1. Introduction
The rapid proliferation of information and communication technology (ICT) developments has prompted numerous cities worldwide to transform into smart cities. This involves implementing intelligent frameworks to enhance various aspects of life such as the environment, transportation, and safety. Despite these advancements, road accidents continue to result in a significant number of casualties, with approximately 1.2 million fatalities and 50 million injuries occurring annually [
1,
2,
3]. Particularly concerning is the impact on vulnerable road users (VRUs) like pedestrians, who face a higher risk of premature death [
4,
5,
6]. These pedestrians are exposed to various dangers, including instances where drivers fail to yield the right of way during crossings. Crosswalks, in particular, frequently become sites of risky situations. The British Transport and Road Research Laboratory and the World Health Organization (WHO) have highlighted that crossing streets, especially at unsignalized crosswalks, can be as dangerous as jaywalking [
7,
8]. Consequently, it is essential to alleviate such risks, especially vehicle–pedestrian collisions, in order to create safer walking environments.
There are various ways to reduce pedestrian injuries and to protect road users from traffic collisions, such as accident and risk factor analysis [
9,
10,
11,
12]. However, there are few actual collision and accident data, and these approaches are ex post facto. A different strategy is to pinpoint “potential risk” (e.g., instances of near-miss collisions, etc.) prior to the occurrence of actual accidents. This can be achieved by detecting such behavioral patterns among objects in proximity to crosswalks or intersections through the use of vision sensors.
In addition, along with the development of deep learning-based video-processing technology, much research has been conducted on assessing the behavioral factors that pose risks to pedestrians near crosswalks, drawing on insights from the interactions between automobiles and pedestrians [
13,
14,
15]. Moreover, there has been a considerable focus on scrutinizing patterns in pedestrian behavior [
16]. By leveraging these subtle interactions, valuable information is made available to administrators, enabling them to make well-informed decisions efficiently [
17]. For example, the authors in [
18] proposed a new measurement for vehicle–pedestrian collision risks, called predictive collision risks (PCRs) by using the trajectories of vehicles and pedestrians from closed-circuit-television (CCTV) video footage in a deep learning approach. The authors in [
14] proposed a method for extracting a pedestrian safety margin (PSM), as one of the surrogate risk measurements, the difference between the time a pedestrian crosses traffic and the time the next vehicle arrives at the crossing point between the vehicle and pedestrian [
19,
20] in a vision environment. In [
15], a multi-person tracking algorithm, in conjunction with the Kalman filter algorithm, was employed to accurately determine the positions of pedestrians. This innovative approach not only enabled the precise tracking and prediction of pedestrian locations but also introduced a methodology capable of swiftly restoring their original trajectories, even in instances where the subject briefly disappears and reappears. The authors in [
21] introduced a novel model designed to extract vehicle-pedestrian trajectories specifically at intersections lacking traffic signals. This model’s primary objective was to analyze and quantify pedestrian interactions. Instead of focusing on the interactions originating from approaching vehicles, it assessed the priority, average crossing speed, and the speed of pedestrians at signal-less intersections. Interestingly, their findings provided evidence that the latter category of interactions tends to be more perilous. Meanwhile, the authors in [
22] demonstrated the practicality of a real-time video analysis system. This system evaluated the spatial and temporal proximity of road users to detect and assess collisions involving pedestrians crossing in front of buses. Beyond detection, it furnished valuable insights into the frequency and severity of these collisions, thus contributing to road safety analysis.
However, in practical operating vision sensors in the real world, several challenges are encountered. The first challenge is the difficulty in precisely extracting the behaviors of objects (road users), such as vehicle speeds and pedestrian positions. This difficulty arises because most CCTVs deployed on the road record videos from oblique viewpoints [
23]. The second challenge relates to real-time operation. In practice, deep learning-based models require high computational costs due to numerous parameters, making it challenging to ensure real-time operations during the inference stage. This challenge becomes particularly significant when addressing vehicle–pedestrian collisions, where instantaneous responsiveness is crucial. Another factor hindering real-time processing is the systemic issue with the traditional approach, which involves a three-stage data flow: video frames are transmitted from the field to the center, processed, and then the results are sent back from the center to the field [
24]. This approach requires physical distance for data transmissions and introduces additional network delays, impacting the ability to promptly process and determine the current situations.
To address these challenges, we introduce a new system for recognizing vehicle–pedestrian risks in advance using vision sensors within edge computing devices deployed in the field. The proposed system encapsulates all operational devices into a single unit, resembling an intelligent CCTV, called the No Accidents with Vision-Infrastructure (NAVIBox) device. This design enables immediate data processing and risk assessment in the field.
In this study, our primary objective is to predict vehicle–pedestrian collisions in real time. These scenarios define what we consider vehicle–pedestrian risks. The proposed system consists of four main core pipelines: (1) motioned-video capture; (2) object detection and tracking; (3) trajectory refinement; and (4) predictive risk recognition and warning decision. These core methodologies enable real-time operation on the edge computing platform. Initially, following the capture of the motioned video through the frame difference approach, road users are detected, and their trajectories are obtained by using a deep learning-based lightweight object detection model, namely, the You Look Only Once version 8 (YOLOv8) model [
25], in conjunction with a centroid tracker [
26]. In this step, we focus on converting the perspective of the given image from the oblique viewpoint to the top viewpoints and conduct grid segmentation to obtain precise road-user behaviors. Vehicle–pedestrian risks are then predicted by analyzing the extracted behaviors, and an alert sign is sent to drivers and pedestrians if risks are forecasted. We validate the feasibility and practicality of the proposed system by implementing and testing it at actual test sites in Sejong City, South Korea. Furthermore, we firmly believe that the proposed system enables the immediate determination of risky situations and provides warnings that can be delivered to drivers and pedestrians without a lag present between the CCTV and the center, thus establishing itself as a safety module in an intelligent transportation system (ITS).
2. Methodology
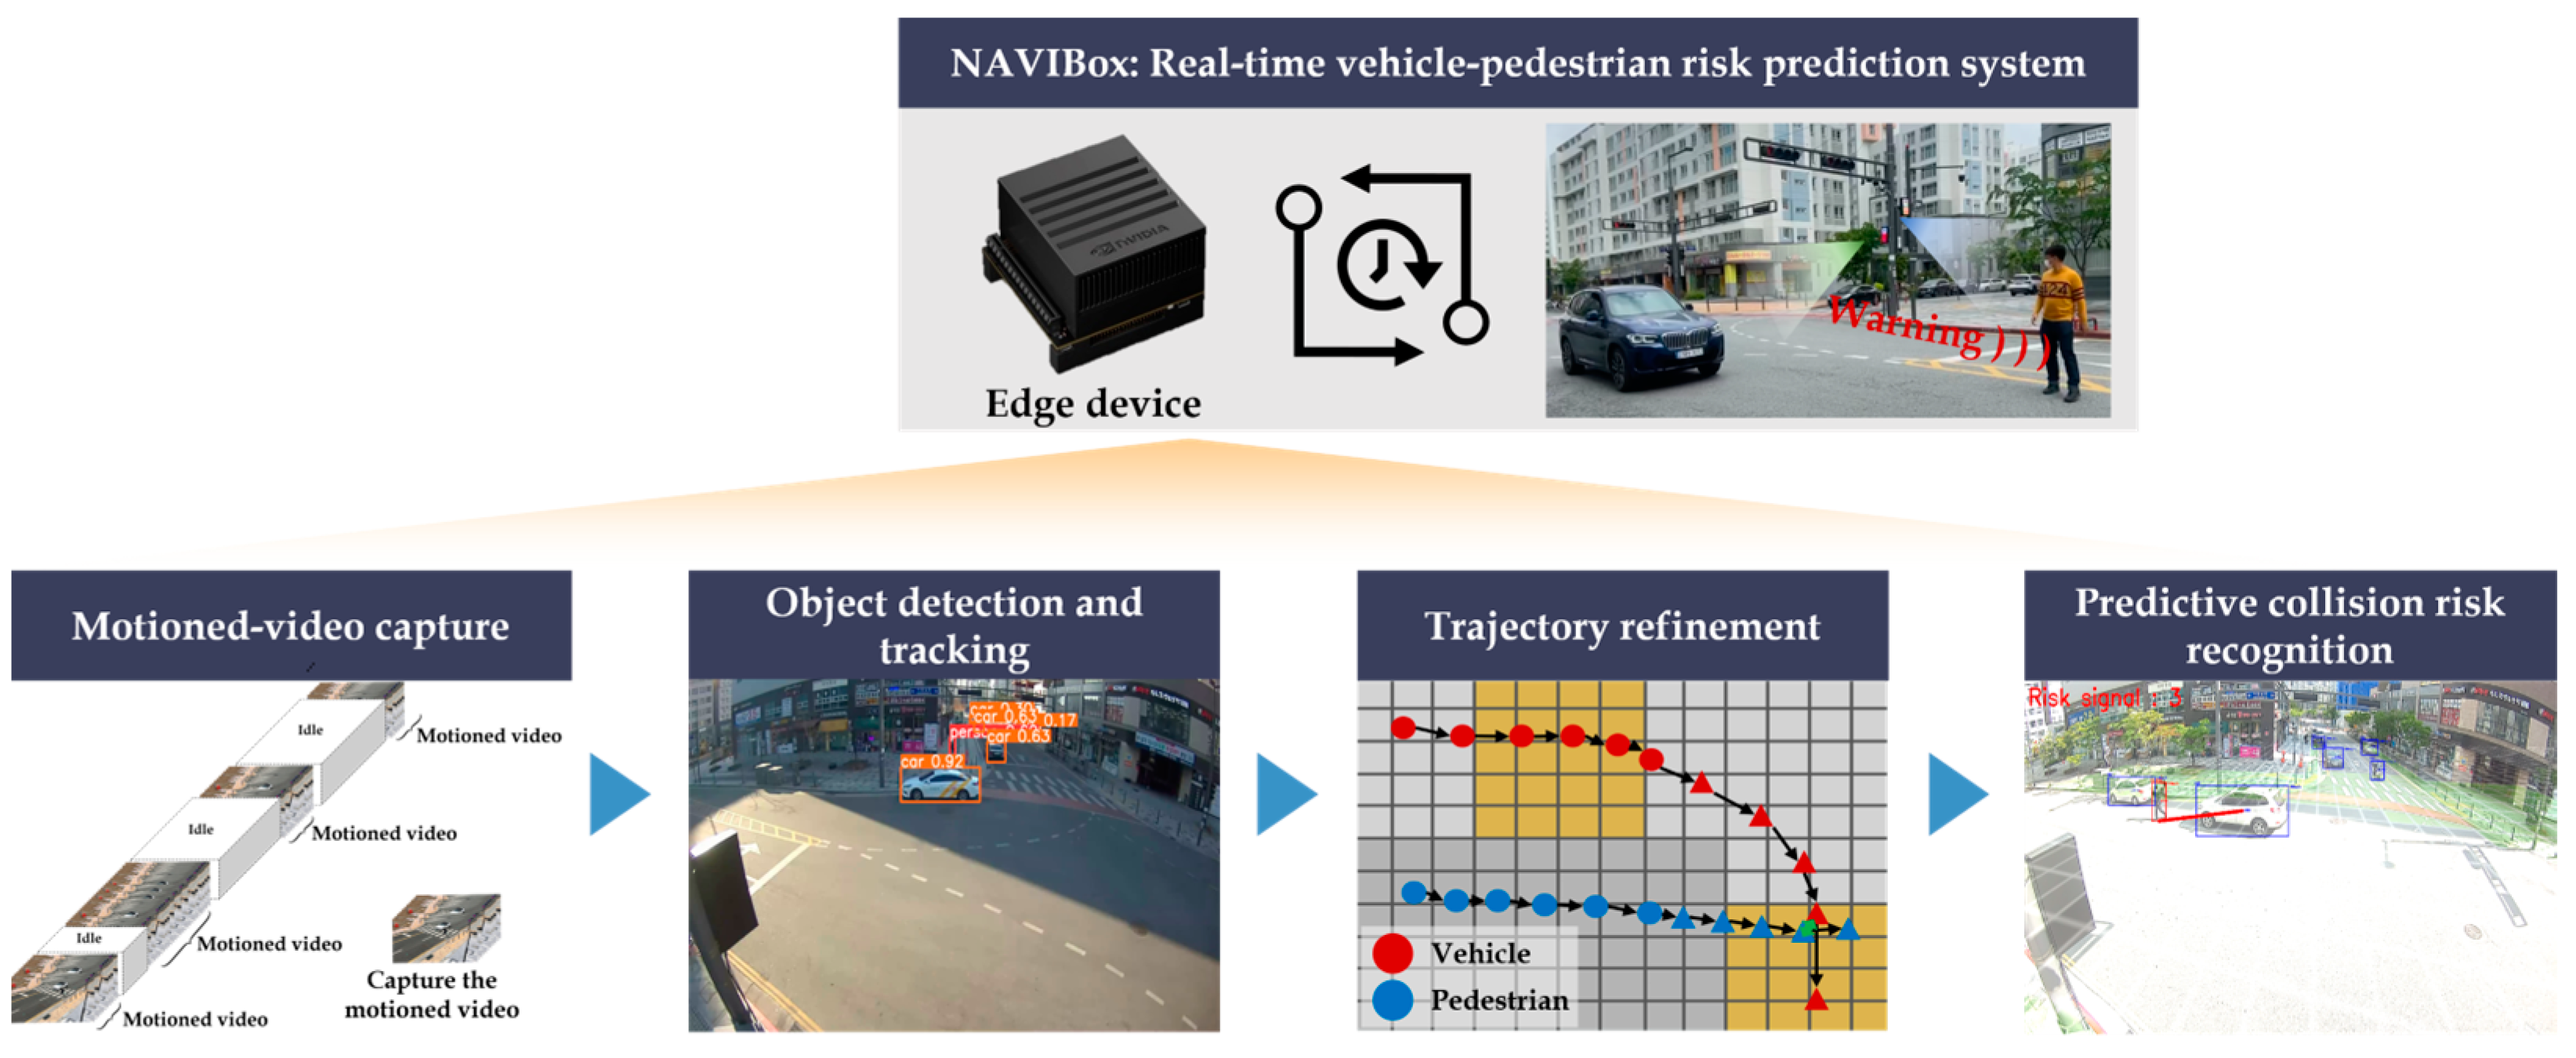
In this section, we describe the overall architecture of the proposed system, as illustrated in
Figure 1. This architecture is composed of four cores: (1) motioned-video capture; (2) object detection and tracking; (3) trajectory refinement; and (4) predictive risk recognition and warning decision. It is crucial to emphasize that each core is designed to enable real-time operations for the recognition and prediction of vehicle–pedestrian risks on the road, all within the confines of an edge computing platform.
2.1. Motioned-Video Capture
To begin, we initiate the process by capturing video clips containing moving vehicle and pedestrian activity from the input video stream. In general, due to the characteristics of CCTV surveillance, a substantial amount of computing power and resource management is necessary, given its 24 h operation. Therefore, it is necessary to handle the real-time video stream efficiently, utilizing an approach that is both simple and has low computational complexity.
In this study, we apply a frame difference method, a widely used approach for discerning movements within videos. This choice stems from the observation that the video stream obtained from CCTV on the road often experiences extended idle periods, where no activity is captured, interspersed with occasional motions, as shown in
Figure 2.
Through the calculation of pixel-wise frame differences, we can distinguish intensity values for pixel positions that have undergone changes between consecutive frames. Subsequently, the term “motion” is attributed by comparing these values against a predetermined threshold as follows:
where an image obtained at the time slot
is denoted by
, and
is the pixel value in the image. In this study, we capture values by calculating the difference between the current frame (foreground) and background frame as illustrated in
Figure 3. The background frame is
.
If the input video is determined to contain motion, subsequent processes will be executed; otherwise, they will be skipped. By using the frames that exhibit motion, which is the result of the frame difference method, we can significantly reduce computational costs. In practice, the threshold can be adjusted based on conditions such as camera deployment height, orientation, and angle, which are determined by the outcomes of the perspective transform.
2.2. Object Detection and Tracking
With the video clips with motion, the proposed system detects and tracks the road by using object detection and tracking models. In this study, we employ YOLO version 8 (YOLOv8) [
25] combined with the Centroid tracker [
26] to achieve these specific objectives. The YOLOv8 model, the latest version within the YOLO series, is frequently used in academia and industry owing to its exceptional performance and rapid computational efficiency. It stands as one of the few models that showcases state-of-the-art performance in real-time computation. One of the most striking deviations between the YOLOv8 model and other object detection models, especially previous YOLO-series models is that the head of the model is anchor-free, which directly locates the bounding boxes rather than using the relative position against predefined boxes. This feature eliminates the need to determine the size and location of the predefined boxes in advance. Thus, it is suitable for our proposed system with its real-time processing, efficiency, and robust performance.
Meanwhile, with the implementation of the Centroid tracker algorithm, we can obtain the trajectories of the vehicles and pedestrians. There exist numerous studies on object tracking, including those using the Centroid tracker, the Deep Simple Online and Real-time Tracking (SORT) algorithm [
27], and the Structured Online Global Tracking (STRONG) SORT algorithm [
28]. It is important to highlight that the proposed system demands the utilization of models that are simple and lightweight. Consequently, we employ the Centroid tracker due to its inherent simplicity and lightweight nature. This tracker operates by associating objects based on the positions of their centroids in real-time processing. This approach is particularly well-suited for scenarios where changes in object appearance are minimal, like our test sites, unsignalized crosswalks.
Figure 4 shows the instances of the output from the object detection and tracking procedures within our proposed system. Since the target objects are only vehicles and pedestrians as output, we use the pretrained YOLOv8 model with the Microsoft Common Objects in Context (MS COCO) dataset without the additional training. With the trajectories of these objects, various behavioral features that affect risks can be extracted from video footage, such as a vehicle’s speed and vehicle–pedestrian distance.
2.3. Trajectory Refinement
In this section, we describe the method for predicting road users’ trajectories. Given that the accurate prediction of future trajectories relies on historical movement patterns, it is essential to obtain the precise trajectories (a sequence of positions) from the video with oblique viewpoints. Therefore, prior to the predictive risk recognition, we present two approaches aimed at capturing precise road-user trajectories: (1) perspective transform and (2) grid segmentation.
First, we transform the perspective of the input image by calculating a homography matrix (
) that facilitates the conversion of pixel coordinates from the oblique-viewed image to the top-viewed image.
is a 3 × 3 matrix and is derived from four pairs of corresponding “anchor points” in the original image and virtual space. These points are the coordinates of quadrangle vertices in the original image, denoted by
where
, and the transformed points are the coordinates of the corresponding quadrangle vertices in virtual space, denoted by
where also
[
23]. We have employed the OpenCV library to perform the computation and application of the homography matrix, with the corresponding mathematical notation as follows:
With
, we can perform the transformation on every point present in the original image by treating each point as a 2D vector, as shown below:
where
, and
.
As depicted in
Figure 5, we used the four points
and
of the rectangular area near the crosswalk as
.
Next, grid segmentation involves dividing the top-viewed image into a grid-like structure, a process referred to as grid segmentation. This approach subdivides the area into smaller sections, enabling a more detailed analysis of road users’ trajectories within each grid cell. It is challenging to precisely determine the exact position of road users using only one camera sensor with
and
coordinates. Therefore, in this study, we introduce the concept of “distance tolerance” through grid segmentation. This means that certain errors are tolerated; assuming that if the predicted points (using our trajectory prediction model) fall within the same cell, these points are correctly detected. Another purpose of grid segmentation is to depict areas such as roads, crosswalks, and sidewalks, facilitating an understanding of vehicle and pedestrian movements and enabling the identification of risky behaviors based on their positions, as shown in
Figure 6.
2.4. Predictive Risk Recognition and Warning Decision
In this section, we discuss the critical task of recognizing predictive risks in real time, specifically focusing on what we refer to as “predictive collisions” between vehicles and pedestrians. As mentioned earlier, the primary goal of this step is to recognize the predictive risks in real time, specifically defined as the “predictive collisions” between vehicles and pedestrians.
2.4.1. Future Trajectory Calculation
The process begins with the calculation of the future trajectories of road users. To achieve this, we calculate the future trajectories of road users from time
to
starting from their current point at time
. We achieve this process by utilizing their previous movements during the time period from
to
, as illustrated in
Figure 7.
A trajectory, denoted as
, can be represented as a sequence of coordinates (
):
Here,
represents the class of road users (vehicle or pedestrian), and
represents the position of the object at time
. We estimate the future trajectories as follows:
It should be noted that represents the time period of the past trajectory used for predicting the future trajectory. and are the averages of the and movements from to , respectively. Subsequently, we assign each predicted point to the corresponding cell in the grid. In our experiments, the system predicts the future trajectories for road users after a specified time interval, typically three seconds from the current time step using trajectory data from the past 0.5 s ( represents this duration).
2.4.2. Risk Determination
We employ predefined rules to determine the potential risk of a predictive collision. The difference in distance between the future trajectories of pedestrians and vehicles is utilized to assess risks thoroughly, illustrated in
Figure 8.
The risk is determined using the following formula:
where
represents the distance threshold, and
and
are the predicted trajectories for the vehicle and pedestrian, respectively.
denotes the Euclidean distance between the predictive positions for the vehicle and pedestrian, and the overall expression signifies that the risky situation is identified when there exists a situation in which the predicted distance is less than the specified distance threshold. This section explains how to predict the movements of road users and assess the likelihood of collision risks by analyzing the variance in their projected locations. This is a crucial component of a road safety system that can quickly detect and warn of potential collisions, thus improving overall road safety.
3. Experiments and Results
3.1. Experimental Design
In this section, we design the experiments to validate the effectiveness of the proposed system. First, we deployed the proposed NAVIBox device on actual roads in Sejong City, South Korea. We selected test sites located at unsignalized crosswalks with a high floating population near commercial complexes and schools. The characteristics of our test sites are presented in
Table 1. We collected the video footage from Site I and Site II for each 30 min and labeled the 24 and 64 risky situations, respectively.
In our study, we conduct three main experiments to validate the (1) accuracy performance of road-user detection in our proposed system, (2) the accuracy performance of the predictive collision recognition, and (3) the time effectiveness of the proposed system.
As evaluation metrics, we adopt the precision, recall, AP50, and AP for the road-user detection for each object class. Precision is the ratio of the number of correctly detected objects to the number of predicted objects. Recall is the number of correctly detected objects to the number of ground-truth objects. A correctly detected object occurs when the IoU (Intersection over Union) of the ground truth and predicted bounding boxes is over 0.5.
and
are the frequently used evaluation metrics in the object detection literature.
is the average precision, the average of recall when precision increases from 0 to 1 by 0.1 with an
threshold of 0.5.
is the mean value of average precision when we increase the
threshold from 0.5 to 0.95 by 0.05.
where
represents the precision when the recall is
,
is the
AP when the IoU threshold value is equal to
.
The evaluation metric for predictive collision recognition is precision and recall. Though recall is more important to reduce the number of traffic accidents at an intersection, we also need to consider precision since the intersection capacity can be reduced significantly by frequent alarms of the system.
3.2. Results of Road-User Detection and Discussion
In this section, we present the results of road-user detection utilizing the pretrained YOLOv8 model. Our pedestrian detection results deserve further attention, as they reflect the unique challenges posed by the detection of small-sized objects. Accurately detecting pedestrians is crucial for predicting collisions through object detection. The system’s accuracy largely depends on the number of pedestrians and vehicles identified in the footage, which directly impacts the detection of distance between objects and their direction of travel. Therefore, detecting small objects is vital to ensure the accuracy of collision prediction. We achieved precision and recall scores of about 0.71 and 0.67, respectively, as depicted in
Table 2. The
AP50 and
AP of pedestrian detection were about 0.70 and 0.25, respectively. When comparing these results to the baseline model, which was chosen from the top 10 COCO 2017 validation data object detection models (as referred in [
29]), our pedestrian detection performance fell slightly short. The baseline models achieved
AP50 and
AP scores of about 0.70 and 0.50, respectively.
It is important to acknowledge that the pedestrians captured in video footage on real roads appear smaller than those in the COCO dataset. This presents a greater challenge in detecting them, highlighting the inherent difficulties in identifying these smaller road users. Notably, our model demonstrated a similar AP50 score, standing at approximately 0.70. In fact, the significant improvement in the AP50 score deserves particular consideration. It underscores our model’s proficiency in detecting pedestrians, especially when dealing with small-sized objects, which are prevalent in our dataset. In this context, the AP50 score, which focuses on the detection of medium- and large-sized objects, becomes a pertinent benchmark.
While the overall AP may appear lower, it is essential to recognize that the AP50 score is more indicative of our model’s effectiveness in detecting small-sized pedestrians, a crucial factor in real-world scenarios. Therefore, our results indicate that our model’s performance in pedestrian detection, especially concerning small-sized objects, meets the requirements of practical applications. Further research may still be beneficial, but we have achieved notable success in addressing this specific challenge.
Meanwhile, regarding vehicle detection, we achieved a precision and recall of approximately 0.81 and 0.85, respectively. In addition, the AP50 and AP for vehicle detection were 0.89 and 0.59, respectively. The detection and localization of vehicles were significantly more accurate than those of pedestrians. These results also outperformed the baseline models, suggesting that further training for the vehicle class is not necessary. Overall, our results demonstrate the effectiveness of our approach in detecting road users and highlight the unique challenges posed by pedestrian detection, especially concerning small-sized objects. Further research may still be beneficial, but we have achieved notable success in addressing this specific challenge.
3.3. Results of the Predictive Collision Recognition and Discussion
In
Table 3, we have observed that the recall values, which measure the proportion of correctly identified risks out of all actual risks, exhibit a notably high level of accuracy, registering at 0.96 for Site I and 0.84 for Site II. These robust recall values emphasize the critical significance of our system in accurately detecting predictive collision risks, particularly in scenarios where the potential for collisions is substantial.
It is worth noting, however, that the recall value for Site II is relatively lower, standing at 0.84. This discrepancy can potentially be rectified by fine-tuning the minimum distance threshold
. As represented in
Figure 8, elevating the minimum threshold yields higher recall values, underscoring the system’s capacity for adaptability through customization. By modifying the minimum distance threshold, we can precisely tailor the precision and recall metrics to align with specific system requirements.
Figure 9 serves as an illustrative example, showing the instances where the system adeptly recognizes predictive collision risks in both Site I and Site II. It showed that the proposed system could reduce the number of actual traffic accidents by proactively predicting the collision risk in real time and warning before a collision occurs.
On the other hand, the precision value, which represents the proportion of correctly identified risks out of all identified risks, presents a relatively lower figure. While our system effectively identifies predictive collision risks between vehicles and pedestrians, there exists an opportunity for enhancement in terms of reducing false positives and elevating precision metrics. It is crucial to underscore that achieving a higher recall remains a paramount objective, as the accurate identification and mitigation of collision risks assumes paramount importance within our context.
The outcomes unveiled in this section thus underscore our dedication to the development of a system that not only excels in terms of accuracy but also stands as a testament to its capacity to significantly contribute to road safety. This contribution is accomplished through the proactive identification of collision risks and the issuance of timely warnings, thereby potentially reducing the incidence of actual traffic accidents—an outcome of considerable societal significance.
3.4. Result of the Time Effectiveness of the Proposed System and Discussion
In this section, we describe the results of the time effectiveness analysis of the proposed system utilizing edge computing and discuss these findings. Our results highlight the exceptional efficiency of the system, which achieves all procedures in about 23 milliseconds, equal to an impressive 43 frames per second (FPS). It is particularly noteworthy that the proposed system achieves this high level of performance while recording the video stream at a standard rate of 30 FPS. The critical points of the system, such as object detection, object tracking, and trajectory prediction (including position updates), require processing times of approximately 7.5 ms, 15.0 ms, and 3.5 ms, respectively. This outcome signifies that the proposed system can handle assigned tasks in real time without any delay or significant frame skips.
To showcase the system’s performance, we highlight its ability to accurately detect various critical scenarios, such as identifying pedestrians crossing roadways, recognizing vehicles executing turns at unsignalized intersections, and seamlessly tracking cyclists merging into traffic. Compared to traditional systems that address road-related risks and phenomena, our innovative system provides a superior solution. It effectively addresses data flow challenges while simultaneously processing video footage in real time. Furthermore, it excels in recognizing potential risks by predicting the trajectories of road users, enhancing its overall efficacy in ensuring road safety for vulnerable road users. The critical points of the proposed system, namely, object detection, object tracking, and trajectory prediction (including position updates), consume processing times of approximately 7.5 ms, 15.0 ms, and 3.5 ms, respectively. This outcome signifies that the proposed system can handle the assigned tasks in real time without any delay or frame skips.
It should be noted that the primary objectives of the proposed system are to process video footage for recognizing risks with the predicted road-user trajectories in real time and to alleviate the data flow issues in conventional systems that handle road-related risks and phenomena [
30,
31]. However, when dealing with video data, characterized by its substantial file sizes and resource-intensive processing demands, transmitting data and retrieving information can be time-consuming. Nevertheless, due to the critical need to promptly provide road users with information about potential collision risks, real-time data processing on edge devices with lightweight algorithms becomes essential.
As a result, the proposed system is designed for real-time processing in an edge computing environment, employing lightweight algorithms to ensure seamless risk recognition. An essential feature of this system lies in its ability to operate in real time with exceptional computational efficiency. Moreover, it underscores the critical importance of considering not only the accuracy of collision prediction but also the efficiency of the model in terms of processing time when executed on edge devices. Furthermore, it is a first attempt to deploy and operate such a system in real-world road conditions, from processing video in real time to providing potential risk information to pedestrians.
4. Conclusions
In this study, we propose a new system that recognize the predictive collision risks between vehicles and pedestrians using video data processed on an edge computing platform called NAVIBox. The proposed system comprises four main pipelines: (1) motioned-video capture; (2) object detection and tracking; (3) trajectory refinement; and (4) the predictive risk recognition and warning decision.
In the motioned-video capture stage, we extracted the video clips with significant motion from a continuous video stream that includes periods of inactivity. In the object detection and tracking phase, we utilized YOLOv8 for object detection and Centroid tracker for object tracking, specifically targeting road users. Subsequently, we refined the obtained object trajectories using perspective transformation and grid segmentation techniques. This refinement process allowed us to obtain precise road-user behaviors such as position and speed. Then, the predictive collision risks were determined by comparing the future trajectories with the distances between vehicle and pedestrians. Importantly, our system includes a warning module that triggers alerts in the case of identified risky situations in order to warn both drivers and pedestrians when approaching risky situations. These alerts are conveyed through electronic displays for drivers and speakers for pedestrians, providing advance warning for potential hazards.
Through a series of experiments, we validated the feasibility and practicality of the proposed system by implementing the NAVIBox device and deploying it to actual roads in Sejong City, South Korea. Our experiments involved assessing the performance of object detection and tracking, the predictive risk recognition, and time effectiveness. First, the results of object detection and tracking demonstrated an impressive performance, with an AP of 0.70 for pedestrians and 0.89 for vehicles. Additionally, the predictive risk recognition in videos exhibited a high recall rate, emphasizing the importance of accurately identifying and mitigating collision risks within our study context.
Furthermore, in terms of processing speed, our edge-computing-based system proved to be faster and more efficient than traditional CCTV-centered warning structures. We firmly believe that our proposed system has the capability to rapidly identify risky situations and issue timely warnings to drivers and pedestrians, eliminating the lag associated with traditional CCTV systems. Ultimately, we envision this system as a crucial safety component in future transportation systems.
As part of our ongoing work, we are advancing the proposed system to ensure robustness in various conditions, including weather, lighting, and other factors. We are achieving this by adapting to continually changing environments and incorporating a visual quality monitoring system [
32]. Additionally, we are exploring the direction of imperceptible adversarial perturbations [
33], which represents another important aspect of our future work.


