Abstract
A study of video quality perceived by user (Quality of Experience, QoE) was conducted with an examination of whether and how the order and structure of the video sequence presentation affects subjective assessment. For this purpose, the influence of content variability/repeatability, the quality of the preceding sequence, and the sequence order were analyzed. Observations on the correlation of QoE with the micro-structure of sequence presentation are described, which can be the basis for hypotheses of the dependence of QoE assessment on the abovementioned factors. The observed relationships regarding the influence of the number of video repetitions and the impact of the predecessor’s quality on subjective evaluation are consistent with research work on the influence of the order/arrangement and structure of research stimuli on the results of subjective evaluations. Areas for further research are indicated, including relating obtained results in the area of QoE to other cognitive sciences, such as psychological, medical, and economic sciences.
1. Introduction
The growing popularity of using streaming media services and the need to adapt the quality of the services offered to the needs of users as effectively as possible are factors that stimulate the necessity to better understand factors affecting how the recipient subjectively perceives presented video content. Research in this area is a part of the Quality of Experience (QoE) knowledge area [1,2,3].
A subjective assessment of video quality is the result of a number of factors influencing the viewer’s perception. Among these, the literature [4] mentions, e.g., human, system, and context factors. Analysis of the current research on the impact of various factors on the perceived subjective assessment of video quality includes aspects such as:
- Technological—related to coding, compression, transmission, image presentation, etc.;
- Social—regarding the social context of an observation (e.g., in a group vs. alone);
- Environmental—related to the environment (e.g., air temperature, noise level, etc.);
- Human—concerning a number of features differentiating the recipients of the content;
- Content-related—differentiating the content of the presented video streams in terms of content.
Figure 1 shows basic types of factors influencing subjective perception of multimedia streaming.
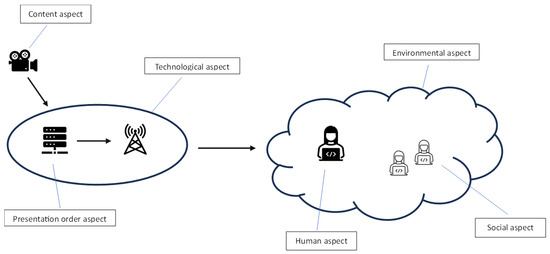
Figure 1.
General types of factors influencing subjective perception of an multimedia (own work).
It should also be noted that the subjective assessment of a given phenomenon is inextricably linked to its human perception, embedded in the context of the method of presenting and making available a research sample for a given phenomenon. Cognitive sciences identify an indisputable influence of the arrangement of presented research samples on the subjective perception and evaluation of a given phenomenon.
A number of publications in the scientific literature were issued, indicating the significant impact of the arrangement of the research samples on the results of subjective research in fields such as psychology, behavioral analysis, legal sciences, or medicine.
In the field of legal sciences, publication [5] indicates that the order in which the speeches of attorneys at law were evaluated was significant and statistically significant. An issue of the optimal sequence of stimuli presentation is described in the literature in the aspect of teaching visual–auditory conditional differentiation [6], where the effect of slower acquisition of content at the first research attempt was described. Another of the described experiments [7], which is in the field of behavioral analysis and is related to the estimation of the durations of phenomena occurring in sequences, brought results indicating some regularity that the second of the pair of durations is usually overestimated in relation to the first one. From the point of view of audio–visual sciences, the influence of the order of content presentation was described in [8], where an experiment was described showing that the perceived attractiveness of images presented in parallel was greater. In publication [9], it was shown that an order of stimulus presentation has a large impact on the evaluation of stimuli during evaluation processes. After applying the forward conditioning technique (the pairing of two stimuli such that the conditioned stimulus is presented before the unconditioned stimulus), a change in the tone evaluating the previously neutral stimuli in a positive direction was observed. An aspect of the impact of the sequence of stimuli presentation on the decision-making process has also been identified in the field of purchasing decisions, where theories of consumer behavior regarding the key importance of the first stimulus and the reference point in making purchase decisions were published. In [10], an experiment confirms that the first presented alternative is preferable, while the effects of the presentation order are not the same for all purchasing items.
An aspect of the influence of research stimuli arrangement is also taken into account in the field of multimedia QoE, where there are also publications devoted to the influence of the arrangement and sequence of a research sample on subjective assessment results. An issue of the analysis of the affective images was described in [11], with the conclusion that unpleasant pictures at the end were assessed less negatively than unpleasant pictures presented at the beginning; therefore, the order of presentation had an impact on the recipient. On the other hand, in [12], an impact of the Peak-End Effect, known in psychology, on the assessment of video quality was described, where this effect was identified for videos of poor quality but not for videos of good quality.
Examples cited from various areas of cognitive science indicate that an effect of order or frequency of the presentation of research stimuli on subjective assessment or actions resulting from human perception is indisputable. The effect of learning, improvement, or vice versa—weariness or impatience with the presented content or its sequence—should also be reflected in the area of Quality of Experience, in particular, in the context of analyzing the impact of factors such as the structure of research stimuli presentation on subjective assessment of multimedia content.
Thereby, it is reasonable to undertake research aimed at further verification of whether and how the phenomena identified in various fields of cognitive science, and related to the impact of the presentation structure of research stimuli on the experiments’ results, also refer to the subjective assessment of multimedia content in the area of Quality of Experience.
The overall subject of this publication is an analysis of the results of the conducted experiment, regarding the potential impact on the subjective assessment of the micro-structure of content presentation, i.e., the relative arrangement of content, including sequence order, frequency, and multiplicity of views, or reference to the quality background, i.e., quality of the preceding video sequence for 2D videos of varying technical quality.
The assumed contribution of this publication refers to research aspects in the field of multimedia Quality of Experience, directly resulting from the conducted research, i.e.,
- Demonstrating the relationship between factors of the research stimuli presentation structure (number of views, quality of the preceding video, and content variability) and the obtained values of subjective video quality assessment;
- Referring obtained results in the field of multimedia QoE to other areas of cognitive sciences (psychology, economic sciences, legal sciences, medicine, etc.), utilizing the aspect of subjective assessment in the research activities;
- Determining future research directions for new research aspects, justifying extending conducted research or research regarding impact factors in addition to those presented in this publication.
2. Research Topic
The aim was to find an answer to the following research question: is the subjective assessment of video sequence quality affected by factors such as:
- Objective quality of a given video—understood as a measure of the objective technical quality of a video sequence, expressed as a numerical value on a scale of 0–100, obtained using the VMAF (Video Multimethod Assessment Fusion) metric [13].
- Number of times a given video is displayed (fatigue/habituation effect)—a value specifying how many times a given video sequence is presented to the tester. Due to the experiment conditions, the multiplicity of impressions assumes acceptable values from sets 1, 2, and 3.
- Qualitative background, i.e., objective quality of the preceding video—expressed by VMAF value defined above for video immediately preceding a given video sequence
The conducted analysis of the impact of the structure and layout of the research stimuli (video sequences) presentation was made in relation to the quality of the objective video sequence (system type factor). An additional research assumption was the neutrality of the experiment in relation to the other factors identified in the field of Quality of Experience, including system factors other than the objective technical quality, environmental factors, and the human factor. Research samples were not differentiated in relation to these factors and the homogeneity of the experiment conditions was maintained. Referring to the research question, three initial research hypotheses were adopted:
Hypothesis 1.
A direct relationship between the subjective evaluation of video quality and its measured objective quality value for each objective quality level exists; i.e., for each objective quality level, video sequences with a higher VMAF value correspond to statistically significantly higher subjective evaluations.
Hypothesis 2.
The relationship between the number of views of a video sequence and its subjective rating exists; i.e., the average subjective rating for the first viewing of a given video sequence is statistically significantly different from the average subjective rating for the third viewing of a given sequence.
Hypothesis 3.
The relationship between the objective quality of the video immediately preceding a given video sequence and its subjective rating exists; i.e., the average subjective rating for a video whose direct predecessor was a video of higher objective quality differs statistically significantly from the average subjective rating for a video whose direct predecessor was a video of lower objective quality.
3. Experiment Description
3.1. Experiment Design
The experiment was carried out in accordance with the recommendations of Recommendation ITU-T P.913—the methods for the subjective assessment of video quality, audio quality, and audiovisual quality of Internet video and distribution quality television in any environment [14]. The aim of the experiment was to obtain subjective ratings issued by testers for a set of PVSs (Processed Video Sequences) sequences displayed in the appropriate order and multiplicity. In the experiment, video presentation sessions were conducted for testers who were divided into two experimental groups:
- The REGULAR group, in which each tester viewed each PVS only once;
- The REPEAT group, in which each tester viewed each PVS sequence three times.
The groups of testers were fully disjoint; i.e., each tester participated in only one experimental group. The testers’ task was to determine subjectively the perceived quality of a watched video sequence (QoE) and assign it a rating on a 5-point Absolute Category Rating (ACR) scale, i.e., (5—excellent, 4—good, 3—fair, 2—poor, 1—bad) [15]. Testers assessed the quality after viewing each PVS separately. Testers evaluated sequences under the same homogeneous technical and environmental conditions. In the REGULAR group, each tester was shown a total number of 170 PVSs, consisting of a randomly selected combination of all 34 unique SRC sequences selected for the experiment, at 5 selected levels of quality degradation, such that each SRC sequence with a specific level of quality degradation was displayed in sequence at random only once. In the REPEAT group, the number of available unique SRC sequences was limited to 12 (out of a total of 34 available in the experiment), assuming that each tester observes the same predetermined set of videos (i.e., no random selection of 12 out of 34 videos for each tester independently was performed). Each tester in this group was shown a total of 180 videos consisting of a randomized combination of 60 unique PVSs (12 SRC sequences in 5 quality degradation levels) so that each video sequence was shown to the tester 3 times in random order. The final result of the experiment is a set of ratings, separately for each experimental group (REGULAR/REPEAT) with admissible discrete values from sets 1, 2, 3, 4, and 5, associated with additional data, such as tester ID, video ID, the level of declared quality/degradation of the video, and the date and time of the registration of the rating.
3.2. Research Dataset
The set of video sequences, selected from sequences made publicly available in the Netflix, CableLabs, SJTU Media Lab, and Xiph.org Video Test Media databases, was utilized in this experiment. The research data consisted of full HD video sequences in MPEG-4 standard [16], with a resolution of 1080p: 1920 × 1080 pixels with a playback speed of 60 frames/s and a variable bit rate of individual videos. PVSs (Processed Video Sequences) selected for the experiment were created by processing 34 unique SRC (Source Reference Circuit) video sequences, undifferentiated in terms of characteristics; generating corresponding videos for each sequence at five levels of quality degradation; and assigning videos to appropriate groups qualitatively, in accordance with Figure 2.
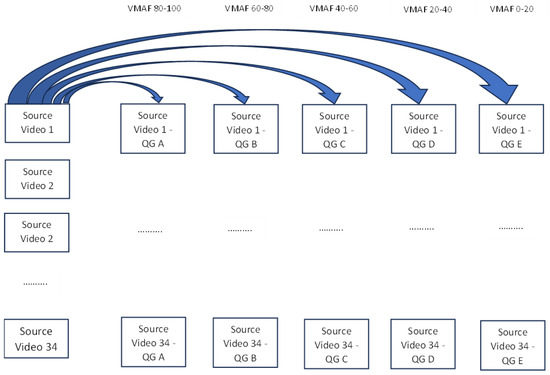
Figure 2.
Selection of videos in particular quality groups.
The selection of videos in particular groups is presented in Figure 2.
For each SRC sequence, files created at bitrate levels varying between 100,000 bps and 21,000,000 bps were generated.
The aspect of selecting research databases also provides the potential for further analyses. For further research work, it is reasonable to select datasets parameterized in terms of the studied features. A number of video databases with various characteristics of distortion (compression, transmission errors, frame rates, spatial and temporal resolution, etc.) have been described in the literature, along with methods for their evaluation. Publications [17,18] describe available databases for User-Generated Content (UGC) live videos, Professionally Generated Content (PGC), or Occupationally Generated Content (OGC) videos. An approach to creating pre-processed transcoded video databases has also been described [19]. From the experiment purpose view, database selection is not critical due to the fact that the focus is on the mutual relations between the research stimuli in the sequence (the number of repetitions, predecessors, and order) and not on the quality and characteristics of the video sequence itself. Future research, as a continuation of this experiment, can regard an aspect of database selection, including, e.g., the types of distortions for individual video sequences.
The popular objective video quality metric VMAF (Video Multimethod Assessment Fusion) was used to generate the final set of PVSs used in an experiment [13]. It is an objective reference video quality metric that allows the prediction of video quality based on reference and distorted video sequences. To predict video quality, VMAF uses image quality metrics such as:
- Visual Information Fidelity (VIF): reflects information fidelity loss at four different spatial scales;
- Detail Loss Metric (DLM): measures detail loss and damage that distracts the viewer;
- Mean Co-Located Pixel Difference (MCPD): measures the time difference between frames on the luminance component.
The above parameters are combined using a regression based on SVM (Support Vector Machine)-supervised learning models. The final result is a single output score ranging from 0 to 100 for each video frame, with 100 being the same quality as a reference video. These scores are then temporally combined across the entire video sequence using the arithmetic mean to produce a cumulative mean differential opinion score (DMOS) for that image. For each of the 34 selected SRC sequences, one PVS was selected for the appropriate quality group (from A to E), whose objective VMAF assessment was closest to the values of 90 (Group A), 70 (Group B), 50 (Group C), 30 (Group D), and 10 (Group E). Thus, 34 videos in each of 5 quality groups were selected for the experiment. For each of the 34 SRC sequences, after selecting 5 PVSs (representing the five quality levels A–E), a total number of 170 PVSs were obtained in the target set. Each PVS lasted 10 s.
The choice of the full reference VMAF metric, using both original and degraded video sequences to parameterize technical video quality, was dictated by the necessity to determine objective quality parameters as simply as possible for the purpose of the adopted assessment method for five different quality levels of assessed videos. In this case, the level of objective technical quality has only an auxiliary value, subservient to the main purpose of the experiment, because the video technical parameters were not analyzed in the experiment, and the levels of objective quality were used only to determine whether dependencies in the assessment of subjective quality occur to a similar extent for different quality levels. Therefore, the focus was on the selection of video sequences, differentiated from each other using one standardized metric parameterizing the levels of objective quality. However, regarding future directions of the research resulting from this experiment, it is reasonable to verify the depth of the correlation of the obtained subjective assessment results with the levels of the technical objective quality obtained for the various types of objective video quality metrics, including “blind”, no-reference video quality metrics. The metrics in [20], requiring a previously created dataset, were used to evaluate the degraded video. The possible use of no-reference metrics concerns a number of research areas described in the literature, such as the NAVE metric for autoencoders [21], NR-GVQM for gaming [22], or the H.264/AVC-based bitstream no-reference video quality metric employing a multiway Partial Least Squares Regression (PLSR) [23]. Hybrid models, utilizing both Full-reference and No-reference feature extraction to assess objective technical quality was also published [24]. The selection of hybrid or no-reference video quality metrics in planned future research will be the subject of a separate analysis beyond the scope of this publication.
3.3. Data Collection Interface
The experiment was carried out in the computer laboratory of AGH University of Krakow, Institute of Telecommunications, with the use of standard computer and network equipment in the laboratory. Data collection during the experiment was carried out using dedicated software—a test platform created for the purpose of this experiment—made available on the AGH server. After logging in using the tester’s ID, the test platform automatically assigned testers to one of two experimental groups (REGULAR or REPEAT). An implication of assigning a tester to the appropriate group was to display a video sequence appropriate for the group. Immediately after starting the experiment, the tester was shown the first single PVS selected in random order with a duration of 10 s from the pool appropriate for the selected group. An exemplary video screen is presented in Figure 3.
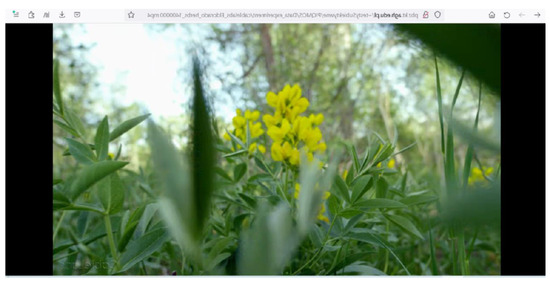
Figure 3.
Exemplary video sequence.
Immediately after the playback of the sequence was completed, a rating screen appeared, containing a single-choice list of possible ratings according to the ACR scale. The video assessment panel is presented in Figure 4. Polish phrase “Podaj Twoją ocenę obejrzanego filmu” is translated into “Insert your rating for the video you watched” in English.
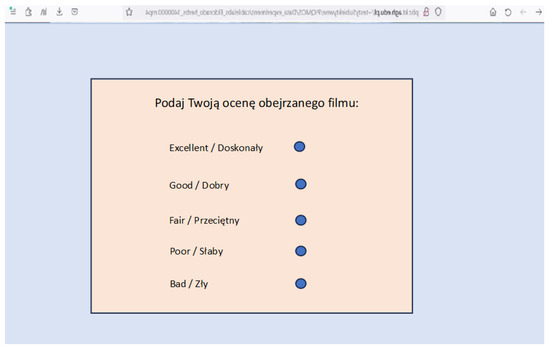
Figure 4.
Video assessment panel.
After evaluation, another randomly selected video from the available pool was displayed, and the process was repeated until the PVS collection was exhausted. Testers’ evaluations were saved in the result file on the server.
3.4. Subjects
The pool of testers was selected from the population of AGH students interested in multimedia. The group of testers was homogenous because the selection of testers did not include gender allocation or any other characteristics differentiating testers apart from belonging to the group of AGH students. No analyses were planned in the experiment regarding the differentiation of any characteristics of the testers. The experiment involved 35 testers, including 7 women and 28 men, divided into two groups in such a way that the REGULAR group consisted of 12 testers, and the REPEAT group consisted of 23 testers. The assignment of the testers to groups was based on evenness or oddness of the last digit of the ID used by the tester to log into the test platform.
Due to the unequal representation of women and men in the research sample, the sample is not representative from the point of view of gender balance in society. Since the gender aspect was not differentiated during the research, it is not possible to determine the impact of this aspect in the obtained results. However, it is planned to continue the presented research, taking into account the gender parameter as one of the aspects differentiating subjects. Based on the results of future research, it will be possible to attempt to determine the impact of imbalance in the selection of representatives of both genders on the obtained results.
4. Experiment Results Analysis
As part of the experiment results analysis, the following activities were performed:
- Statistical analysis tools were selected;
- Outliers were analyzed;
- Results of the experiment were analyzed in response to the research hypotheses.
4.1. Selection of Statistical Analysis Tools
The distribution of the entire research sample results was analyzed in terms of its normality under the following assumptions:
- The samples are random;
- The value space has a defined order;
- The mean values and standard deviations of the population are unknown.
The Shapiro-Wilk test was selected to verify the sample distribution, for which the hypotheses of the distribution normality tests were adopted:
- : the distribution of the examined feature in the population is normal ();
- : the distribution of the examined feature in the population is not normal (F(x) is not ).
The Shapiro-Wilk test statistic is as follows:
where are tabulated test coefficients for sample size n, representing the coefficients determined based on expected values for ordered statistics, assigned weights and covariance matrix, are the sorted samples and represents the average value of data from a sample.
For a research sample obtained from all assessments, at a significance level of , the test resulted in a value of p = 0.00. Thus, the hypothesis was rejected, and the hypothesis was accepted, stating that at the assumed level of result significance, the distribution of the examined feature in the population is not normal. When analyzing a sample limited only to videos from a given quality group (A/B/C/D/E), no normal distribution was found as well. Due to the fact that the distribution is not normal (), non-parametric tests were selected for further analysis [25]. The criteria for using non-parametric tests assume that such tests can be used when a data distribution does not correspond to the criterion of fitting to a normal distribution and when a quantitative variable is ordinal. Both conditions are met in this case. In addition, the samples in the experiment are non-equivalent, which also allows the use of non-parametric tests. Two types of tests were used for further analysis:
- The Mann–Whitney U test for independent samples;
- The Wilcoxon test for dependent samples.
4.2. Verification of Outliers
The verification of outliers was carried out for individual testers, using the method described in the ITU-T P.913 recommendation [14]. This method examines the correlation of tester average scores with the corresponding average scores of all testers using a linear Pearson’s correlation coefficient. The linear Pearson’s correlation coefficient (PCC) for one subject versus all subjects is calculated as:
where x and y are arrays of data and n is the number of data points. To calculate the linear PCC on individual stimuli (i.e., per PVS), compute:
where, in Equation (2), is the MOS of all subjects per PVS, is the individual score of one subject for the corresponding PVS, n is total number of PVSs, and I is the PVS number.
To set up the rejection criteria, a screening analysis is performed per PVS only, using Equation (3). Subjects are rejected if falls below a set threshold. A discard threshold of () is recommended for ACR tests. Subjects should be discarded one at a time, beginning with the worst outlier (i.e., lowest ) and then recalculating for each subject. For the REGULAR group in the first run of the procedure for one tester, the value of the rejection coefficient 0.71 was calculated, which meets the criteria for its rejection. For the remaining testers, values of 0.75 were obtained. In the second run of the procedure, without the rejected tester, values for the remaining testers did not exceed the rejection threshold, which ended the procedure. For the REPEAT group, in the first run of the procedure for two testers, the value of the rejection coefficient was calculated at the levels of 0.37 and 0.74, respectively. For the remaining testers, values of 0.75 were obtained. The result of one tester for whom the value of was the lowest among all testers was discarded, and a second run of the procedure was performed for the remaining testers. In this case, for one of the testers, the result was = 0.73, which meets the tester’s rejection criteria. For the remaining testers, values of 0.75 were obtained. In the third run of the procedure, values for the remaining testers did not exceed the rejection threshold, which ended the procedure. Finally, as a result of verification, scores received from one tester in the REGULAR group and two testers in the REPEAT group were rejected. Thus, the scores collected from 11 testers in the REGULAR group and 21 testers in the REPEAT group were allowed for further statistical analysis.
4.3. Analysis of the Experiment Results
The conclusions from the experiment results in relation to the research question and research hypotheses are presented below. The results were analyzed in relation to the individual groups of the objective quality of the presented sequences. In this case, the emphasis was placed on the interdependence and relative arrangement of the changing video sequences.
4.3.1. Research Hypothesis 1
Experiment results: Figure 5 shows the distribution of the subjective assessments obtained in the experiment in relation to the qualitative groups (A, B, C, D, and E).
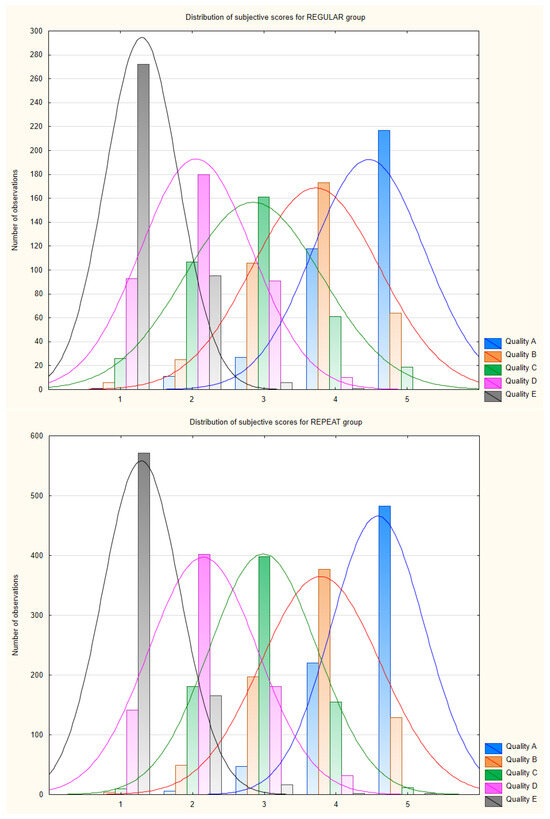
Figure 5.
Distribution of subjective assessments obtained in the experiment in relation to qualitative groups (A, B, C, D, E).
Table 1 presents the mean values and variances for the individual qualitative groups in both research samples.

Table 1.
Values of means and variances for categorical groups.
Figure 6 shows a distribution of the MOS for the individual qualitative groups in both research samples.
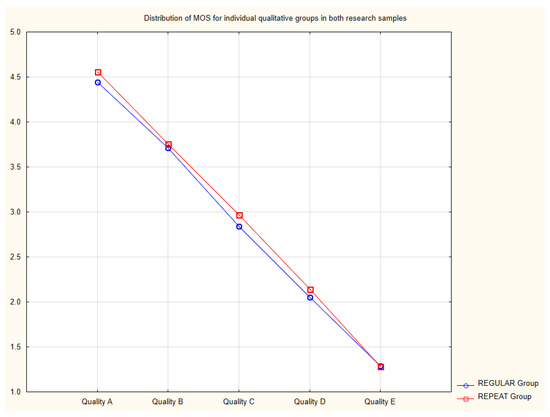
Figure 6.
Distribution of MOS for individual quality groups.
Statistical Verification. A non-parametric Mann–Whitney U test was used to carry out the statistical verification of the obtained results with the following assumptions: We have two samples of the sizes and , taken from the population in which the feature has a stepwise distribution. The data are presented on an ordinal scale. F(x) and G(x) are the distribution functions of the considered populations. The Mann–Whitney U test compared the average MOS ratings between videos in adjacent quality groups (QG A vs. QG B, QG B vs. QG C, QG C vs. QG D, and QG D vs. QG E).
For each indicated pair of qualitative groups, the following null hypothesis was defined: —the distributions of the subjective MOS ratings in both populations are equal (F(x) = G(x)). An alternative hypothesis is: —the distributions of the subjective MOS ratings in both populations are different (). The test results are presented in Table 2.
Table 2.
Statistical significance of p-value for test.
The obtained values of indicate that at a significance level of , the hypothesis for each pair of research groups in Table 2 should be rejected in favor of the hypothesis; i.e., the distributions of the subjective MOS ratings in both populations are different. In addition, using the characteristics of transitive relations between the average MOS values for individual qualitative groups (i.e., if a given property holds for pair (x,y) and pair (y,z), it also holds for the pair (x,z)), it should be noted that, in this case, the average MOS value for each qualitative group with a higher objective quality is greater than the average MOS value for the qualitative group with a lower objective quality. Thus, the hypothesis indicates that for each pair of quality groups, for a group with a better technical objective quality, the average subjective assessment is higher.
In addition, for extreme quality groups (A vs. E), an analysis of the MOS variance differences was performed using the F-Snedecor test. In this test, a value of was obtained in both groups, which indicates at the level of statistical significance of 0.05 that the variance of ratings for the group with the highest quality is higher than the variance of ratings for the group with the lowest quality.
Results interpretation. At the assumed level of statistical significance, in each qualitative group, the subjective ratings obtained in the experiment directly correlate with the level of the objective video quality—the average subjective MOS rating is always higher for a qualitative group with a higher objective quality. In addition, for the extreme quality groups, a greater dispersion of the ratings was shown for sequences of high objective quality (QG A) compared to videos of low objective quality (QG E).
4.3.2. Research Hypothesis 2
Experiment results. In the REPEAT research group, the values of the MOS ratings for the sequences in all quality groups were analyzed depending on the display multiplicity, taking into account the ratings of the first, second, and third displays of a given PVS by the tester, as in Figure 7, where (1, 2, and 3) are the analyzed scores for the first, second, and third occurrences of a PVS for a given subject.

Figure 7.
Analyzed subjective assessments for Hypothesis 2.
Figure 8 shows the MOS values obtained depending on the multiplicity of the presentation of a given PVS.
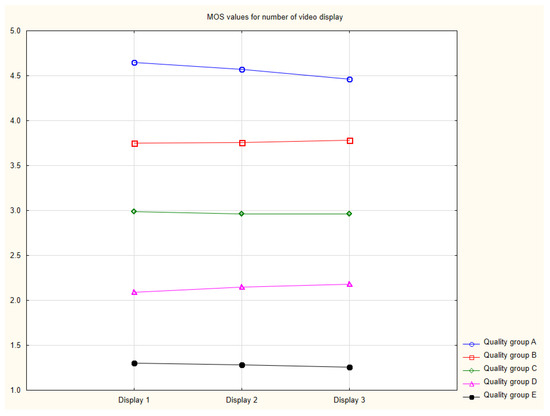
Figure 8.
MOS values depending on the multiplicity of the PVS’s presentation.
Table 3 shows the MOS ratings for the first, second, and third views of the same video.
Table 3.
Average MOS values depending on the number of views of a given PVS for REPEAT group.
Statistical verification. An appropriate procedure for an analysis of the dependent samples was adopted, as they concerned successive views of the same sequences by the same testers. Thus, the same variable was measured multiple times at a specific time interval. Stimulus differentiating trials are the recipient’s habituation to repetitive content. For each quality group (A–E), an analysis was performed using the Wilcoxon matched-sample order test, which compares the differences between the MOS scores obtained for the first and third displays of a given sequence. The Wilcoxon pairwise order test is used when the measured variable has been measured twice under different conditions. One subject of the analysis is the difference between the pairs of measurements of an examined feature for each of the tested objects. For each indicated pair of samples in each qualitative group, the following statistical null hypothesis was defined: —the distributions of the subjective MOS scores in both populations are equal (F(x) = G(x)), and no differences between the groups exist. An alternative hypothesis is: —the distributions of the subjective MOS scores in both populations are different (), and statistically significant differences between the groups exist.
For large samples (n > 20), the Wilcoxon test statistic takes the form:
where , n is the number of ranked characters (number of ranks), and t is the number of cases included in the tied rank. is the sum of the negative ranks, and is the sum of the positive ranks.
Table 4 presents the obtained values of the p-value statistical significance level for the test in two qualitative groups for which the potentially correlated results were obtained, i.e., for qualitative groups A and D.
Table 4.
Statistical significance of p-value for the test in REPEAT group—dependent samples.
For qualitative group A, the obtained p-value indicates that at significance level of , the hypothesis should be rejected in favor of the hypothesis; i.e., the distribution of the subjective MOS ratings in both populations is different. In the case of qualitative group D, at a significance level of , there are no grounds for rejecting the null hypothesis, and the p-value is close to the significance level of 0.05.
Results interpretation. In the group with the highest objective quality (A), the average MOS score for the first impression was statistically significantly higher than that of the third impression. Thus, the high-quality PVS ratings deteriorate with subsequent views, which may indicate an increase in the testers’ criticisms of objectively high-quality content.
4.3.3. Research Hypothesis 3
Experiment results. In both research groups, MOS values for all quality groups were compared, depending on the quality group of the preceding video, as shown in Figure 9, where X (marked with blue colour) represents given research sample (PVS), and (A, B, C, D, E) are the preceding samples assigned to objective quality groups (for better visibility marked with various colours).
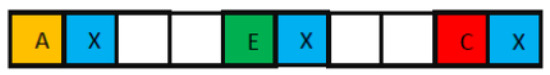
Figure 9.
Analyzed subjective assessments for Hypothesis 3.
Figure 10 shows the dependence of the obtained MOS values for the individual quality groups depending on the objective quality of the preceding video for two extreme quality groups of predecessors, i.e., group A (the best) and group E (the worst).
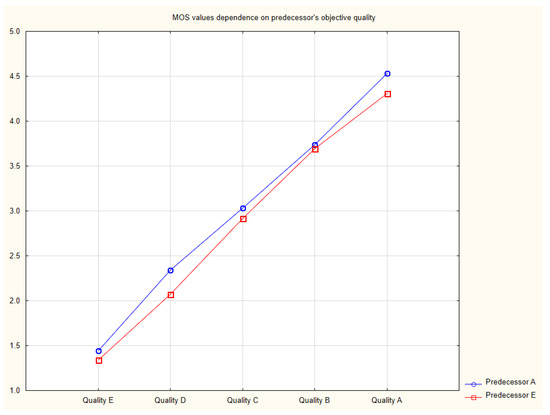
Figure 10.
MOS values depending on qualitative group of predecessors.
Table 5.
MOS values depending on the quality of the objective predecessor for REGULAR group.
Table 6.
MOS values depending on the quality of the objective antecedent for REPEAT group.
Statistical verification. In each quality group of both research samples (REGULAR/REPEAT), the average MOS score for the preceding videos from the highest quality group (A) was higher than for the preceding videos from the lowest quality group (E). In order to verify this statistically, for each quality group, an analysis of the results obtained using the Mann–Whitney U test was carried out, comparing the differences between the MOS scores obtained in the case in which the predecessors were sequences of extreme objective quality (very high from quality group A and very low from the quality group E).
The Mann–Whitney U test was used to compare two independent research groups in terms of the quantitative variable. This test can be used when the quantitative variable is ordinal, as well as in the case of unequal samples, which is true in this case. The Mann–Whitney U test compares each observation against the rank averages.
For each indicated pair of qualitative groups, the following null hypothesis was defined: —the distributions of the subjective MOS ratings in both populations are equal (F(x) = G(x)); i.e., no differences between the groups can be observed. An alternative hypothesis is: —the distributions of the subjective MOS scores in both populations are different (), and statistically significant differences between the groups exist.
The test statistic for the Mann–Whitney U test is as follows:
where , is the minimum sum of ranks from the groups, is the number of observations in a group with the minimum sum of ranks, and t is the number of observations with the same ranks.
The formula for the Z-test statistic includes a correction for tied ranks, i.e., the ranking values resulting from dividing the sum of the same case values by the number of the same case values. This correction is applied when tied ranks exist. When there are no tied ranks, this correction is not calculated because then
The statistical test was performed separately in both the REGULAR and REPEAT groups. Table 7 presents the obtained values of the p-values for the test in the REPEAT group.
Table 7.
Obtained p-values for the test in REPEAT group.
In qualitative groups A and D, the obtained p-value indicates that at a significance level of , the hypothesis for each of the pairs of research groups should be rejected in favor of the hypothesis—the distribution of the subjective MOS ratings in both populations is different. In other cases, at a significance level of , there are no grounds for rejecting the null hypothesis on the equality of the distributions. In the REGULAR group, for all pairs, the obtained p-value (≥0.42) indicates that at a significance level of , there are no grounds for rejecting the null hypothesis about the equality of the distributions.
Results interpretation. Referring the obtained results of the statistical analysis to the experiment results, it should be noted that the effect of a better average subjective MOS score in the case in which a preceding video is of much better quality was obtained at each level of sequence objective quality. It is true that the statistical significance was obtained only in the REPEAT group for quality groups A and D, but the repeated better results obtained in the group with a very high-quality predecessor for all quality groups indicate the justification of further research in this area.
5. Discussion
As a result of the conducted experiment, at the level of statistical significance , the following have been shown:
- For all levels of objective quality groups—a correlation of the average subjective assessment for the presented video sequences (MOS) with their objective quality (for Hypothesis 1);
- For the highest level of objective quality group—the dependence of the subjective quality assessment for the presented video sequences on their display number (for Hypothesis 2);
- For the highest level of objective quality group—the dependence of the subjective quality assessment on the objective quality of the previously displayed video sequence; the average assessment if the preceding video belonged to the highest quality group is higher than if the preceding video was of very low quality (for Hypothesis 3).
Further discussion on the obtained results should focus on conclusions concerning Hypotheses 2 and 3, i.e., the impact of the number of views for a given video and the impact of the preceeding video’s objective quality on the subjective quality assessment. Hypothesis 1, concerning the compliance of technical objective assessment with average values of the subjective assessments, is of an auxiliary nature as the correlation has been mainly utilized to verify data consistency and to confirm that the obtained results retain their substantive and logical sense.
The regularity observed in the experiment is the deterioration of the subjective ratings for videos from the highest quality group with successive views in a research sample. Videos from group A are the ones of the highest quality, i.e., close to the source quality. The phenomenon of the deterioration of the average rating in subsequent views of the same video would indicate the effect of a lower “appreciation” of the video’s quality by the tester with subsequent presentations. The deteriorating ratings of videos of the highest quality also fit in with the state of knowledge developed within cognitive sciences, indicating a more favorable assessment by the tester for a high-quality stimulus that he/she can see for the first time [26]. An option presented first is ultimately more often chosen by a tester, so it is also treated more favorably than a similar stimulus presented later.
It should also be noted that such an effect was not obtained for videos from other quality groups, as no statistically significant differences in the average ratings of these videos were noted in the conducted research. The regularity worth noting is an improvement in the average ratings with successive views for videos from the D quality group, i.e., from the penultimate worst group of objective quality. The obtained results could suggest that with successive views of the same video, their average rating becomes “averaged”, as videos of the highest quality are rated worse and videos of low quality are rated better. It should be noted here that videos from the lowest quality group E are characterized by a VMAF value of around 10. It is assumed that the lowest acceptable VMAF value that should be analyzed is 20, so the D quality group is the lowest quality group for which reliable results can be obtained. The obtained results are in line with the results of the research described in the subject literature. Publication [11] indicates that, in an experiment, “unpleasant” images displayed at the end are less “unpleasant” than when they are displayed at the beginning. This corresponds to the situation of presenting a low-quality video that is not pleasant to watch to the tester and its subjective rating increases with subsequent views.
It is also worth referring to the results published in [12], containing the so-called “Peak-End Effect”, regarding the overall quality of the QoE measures obtained after participants watched a sequence of videos. Within this concept, the Peak-End Effect is a regularity in which a subject evaluates an overall experience largely on the basis of the sensations at the moment of the most intense sensations and on the basis of the final ones. Other information beyond the peak and end of the experience is not lost, but it is not used. This applies to both positive and negative impressions. Admittedly, this effect cannot be directly translated into the results obtained in the experiment because the described effect applies to the final video evaluation after watching a whole video, consisting of video sequences of various quality, while, indirectly, the growing feelings of the evaluator may translate into a subjective evaluation of the individual video sequences.
Demonstrated in the experiment, the regularity of the higher variance of the subjective ratings for the highest quality group than the variance of ratings for the lowest quality group indicates that for videos of a very low quality level, the subjects focused more on the negative assessment of poor quality videos than their appreciation of the high quality videos. This regularity correlates with the theses expressed in publication [27], in which the negative assessment of events equidistant from the permissible boundary values is stronger than the positive assessment. This constitutes a kind of “negative bias” where negative evaluations are “weighted” more than positive evaluations. Worth discussing, as well, is an aspect of multimedia content presentation order and structure randomization for mitigating the impact of the identified effects mentioned above and, as a result, avoiding the so-called order bias. In publication [28], the authors identified an aspect of “learning” the rating scale along with running a test, proposing a solution that uses other comparison methods (the Pair Comparison method) in their research, instead of the ACR methodology used in this experiment, in order to mitigate a bias effect.
6. Conclusions and Further Directions
The contributions of the presented research includes the following aspects:
- Demonstrating the correlation between a number of video views and the subjective assessment;
- Demonstrating the correlation between the technical objective quality of the preceding video and the subjective assessment of a given video;
- Referring the obtained results for a multimedia QoE to dependencies identified in the other areas of cognitive sciences.
Recommendations for further research, related to the presented results, include the aspects listed below:
- Randomization of the order and structure of multimedia content presentation to eliminate or minimize the impact of identified correlations and optimize content presentation in a way that minimizes the effects of the observed dependencies, i.e., deterioration of the perceived quality with subsequent views and deterioration of the subjective quality compared to the poor quality predecessor.
- Analyzing the impact of actions contrary to randomization, i.e., the intentional strengthening of an “order bias” effect to maximize the perceived subjective quality through the appropriate selection of the tested stimuli presentation structure.
- Identifying the correlation of the obtained dependencies with other impact factors, particularly of a human- and system-related nature, by deepening the research to verify whether the observed dependencies of the subjective assessments to the stimuli order can also be correlated with demographic characteristics. In such a case, it would be necessary to analyze multiple correlations between stimuli order and structure, demographic characteristics (independent variables), and subjective assessment (dependent variable).
- Analyzing the correlation of a subjective assessment and the impact of the research stimuli order in reference to different image/video sources (e.g., satellite images, SAR, etc.), including the ones used for video and image detection in various aspects of scientific research.
- An impact analysis on the subjective assessment for various video database types, including analyzing the types of distortions for particular video sequences.
- Verification of the correlation degree for the obtained subjective assessment results with the levels of technical objective quality for various types of objective video quality metrics, including no-reference metrics, reduced reference metrics, and those other than the full reference VMAF metrics.
Author Contributions
Conceptualization, T.K. and M.L; methodology, T.K., M.L. and D.J.; software, M.L.; validation, T.K., M.L. and D.J.; formal analysis, T.K. and D.J.; resources, T.K., M.L. and D.J.; data curation, T.K.; writing—original draft preparation, T.K.; writing—review and editing, M.L., D.J. and T.K.; visualization, T.K.; supervision, M.L. and D.J.; project administration, M.L. and T.K.; funding acquisition, M.L. All authors have read and agreed to the published version of the manuscript.
Funding
This work was supported by the Polish Ministry of Science and Higher Education with the subvention funds of the Faculty of Computer Science, Electronics and Telecommunications of AGH University of Krakow.
Data Availability Statement
Datasets used and supporting reported results are not available publicly but they are available in the Institute of Telecommunications of AGH University of Krakow and can be accessed on demand (in agreement with the corresponding author).
Conflicts of Interest
The authors state that they have no conflict of interest.
References
- Brunnström, K.; Beker, S.A.; De Moor, K.; Dooms, A.; Egger, S.; Garcia, M.N.; Hossfeld, T.; Jumisko-Pyykkö, S.; Keimel, C.; Larabi, M.C.; et al. Qualinet White Paper on Definitions of Quality of Experience. 2014; HAL Id: hal-00977812. Available online: https://hal.science/hal-00977812 (accessed on 6 November 2023).
- Kilkki, K. Quality of experience in communications ecosystem. J. Univers. Comput. Sci. 2008, 14, 615–624. [Google Scholar]
- Raake, A.; Egger, S. Quality and Quality of Experience. In Quality of Experience; Möller, S., Raake, A., Eds.; T-Labs Series in Telecommunication Services; Springer: Cham, Switzerland, 2014. [Google Scholar]
- Reiter, U.; Brunnström, K.; De Moor, K.; Larabi, C.; Pereira, M.; Pinheiro, A.; You, J.; Zgank, A. Factors Influencing Quality of Experience. In Quality of Experience; Möller, S., Raake, A., Eds.; T-Labs Series in Telecommunication Services; Springer: Cham, Switzerland, 2014. [Google Scholar]
- Newman, J.L.; Fuqua, D.R. The Effects of Order of Stimulus Presentation on Ratings of Counseling Performance. Couns. Educ. Superv. 1986, 26, 7–16. [Google Scholar] [CrossRef]
- Schneider, K.A.; Devine, B.; Aguilar, G.; Petursdottir, A.I. Stimulus presentation order in receptive identification tasks: A systematic replication. J. Appl. Behav. Anal. 2018, 51, 634–646. [Google Scholar] [CrossRef] [PubMed]
- Jamieson, D.G.; Petrusic, W.M. Presentation order effects in duration discrimination. Percept. Psychophys. 1975, 17, 197–202. [Google Scholar] [CrossRef]
- Pollack, R.H. Effects of Temporal Order of Stimulus Presentation on the Direction of Figural Aftereffects. Percept. Mot. Ski. 1963, 17, 875–880. [Google Scholar] [CrossRef] [PubMed]
- Hammerl, M.; Grabitz, H.J. Human evaluative conditioning: Order of stimulus presentation. Integr. Physiol. Behav. Sci. 1993, 28, 191–194. [Google Scholar] [CrossRef] [PubMed][Green Version]
- Scarpi, D. Effects of Presentation Order on Product Evaluation: An Empirical Analysis. Int. Rev. Retail. Distrib. Consum. Res. 2004, 14, 309–319. [Google Scholar] [CrossRef]
- Kosonogov, V. The effects of the order of picture presentation on the subjective emotional evaluation of pictures. PSICOLOGIA 2020, 34, 171–178. [Google Scholar] [CrossRef]
- Chignell, M.H.; Zucherman, L.; Kaya, D.; Jiang, J. Peak-end effects in video Quality of Experience. In Proceedings of the 2016 Digital Media Industry & Academic Forum (DMIAF), Santorini, Greece, 4–6 July 2016; pp. 230–234. [Google Scholar]
- Rassool, R. VMAF reproducibility: Validating a perceptual practical video quality metric. In Proceedings of the IEEE International Symposium on Broadband Multimedia Systems and Broadcasting (BMSB), Cagliari, Italy, 7–9 June 2017; pp. 1–2. [Google Scholar]
- ITU-T. Recommendation ITU-T P.913: Methods for the Subjective Assessment of Video Quality, Audio Quality and Audio-Visual Quality of Internet Video and Distribution Quality Television in Any Environment, International Telecommunication Union; ITU-T Publications: Geneva, Switzerland, 2016. [Google Scholar]
- ITU-T. Recommendation ITU-T P.800: Methods for Subjective Determination of Transmission Quality, International Telecommunication Union; ITU-T Publications: Geneva, Switzerland, 1996. [Google Scholar]
- ISO/IEC 14496-1:2010; Coding of Audio-Visual Objects. Technical Committee: ISO/IEC JTC 1/SC 29. ICS:35.040.40. International Organization for Standardization: Geneva, Switzerland, 2010.
- Xu, J.; Li, J.; Zhou, X.; Zhou, W.; Wang, B.; Chen, Z. Perceptual quality assessment of internet videos. In Proceedings of the 29th ACM International Conference on Multimedia, Virtual Event, 20–24 October 2021; pp. 1248–1257. [Google Scholar]
- Zhang, Z.; Wu, W.; Sun, W.; Tu, D.; Lu, W.; Min, X.; Chen, Y.; Zhai, G. MD-VQA: Multi-dimensional quality assessment for UGC live videos. In Proceedings of the IEEE/CVF Conference on Computer Vision and Pattern Recognition, Vancouver, BC, Canada, 18–22 June 2023; pp. 1746–1755. [Google Scholar]
- Huang, S.; Luo, Z.; Xu, J.; Zhou, W.; Chen, Z. Perceptual Evaluation of Pre-processing for Video Transcoding. In Proceedings of the 2021 International Conference on Visual Communications and Image Processing (VCIP), Munich, Germany, 5–8 December 2021; pp. 1–5. [Google Scholar]
- Li, B.; Zhang, W.; Tian, M.; Zhai, G.; Wang, X. Blindly assess quality of in-the-wild videos via quality-aware pre-training and motion perception. IEEE Trans. Circuits Syst. Video Technol. 2022, 32, 5944–5958. [Google Scholar] [CrossRef]
- Martinez, H.B.; Farias, M.C.; Hines, A. A no-reference autoencoder video quality metric. In Proceedings of the 2019 IEEE International Conference on Image Processing (ICIP), Taipei, Taiwan, 22–25 September 2019; pp. 1755–1759. [Google Scholar]
- Zadtootaghaj, S.; Barman, N.; Schmidt, S.; Martini, M.G.; Möller, S. NR-GVQM: A no reference gaming video quality metric. In Proceedings of the 2018 IEEE International Symposium on Multimedia (ISM), Taichung, Taiwan, 10–12 December 2018; pp. 131–134. [Google Scholar]
- Keimel, C.; Habigt, J.; Diepold, K. Hybrid no-reference video quality metric based on multiway PLSR. In Proceedings of the 2012 20th European Signal Processing Conference (EUSIPCO), Bucharest, Romania, 27–31 August 2012; pp. 1244–1248. [Google Scholar]
- Dutta, S.; Das, S.D.; Shah, N.A. Can No-reference features help in Full-reference image quality estimation? arXiv 2022, arXiv:2203.00845. [Google Scholar]
- Corder, G.W.; Foreman, D.I. Nonparametric Statistics: A Step-by-Step Approach; John Wiley & Sons: Hoboken, NJ, USA, 2014. [Google Scholar]
- Hung, Y.; Song, L.; Chao, C.F.; Guan, C. Love at first sight: The effect of presentation order on evaluation of experiential options in luxury tour packages. J. Bus. Res. 2017, 81, 181–191. [Google Scholar] [CrossRef]
- Baumeister, R.F.; Bratslavsky, E.; Finkenauer, C.; Vohs, K.D. Bad is stronger than good. Rev. Gen. Psychol. 2001, 5, 323–370. [Google Scholar] [CrossRef]
- Juszka, D.; Papir, Z. A study on order effect in a subjective experiment on stereoscopic video quality. In Proceedings of the 2015 Seventh International Workshop on Quality of Multimedia Experience (QoMEX), Pilos, Greece, 26–29 May 2015; pp. 1–6. [Google Scholar]


Disclaimer/Publisher’s Note: The statements, opinions and data contained in all publications are solely those of the individual author(s) and contributor(s) and not of MDPI and/or the editor(s). MDPI and/or the editor(s) disclaim responsibility for any injury to people or property resulting from any ideas, methods, instructions or products referred to in the content. |
© 2023 by the authors. Licensee MDPI, Basel, Switzerland. This article is an open access article distributed under the terms and conditions of the Creative Commons Attribution (CC BY) license (https://creativecommons.org/licenses/by/4.0/).