Article

One-Dimensional Convolutional Wasserstein Generative Adversarial Network Based Intrusion Detection Method for Industrial Control Systems

1
School of Computer and Communication Engineering, Zhengzhou University of Light Industry, Zhengzhou 450001, China
2
School of Informatics, Xiamen University, Xiamen 361005, China
3
School of Mechanical and Electrical Engineering, Zhengzhou University of Light Industry, Zhengzhou 430002, China
4
School of Software Engineering, Zhengzhou University of Light Industry, Zhengzhou 450003, China
*
Author to whom correspondence should be addressed.
Electronics 2023, 12(22), 4653; https://doi.org/10.3390/electronics12224653
Submission received: 13 October 2023 / Revised: 13 November 2023 / Accepted: 13 November 2023 / Published: 15 November 2023
(This article belongs to the Special Issue AI-Driven Network Security and Privacy)

Abstract

:
The imbalance between normal and attack samples in the industrial control systems (ICSs) network environment leads to the low recognition rate of the intrusion detection model for a few abnormal samples when classifying. Since traditional machine learning methods can no longer meet the needs of increasingly complex networks, many researchers use deep learning to replace traditional machine learning methods. However, when a large amount of unbalanced data is used for training, the detection performance of deep learning decreases significantly. This paper proposes an intrusion detection method for industrial control systems based on a 1D CWGAN. The 1D CWGAN is a network attack sample generation method that combines 1D CNN and WGAN. Firstly, the problem of low ICS intrusion detection accuracy caused by a few types of attack samples is analyzed. This method balances the number of various attack samples in the data set from the aspect of data enhancement to improve detection accuracy. According to the temporal characteristics of network traffic, the algorithm uses 1D convolution and 1D transposed convolution to construct the modeling framework of network traffic data of two competing networks and uses gradient penalty instead of weight cutting in the Wasserstein Generative Adversarial Network (WGAN) to generate virtual samples similar to real samples. After a large number of data sets are used for verification, the experimental results show that the method improves the classification performance of the CNN and BiSRU. For the CNN, after data balancing, the accuracy rate is increased by 0.75%, and the accuracy, recall rate and F1 are improved. Compared with the BiSRU without data processing, the accuracy of the s1D CWGAN-BiSRU is increased by 1.34%, and the accuracy, recall and F1 are increased by 7.2%, 3.46% and 5.29%.

1. Introduction

The traditional industrial control system (ICS) is in a physical environment completely isolated from the external network, and its operating system requires a dedicated communication protocol [1]. Most existing ICSs, such as building energy management systems (EMSs), had only physical threats in the past. With the continuous integration of information technology (IT) and ICSs, the integration process of industrialization and informatization is accelerating, and potential ICS network security problems are gradually exposed. ICSs are now usually connected to a communication network, so they can be accessed remotely. The inherent connectivity in these services makes such systems face network security risks. And this expands the attack surface, including the possibility of complex cyber attacks, which may adversely affect ICS operations, resulting in service outages, equipment damage, security issues and related financial impacts.
Intrusion detection can take the initiative to monitor network traffic and host equipment and find and prevent network attacks. In the ICS network environment, the imbalance between normal samples and attack samples leads to a low recognition rate of intrusion detection models for a small number of abnormal samples in the classification. The industrial control intrusion detection model pays special attention to the detection success rate of abnormal samples. With the development of artificial intelligence technology, machine learning is more and more widely used in ICS intrusion detection. Although the traditional machine learning method is simple and the training time is short, the detection accuracy is relatively low. In addition, complex data preprocessing and artificial feature extraction are required before processing these industrial control data, which requires rich experience and a lot of practice. The deep learning method can avoid complex data preprocessing and identify attack-type data with high precision [2,3,4,5].
Researchers [6] have demonstrated that deep learning algorithms are more accurate than traditional machine learning algorithms. However, when a large amount of unbalanced data is used for training, the detection performance of deep learning decreases significantly. The imbalance of traffic data of ICSs is the main factor, and generative adversarial networks (GANs) have become a research hotspot for enhancing a few types of data. However, GANs have the problems of unstable training, disappearing gradient and mode collapse. In view of the shortcomings of GANs, WGANs make the training of the model more stable and reduce the occurrence of mode collapse by introducing the Wasserstein distance. At the same time, WGANs can generate more samples by optimizing the Wasserstein distance. In general, WGANs are improved on the basis of GANs, which improve the stability of training and the diversity of generated samples and alleviate the problem of gradient disappearance.
Aiming at the imbalance of ICS traffic data, this paper proposes a network attack sample generation method, 1D CWGAN, which integrates 1D CNN and WGAN. The algorithm uses 1D convolution and 1D transposed convolution to construct two competitive network traffic data modeling frameworks and uses gradient penalty instead of weight pruning in the WGAN to improve the stability of model training. Finally, a convolutional neural network (CNN) and bidirectional simple recurrent unit (BiSRU) are used to verify the 1D CWGAN model on the enhanced data set.

2. Related Work

In this section, we introduce related work, including intrusion detection methods based on machine learning and deep learning ICSs.

2.1. Intrusion Detection Method Based on Machine Learning

There are many classical machine learning methods, including support vector machine (SVM) [7], decision tree [8] and naive Bayes [9]. Anton et al. [10] used SVM to detect seven different classes of attacks in the gas pipeline of the standard industrial data set. Although a high accuracy rate was achieved, the precision rate was low. Al-Asiri et al. [11] used the gas pipeline of the standard industrial data set to verify the effectiveness of the decision tree classifier for various features in the SCADA system using an IDS with a single network metric and physical metric. Khan et al. [12] used the original features from the gas pipeline data set to formulate a new set of features for attack detection using naive Bayes in supervised learning mode. Tian et al. [13] proposed a method that combines machine learning optimized by a swarm intelligence algorithm and deep learning. They used a stack autoencoder to reduce the dimension of data feature and then combined SVM and an artificial bee colony algorithm to perform an intrusion detection experiment. Although machine-learning-based methods have achieved good results in recent years, they can only perform shallow learning and cannot accurately identify network attacks in ICSs [14]. For example, SVM instead leads to a decrease in accuracy when the number of samples increases, naive Bayes methods do not handle data with correlated attributes well and decision tree has poor generalization capabilities [15,16].

2.2. Intrusion Detection Method Based on Deep Learning

With the increasing computing power of computers, deep learning methods are rapidly emerging in various fields, especially in image detection and speech recognition [17]. At the same time, this has led many scholars in the direction of industrial Internet security to apply deep learning to intrusion detection of ICSs. Yang et al. [18] proposed a CNN for intrusion detection systems (IDSs). Liu et al. [19] proposed a hybrid method of deep learning and population intelligence optimization algorithms. They used a CNN for feature extraction and anomaly recognition; then, the features extracted by the CNN model were invoked as input to the algorithm to construct a normal state process transfer model. RNNs are widely used as temporal deep learning models for intrusion detection of ICSs. The IDSs provide an effective method of abnormal traffic detection. Yin Let al. [20] proposed an IDS based on the RNN-IDS algorithm. The method was validated using the NSL_KDD data set, and the results showed that it outperformed traditional machine learning methods. LSTM is a variant of SimpleRNN, and it alleviates the problem of gradient vanishing and gradient explosion of SimpleRNN to a certain extent. Roy et al. [21] proposed an Internet of Things (IoT) intrusion detection method based on a bidirectional long short-term memory recurrent neural network (BLSTM RNN) to improve the problem of insufficient SimpleRNN temporal storage capacity. Sokolov et al. [22] used GRU for experiments on intrusion detection in the gas pipeline data set and investigated the applicability of the method in various aspects of intrusion detection of ICSs. In 2018, Lei et al. proposed an SRU model [23]. The model used a simpler structure to solve the sequence dependence problem in previous LSTM and GRU models, further alleviating the problem of RNN gradient vanishing and gradient explosion and enabling parallel computation. SRU has been successfully applied in the field of classification and conversational systems.
Researchers have proved that deep learning algorithms are more accurate than traditional machine learning algorithms. However, when training with a large amount of imbalanced data, the detection performance of deep learning decreases significantly. The imbalance of ICS traffic data is the main factor, and GANs have become a research hotspot for enhancing several types of data. However, GANs have problems such as unstable training, gradient disappearance and model collapse. This paper proposes an ICS traffic data detection model based on a CNN and BiSRU. The CNN can effectively extract the spatial features of traffic data, and the BiSRU can effectively learn the forward and backward time series features of ICSs. At the same time, one-dimensional convolution and one-dimensional transposed convolution are used to establish discriminator D and generator G, which is conducive to the establishment of the network model and the better simulation of data distribution of the ICS network traffic. The WGAN with gradient penalty (GP) can effectively solve the problem of model collapse during training. This study has conducted sufficient experiments on multiple data sets to verify our proposed method.

3. ICS Intrusion Detection Method Based on 1D CWGAN

In this paper, 1D convolution and 1D transposed convolution are used to build discriminator D and generator G, which is conducive to the network model to better simulate the data distribution of the ICS network traffic. The WGAN with gradient penalty (GP) can effectively solve the problem of model collapse during training. The detection models of the ICS traffic data based on a CNN and BiSRU are proposed, respectively.

3.1. Overview of GAN

A GAN is a powerful neural network for unsupervised learning, first developed and introduced in 2014. A GAN is a system composed of two competing neural network models that compete with each other and can analyze, capture and replicate changes in the data set [24]. In a GAN, there is a generator and a discriminator. The generator generates false data samples and tries to deceive the discriminator. On the other hand, the discriminator attempts to distinguish between true and false samples. Both the generator and the discriminator are neural networks. The generator network needs to continuously optimize the data generated by itself so that the discriminator network cannot judge. The discriminator network also needs to optimize itself to make its judgment more accurate. The relationship between the two forms a confrontation, so it is called a confrontation network. They compete with each other in the training phase and repeat these steps. In this process, the generator and discriminator become better and better in their respective work after each game.

3.1.1. Generator

The generator G is responsible for learning the real distribution of the sample. The function of the generator is similar to that of the autoencoder. The random vector z is sampled from the prior distribution, and the generated sample G (z) is obtained by generating the network parameterized distribution. From the input and output level, the function of the generator is to convert the hidden vector z into the sample vector x through the neural network.

3.1.2. Discriminator

The discriminator is similar to the ordinary binary classification network. It accepts the data set of the input sample x, including the samples sampled from the real data distribution, and also includes the false samples sampled from the generated network, which together form the discriminator training data set [25]. The discriminator output is the probability P belonging to the real sample, the labels of all real samples are labeled as true, and the samples generated by all generators are labeled as false.

3.1.3. Network Training

The training process is a process of the generator and discriminator game. The generator generates false data and then inputs both the generated false data and the true data into the discriminator, which determines what is true and what is false. The discriminator must have a large error for the first time, and then the discriminator is optimized according to the error. As the discriminator level increases, it is difficult to deceive the discriminator again with the data generated by the generator, so the optimization of the generator continues. As the generator level increases, in turn, it continues to train the discriminator, so that the cycle is repeated until Nash equilibrium is reached.
The training of the GAN first trains D and then trains G in the first round. It is not necessary to wait for all of the D training to start training G, because the training of D also requires the output value of G in the previous round as the input. In the first stage, only discriminant model D is involved. The sample in the training set is used as the input of D, and a certain value between 0 and 1 is output. The larger the value, the greater the possibility that the sample is real data. In this process, we hope that D can make the output value close to 1 as much as possible. In the second stage, both the discriminant model D and the generation model G are involved. First, the noise z is input into G, G learns the probability distribution from the real data set and generates false samples, and then inputs the false samples into the discriminant model D. This time, D will enter the value 0 as much as possible. Therefore, in this process, the discriminant model D is equivalent to a binary classifier, and the data are either classified as 1 or 0. The result of the last two model games is that G can generate false data G (z). However, it is difficult for D to determine whether the data generated by G are true, that is, D (G (z)) = 0.5.

3.2. Data Enhancement Method Based on 1D CWGAN

In order to solve the problem of unbalanced data set samples caused by the small number of attack samples, this chapter proposes a 1D CWGAN algorithm to generate virtual samples to balance the number of samples in various data sets. Aiming at the temporal characteristics of network traffic, the algorithm uses 1D convolution and 1D transposed convolution to construct two network traffic data modeling frameworks of competitive networks and uses the gradient penalty in the WGAN instead of weight clipping to improve the stability of model training. Finally, a CNN and BiSRU are used to verify the 1D CWGAN model of the enhanced data set. The ICS intrusion detection data enhancement model based on 1D CWGAN is shown in Figure 1.

3.3. Description of Intrusion Detection Algorithm Based on 1D CWGAN

Using the generative adversarial network to learn the data distribution of the ICS network traffic data, a virtual sample similar to the real sample is generated. The confrontation process needs to train the generator G and the discriminator D at the same time. For serial data like the network traffic of ICSs, this paper uses 1D convolution and 1D transposed convolution to construct a modeling framework for network traffic data for two competing networks. The generator model generates synthetic data examples with similar distribution to the real sample data by random Gaussian noise; the discriminator model is used to distinguish whether the generated synthetic data are real or not. In the process of the game between the two models, the generator model generates samples to deceive the discriminator model as much as possible, and the discriminator model avoids this deception as much as possible. Finally, generator G and discriminator D will be in Nash equilibrium. The objective function is written in the form of a minimum–maximum game:
min D   max G V D ,   G = E x ~ p r l o g D ( x ) + E z ~ p g l o g 1 D G z
where x is the real data, pr is the probability distribution of the real data, z is the input noise of the generator, pg is the distribution of the generated data G(z) and D(x) is the output of the discriminator network. The objective function in (1) is essentially to minimize the Jensen–Shannon (JS) dispersion between the real data distribution and the virtual data distribution under the premise that the discriminator D is optimal.
Arjovsky et al. [26] theoretically analyzed that the JS dispersion is not suitable for measuring the distance between disjoint parts of the distribution and used the Wasserstein distance to measure the distance between the generated distribution and the real data distribution, providing meaningful gradient information to solve the problem of instability of GAN training data and model collapse. Although the training stability of the WGAN is further enhanced than that of the original GAN, the WGAN uses Lipschitz weight pruning to limit the parameters of the discriminator model to a certain range during training, which makes the network parameters tend to be unreasonable extreme values and weakens the fitting ability of the neural network. When the pruning range approaches the limit, it also re-causes the phenomenon of gradient explosion. Therefore, this paper introduces the gradient penalty (GP) term, which improves the Lipschitz continuity constraint and uses the gradient penalty instead of weight clipping in the WGAN to improve the stability of model training. The loss function of the 1D CGAN with the introduction of the GP term is shown in Equation (2):
L = E G z ~ p g D ( G z ) E x ~ p r D x + φ E x ^ ~ p x ^ x ^ D x ^ 2 1 2
where φ is the gradient penalty coefficient and p x ^ is the random sample between the real data x and the random noise z. x ^ D x ^ represents the gradient of discriminator D. The first two terms of the loss function are the original discriminator D loss, and the latter is the introduced GP.
The specific steps of the algorithm are as follows:
Step 1: Separate different types of attack data and generate corresponding virtual samples through the following steps.
Step 2: Generate the random sample set. The random noise z is used as the input layer of the generation network, denoted as z 1 ,   z 2 ,   ,   z n , where z n is a random number. The generator network generates close to real dummy samples by capturing the probability distribution of the network traffic data of ICSs during the training process. The simulation of the generated attack samples is very low at this time.
Step 3: Train discriminator D. Fix the generator G, network traffic data of the ICSs and the set of fake attack samples generated from the G as the input of the D. E G z ~ P g D G z and Equation (2) are used to establish the loss functions of the G and D, respectively, as the reference standard for the adversarial training of the G and D. The objective function value of the D is denoted as L.
Step 4: Train generator G. The further training of generator G is to be trained through the G–D concatenation. After step 2, the D has a certain discriminative ability. The purpose of training G is to generate a false sample that D cannot discriminate between true and false. The set of false attack samples generated after step 1 with a similar distribution of network traffic data of ICSs is used as the input layer of D.
Step 5: Alternate training. If the objective function value or the specified number of cycles does not reach the threshold, step 2 and step 3 are cycled to alternate training for D and G. The gradient update using an Adam optimizer optimizes the D loss value L.
Step 6: Generate data. The final output generates data for the generator G model, solves the data set imbalance problem and reconstructs the data set.
A CNN and BiSRU were used to validate the 1D CWGAN model against the data set after enhancement. Our CNN network stacks two convolutional layers before the pooling layer. By stacking the convolutional layers, the activation function relu is sandwiched between the convolutional layers. The stacking of nonlinear functions increases the nonlinear expressiveness of the activation function, which enables it to learn well the spatial feature information of the ICSs’ complex high-dimensional network traffic data. Due to the efficiency of the SRU, it is used to replace LSTM and GRU, but it can only extract sequence features in a single direction and does not fully consider the influence before and after features of network traffic of ICSs. In this paper, we use the BiSRU for feature extraction of long-distance dependence information of network traffic in both positive and negative directions, and finally, through the intrusion detection, the results are finally output by softmax.

4. Experiment

4.1. Data Set

In this paper, a large number of data sets are used to verify the proposed data augmentation method. They are the gas pipeline industrial data set proposed by Mississippi State University in 2014 and the TON_IoT (UNSW-IoT20) data set collected from a real large-scale network of the University of New South Wales and the Australian Defence College in 2020. It includes network data sets, Linux data sets and Windows data sets.
In 2014, Mississippi State University provided the gas pipeline standard industrial data set. In recent years, it has been widely used in simulation experiments of ICS intrusion detection. The system was collected from a set of natural gas pipeline systems based on Modbus tcp, and its structure is similar to the data acquisition and monitoring control system in the real production environment. The gas pipeline data set contains normal data and seven types of attack data. See Table 1 for details.
TON_IoT includes Linux operating system data, Windows operating system logs and IoT network traffic. TON_IoT is represented in CSV format.
TON_IoT network data set: The network TON_IoT data set contains 44 attributes, and each data point has a label classified as normal or attack. Table 2 shows the statistical data of network data samples in the TON_IoT data set.
TON_IoT Linux data set: The Linux data set is divided into three categories: disk, memory and process. The first CSV file contains the properties of normal behavior and attack disk usage. The second CSV file is related to memory activity and contains 11 attributes, a tag column marked as normal or attacked and an attack type column containing attack types. The last file belongs to the process in the Linux operating system. Table 3 shows the statistics recorded on the TON_IoT Linux process data set.

4.2. Data Preprocessing

The data preprocessing stage mainly includes low variance filtering, normalization and single-hot coding. In the preprocessing stage, the above method is used to remove irrelevant data, which provides more effective data for the detection of subsequent algorithms.

4.2.1. Gas Pipeline Industrial Data Set

The data set is complex and variable, with many eigenvalues, but not every eigenvalue is well distinguished, that is, it has a very low variance. Such eigenvalues have no analytical value, so we chose to remove them directly. For example, if a feature in a column accounts for 95% of the instance value of all input samples, it can be considered not very useful. If 100% is 1, then this feature is meaningless. Nine feature columns with the smallest variance were selected, and finally a data set with 17-dimensional effective eigenvalues was obtained.
The classifier cannot directly process the unordered discrete features of the gas pipeline data set. Using one-hot coding, a mapping table was established for discrete feature data to make it ordered and continuous. The data set has eight classification results, as shown in Equation (3), including Normal (0), NMRI (1), CMRI (2), MSCI (3), MPCI (4), MFCI (5), DOS (6) and Recon (7). They can be encoded as (1, 0, 0, 0, 0, 0, 0, 0), (0, 1, 0, 0, 0, 0, 0, 0), (0, 0, 1, 0, 0, 0, 0, 0), (0, 0, 0, 1, 0, 0, 0, 0), (0, 0, 0, 0, 1, 0, 0, 0), (0, 0, 0, 0, 0, 1, 0, 0), (01, 0, 0, 0, 0, 0, 1, 0) and (0, 0, 0, 0, 0, 0, 0, 1).
O n e h o t   e n c o d i n g = 1 ,   0 ,   0 ,   0 ,   0 ,   0 ,   0 ,   0 ,     i f   t h e   r e s u l t   i s   N o r m a l 0 . 0 ,     1 ,   0 ,   0 ,   0 ,   0 ,   0 ,   0 ,     i f   t h e   r e s u l t   i s   N M R I 1 . 0 ,   0 ,   1 ,   0 ,   0 ,   0 ,   0 ,   0 ,     i f   t h e   r e s u l t   i s   C M R I 2 . 0 ,     0 ,   0 ,   1 ,   0 ,   0 ,   0 ,   0 ,     i f   t h e   r e s u l t   i s   M S C I 3 . 0 ,     0 ,   0 ,   0 ,   1 ,   0 ,   0 ,   0 ,     i f   t h e   r e s u l t   i s   M P C I 4 . 0 ,     0 ,   0 ,   0 ,   0 ,   1 ,   0 ,   0 ,     i f   t h e   r e s u l t   i s   M F C I 5 . 0 ,     0 ,   0 ,   0 ,   0 ,   0 ,   1 ,   0 ,     i f   t h e   r e s u l t   i s   D O S 6 . 0 ,     0 ,   0 ,   0 ,   0 ,   0 ,   0 ,   1 ,     i f   t h e   r e s u l t   i s   R e c o n 7 .

4.2.2. TON_IoT (UNSW-IoT20) Data Set

In the ToN_IoT data set, missing values must be filled and attributes that lead to overfitting must be deleted.
  • Missing value filling. Missing values are common in ToN_IoT, and these missing values must be handled appropriately. In the proposed model, the imputation of missing values is replaced by the most frequent value in each feature containing missing data.
  • Delete the attributes that cause overfitting. Multiple attributes such as timestamp, IP address, source port and target port in the data set are deleted because they may cause overfitting.

4.3. Evaluation Indicators of Intrusion Detection

Intrusion detection has different indicators to evaluate the results obtained. Among these metrics, the most commonly used are accuracy, precision, recall and F1. A common way to present these concepts is the cross-list between the class predicted by the model and the actual class. This table is called the confusion matrix. The confusion matrix is a 2D matrix used to visualize the prediction of the classification model of the test label data set. Table 4 shows the confusion matrix. True negative (TN) indicates the number of benign samples correctly classified as benign, true positive (TP) indicates the number of malicious samples misclassified as malicious, false negative (FN) indicates the number of benign samples misclassified as malicious and false positive (FP) indicates the number of malicious samples misclassified as benign.
A c c u r a c y = T N + T P T P + F P + T N + T P
The precision, also known as the precision rate, aims to predict how many of the positive results are correct, that is, how many are true positive, as shown in Formula (5).
P r e c i s i o n = T P T P + F P
Recall, also known as the recall rate, aims to find out how many of the samples that are actually positive are predicted to be positive, that is, how many predictions are correct for all the actual categories that are positive, as shown in Formula (6).
R e c a l l = T P F N + T P
Precision and the recall index sometimes appear to be contradictory, so they need to be evaluated. The most common method for this is F1. F1 is an evaluation index that can reflect both the accuracy and recall rate, as shown in Formula (7). F1 combines the results of precision and recall rate. When F1 is higher, it can show that the test method is more effective.
F 1 = 2 T P 2 T P + F P + F N

4.4. Analysis of Experimental Results

In this paper, all experiments were implemented in Python 3.6 and Keras 2.10.0. The experiments were performed on a machine with Intel Core i7-9700H CPU, NVIDIA GeForce GTX745 GPU.

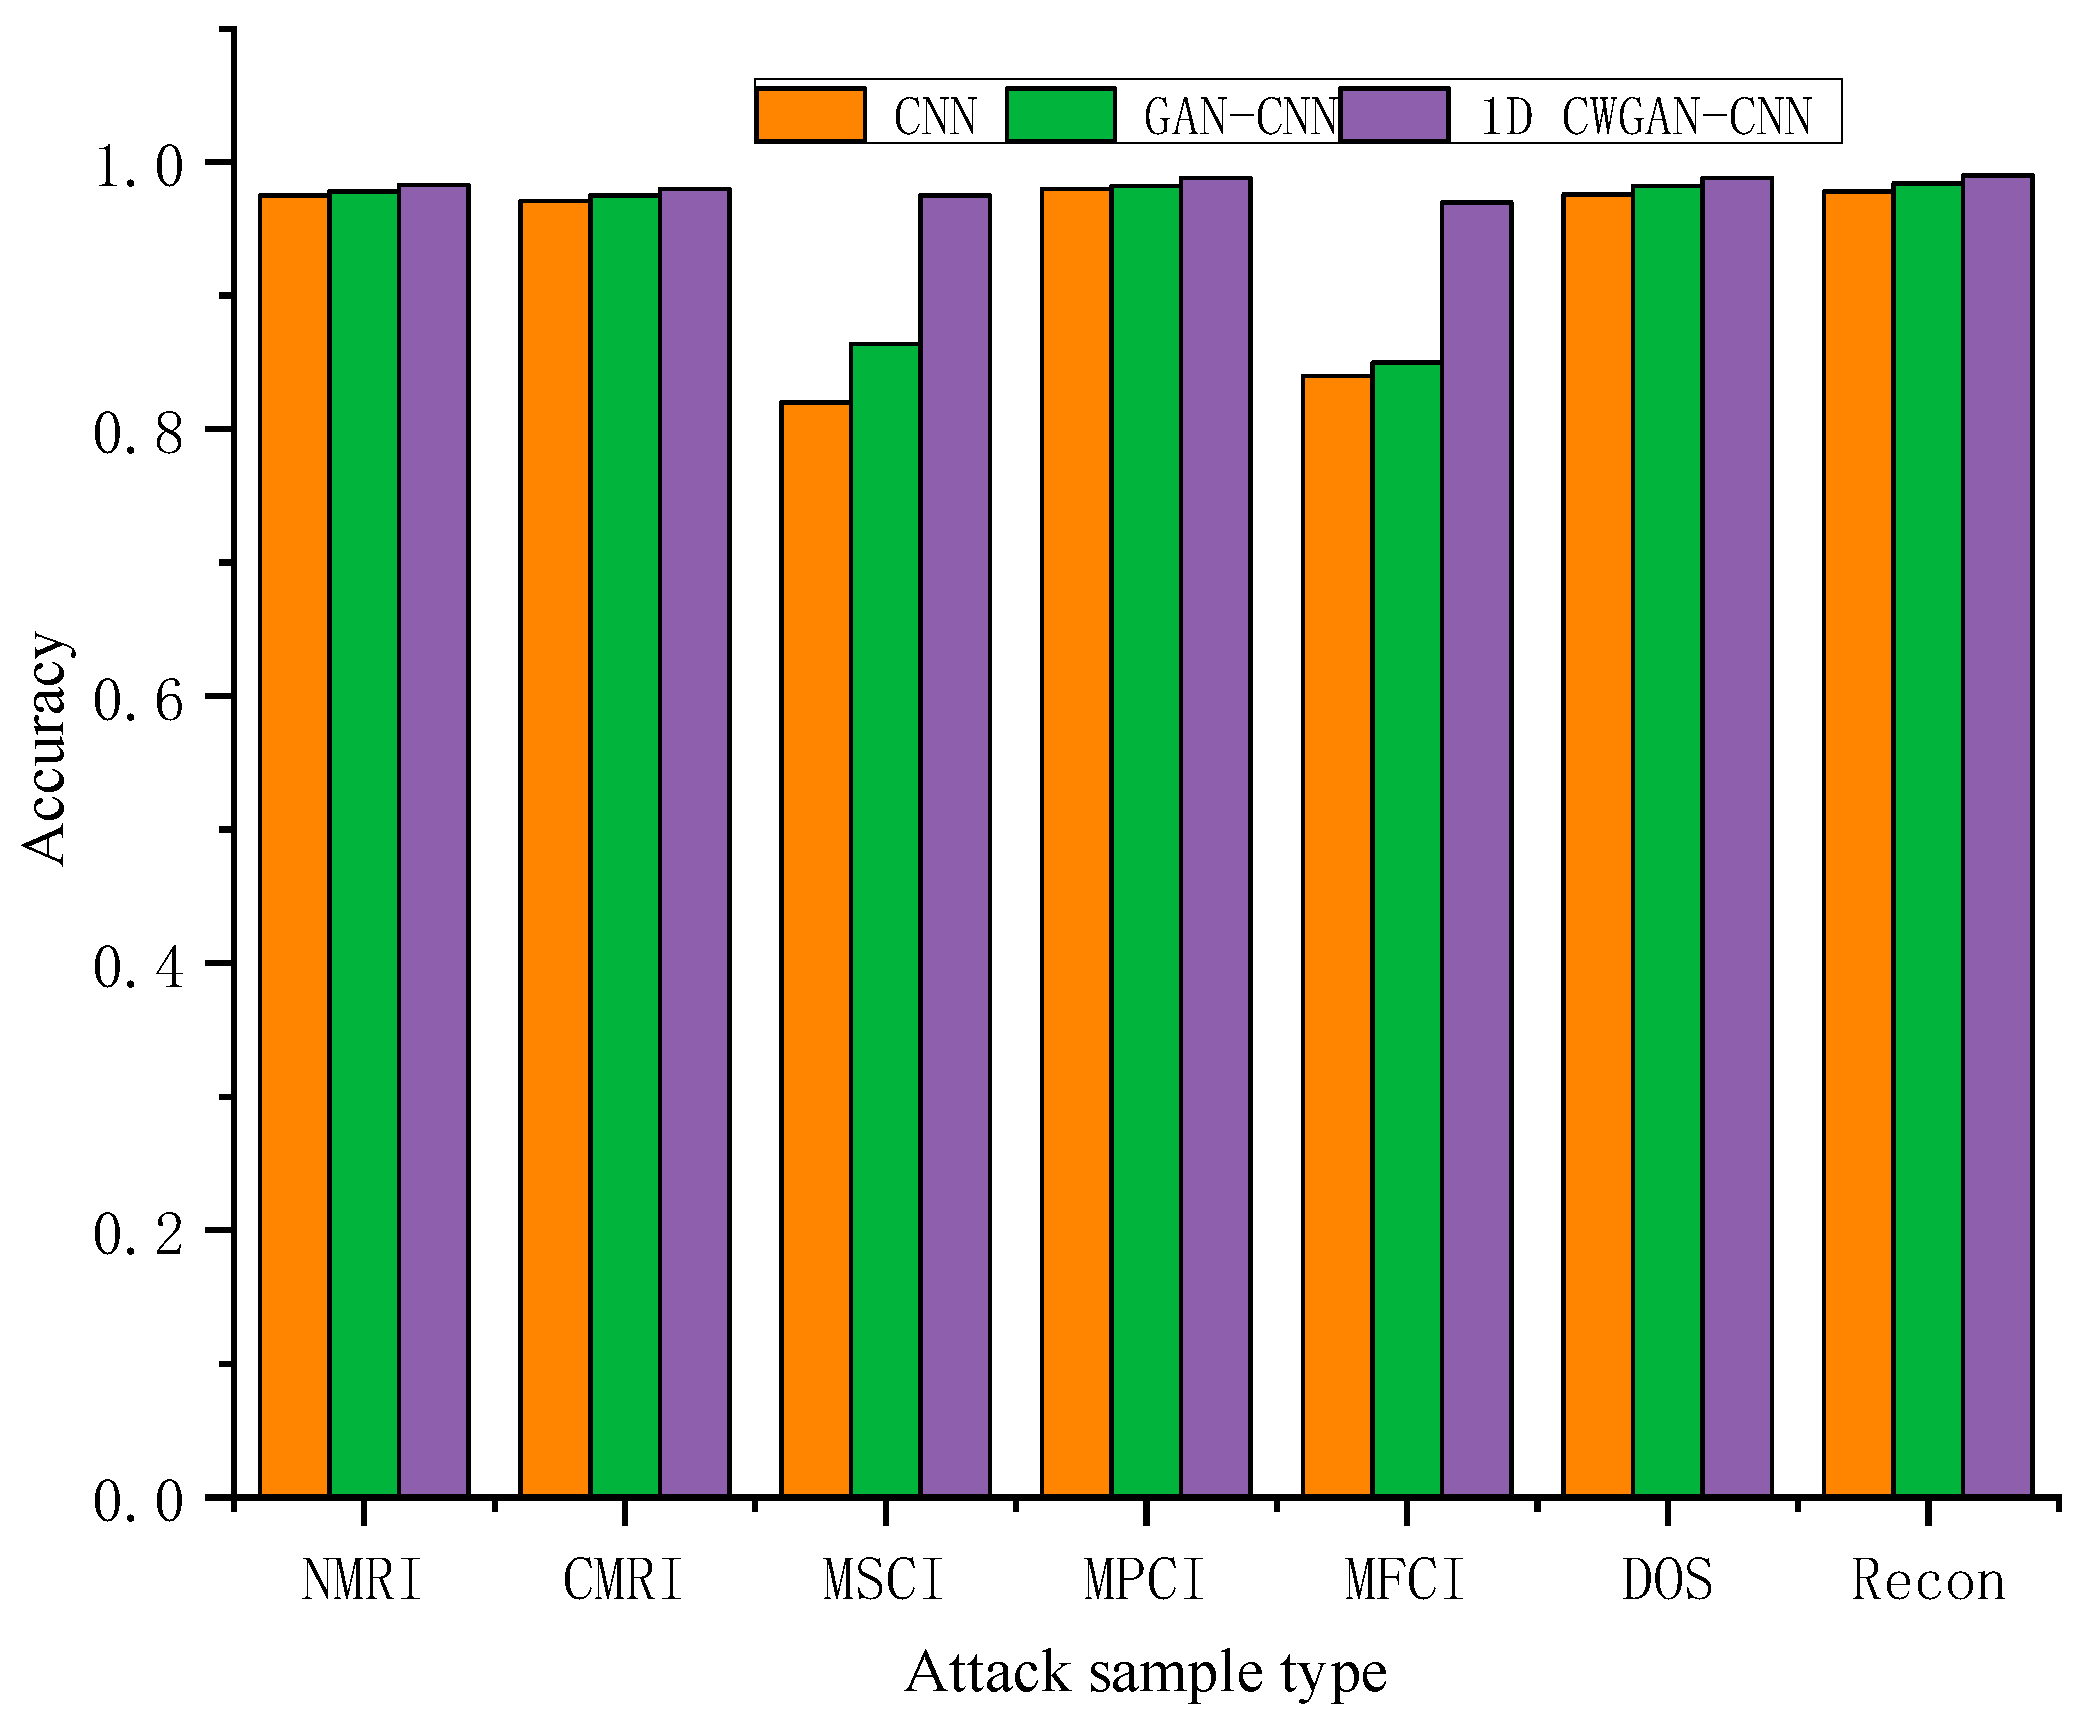
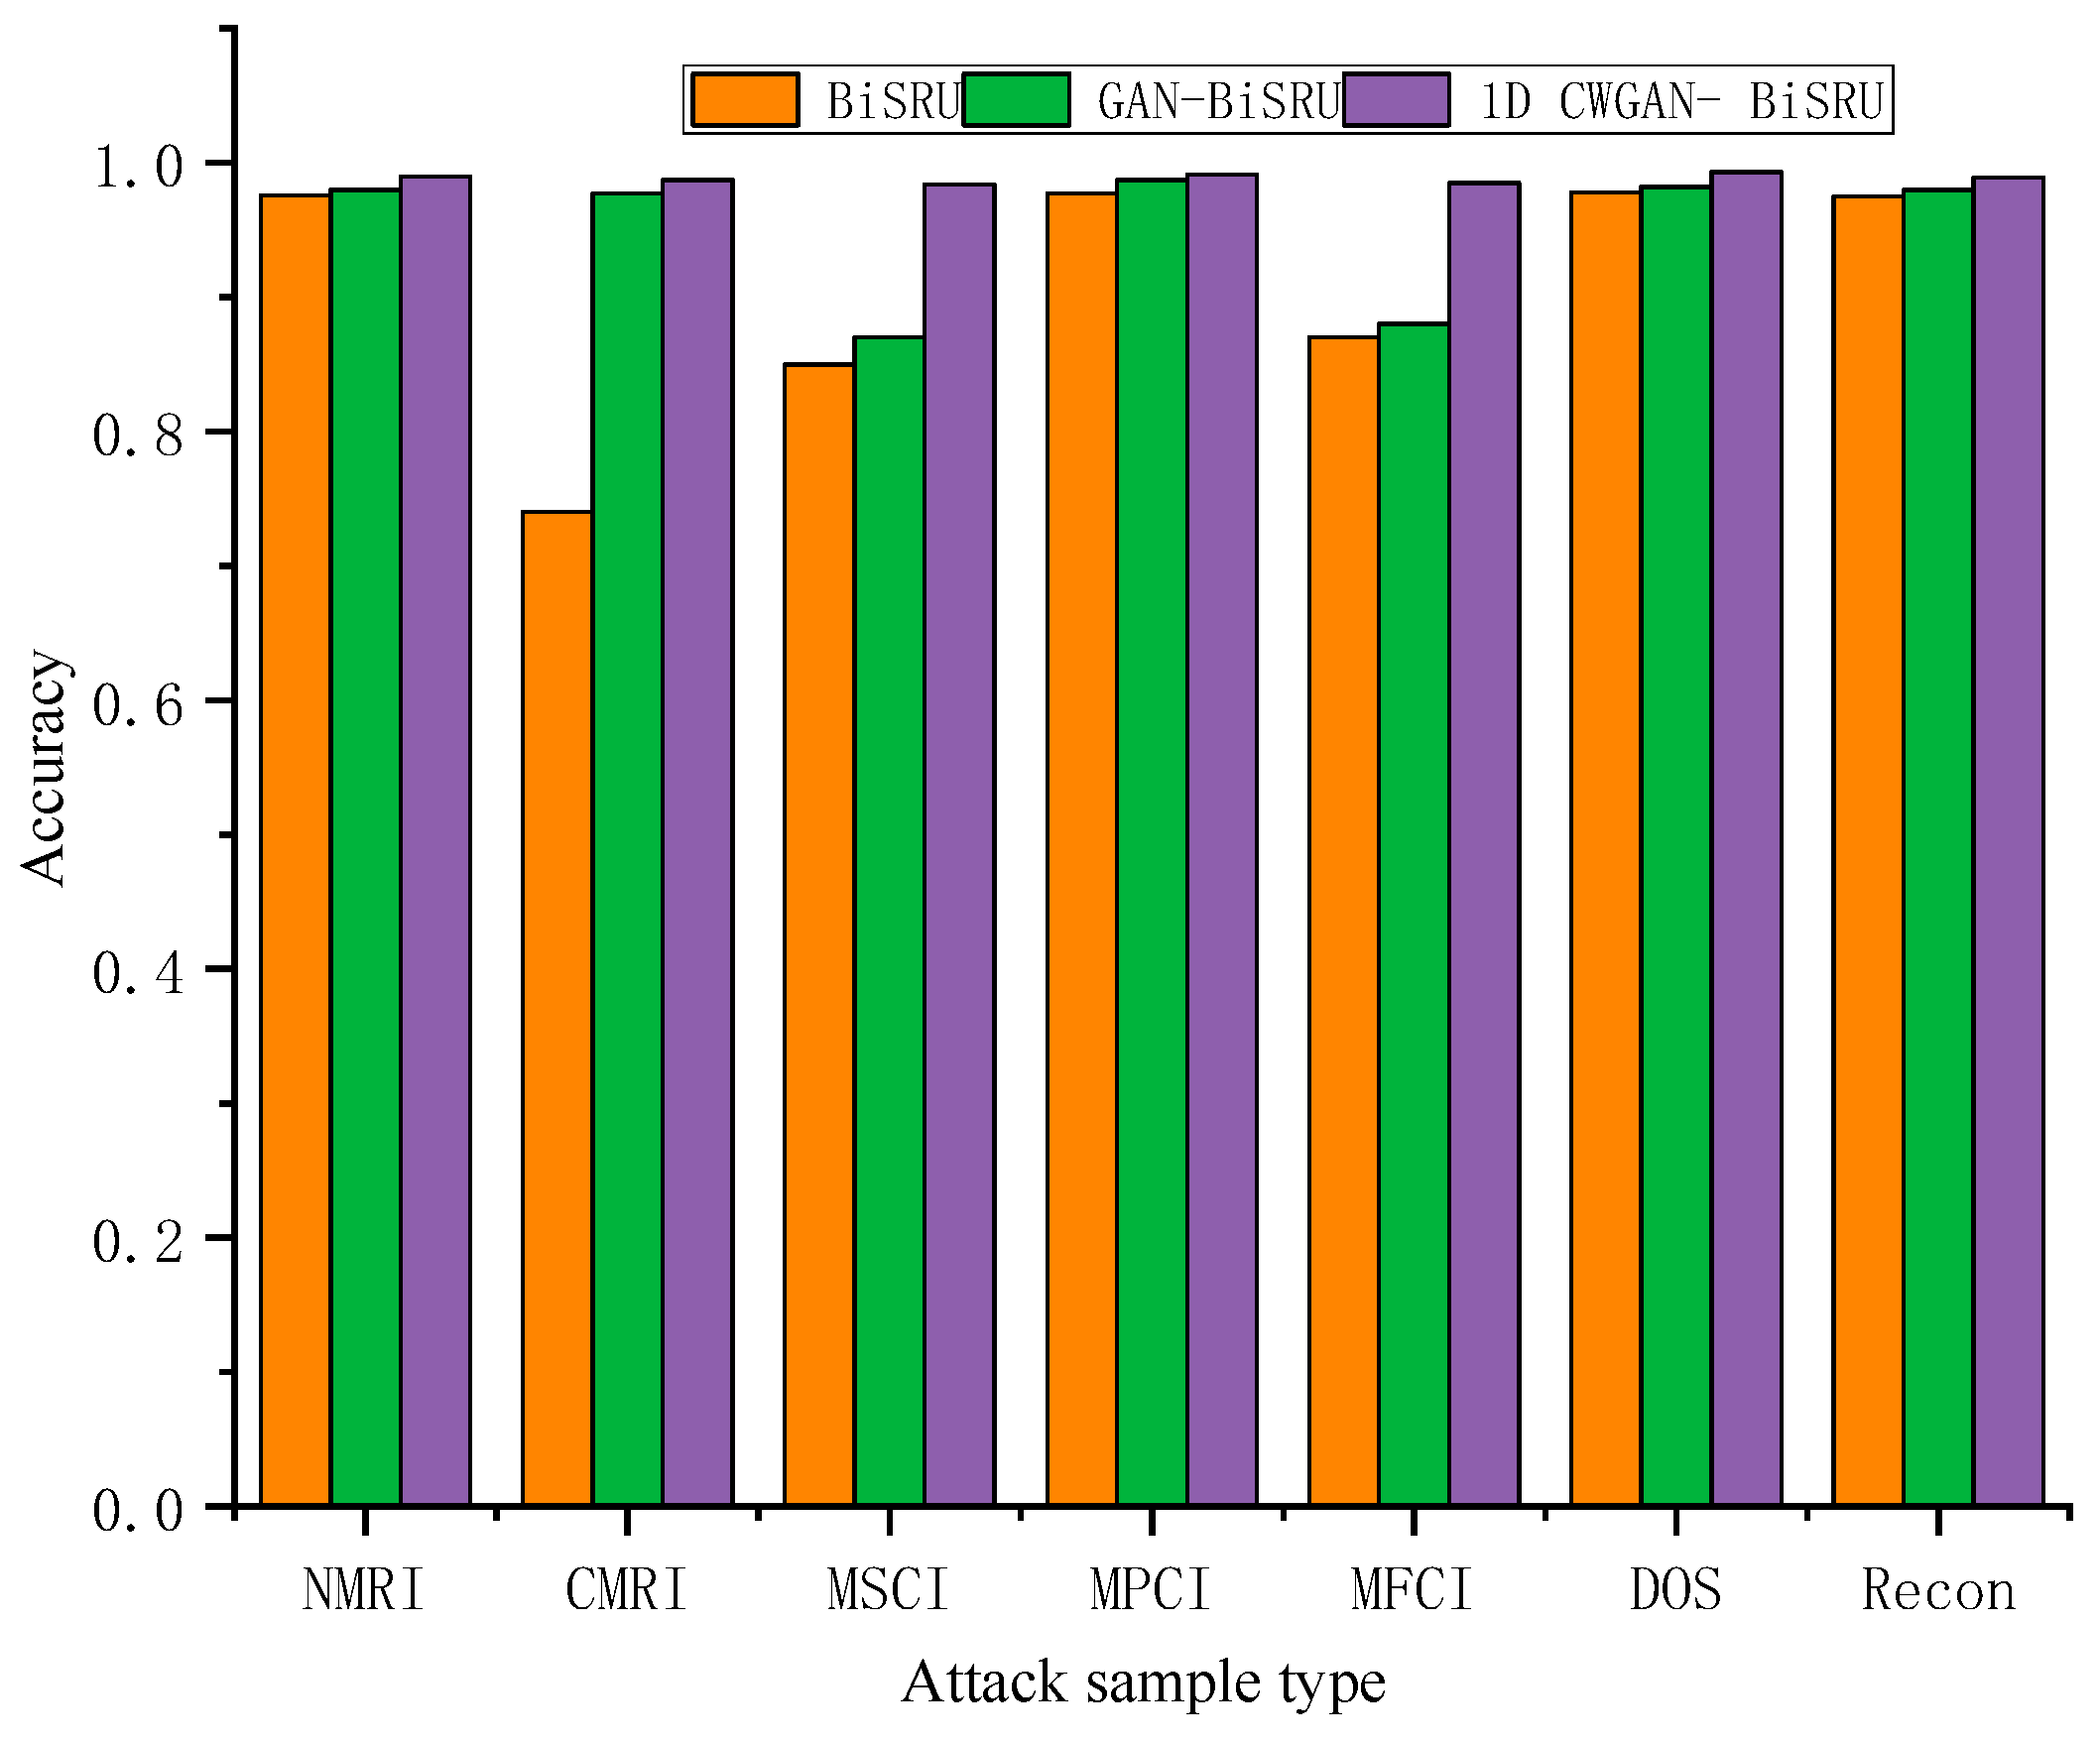
4.4.1. Verify the Gas Pipeline Data Set

This section first verifies the gas pipeline data set released by Mississippi State University in 2014, and the detailed information of the gas pipeline data set is described in the previous section. Firstly, the virtual samples of two minority classes MSCI and MFCI in the gas pipeline data set are generated, so that the amount of data of different classes in the training set is balanced. The specific number of generated samples is shown in Table 5. In order to evaluate the performance of the 1D CWGAN, experiments were carried out using 10,000 samples from the gas pipeline data set sample, of which 1250 samples were of all types. The ratio of training set to test set is 8:2.
In order to verify the superiority of the data enhancement method based on the 1D CWGAN in the gas pipeline data set, a CNN and BiSRU were selected as the experimental baseline methods. Previous studies used the traditional data replicator GAN method to deal with unbalanced data, and this study used the 1D CWGAN method to generate minority samples. In order to further illustrate the superiority of the performance of the model in this paper, the original training set, the GAN enhanced data set and the 1D CWGAN enhanced data set were sent to the CNN classifier and the BiSRU classifier for testing.
It can be seen from the analysis of the data in Table 6 that although the CNN and BiSRU have achieved high accuracy on the gas pipeline data set, the F1 score is low, and the F1 score is improved after using the GAN algorithm to generate a small number of samples. It shows that the CNN and BiSRU methods cannot handle class-imbalanced data well alone. The 1D CWGAN unbalanced sample generation method proposed in this study significantly improves the classification performance of the CNN and BiSRU. For the CNN, after data balancing, the accuracy rate is increased by 0.75%, and the accuracy, recall rate and F1 are improved. Compared with the BiSRU without data processing, the accuracy of the 1D CWGAN-BiSRU is increased by 1.34%, and the accuracy, recall and F1 are increased by 7.2%, 3.46% and 5.29%, respectively. In contrast, the data augmentation method proposed in this paper obtains the highest F1 score on each classifier, showing better performance than the GAN.
The experiment compares the classification performance of the model directly using CNN classification without data enhancement with the GAN-CNN model based on GAN data enhancement and the 1D CWGAN-CNN model based on 1D CWGAN data enhancement. It can be seen that the 1D CWGAN-CNN model has better performance than the single CNN model and the GAN-CNN model after data enhancement. As shown in Figure 2, accuracy is the ratio of well-classified data to total data, so the accuracy of all categories is significantly improved. In particular, after the data augmentation of MSCI and MFCI minority classes, the performance of a few attack classes is the same as that of normal classes. As shown in Figure 3, the same verification with the BiSRU model also shows that the data augmentation method proposed in this study understands more about the characteristics of a few attacks.

4.4.2. Verify the TON_IoT Network Data Set

This section next verifies the TON_IoT (UNSW-IoT20) network data set jointly published by the University of New South Wales and the Australian Defence College. The details of the network data set are described in the previous section. First, a small number of mitm samples in the network data set are generated to balance the amount of data in different categories in the training set. The specific number of generated samples is shown in Table 7. In order to evaluate the performance of the 1D CWGAN, the experiment used 20,000 samples in the TON_IoT data set, of which 2000 samples were of all types. The ratio of training set to test set is 8:2.
In order to verify the superiority of the data enhancement method based on the 1D CWGAN in the TON_IoT (UNSW-IoT20) network data set, a CNN and BiSRU were selected as the experimental baseline methods. Previous studies used the traditional data replicator GAN method to generate minority samples, and this study used the 1D CWGAN method to generate minority samples. In order to further illustrate the superiority of the performance of the model in this paper, the original training set, the GAN enhanced data set and the 1D CWGAN enhanced data set were sent to the CNN classifier and the BiSRU classifier for testing.
The analysis of the data in Table 8 shows that although the CNN and BiSRU have achieved high accuracy on the TON_IoT network data set, the F1 score is low, and the F1 score is improved after using the GAN algorithm to generate a small number of samples. It shows that the CNN and BiSRU methods cannot handle class-imbalanced data well alone. The 1D CWGAN unbalanced sample generation method proposed in this study significantly improves the classification performance of the CNN and BiSRU. For the CNN, after data balancing, the accuracy rate is increased by 4.63%, and the accuracy, recall rate and F1 are improved. Compared with the BiSRU without data processing, the accuracy of the 1D CWGAN-BiSRU is increased by 5.28%. In contrast, the data augmentation method proposed in this paper obtains the highest F1 score on each classifier, showing better performance than the GAN.
The experiment also compares the classification performance of the model that directly uses CNN classification without data enhancement with the GAN-CNN model based on GAN data enhancement and the 1D CWGAN-CNN model based on 1D CWGAN data enhancement. It can be seen that the performance of the 1D CWGAN-CNN model is better than that of the single CNN model and the GAN-CNN model after data enhancement. As shown in Figure 4, accuracy is the ratio of well-classified data to total data, so the accuracy of all categories is significantly improved. In particular, after data augmentation of the mitm minority class, the performance of the minority attack class is the same as that of the normal class. As shown in Figure 5, the same verification with the BiSRU model also shows that the data augmentation method proposed in this study understands more about the characteristics of a few attacks.

4.4.3. Verify the TON_IoT Linux Process Data Set

This section next verifies the TON_IoT (UNSW-IoT20) Linux process data set jointly released by the University of New South Wales and the Australian National Defense College. Firstly, a small number of mitm samples in the Linux process data set are generated, so that the amount of data in different categories in the training set is balanced. The specific number of generated samples is shown in Table 9. In order to evaluate the performance of 1D CWGAN, experiments were performed using 10,000 samples from the TON_IoT (UNSW-IoT20) Linux process data set sample, of which all kinds of samples were 1250. The ratio of training set to test set is 8:2.
In order to verify the superiority of the data enhancement method based on 1D CWGAN in the TON_IoT (UNSW-IoT20) Linux process data set. CNN and BiSRU were also selected as the experimental baseline methods. Previous studies used the traditional data replicator GAN method to generate minority samples, and this study used the 1D CWGAN method to generate minority samples. In order to further illustrate the superiority of the performance of the model in this paper, the original training set, the GAN enhanced data set and the 1D CWGAN enhanced data set are sent to the CNN classifier and the BiSRU classifier for testing.
It can be seen from the analysis of the data in Table 10 that although CNN and BiSRU have achieved high accuracy on the Linux process data set, the F1 score is low, and the F1 score is improved after using the GAN algorithm to generate a few samples. It shows that the CNN and BiSRU methods cannot handle class-imbalanced data well alone. The 1D CWGAN unbalanced sample generation method proposed in this study significantly improves the classification performance of CNN and BiSRU. For CNN, after data balancing, the accuracy rate is increased by 4.66%, and the accuracy, recall rate and F1 are improved. Compared with BiSRU without data processing, the accuracy of 1D CWGAN-BiSRU is improved by 4.33%. In contrast, the data augmentation method proposed in this paper obtains the highest F1 score on each classifier, showing better performance than GAN.
The experiment also compares the classification performance of the model that directly uses CNN classification without data enhancement with the GAN-CNN model based on GAN data enhancement and the 1D CWGAN-CNN model based on 1D CWGAN data enhancement. It can be seen that the 1D CWGAN-CNN model has better performance than the single CNN model and the GAN-CNN model after data enhancement. As shown in Figure 6, accuracy is the ratio of well-classified data to total data, so the accuracy of all categories is significantly improved. In particular, after data augmentation of the mitm minority class, the performance of the minority attack class is the same as that of the normal class. As shown in Figure 7, the same verification with the BiSRU model also shows that the data augmentation method proposed in this study understands more about the characteristics of a few attacks.

5. Conclusions

Aiming at the existing problems in the research topic of industrial control network intrusion detection, this paper proposes a network traffic data enhancement model based on a 1D CWGAN, which solves the problem of unbalanced traffic data categories in the field of ICS network intrusion detection. A generator and discriminator based on the 1D CWGAN model are constructed by using a 1D CNN and a 1D transposed CNN, and a WGAN neural network with a GP term is used to expand network traffic data samples. The verification experiment was carried out on a large number of industrial data sets. The experimental results show that the ICS intrusion detection model based on the 1D CWGAN has achieved good results. Although this method has potential applications in industrial control system intrusion detection, it also has some shortcomings. First, like any other generation model, this method can introduce noise into the data set, so additional processing will be needed to mitigate the effects of noise in future work. In addition, in order to find the best hyperparameter configuration, it is often necessary to conduct multiple trials and adjustments, which also increases the training time. In future research, we will carry out more in-depth theoretical research to optimize the algorithm and hardware, speed up its training and convergence process, and improve the computational efficiency of the model to meet the real-time requirements of industrial control systems. In addition, interpretive artificial intelligence techniques, such as interpretable machine learning models or visualization tools, can be introduced to improve the interpretability of methods.

Author Contributions

Conceptualization, Z.C. and H.D.; methodology, Z.C. and H.D.; validation, H.W. and J.Z.; data curation, Y.S. and P.L. All authors have read and agreed to the published version of the manuscript.

Funding

This research was funded by the National Natural Science Foundation of China (No. 62072416), the Key Research and Development Special Project of Henan Province (221111210500), and the Key Technologies R&D Program of Henan Province (232102211053, 222102210170, 222102210322).

Data Availability Statement

Data are contained within the article.

Conflicts of Interest

The authors declare no conflict of interest.

References

  1. Altunay, H.C.; Albayrak, Z.; Özalp, A.N.; Çakmak, M. Analysis of Anomaly Detection Approaches Performed Through Deep Learning Methods in SCADA Systems. In Proceedings of the 2021 3rd International Congress on Human-Computer Interaction, Optimization and Robotic Applications (HORA), Ankara, Turkey, 11–13 June 2021; pp. 1–6. [Google Scholar]
  2. Balla, A.; Habaebi, M.H.; Elsheikh, E.A.; Islam, M.R.; Suliman, F.M. The Effect of Dataset Imbalance on the Performance of SCADA Intrusion Detection Systems. Sensors 2023, 23, 758. [Google Scholar] [CrossRef] [PubMed]
  3. Dusan, N.; Zivana, J. CNN based Method for the Development of Cyber-Attacks Detection Algorithms in Industrial Control Systems. Comput. Secur. 2022, 114, 102585. [Google Scholar]
  4. Qian, J.; Du, X.; Chen, B.; Qu, B.; Zeng, K.; Liu, J. Cyber-Physical Integrated Intrusion Detection Scheme in SCADA System of Process Manufacturing Industry. IEEE Access 2020, 8, 147471–147481. [Google Scholar] [CrossRef]
  5. Shen, C.; Liu, C.; Tan, H.; Wang, Z.; Xu, D.; Su, X. Hybrid-Augmented Device Fingerprinting for Intrusion Detection in Industrial Control System Networks. IEEE Wirel. Commun. 2018, 25, 26–31. [Google Scholar] [CrossRef]
  6. Jamoos, M.; Mora, A.M.; AlKhanafseh, M.; Surakhi, O. A New Data-Balancing Approach Based on Generative Adversarial Network for Network Intrusion Detection System. Electronics 2023, 12, 2851. [Google Scholar] [CrossRef]
  7. Reddy, R.R.; Ramadevi, Y.; Sunitha, K.V.N. Effective discriminant function for intrusion detection using SVM. In Proceedings of the International Conference on Advances in Computing, Communications and Informatics (ICACCI), Jaipur, India, 21–24 September 2016; pp. 1148–1153. [Google Scholar]
  8. Moon, D.; Im, H.; Kim, I.; Park, J.H. DTB-IDS: An intrusion detection system based on decision tree using behavior analysis for preventing APT attacks. J. Supercomput. 2017, 73, 2881–2895. [Google Scholar] [CrossRef]
  9. Mughal, M.O.; Kim, S. Signal classification and jamming detection in wide-band radios using Nave Bayes classifier. IEEE Commun. Lett. 2018, 22, 1398–1401. [Google Scholar] [CrossRef]
  10. Anton, S.D.D.; Sinha, S.; Schotten, H.D. Anomaly-based intrusion detection in industrial data with SVM and Random Forests. In Proceedings of the 27th International Conference on Software, Telecommunications and Computer Networks (SOFTCOM), Split, Croatia, 19–21 September 2019; pp. 465–470. [Google Scholar]
  11. Al-Asiri, M.; El-Alfy, E.-S.M. On Using Physical Based Intrusion Detection in SCADA Systems. Procedia Comput. Sci. 2020, 170, 34–42. [Google Scholar] [CrossRef]
  12. Khan, A.A.Z.; Serpen, G. Misuse intrusion detection using machine learning for Gas Pipeline SCADA networks. In Proceedings of the International Conference on Security and Management (SAM), Las Vegas, NV, USA, 29 July–1 August 2019; pp. 84–90. [Google Scholar]
  13. Tian, Q.; Li, J.; Liu, H. A Method for Guaranteeing Wireless Communication Based on a Combination of Deep and Shallow Learning. IEEE Access 2019, 7, 38688–38695. [Google Scholar] [CrossRef]
  14. Ding, P.; Li, J.; Wen, M.; Wang, L.; Li, H. Efficient BiSRU Combined with Feature Dimensionality Reduction for Abnormal Traffic Detection. IEEE Access 2020, 8, 164414–164427. [Google Scholar] [CrossRef]
  15. Mubarak, S.; Habaebi, M.H.; Islam, M.R.; Balla, A.; Tahir, M.; Elsheikh, A.; Suliman, F.M. Industrial Datasets with ICS Testbed and Attack Detection Using Machine Learning Techniques. Intell. Autom. Soft Comput. 2022, 31, 1345–1360. [Google Scholar] [CrossRef]
  16. Mubarak, S.; Habaebi, M.H.; Islam, M.R.; Rahman FD, A.; Tahir, M. Anomaly Detection in ICS Datasets with Machine Learning Algorithms. Comput. Syst. Sci. Eng. 2021, 37, 014384. [Google Scholar] [CrossRef]
  17. Liao, X.; Li, K.; Zhu, X.; Liu, K.J.R. Robust Detection of Image Operator Chain with Two-Stream Convolutional Neural Network. IEEE J. Sel. Top. Signal Process. 2020, 14, 955–968. [Google Scholar] [CrossRef]
  18. Yang, H.; Cheng, L.; Chuah, M. Deep-learning-based network intrusion detection for SCADA Systems. In Proceedings of the IEEE Conference on Communications and Network Security (CNS), Washington, DC, USA, 10–12 June 2019; pp. 1–7. [Google Scholar]
  19. Liu, J.; Yin, L.; Hu, Y.; Lv, S.; Sun, L. A novel intrusion detection algorithm for industrial control systems based on CNN and process state transition. In Proceedings of the 37th International Performance Computing and Communications Conference (IPCCC), Orlando, FL, USA, 17–19 November 2018; pp. 1–8. [Google Scholar]
  20. Yin, C.; Zhu, Y.; Fei, J.; He, X. A deep learning approach for intrusion detection using recurrent neural network. IEEE Access 2017, 5, 21954–21961. [Google Scholar] [CrossRef]
  21. Roy, B.; Cheung, H. A deep learning approach for intrusion detection in internet of things using bi-directional long short-term memory recurrent neural network. In Proceedings of the 28th International Telecommunication Networks and Applications Conference (ITNAC), Sydney, NSW, Australia, 21–23 November 2018; pp. 57–62. [Google Scholar]
  22. Sokolov, A.N.; Alabugin, S.K.; Pyatnitsky, I.A. Traffic modeling by recurrent neural networks for intrusion detection in industrial control systems. In Proceedings of the International Conference on Industrial Engineering, Applications and Manufacturing (ICIEAM), Sochi, Russia, 25–29 March 2019; pp. 1–5. [Google Scholar]
  23. Lei, T.; Zhang, Y.; Wang, S.I.; Dai, H.; Artzi, Y. Simple recurrent units for highly parallelizable recurrence. In Proceedings of the Conference on Empirical Methods in Natural Language Processing (EMNLP), Brussels, Belgium, 31 October–4 November 2018; pp. 4470–4481. [Google Scholar]
  24. Alotaibi, A.; Rassam, M.A. Enhancing the Sustainability of Deep-Learning-Based Network Intrusion Detection Classifiers against Adversarial Attacks. Sustainability 2023, 15, 9801. [Google Scholar] [CrossRef]
  25. Mari, A.G.; Zinca, D.; Dobrota, V. Development of a Machine-Learning Intrusion Detection System and Testing of Its Performance Using a Generative Adversarial Network. Sensors 2023, 23, 1315. [Google Scholar] [CrossRef] [PubMed]
  26. Du, P.H.; Nguyen, H.N. APELID: Enhancing real-time intrusion detection with augmented WGAN and parallel ensemble learning. Comput. Secur. 2024, 136, 103567. [Google Scholar]
  27. Ling, J.; Zhu, Z.H.; Luo, Y.; Wang, H. An intrusion detection method for industrial control systems based on bidirectional simple recurrent unit. Comput. Electr. Eng. 2021, 91, 107049. [Google Scholar] [CrossRef]
Figure 1. Schematic diagram of the 1D-CWGAN-based intrusion detection model framework.
Electronics 12 04653 g001
Figure 2. Comparison of attack sample recognition accuracy based on CNN model.
Electronics 12 04653 g002
Figure 3. Comparison of attack sample recognition accuracy based on BiSRU model.
Electronics 12 04653 g003
Figure 4. Comparison of attack sample recognition accuracy based on CNN model.
Electronics 12 04653 g004
Figure 5. Comparison of attack sample recognition accuracy based on BiSRU model.
Electronics 12 04653 g005
Figure 6. Comparison of attack sample recognition accuracy based on CNN model.
Electronics 12 04653 g006
Figure 7. Comparison of attack sample recognition accuracy based on BiSRU model.
Electronics 12 04653 g007
Table 1. Description of data sets.
Attack TypeDescribeNumber
NormalNormal (0)61,156
Naïve malicious response injectionNMRI (1)2763
Complex malicious response injectionCMRI (2)15,466
Malicious state command injectionMSCI (3)782
Malicious parameter command injectionMPCI (4)7637
Malicious function code injectionMFCI (5)573
Denial of serviceDOS (6)1837
ReconnaissanceRecon (7)6805
Table 2. Statistical records of TON_IoT network data sets.
Attack TypeNormalDoSRansomwarePasswordScanning
Number300,00020,00020,00020,00020,000
Attack typeInjectionDDoSbackdoorXSSmitm
Number20,00020,00020,00020,0001043
Table 3. Statistical records of TON_IoT Linux process data sets.
Attack TypeNormalDoSPasswordScanning
Number100,00010,00010,00010,000
Attack typeInjectionDDoSXSSmitm
Number10,00010,00010,000112
Table 4. Confusion matrix.
Predictive Value = 1Predictive Value = 0
True value = 1TPFN
True value = 0FPTN
Table 5. The number of samples generated by the training set.
Attack TypesNormalNMRICMRIMSCIMPCIMFCIDOSRecon
Number of original samples61,156276315,466782763757318376805
Number of samples generated000468067700
Total61,156276315,46612507637125018376805
Table 6. Performance of different algorithms.
MethodAccuracy (%)Precision (%)Recall (%)F1(%)
CNN [27]97.5890.4289.9790.30
BiSRU [14]97.6690.7890.4490.61
GAN-CNN97.8591.1492.6791.90
GAN-BiSRU98.0193.3493.0893.21
1D CWGAN-CNN98.3393.3493.0893.19
1D CWGAN-BiSRU99.0097.9093.9095.90
Table 7. The number of samples generated by the training set.
Attack TypesNormalScanningInjectionDDoSMitm
Number of original samples300,00020,00020,00020,0001043
Number of samples generated0000957
Total300,00020,00020,00020,00020,000
Attack TypesRansomwareDOSXSSPasswordBackdoor
Number of original samples20,00020,00020,00020,00020,000
Number of samples generated0067700
Total20,00020,00020,00020,00020,000
Table 8. Performance of different algorithms.
MethodAccuracy (%)Precision (%)Recall (%)F1 (%)
CNN [27]92.7684.4284.6684.54
BiSRU [14]92.8484.7884.5484.66
GAN-CNN94.8987.1487.7487.44
GAN-BiSRU95.7688.3488.2188.27
1D CWGAN-CNN97.3990.3490.4590.39
1D CWGAN-BiSRU98.1292.9091.5492.21
Table 9. The number of samples generated by the training set.
Attack TypesNormalScanningInjectionDDoS
Number of original samples60,11210,00010,00010,000
Attack TypesMitmDOSXSSPassword
Number of original samples11210,00010,00010,000
Table 10. Performance of different algorithms.
MethodAccuracy (%)Precision (%)Recall (%)F1 (%)
CNN [27]92.5484.2283.1483.68
BiSRU [14]92.8784.5484.1884.98
GAN-CNN94.6587.8787.5487.70
GAN-BiSRU95.5488.0188.2188.11
1D CWGAN-CNN97.7890.5490.4190.47
1D CWGAN-BiSRU97.2092.4591.7692.10
Disclaimer/Publisher’s Note: The statements, opinions and data contained in all publications are solely those of the individual author(s) and contributor(s) and not of MDPI and/or the editor(s). MDPI and/or the editor(s) disclaim responsibility for any injury to people or property resulting from any ideas, methods, instructions or products referred to in the content.

