Abstract
In recent years, deep neural networks have shown superior performance in various fields, but interpretability has always been the Achilles’ heel of deep neural networks. The existing visual interpretation methods for deep neural networks still suffer from inaccurate and insufficient target localization and low-resolution saliency maps. To address the above issues, this paper presents a saliency map generation method based on image geometry augmentation and super-resolution called augmented high-order gradient weighting class activation mapping (augmented grad-CAM++). Unlike previous approaches that rely on a single input image to generate saliency maps, this method first introduces the image geometry augmentation technique to create a set of augmented images for the input image and generate activation mappings separately. Secondly, the augmented activation mappings are combined to form the final saliency map. Finally, a super-resolution technique is introduced to add pixel points to reconstruct the saliency map pixels to improve the resolution of the saliency map. The proposed method is applied to analyze standard image data and industrial surface defect images. The results indicate that, in experiments conducted on standard image data, the proposed method achieved a 3.1% improvement in the accuracy of capturing target objects compared to traditional methods. Furthermore, the resolution of saliency maps was three times higher than that of traditional methods. In the application of industrial surface defect detection, the proposed method demonstrated an 11.6% enhancement in the accuracy of capturing target objects, concurrently reducing the false positive rate. The presented approach enables more accurate and comprehensive capture of target objects with higher resolution, thereby enhancing the visual interpretability of deep neural networks. This improvement contributes to the greater interpretability of deep learning models in industrial applications, offering substantial performance gains for the practical deployment of deep learning networks in the industrial domain.
1. Introduction
Deep neural networks have been widely used in many fields, such as computer vision, recommender systems, and semantic segmentation, and have shown good performance [1]. These tasks are mostly based on convolutional neural networks (CNNs) to build decision models, and the trained models have excellent automatic feature extraction and decision-making capabilities. However, a CNN’s performance can be evaluated to a large extent only based on the quality of its decision results. In many critical areas where the performance of deep learning models is required, higher demands are placed on the transparency and interpretability of the models [2,3,4,5,6,7,8]. For example, in the industrial field of surface defect detection, people rely on the localization results of deep learning models for decision-making [9], and the lack of interpretability affects the localization of industrial surface defects, and incorrect decisions lead to accidents [10]. In the field of unmanned vehicles [11], the unknown nature of the causes of erroneous decisions of deep learning models hinders their practical application due to the need for high safety [12]. Therefore, it is clear that the interpretability of deep learning has profound significance [13]. In addition, some other methods have also been proposed in recent years [14,15,16,17,18,19,20].
In recent years, several CNN models have been proposed as explanatory models by research scholars and applied in the field of computer vision. In terms of interpretable methods based on implicit visualization, Zeiler et al. [21] proposed a visualization method based on deconvolution, which reverse reconstructs the patterns learned by the neurons in the middle layer of the CNN, deconvolutes the middle-layer activation values layer by layer into the input space, and reverse reconstructs the generated image to highlight these features, which may cause blurring and information loss in the image. In terms of interpretability based on robustness perturbation tests, Pezeshkpour et al. [22] proposed an adversarial modification of the link prediction model that maximizes the change in the prediction results of the target facts after relearning by minimally changing the graph structure. In terms of interpretability based on information theory, Schwartz-Ziv [23] found that the deep learning model training process has two phases, “feature compression” and “feature fitting,” and visualized a deep neural network in the information plane. In terms of interpretability based on sensitivity analysis, Ribeiro [24] proposed the locally interpretable algorithm LIME, which interprets the prediction of any classifier in an interpretable and faithful way by learning interpretable models locally around the prediction. Class activation mapping analyzes the activations in the intermediate layers of deep neural networks to generate visually clear and intuitive results, providing strong interpretability and visualization effects. Additionally, this method can offer spatial localization information on targets within input images, which is crucial for fine-grained defect detection. Moreover, class activation mapping contributes to a deeper understanding of the model’s decision-making process, offering insights into the key image regions that the model focuses on. In application scenarios like industrial defect detection, the combination of intuitive visualization, spatial localization capability, and model interpretability makes class activation mapping a practical and suitable choice. In terms of interpretability based on class activation mapping, the class activation mapping (CAM) proposed by Zhou B explains the CNN internal mechanism in terms of a saliency map [25]. The average of the feature maps of each neuron in the last convolutional layer is calculated, and the average is linearly combined with the vector as the final activation map, which is then superimposed on the upper layer of the input image to become the saliency maps. This model relies on the last convolutional layer to calculate the mean of the feature maps, which only focuses on the most discriminative regions and cannot cover the whole target. Selvaraju et al. [26] proposed Grad-CAM using gradient information; the mean values of channel gradient weights obtained in backpropagation are used as channel weights to visualize the features learned by the CNN using a saliency map. Grad-CAM calculates the category weights with low-order derivatives, the saliency map resolution is not high, and it can only capture the local features of a single target of the same category. The Grad-CAM performance decreases when the target of the same category appears several times, and it cannot capture the complete target object feature information. A further proposed Grad-CAM++ [27] visualizes multi-target images by using the combination of higher-order gradients (higher-order derivatives of the category weights) as channel weights, but the recognition accuracy of the target object as a whole is not high and no improvement in resolution is made. Wang et al. [28] proposed Score-CAM to determine the importance of each pixel for a specific category by analyzing the scores output from the network and capturing the details and features related to the target category in the image to generate saliency maps for visualization, which generate saliency maps with low clarity and inaccurate localization. Jiang et al. [29] introduced LayerCAM, which generates reliable class activation maps for different layers of CNN by reexamining the relationship between feature maps and their corresponding gradients. However, due to the consideration of multiple convolutional layers, the generated saliency maps suffer from insufficient resolution. Zhang et al. [30] proposed GroupCAM, a method that employs a “split-transform-merge” strategy to generate saliency maps. This strategy involves splitting class activations into multiple groups to generate saliency maps; however, it does not enhance the resolution aspect. Zhang et al. [31] proposed a novel saliency-driven unequal single-image reconstruction network in which the demands of various regions in the superresolution process are distinguished by saliency maps. Liu et al. [32] proposed a saliency-based approach to perform super-resolution image reconstruction with the aim of producing a higher-resolution image based on its low-resolution counterparts. Liu et al. [33] proposed a saliency-guided remote sensing image super-resolution (SG-GAN) method to alleviate the above issue while maintaining the merits of GAN-based methods for the generation of perceptual-pleasant details. In addition, some other methods have also been proposed in recent years [4,34,35,36,37,38,39,40,41,42,43,44]. CAM exhibits a notable dependency on localization accuracy, primarily utilizing global average pooling to generate class activation maps, leading to the loss of spatial details. This may result in suboptimal target localization, particularly at object edges or within complex structures. CAM encounters challenges in handling multi-scale information. Due to the global average pooling operation, CAM struggles to capture scale information from different parts of an object, potentially causing inaccuracies in localization when dealing with targets featuring multi-scale structures. Furthermore, the class activation maps generated by CAM lack a detailed description of the internal structure of the targets, failing to provide insights into the specific focal points of the deep network concerning target shape and texture. This limitation becomes apparent when richer target interpretations are required. Despite these drawbacks, CAM’s simplicity and intuitiveness make it a valuable tool for a preliminary understanding of deep learning model decisions. Researchers need to weigh its ease of use against its limitations, considering whether higher precision in target localization and structural interpretation is necessary for specific real-world applications. Traditional deep neural network visual interpretability methods have the disadvantage of inaccurate target localization or a lack of image clarity when visualization is performed, which has an impact when analyzing the decision process and results of the model.
In order to generate more accurately positioned and higher resolution saliency maps, this paper proposes Augmented Grad-CAM++, which combines multiple low-resolution saliency maps from the same input by using the feature information of the target object in multiple low-resolution saliency maps with different augmented transformations to combine them into the final saliency map and introducing super-resolution techniques to increase pixel points to improve the resolution of the saliency map.
The main contributions of this paper are described as follows:
- The Augmented Grad-CAM++ method is proposed to introduce an augmentation strategy that preserves the high-frequency details of the saliency maps, generates multiple input images using image augmentation techniques, creates different activation mapping maps with spatial feature information of the target object for each image, and combines multiple activation maps into the final saliency map, which contains more detailed details, a more accurate and focused distribution of the target object, and better visualization than the traditional method.
- A super-resolution technique is applied to reconstruct the saliency maps by increasing the pixel points in the saliency maps using bilinear interpolation to improve the resolution of the salient mapping map. Compared with traditional methods, the saliency maps of this model have a higher resolution, providing a more detailed and interpretable visual interpretation, and the high resolution of the heat map provides a better understanding of the decision process of the model and helps to identify the input image regions that play an important role in prediction.
- Application in the localization of defects on industrial surfaces. Augmented Grad-CAM++ is applied to locate tiny defects of various shapes in industrial images. The results show that Augmented Grad-CAM++ is more capable of locating industrial defects of various damage shapes than traditional methods, providing strong support for quality control and defect detection, and enhancing the interpretability of deep learning network model applications in the industrial field, which shows the potential and application prospects of this model in the industrial field.
2. Related Works
Interpretability has been a hot research topic in the field of deep learning in recent years [45]. Interpretability represents the mapping from abstract concepts such as vector space and unstructured feature space, which are not well understood by humans, to human-understandable domains such as image and text, etc. The research content of deep learning interpretability can be divided into post-hoc interpretation and self-interpretation methods, etc. Post-hoc interpretation is the interpretation of pre-trained models of deep learning networks. The interpretation of the pre-trained model is carried out by combining the input, middle layer parameters, and output information of the pre-trained model without modifying the structure or parameters of the model itself to achieve the interpretation of the internal mechanism of the deep learning model and the decision-making results [46]. In recent years, several post-hoc interpretation methods based on representation visualization have been proposed to explain the internal mechanisms and decision results in CNN models in a visual way. Among them, CAM, Grad-CAM, Grad-CAM++, Score-CAM, LayerCAM, GroupCAM, and other classes of activation mapping methods are representative. Distinguishing itself from alternative methodologies, Grad-CAM++ strategically incorporates high-order gradient information weights, thereby producing saliency maps that exhibit a heightened ability to discern the model’s sensitivity across distinct regions within the input image. This nuanced approach not only furnishes more comprehensive and precise insights but also facilitates a deeper understanding of the intricate decision-making processes employed by the model. The judicious utilization of high-order gradients during the activation map generation process serves to effectively mitigate the impact of background noise, resulting in saliency maps characterized by enhanced clarity and accuracy. Hence, this paper builds on Grad-CAM++ to create a better visualization method.
Grad-CAM++ integrates the category conditional properties of CAM with existing pixel space gradient visualization techniques (guided backpropagation and deconvolution) to achieve multi-objective activation mapping map generation using the exact expression of the higher-order derivatives of pixel weights. The category confidence score of Grad-CAM++ is shown in Equation (1).
where is the category confidence score, c is the category index, and denotes the activation at position .
is the weight of the feature mapping for the classification of category c, as shown in Equation (2).
where denotes the neuron weights.
Applying the ReLU operation to remove the negative effects from the activation mapping map, a linear combination of positive activation maps is obtained, as shown in Equation (3).
Grad-CAM++ saliency maps can locate multiple targets but still suffer from inadequate capture of target objects and low resolution of the saliency maps.
3. Algorithm Design
To address the problems of inaccurate, adequate and low resolution visualization of target object localization by the saliency maps generated by traditional visual interpretable methods, this paper proposes the augmented gradient activation mapping (Augmented Grad-CAM++) method, which introduces an augmentation strategy that preserves the high-frequency details of the activation mapping to address this limitation and introduces an image augmentation method that geometrically augments the input image [47], aiming to increase the size of the training set, improve the training process of the model, and avoid overfitting while extracting more detailed and exhaustive feature information to improve the object localization capability of the saliency maps. After that, super-resolution techniques are introduced to increase the pixel points for the reconstruction of the saliency map pixel to improve the resolution of the activation mapping generated by grad-CAM++ to solve the problem of low resolution of the saliency maps generated by the traditional method, so that the model can better reflect the basis of the model decision and the importance of different features and better explain the decision process of the model. By introducing these innovative strategies, this paper addresses certain limitations of traditional methods, thereby enhancing the quality of interpretability and the visualization effects in deep neural networks.
The weight updates in the algorithm are implemented by backpropagation and gradient descent algorithms, and the updated weights are stored in the model parameters of the deep neural network. In terms of feature selection, the model emphasizes relevant features by augmenting the gradient-weighted activation mapping. Specifically, the model augments the target class-related features with the augmented gradient plus activation mapping. This approach improves the quality of the class activation mapping and helps to understand the focus and decision basis of the deep neural network for the target class.
3.1. Geometric Image Augmentation
The image augmentation strategy introduced in this model uses the geometric augmentation of rotation followed by translation for the images, and by introducing image geometric augmentation techniques, the input images are transformed in diverse ways and the corresponding augmented saliency maps are generated. This increases the robustness of the model to different image variations and improves the accuracy and stability of feature selection. Considering the limited information extracted in a single image when extracting information from an image, this paper takes the approach of fusing multiple generated augmented image features. In addition, rotating a large angle would compromise the image’s context and cause feature-worthy details to be ignored in parts of the image’s edges and corners, so each augmented image is created by slight rotation and panning. Therefore, the angle range chosen for the augmented section is between −30° and 30°. The remaining space in the augmented image other than the image pixels is filled with black (pixel values are zero).
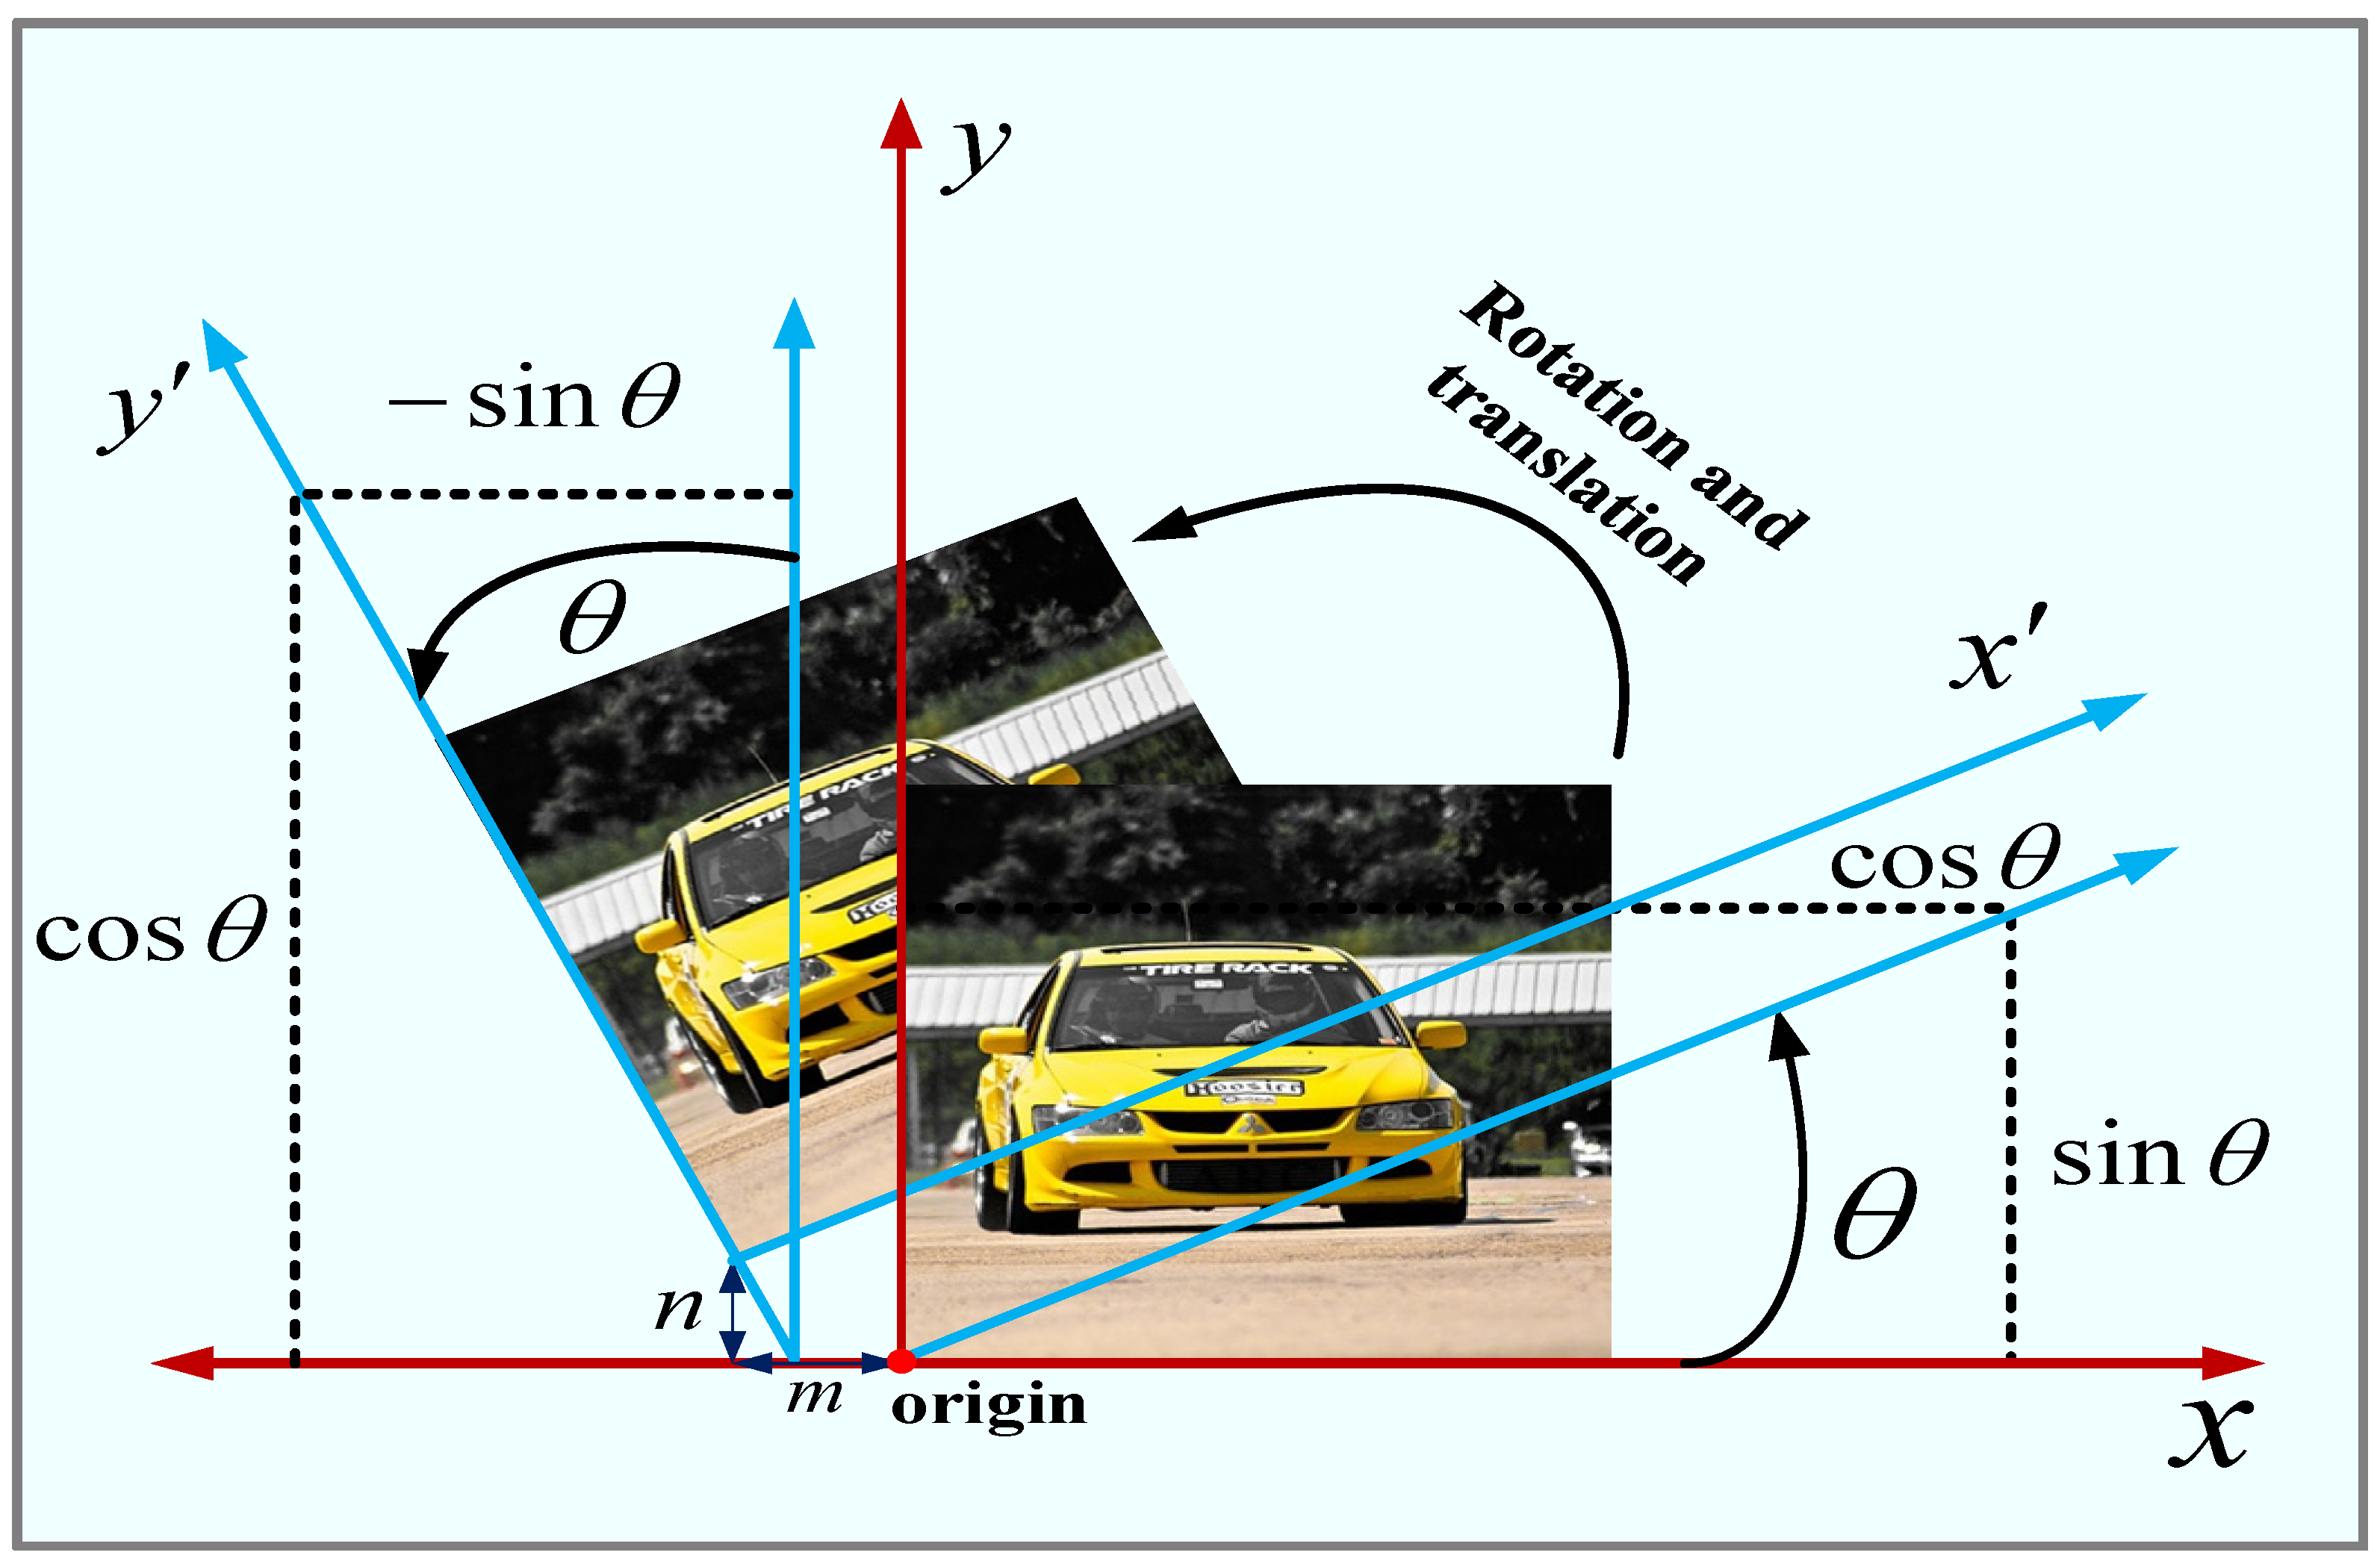
In the rotation operation, set the rotation angle be negative for clockwise rotation and positive for counterclockwise rotation, and the rotation angle to be . The rotation of all pixels of the image from to is calculated as shown in Equation (4).
In the translation operation, set the movement vector of all pixels of the image translating from the original position to the new position to be . The new position of the pixels moving on the image is shown in Equation (5).
After performing the rotation followed by translation operation, the original position of the pixel to the new position is shown in Equation (6).
As Figure 1 illustrates the process of rotational translation operation, the output is when rotating the image by n angle and translating the vector along the -axis and the vector along the -axis.

Figure 1.
Image rotation and translation operations.
In the augmented transformation studied in this paper, Equation (6) is applied first using a rotation operation and then a translation operation to obtain the new position of the pixel.
The image augmentation transform is used to generate the input image part. Suppose the given input image is , the corresponding category index is c, and the input image has pixel points. Applying the rotation and then translation operation of Equation (6) to all pixel points on the image , Equation (7) will be used times to generate a new location for all pixels. Therefore, for a given input image , augmented images are generated after various rotations and then translations, as shown in Equation (7).
where denotes the rotation and translation augmentation operations performed on the input image , denotes the enhancement operation, and denotes the augmented images generated after the augmentation operations.
At this point, the input is changed from a single input image to images, and then the images are calculated separately by Grad-CAM++ to obtain a separate activation map for each image. The activation maps are combined to form the final saliency map.
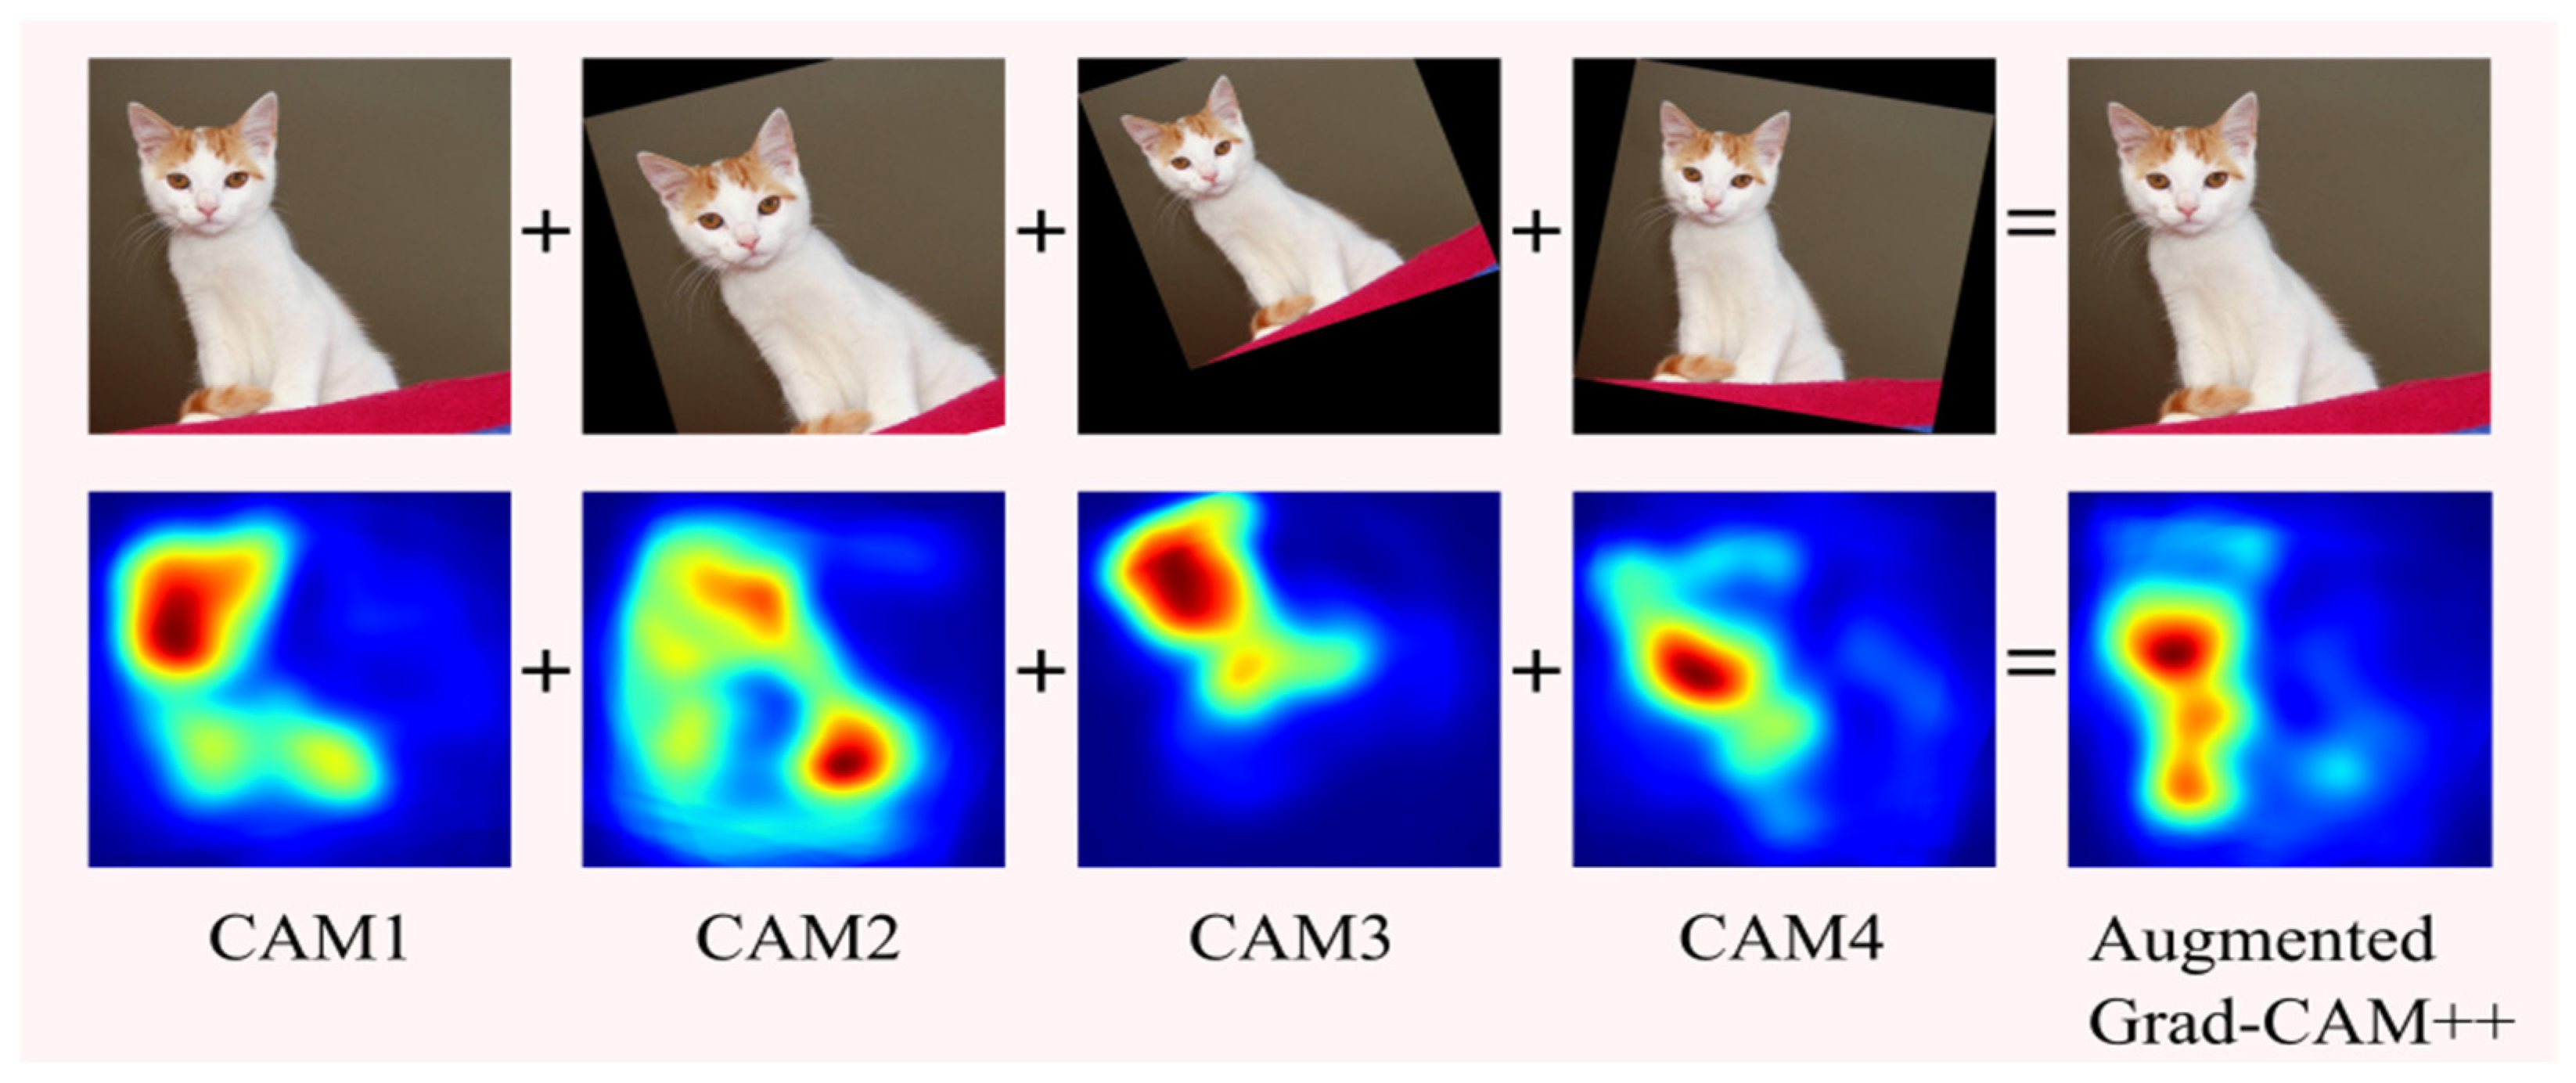
Figure 2 shows an example of augmenting the images and obtaining the combined saliency map. The first image is the input image, and the rest are the images after different degrees of augmentation transformation; each image below the corresponding saliency map, with different degrees of augmentation transformation of each image, can be seen that the saliency map changes. Using Augmented Grad-CAM++, CAM1, 2, 3, and 4 are combined to form the final saliency map Augmented Grad-CAM++ CAM with a more accurate and higher resolution visual interpretation of the target object.
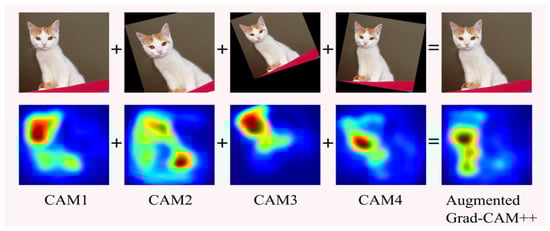
Figure 2.
Example of Augmented Grad-CAM++ image augmentation.
3.2. Saliency Map Generation Based on Super-Resolution Techniques
To improve the clarity of the saliency map, a super-resolution technique is introduced to reconstruct the pixel values of the image. Using a super-resolution technique based on bilinear interpolation, in the combined saliency map, new pixel points are added based on the four pixel points around each pixel point, where the pixel values of the new pixel points are calculated using bilinear interpolation to improve the resolution of the saliency map. Since the resolutions of multiple saliency maps are combined, the final saliency map is less noisy than a single map, and each augmented image brings useful information to the super-resolution algorithm, so a high-resolution saliency map is generated by the super-resolution technique.
The augmented images are passed through Grad-CAM++ as input, and the final activation mapping is obtained by combining the activation mappings generated by Equation (8).
where is the activation mapping map after combination, and then apply the super-resolution on . In this paper, we use a method based on bilinear interpolation to improve the image resolution. The saliency map with high resolution is obtained by reconstructing the significant mapping image element [27].
3.3. Flow Chart of Augmented Grad-CAM++
The flowchart of Augmented Grad-CAM++ is shown in Figure 3. Firstly, the geometric augmentation of rotation followed by translation is used to generate r augmented images in addition to the original image [48], and then each augmented image is passed to Grad-CAM++ for the corresponding computation to generate r different activation mapping saliency maps. Finally, the multiple activation mapping maps are combined into the final saliency map, and then the resolution is improved using a super-resolution algorithm.
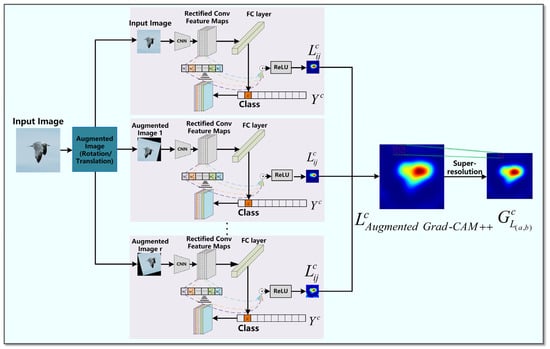
Figure 3.
The flow of augmented Grad-CAM++ algorithm.
3.4. The Pseudo-Code of the Model-Based Approach
The pseudo-code of the augmented Grad-CAM++ is shown in Algorithm 1.
| Algorithm 1: Augmented Grad-CAM++ |
| 1 Start 2 Input image object class indexed as , number of augmented images 3 Apply the combination of rotation and translation to augment the transformation 4 5 Apply Equation (7) for rotation and translation operations 6 Calculate the new pixels , after the transformation 7 Compute the activation mapping of the last layer of the convolutional neural network 8 Compute the combined activation mapping of augmented images 9 10 Apply super-resolution operation 11 12 Compute the saliency map after reconstructing the pixels 13 14 |
4. Experiment Results and Evaluation
In this section, the extent to which people trust Augmented Grad-CAM++ for deep learning interpretability is first verified through human trust assessment experiments: Validation of Augmented Grad-CAM++ for localization and identification of targets using weakly supervised target localization and t-SNE visualization experiments. Evaluating the concentration of energy at the target object location of saliency maps with the pointing game. Testing the reliability of Augmented Grad-CAM++ in generating saliency maps of target objects when pixels of an image are occluded and deleted through insertion and deletion of pixels experiments. Testing the quality of Augmented Grad-CAM++ for generating saliency maps through energy-pointing games. Integrity checks are used to test whether Augmented Grad-CAM++ is a reliable interpretation of a pre-trained model. Finally, industrial surface defect detection experiments are conducted to demonstrate that Augmented Grad-CAM++ can find fine-grained object localization information.
4.1. Experimental Environment and Data
4.1.1. Experiment Environment
The Augmented Grad-CAM++ for the experimental part of this section was implemented using Keras. The development equipment is a Dell commercial desktop: Intel(R)Core(TM) i7-11700CPU@2.50GHz with 8G RAM, Windows 10, integrated development environment PyCharm, Python scripts are created to run and evaluate the model, the scripts contain Augmented Grad-CAM++ and Grad-CAM++ code, first preprocess the input images to the same size, initialize the weight parameters, set the number of augmented images r = 100 during model iteration, the learning rate is 0.001, the batch size is set to 200, the loss reaches convergence, avoid dying ReLU, pass the input images and class indexes to the two algorithms, and output the visualization results when the iteration is completed. The model uses a pre-trained VGG-19 as the base model, and the best VGG19 pre-trained model is determined during the training and optimization process. VGG19 consists of 19 convolutional layers and 3 fully connected layers with full convolutional kernel sizes of 3 × 3 and 2 × 2 to reduce information loss and extract features with better details. VGG19 pre-trained weights are saved in the model project for calls to perform feature extraction in images.
4.1.2. Introduction of Dataset
The datasets used in the experiments include the ImageNet (ILSVRC2012) validation set and the Wind Turbine Damage Image dataset [49]. ImageNet is a widely used large-scale image database created by Stanford University for image classification and object recognition tasks. It comprises over one million images covering objects and scenes from 1000 different categories. Each category has approximately 1000 training samples and several hundred validation samples. The dataset encompasses diverse image categories such as animals, plants, objects, and scenes. The scale and diversity of the ImageNet dataset make it a crucial benchmark in the field of deep learning. Its creation has driven the development of deep learning algorithms and serves as a benchmark dataset for many image classification and object recognition models. The ImageNet (ILSVRC2012) validation set consists of 50,000 images across 1000 categories. The Wind Turbine Blade dataset is a publicly available image dataset designed for wind turbine blade defect detection and classification tasks within the wind power generation domain. It comprises thousands of images of wind turbine blades, with each image representing a blade sample. The images cover various types of defects, such as cracks, holes, rust, etc. The dataset also includes images of normal blades as reference samples. Accurate detection and classification of defects on turbine blades contribute to the safety and reliability of wind power generation systems. The scale and content of the Wind Turbine Blade dataset are closely aligned with practical applications in the field of wind power generation.
4.2. Human Trust Assessment
Human trust assessment experiments were used to evaluate human trust in Augmented Grad-CAM++ and Grad-CAM++ methods. In the experiment, a total of 150 images from six categories were randomly selected from the ImageNet (ILSVRC2012) validation set, and two saliency maps were created using pre-trained VGG-19 to generate two saliency maps for each of the 150 images, one saliency map using Augmented Grad-CAM++ and the other using Grad-CAM++. The saliency maps and the input image were presented to 25 participants from different industries, 15 men and 10 women, with an average age of about 35 years, who chose either a map they felt better about or two that were the same.
In the experiment, each image was normalized to 1. For example, if 16 answers chose Augmented Grad-CAM++, 4 answered Grad-CAM++, and 5 answered “both images are the same,” the scores would be 0.64, 0.16, and 0.20, respectively. As shown in Table 1, this demonstrates that with the introduction of geometric augmentation and super-resolution techniques, Augmented Grad-CAM++ generates saliency maps with higher focus and resolution than the Grad-CAM++ method. Therefore, it outpeformes Grad-CAM++ in terms of human trust assessment and enhances human trust in the interpretability of deep learnable models.

Table 1.
Human trust assessment results for Augmented Grad-CAM++ and Grad-CAM++.
4.3. Model Target Object Visualization and Analysis Experiments
4.3.1. Weakly Supervised Target Localization Experiments
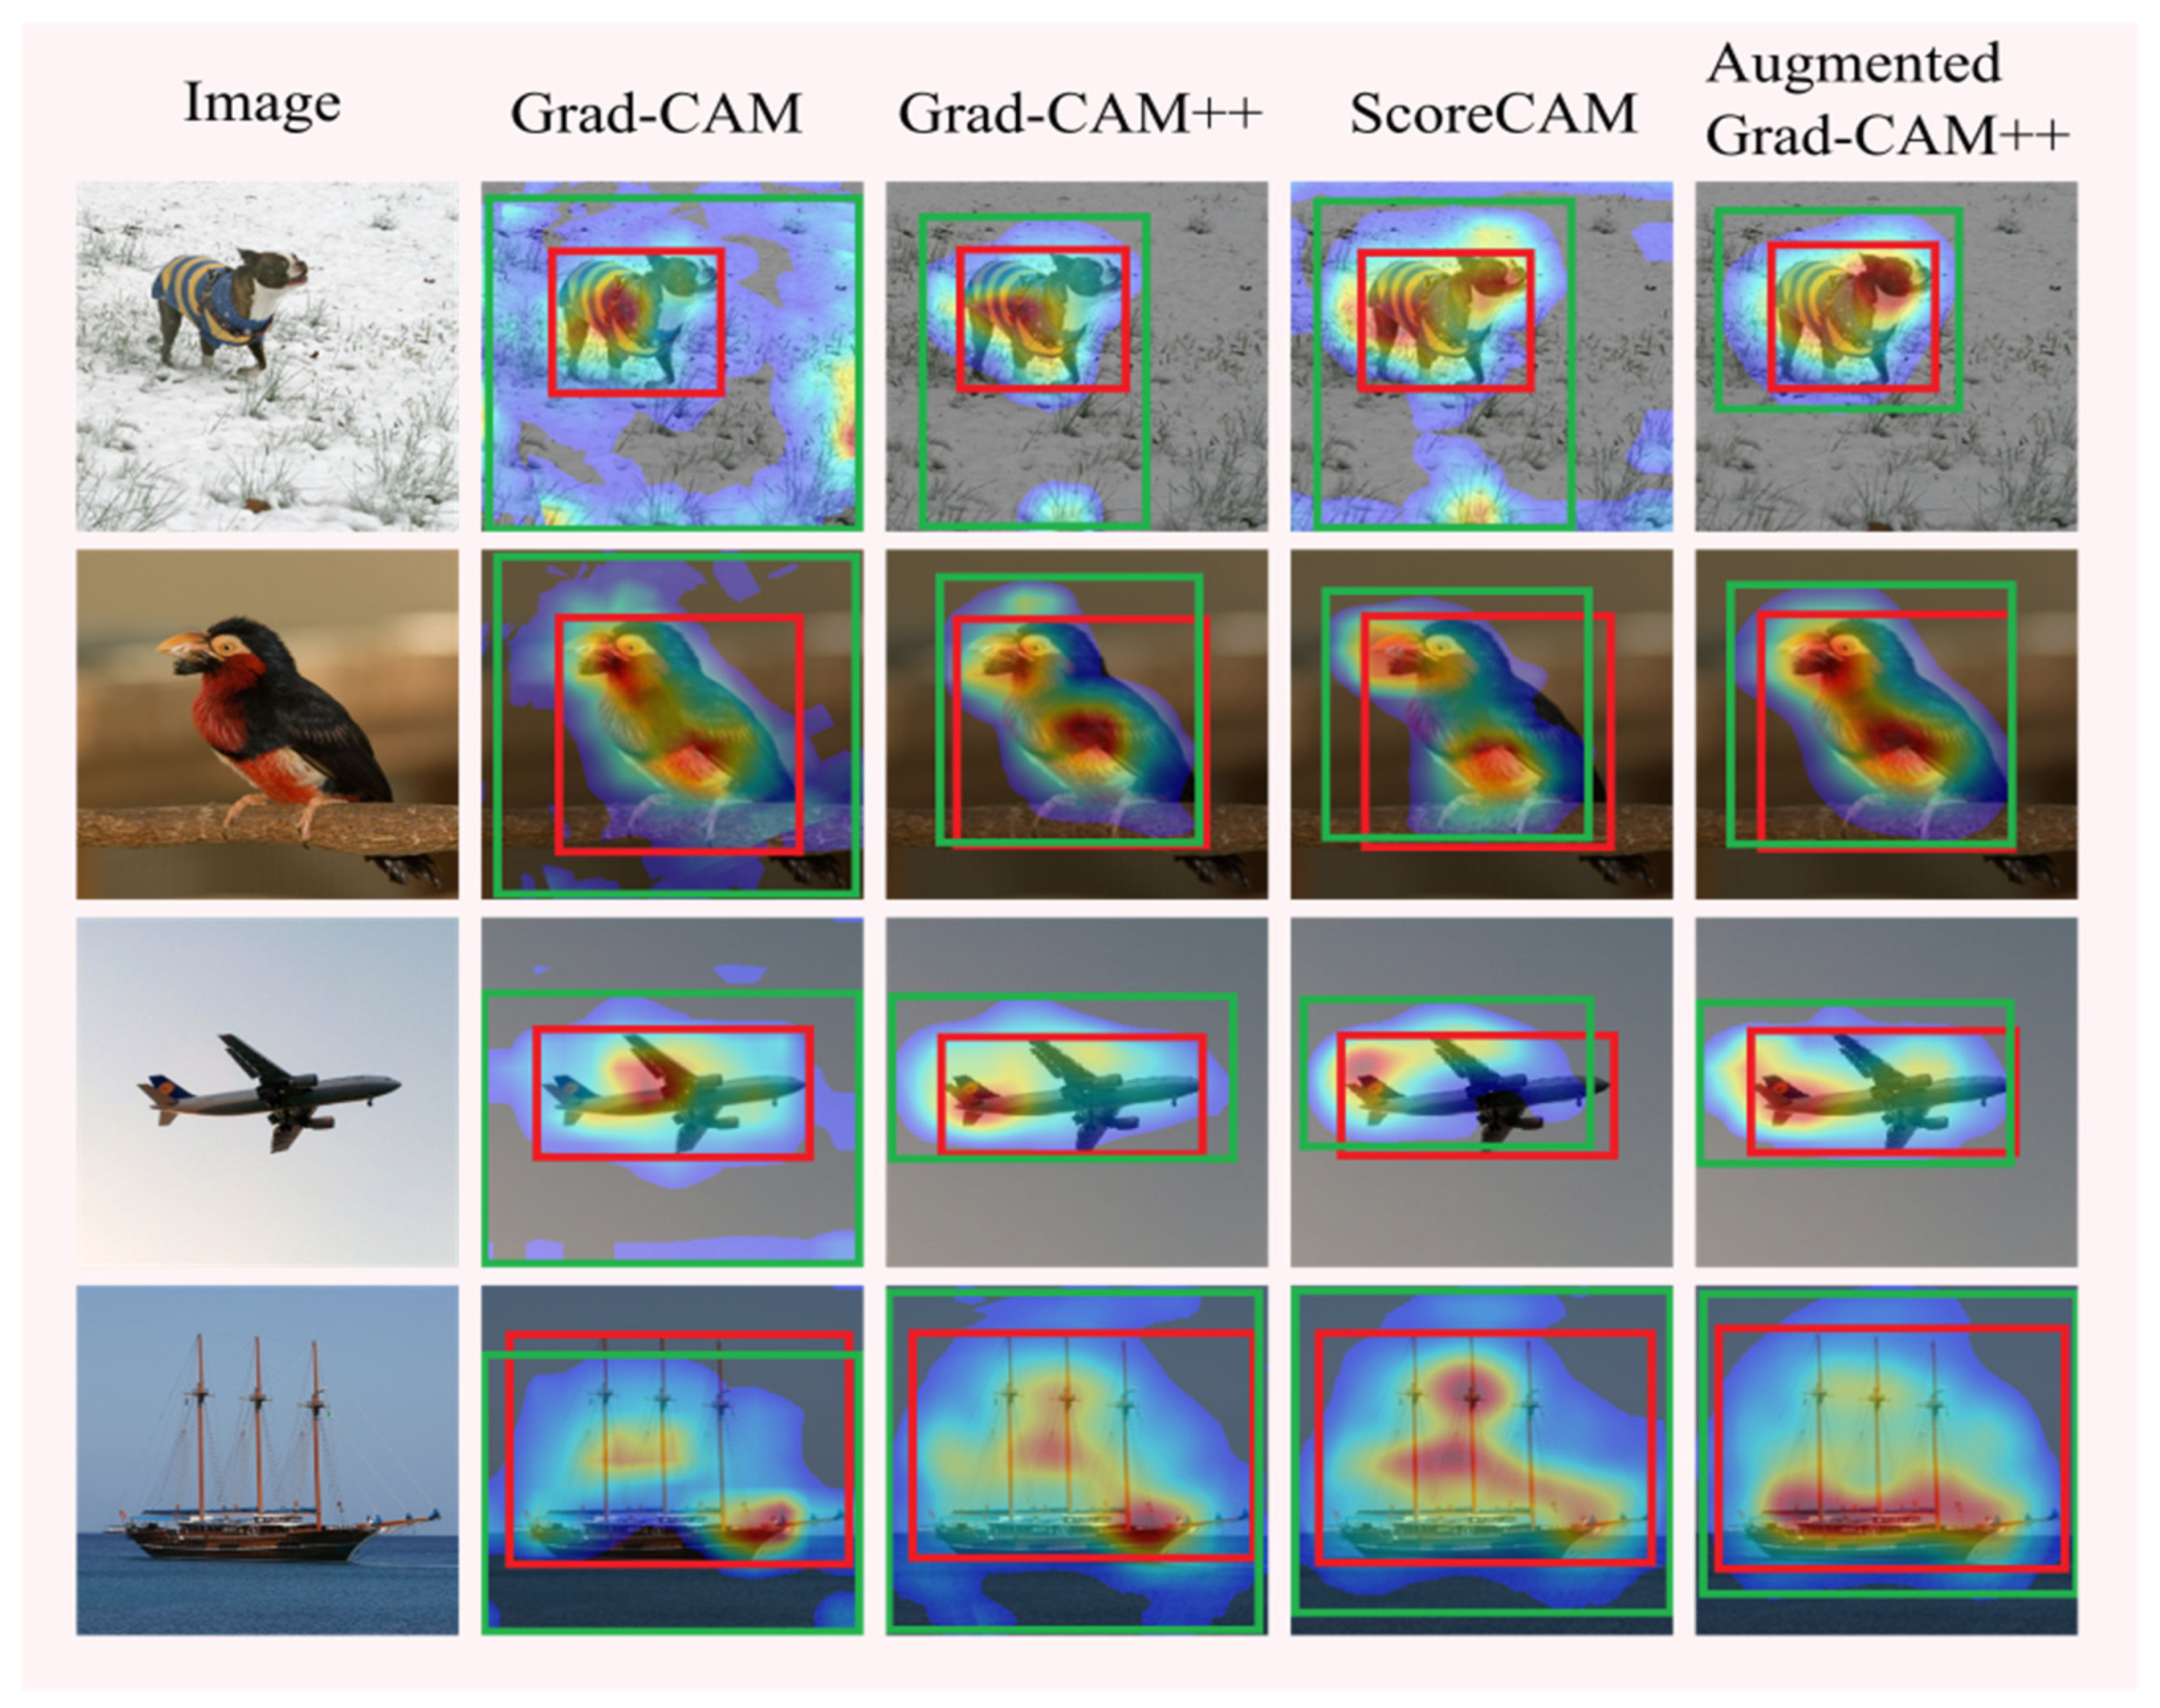
Weakly supervised target localization experiments were used to evaluate the effectiveness of the model in localizing target objects in images [50], aiming to locate object-bounding boxes for the highest prediction category. The experiments were conducted on 200 images selected from the ImageNet (ILSVRC2012) validation set, which were selected with labeled bounding boxes. A pre-trained VGG-19 model was used in the evaluation, and images with one object real box and one saliency map mapping bounding box were selected, as shown in the figure, with green rectangles representing Augmented Grad-CAM++ saliency map or Grad-CAM++ saliency map bounding boxes and red rectangles representing real bounding boxes. To generate the object-bounding box from the activation saliency map, a threshold of 15% is used to binarize the activation mapping, and then a tight bounding box is drawn around the activation mapping, and the object localization score is compared by comparing the average IoU values (mIoU) of Augmented Grad-CAM++ and Grad-CAM++. IoU, which stands for intersection over union, is a metric used to assess the performance of object detection models. It evaluates the accuracy of detection by computing the ratio of the intersection to the union of the predicted and actual regions of the target. Meanwhile, mIoU, or mean intersection over union, is a metric used for assessing the performance of object detection models as well. It evaluates the accuracy of detection by calculating the ratio of the intersection to the union of the predicted and actual regions of the target and then averaging these values. These metrics provide crucial information for evaluating object detection tasks, especially in understanding the accuracy and localization performance of models. The target localization metric is calculated as shown in Equation (9):
where is the input image and is the object class. represents the number of pixels inside the bounding box of the feature object, while represents the number of pixels outside the bounding box. The corresponding mIoU values are calculated with Grad-CAM, Score-CAM, and Grad-CAM++ for comparison with the Augmented Grad-CAM++ algorithm proposed in this paper, and the experiment results are shown in Table 2.
Table 2.
Miou values for weakly supervised target localization.
As shown in Table 2, the Augmented Grad-CAM++ algorithm has an mIoU value of 53.01%, which is higher than other methods. The higher the mIoU value, the better the target localization effect. This proves that the application of the geometric augmentation technique to generate multiple augmented graphics extracts more information to make the target object localization better.
Figure 4 shows an example of target object localization; the red box is the real border of the target object, and the green box is the border of the activation mapping generated by Grad-CAM, Grad-CAM++, Score-CAM, and Augmented Grad-CAM++. Since the geometric augmentation technique is introduced to extract more image information and the super-resolution technique is introduced to improve the resolution of the saliency map, it can be seen from the figure that Augmented Grad-CAM++ produces a more focused and clearer saliency map than other methods.
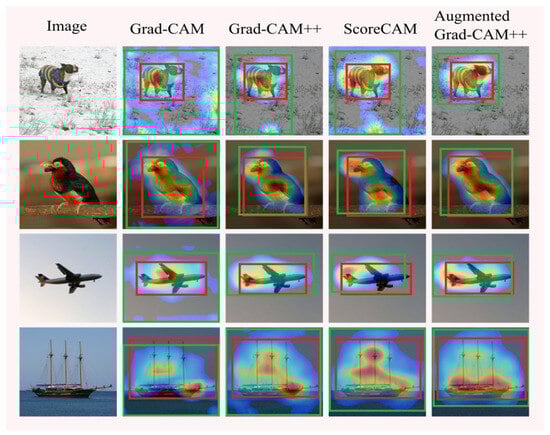
Figure 4.
Comparison of the positioning ability of different methods.
4.3.2. t-SNE Visualization and Analysis
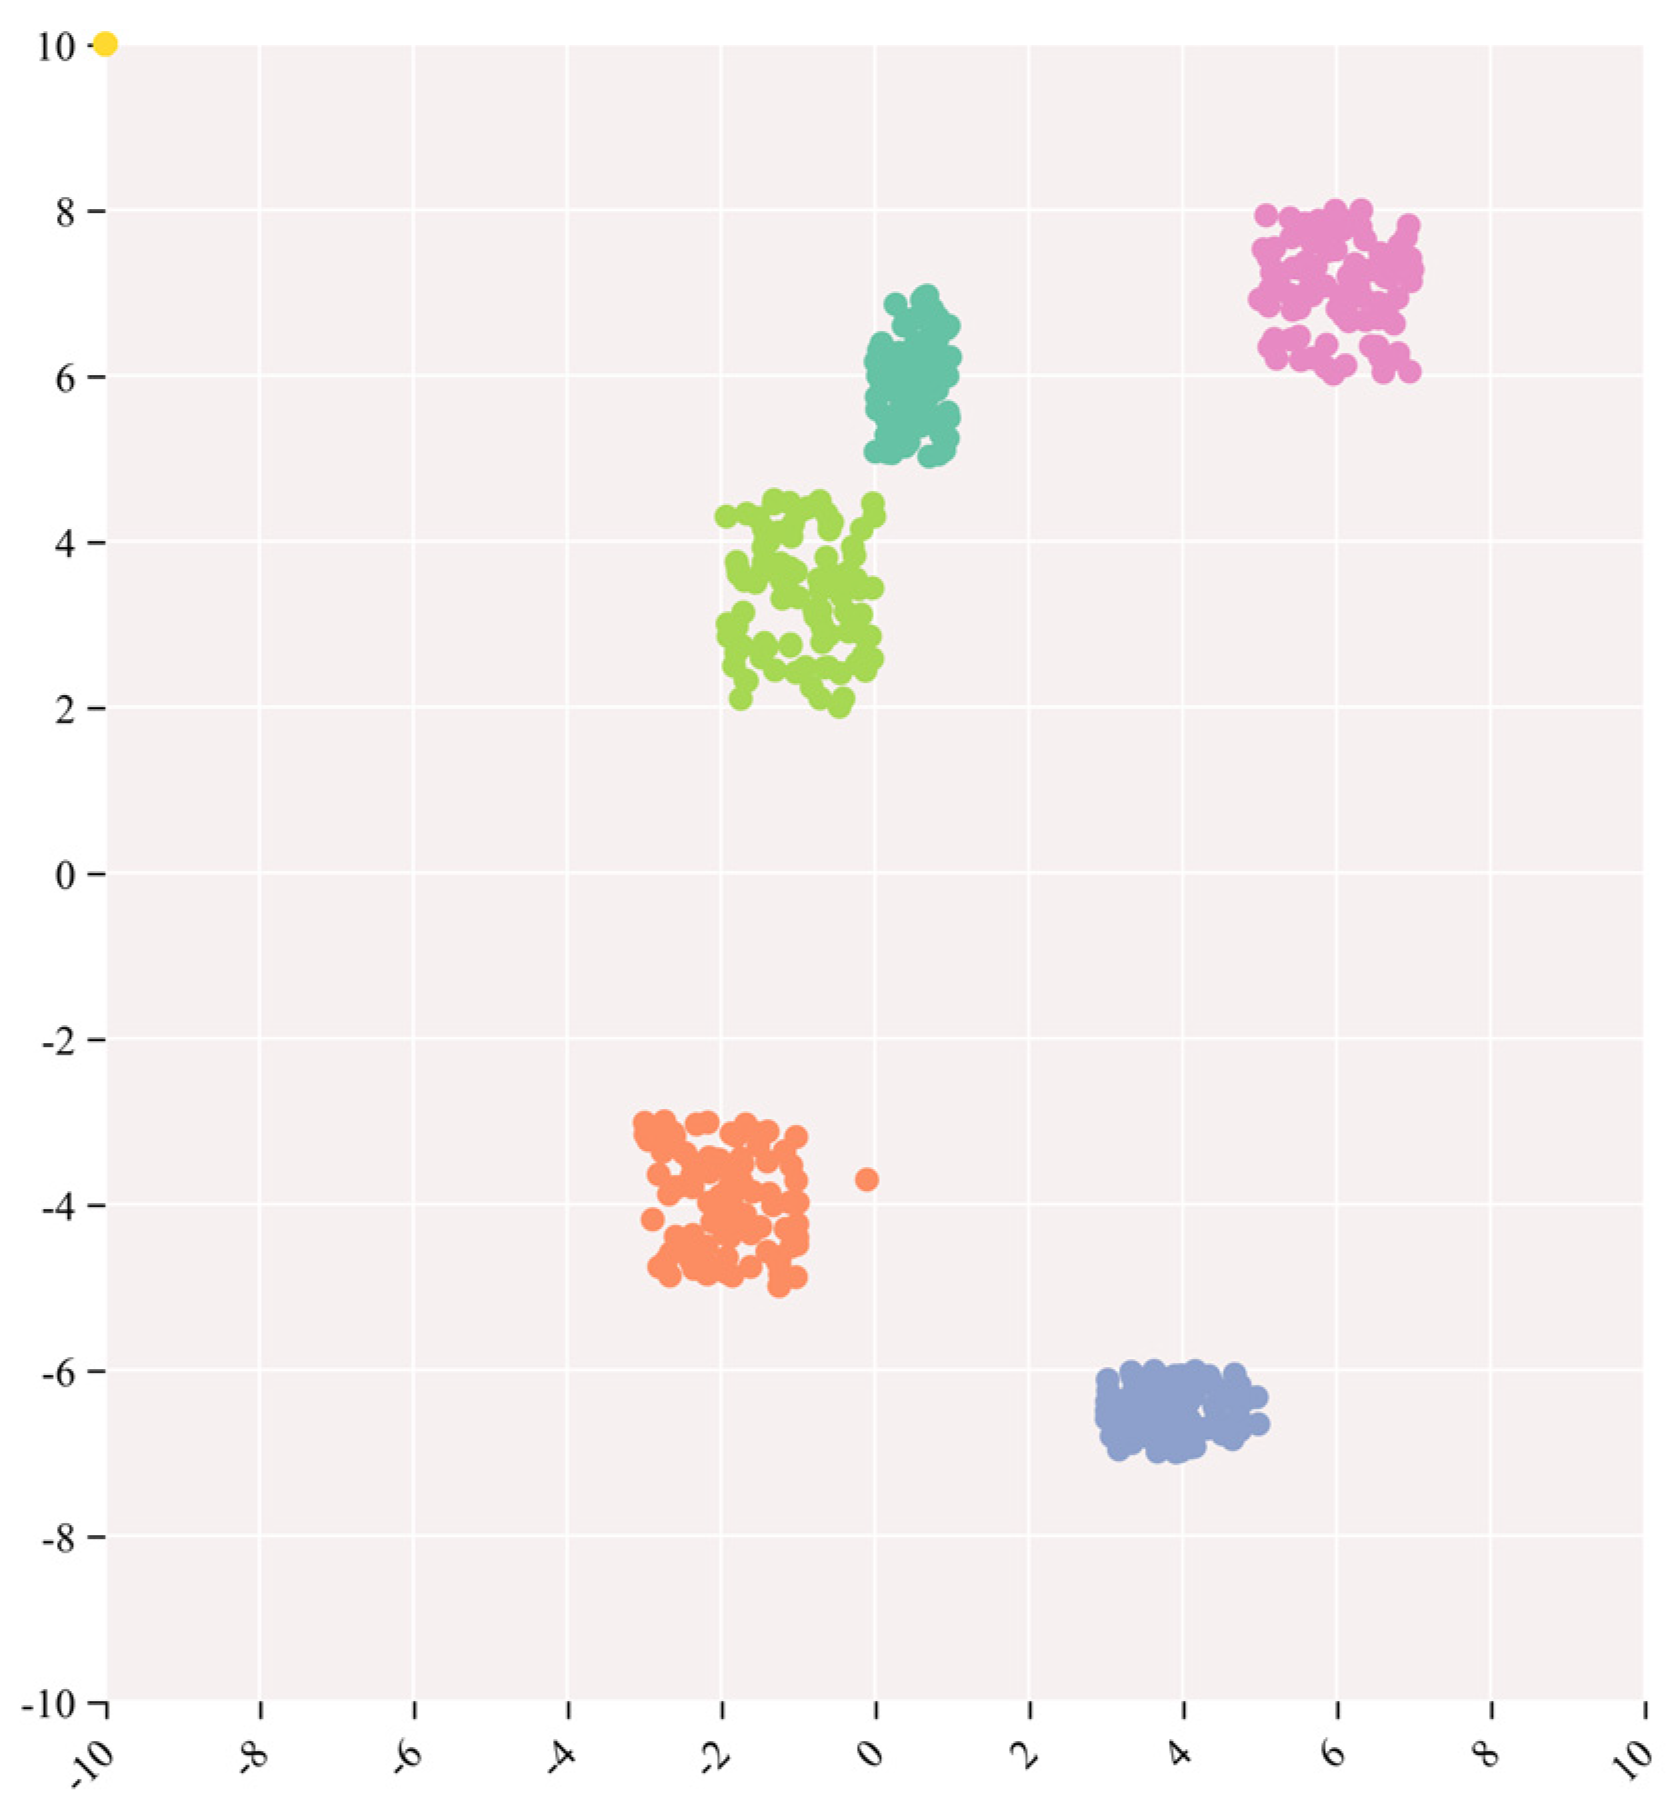
The outcomes of the t-distributed stochastic neighbor embedding (t-SNE) analysis are juxtaposed with the visualizations derived from Augmented Grad-CAM++. This amalgamation is undertaken to comprehend the model’s efficacy on image data, offering a visual scrutiny of the coherence and distinctions in the model’s outputs. t-SNE, an acronym for t-distributed stochastic neighbor embedding, serves as a non-linear dimensionality reduction and visualization technique extensively applied to project high-dimensional data into a lower-dimensional space, enhancing our understanding of the data’s structural arrangement and similarities [51]. For this specific experiment, a selection of 500 images was made from the ImageNet (ILSVRC2012) validation set, encompassing five distinct categories, with each category containing 100 images. The outcomes derived from Augmented Grad-CAM++ were then mapped onto a two-dimensional space leveraging t-SNE, resulting in the formation of a scatter plot. Each data point within the plot corresponds to an individual sample, and unique colors or markers are employed to signify clusters corresponding to the five predefined categories. By scrutinizing the arrangement of these data points, it becomes evident whether samples from the same category manifest as cohesive clusters within the lower-dimensional space. The t-SNE outcomes are visually represented in the accompanying Figure 5.
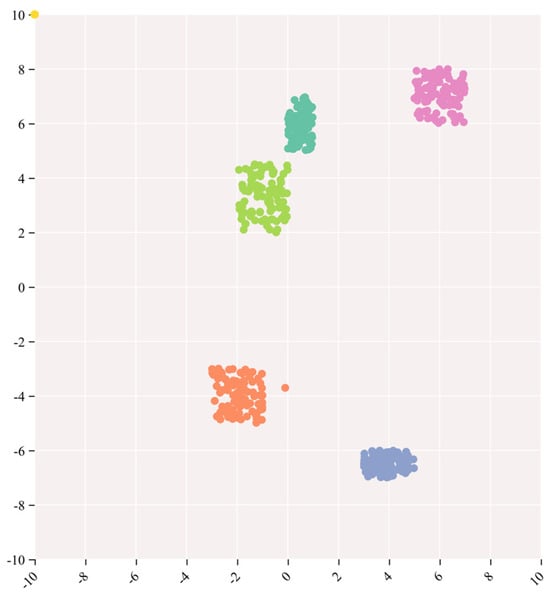
Figure 5.
Visualization of five categories of images by t-SNE.
As illustrated in Figure 5, the formation of distinct clusters for all five categories signifies that Augmented Grad-CAM++ has effectively learned category-specific feature representations in the high-dimensional feature space. The model demonstrates an ability to capture and discriminate subtle differences between different categories, highlighting its effectiveness in learning task-relevant information. The clusters formed for each category indicate the model’s capability to distinguish between various targets effectively. This visual representation provides an intuitive showcase of the model’s focus areas for different categories, thereby enhancing the model’s interpretability.
4.4. Experiment on Pixel Count and Resolution Comparison
This section involves the calculation of pixel count and resolution to evaluate the clarity of different class activation mapping methods. The experiment selects 200 images from the ImageNet (ILSVRC2012) test set, normalizing them to a resolution of 300 × 300 before inputting them into the class activation mapping methods. The average pixel count and resolution of the resulting saliency maps are then calculated for each method. The formulas for resolution and pixel count are shown in Equation (10).
In the aforementioned expressions, denotes the pixel count, signifies the resolution, and as well as denote the pixel counts corresponding to the width and height of the input image. The formulas for calculating the pixel count and resolution after super-resolution for the Augmented Grad-CAM++ saliency maps are shown in Equation (11).
As shown in Table 3, Augmented GradCAM++ has an enhanced number of saliency map pixels and resolution.
Table 3.
Number of pixels and resolution of different methods.
4.5. Insert and Delete Pixel Test
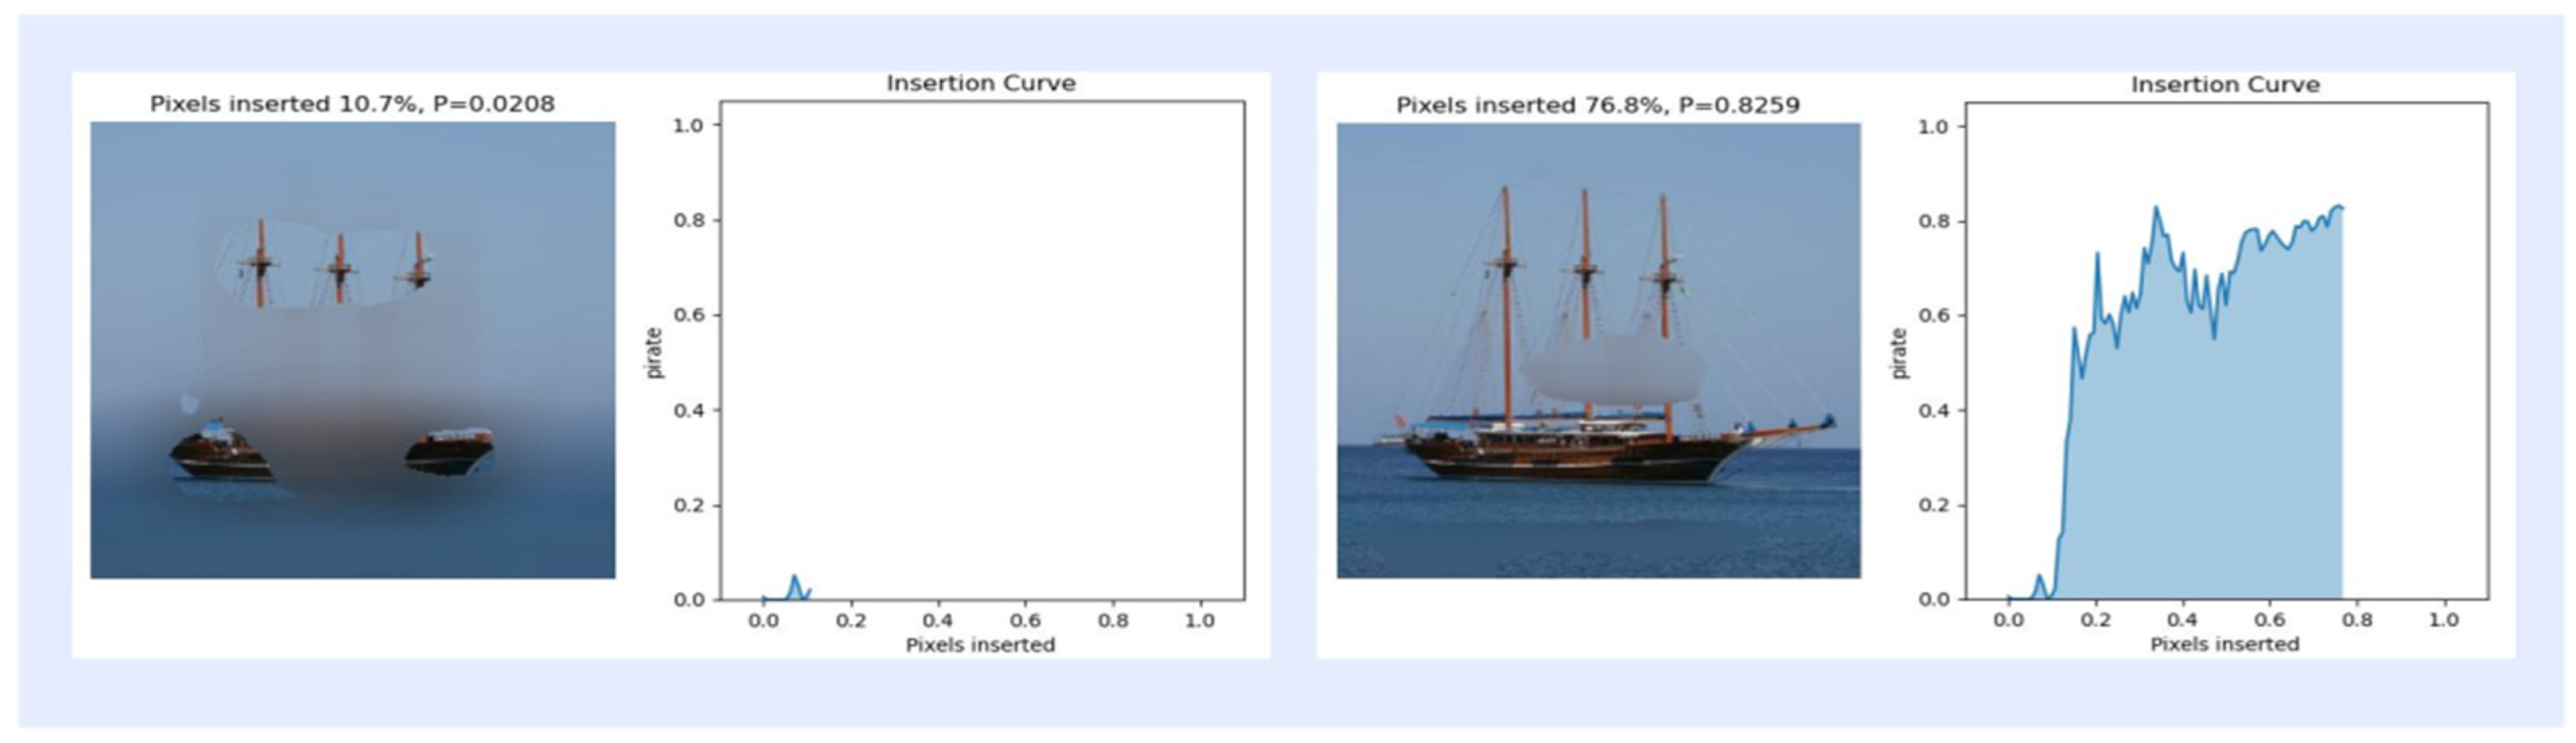
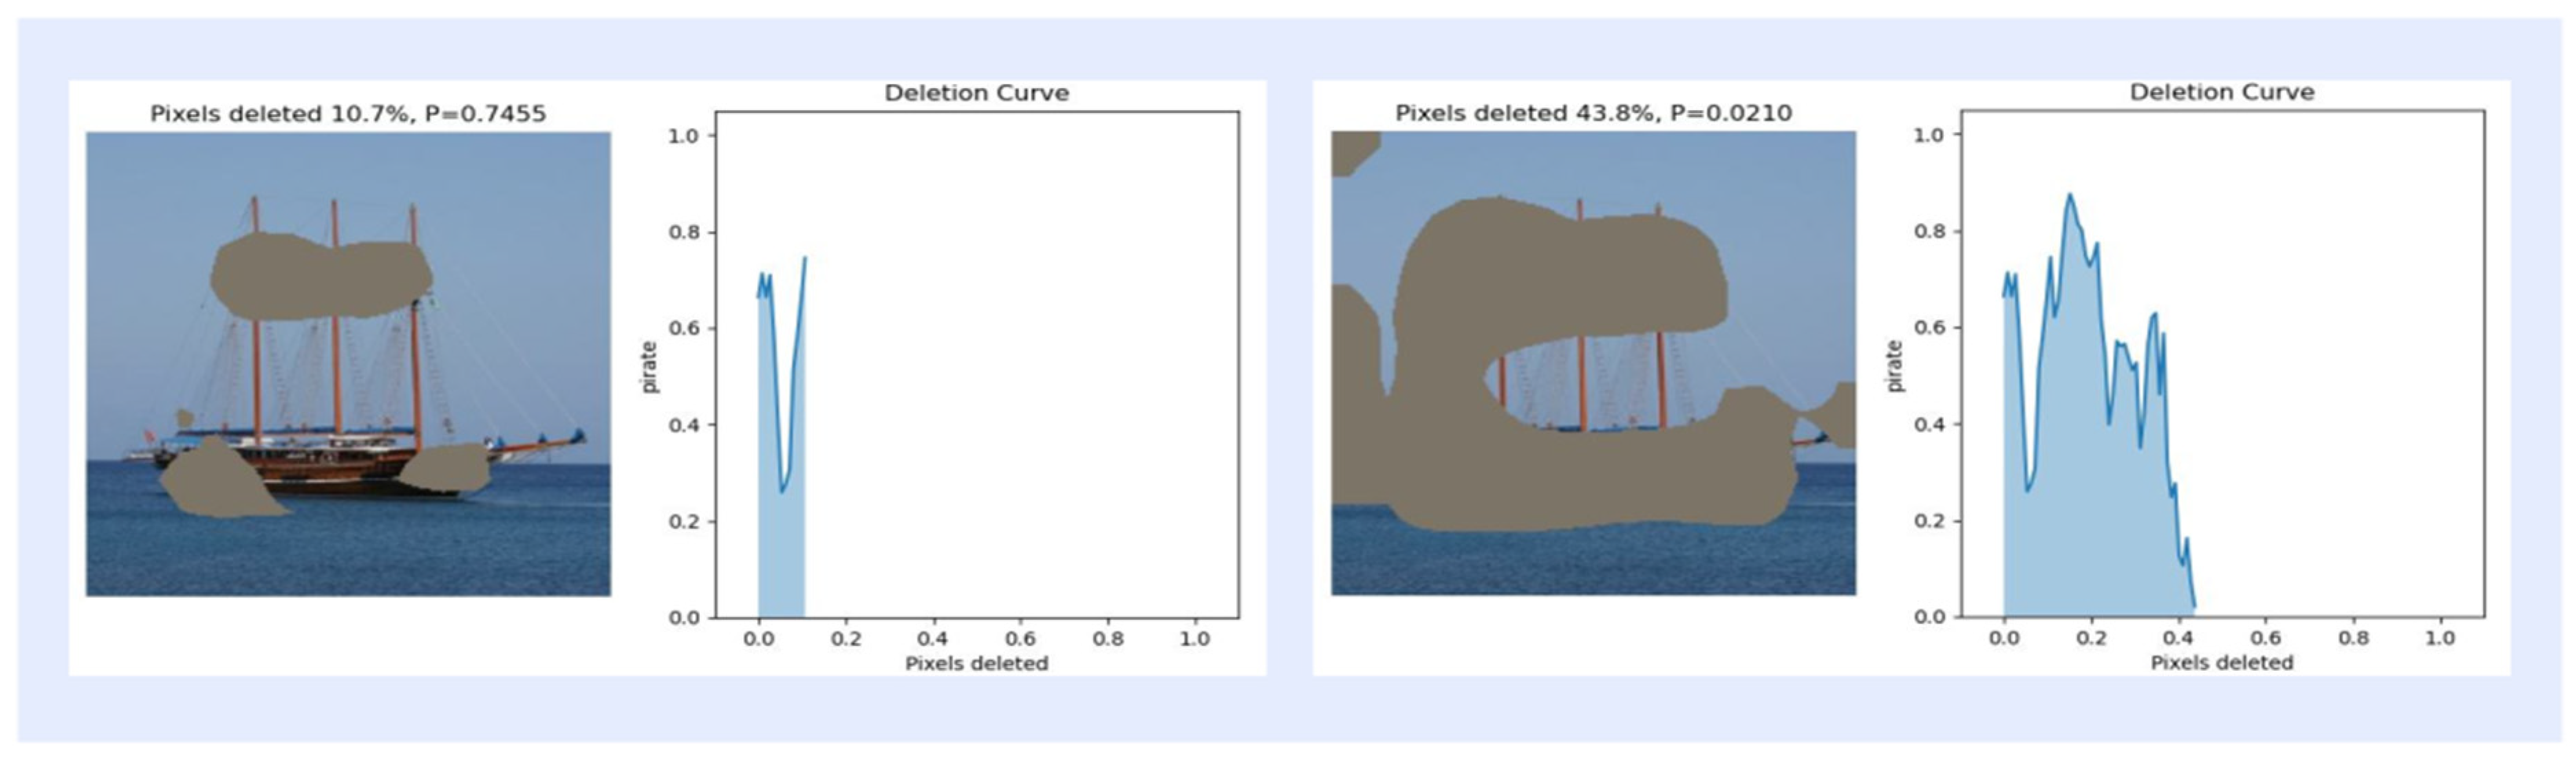
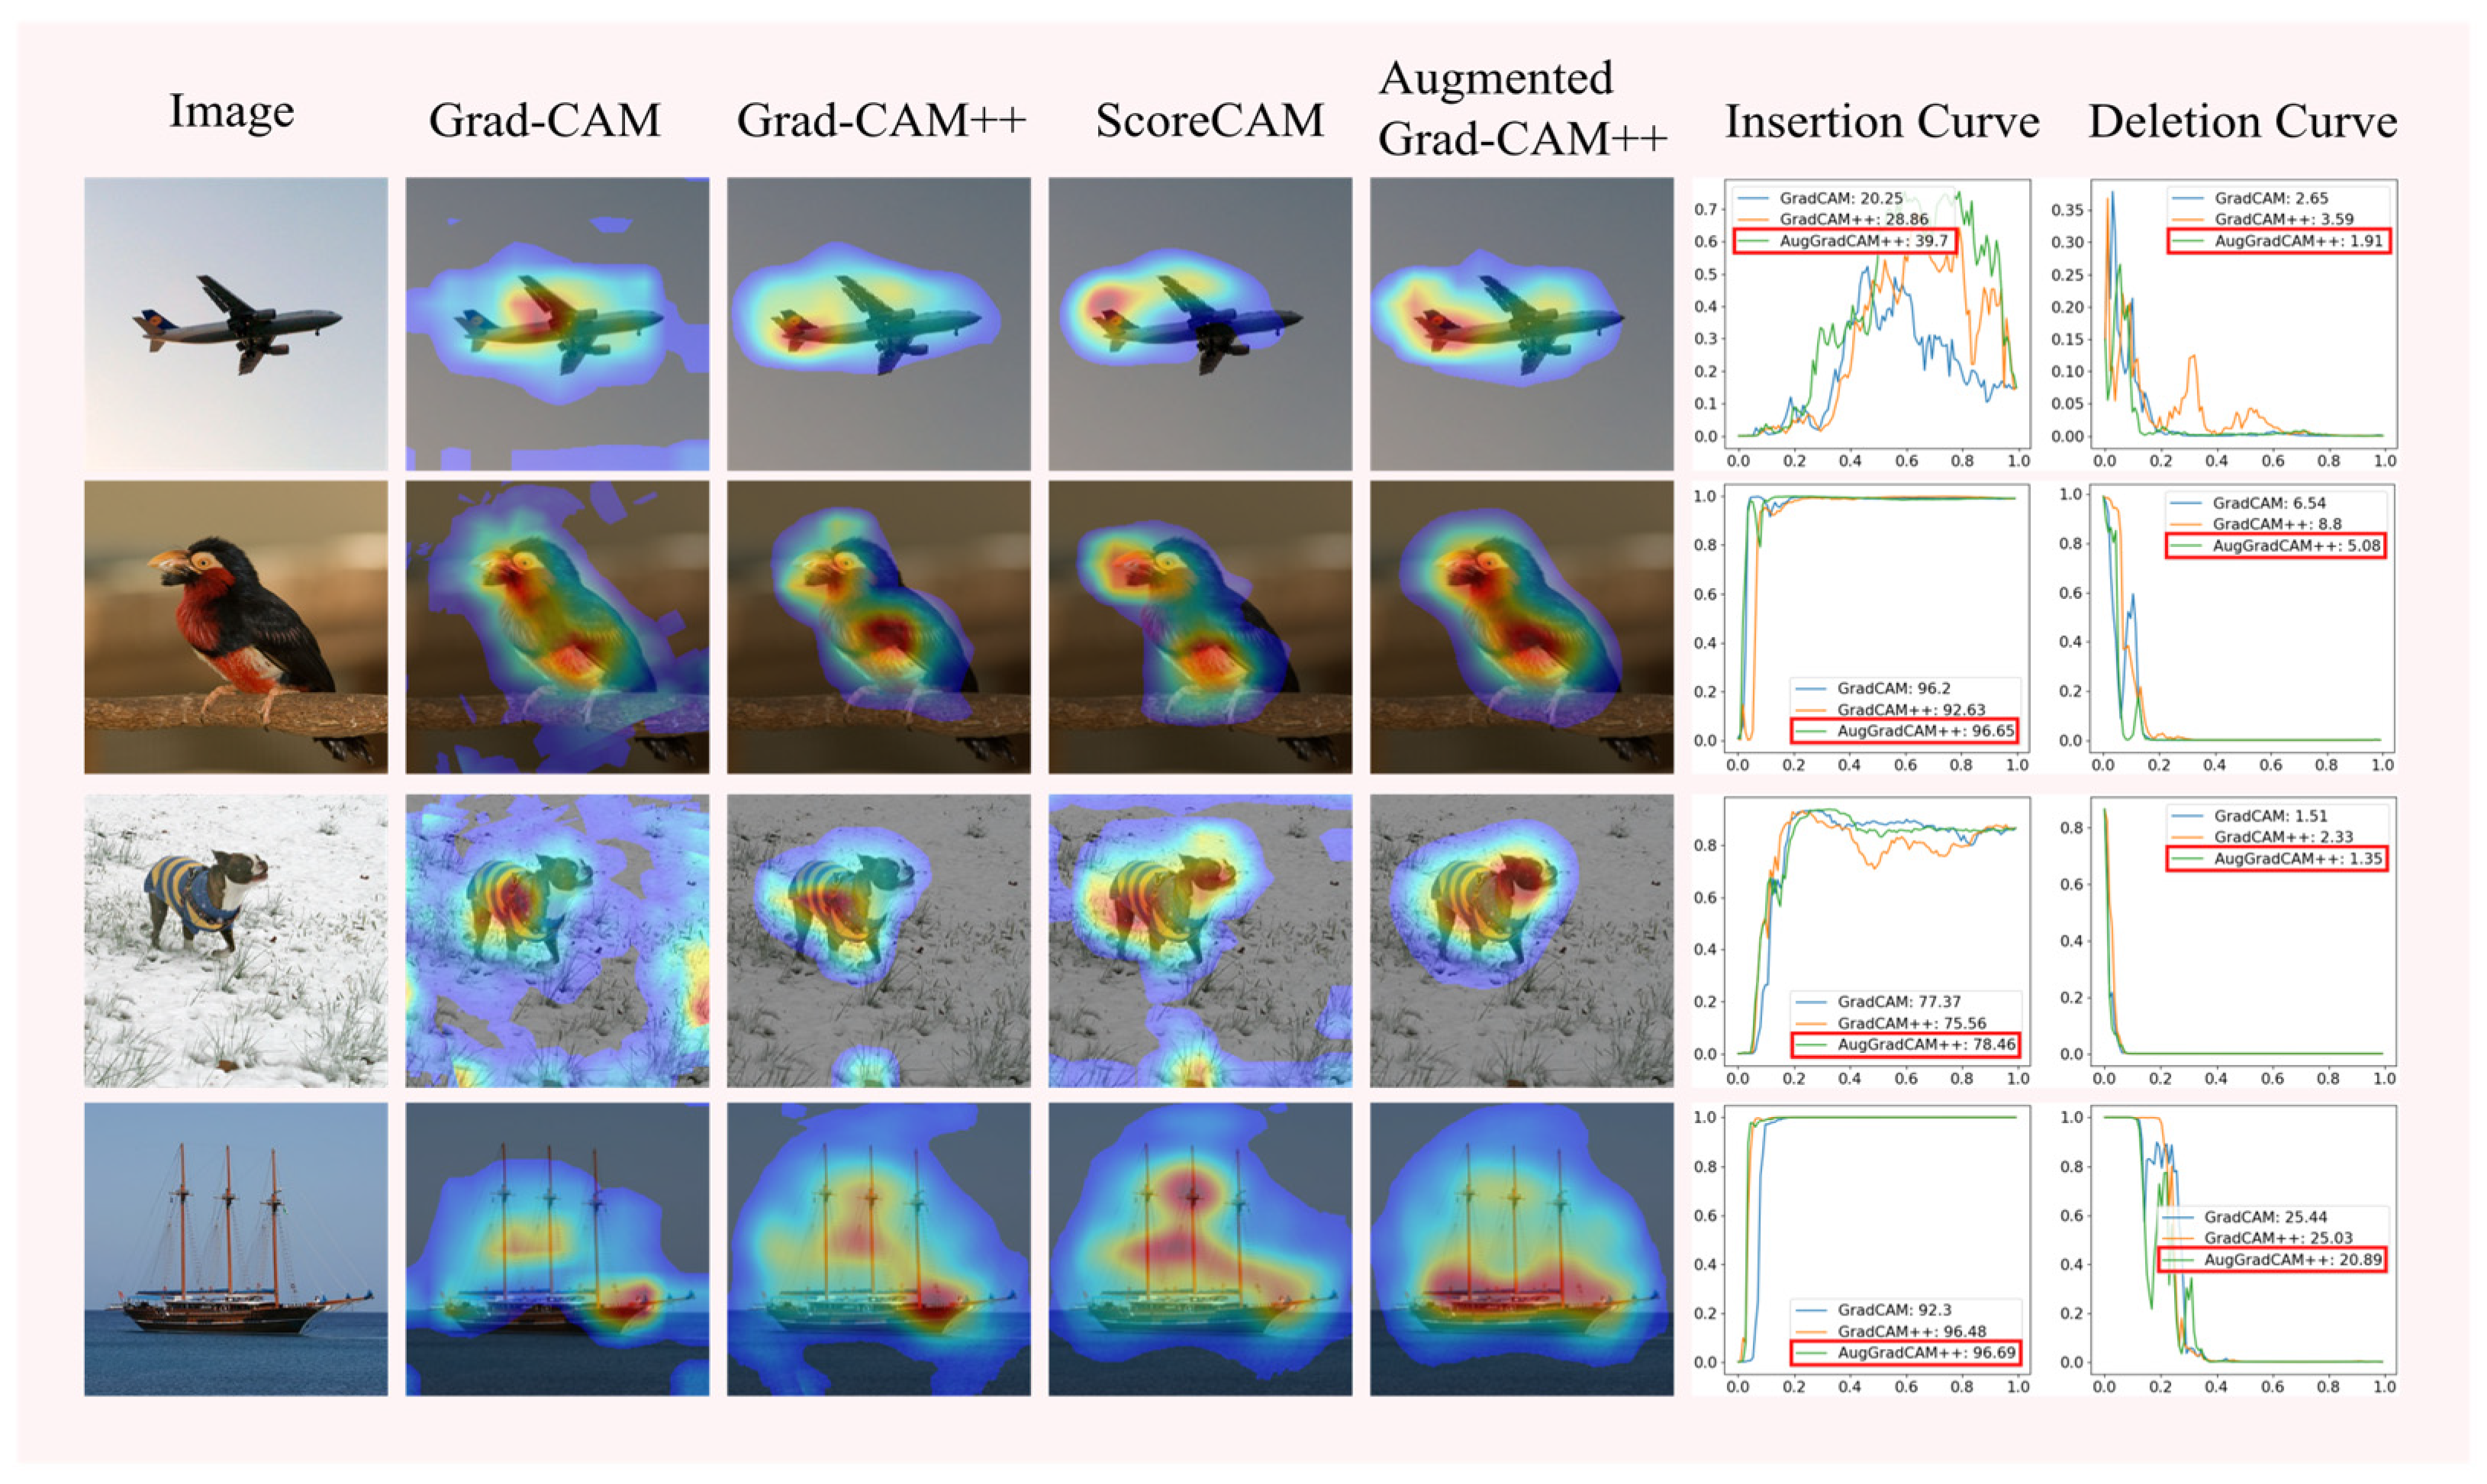
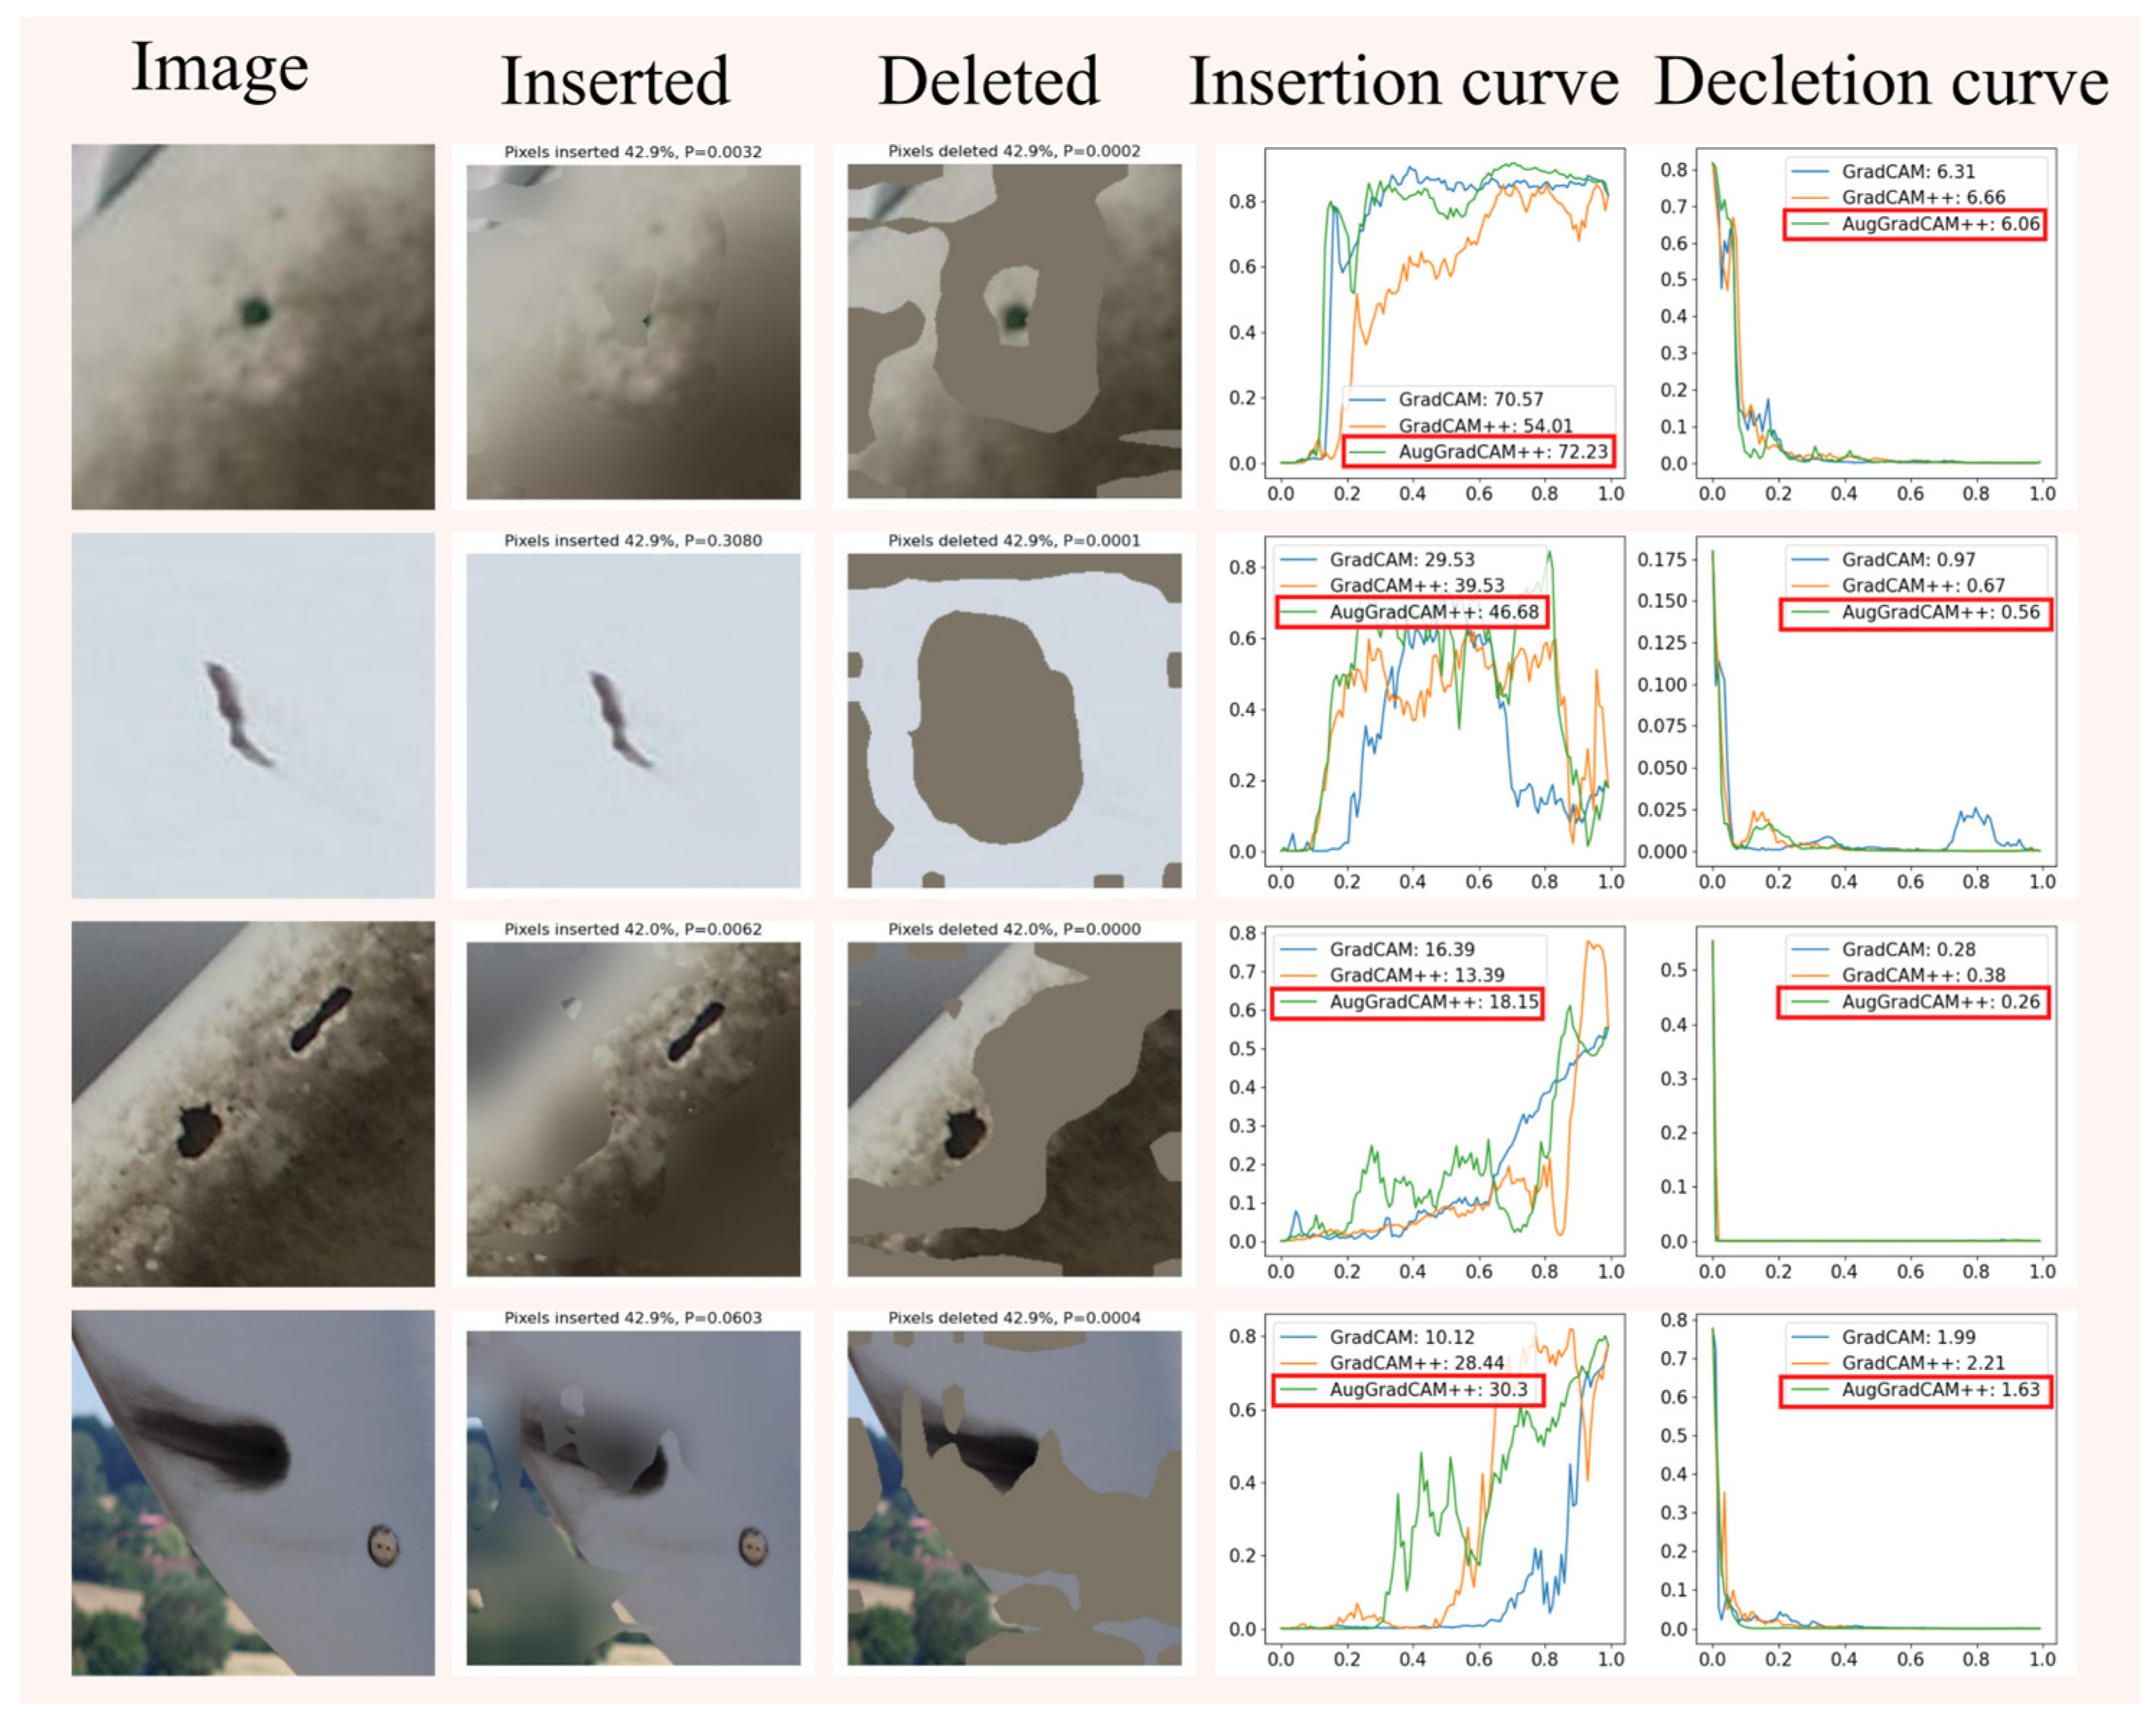
In this section, insertion and deletion experiments of pixels in images are performed to evaluate the effects of different activation mapping methods. The experiments were performed on 368 images selected from the ImageNet (ILSVRC2012) test set. Insertion refers to starting from a blurred image and gradually reinserting pixels that were originally clear [52], and deletion refers to removing pixels that are most relevant to the features of the object class, which will result in a significant decrease in the feature classification score [53]. The specific operation is the insertion operation experiment, in which 2.8% of the pixels of the blurred image are gradually replaced with the original pixels until the image returns to a clear state, as shown in Figure 6 for the insertion curve at 10.7% and 76.8% of the inserted pixels. For the deletion operation experiment, the 2.8% pixels are gradually replaced, and the pixels of the original image are gradually replaced with highly blurred pixels in the original image each time according to the value of the activation mapping map until they are completely replaced until there are no pixels left, as shown in Figure 7 for the deletion curve when the deleted pixels are 10.7% and 43.8%. As shown in Table 4, the AUC of the final activation mapping according to the category classification after the score is then calculated as a quantitative index, and the combined score is used to evaluate the results of the insertion and deletion operations, and the AUC curves are used to show the trend of the classification confidence in insertion and deletion, as shown in Figure 8.

Figure 6.
Example of the curve corresponding to 10.7% and 76.8% of the inserted pixel ratio.
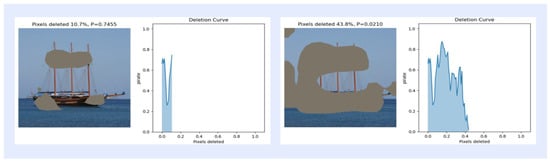
Figure 7.
Example of the curve corresponding to 10.7% and 43.8% of the deleted pixel ratio.
Table 4.
Combined AUC scores for inserted and deleted pixels.
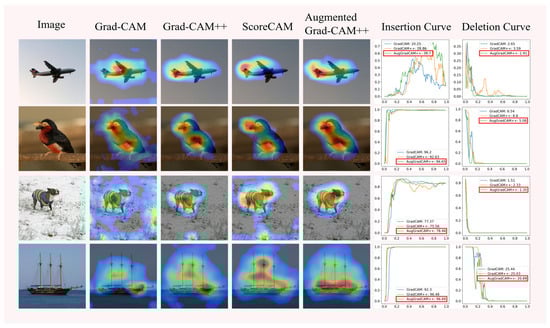
Figure 8.
Saliency maps and insertion and deletion curves of Grad-CAM, Grad-CAM++, and Augmented Grad-CAM++ methods.
As can be seen from the saliency maps in Figure 8, the quality of the saliency maps generated by Augmented Grad-CAM++ is better than that of the other methods. The insertion and deletion curves show that Augmented Grad-CAM++ confidence scores grow fastest during the pixel insertion operation, indicating that Augmented Grad-CAM++ is better at capturing important features in the image. The Augmented Grad-CAM++ confidence score decreases the fastest when the pixel is deleted, and the confidence score is lower when the pixel is completely deleted from the image than the other methods, which shows that the pixel reduction of important features in the image has a greater impact on Augmented Grad-CAM++. Since Augmented Grad-CAM++ extracts more information into the image and identifies the pixels at the target object location in the image more accurately, it is more sensitive to the change in pixels at the target location in the insertion and deletion experiments than other methods.
4.6. Pointing Game
This section uses the pointing game to evaluate the quality of the saliency maps generated by Augmented Grad-CAM++, extracting the energy maxima points from the mapping maps and calculating whether the maxima points fall within the true borders of the objects. The process is measured by whether the energy extremum point falls within the border or not. Setting the value to 1 for the region inside the border and 0 for the region outside the border, these points are then multiplied with the activation mapping of the saliency maps and summed to obtain the total energy value inside the border, which is calculated as shown in Equation (12).
A total of 300 images of different categories were randomly selected from the ImageNet (ILSVRC2012) validation set, and the quality of the generated salient maps was measured by calculating the position of energy values in Equation (12). The experimental results are shown in Table 5.
Table 5.
Percentage of the distribution of energy extrema within the object borders.
As can be seen from Table 5, the energy value distribution of Augmented Grad-CAM++ is 52.8%, which is higher than the other methods, and the distribution of the generated saliency maps is more concentrated than the other methods.
4.7. Integrity Check
The integrity check experiments first demonstrate that Augmented Grad-CAM++ can effectively identify target objects when both correct and incorrect category indexes are set through data category randomization experiments [54], second demonstrate that target objects can still be located when model accuracy is reduced and the model has good stability and robustness through randomization experiments, and finally demonstrate the reliability of Augmented Grad-CAM++ in locating targets through model scalability experiments.
4.7.1. Data Category Randomization
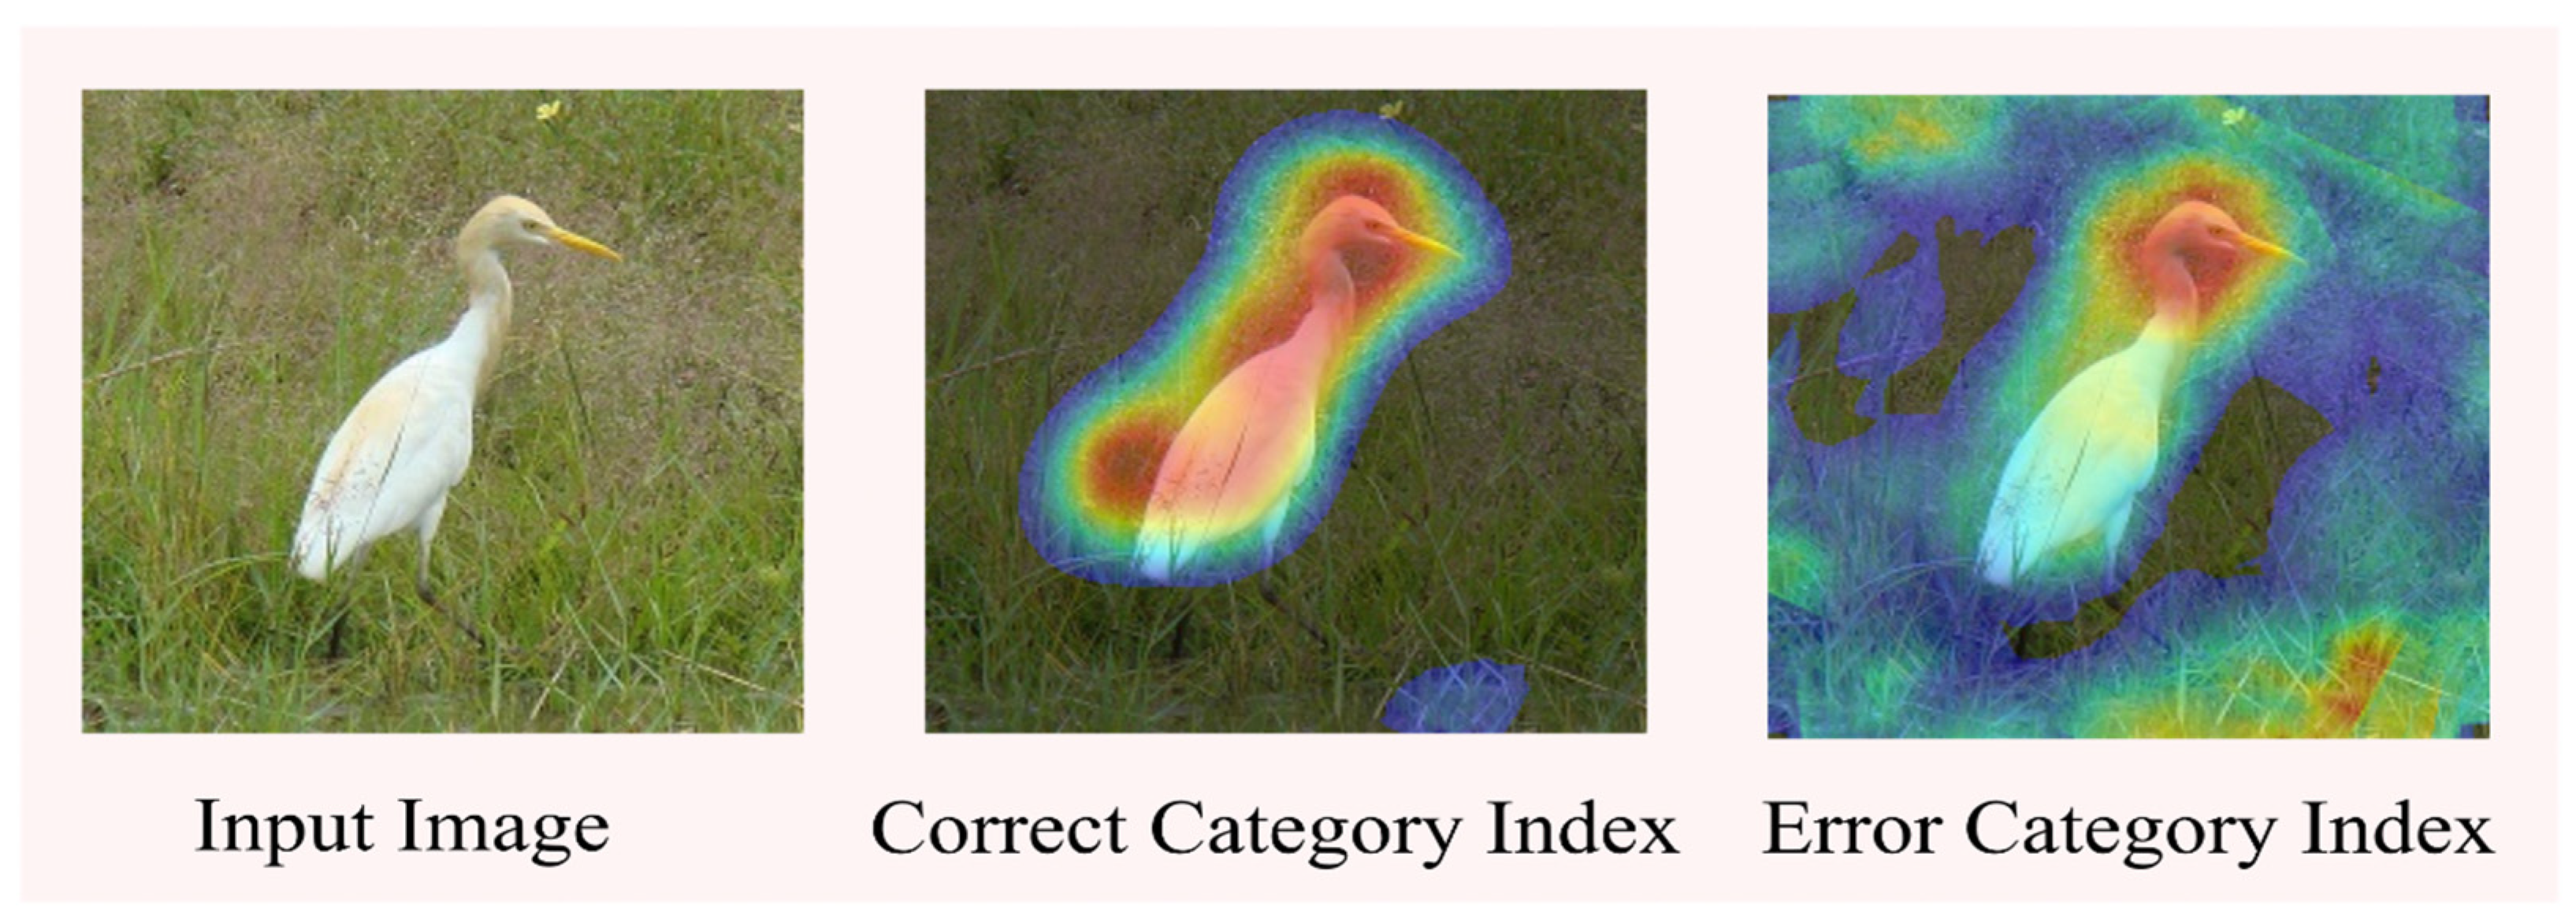
This section uses pre-trained VGG-19 for input data category randomization to validate the model and sets correct and incorrect category indexes at the input image to generate Augmented Grad-CAM++ saliency maps, respectively. It is expected to affect the Augmented Grad-CAM++ saliency map and reduce the prediction accuracy. An image of an egret was selected from the ImageNet (ILSVRC2012) validation set, and the correct category index was set to 426 and the incorrect category index was randomly set to 241, and the results are shown in Figure 9.
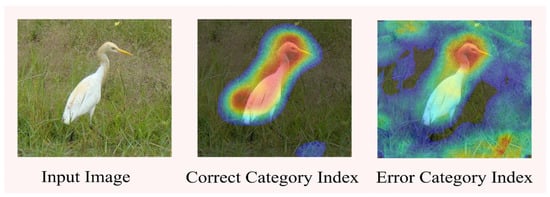
Figure 9.
Data randomization for integrity checking.
Augmented Grad-CAM++ set to the correct index successfully focuses the egret, while when it is set to the wrong category index, the egret can be located, although the quality of the saliency map is lower than that generated by the correct category index, demonstrating the reliability of the Augmented Grad-CAM++ algorithm in identifying the target object.
4.7.2. Model Randomization
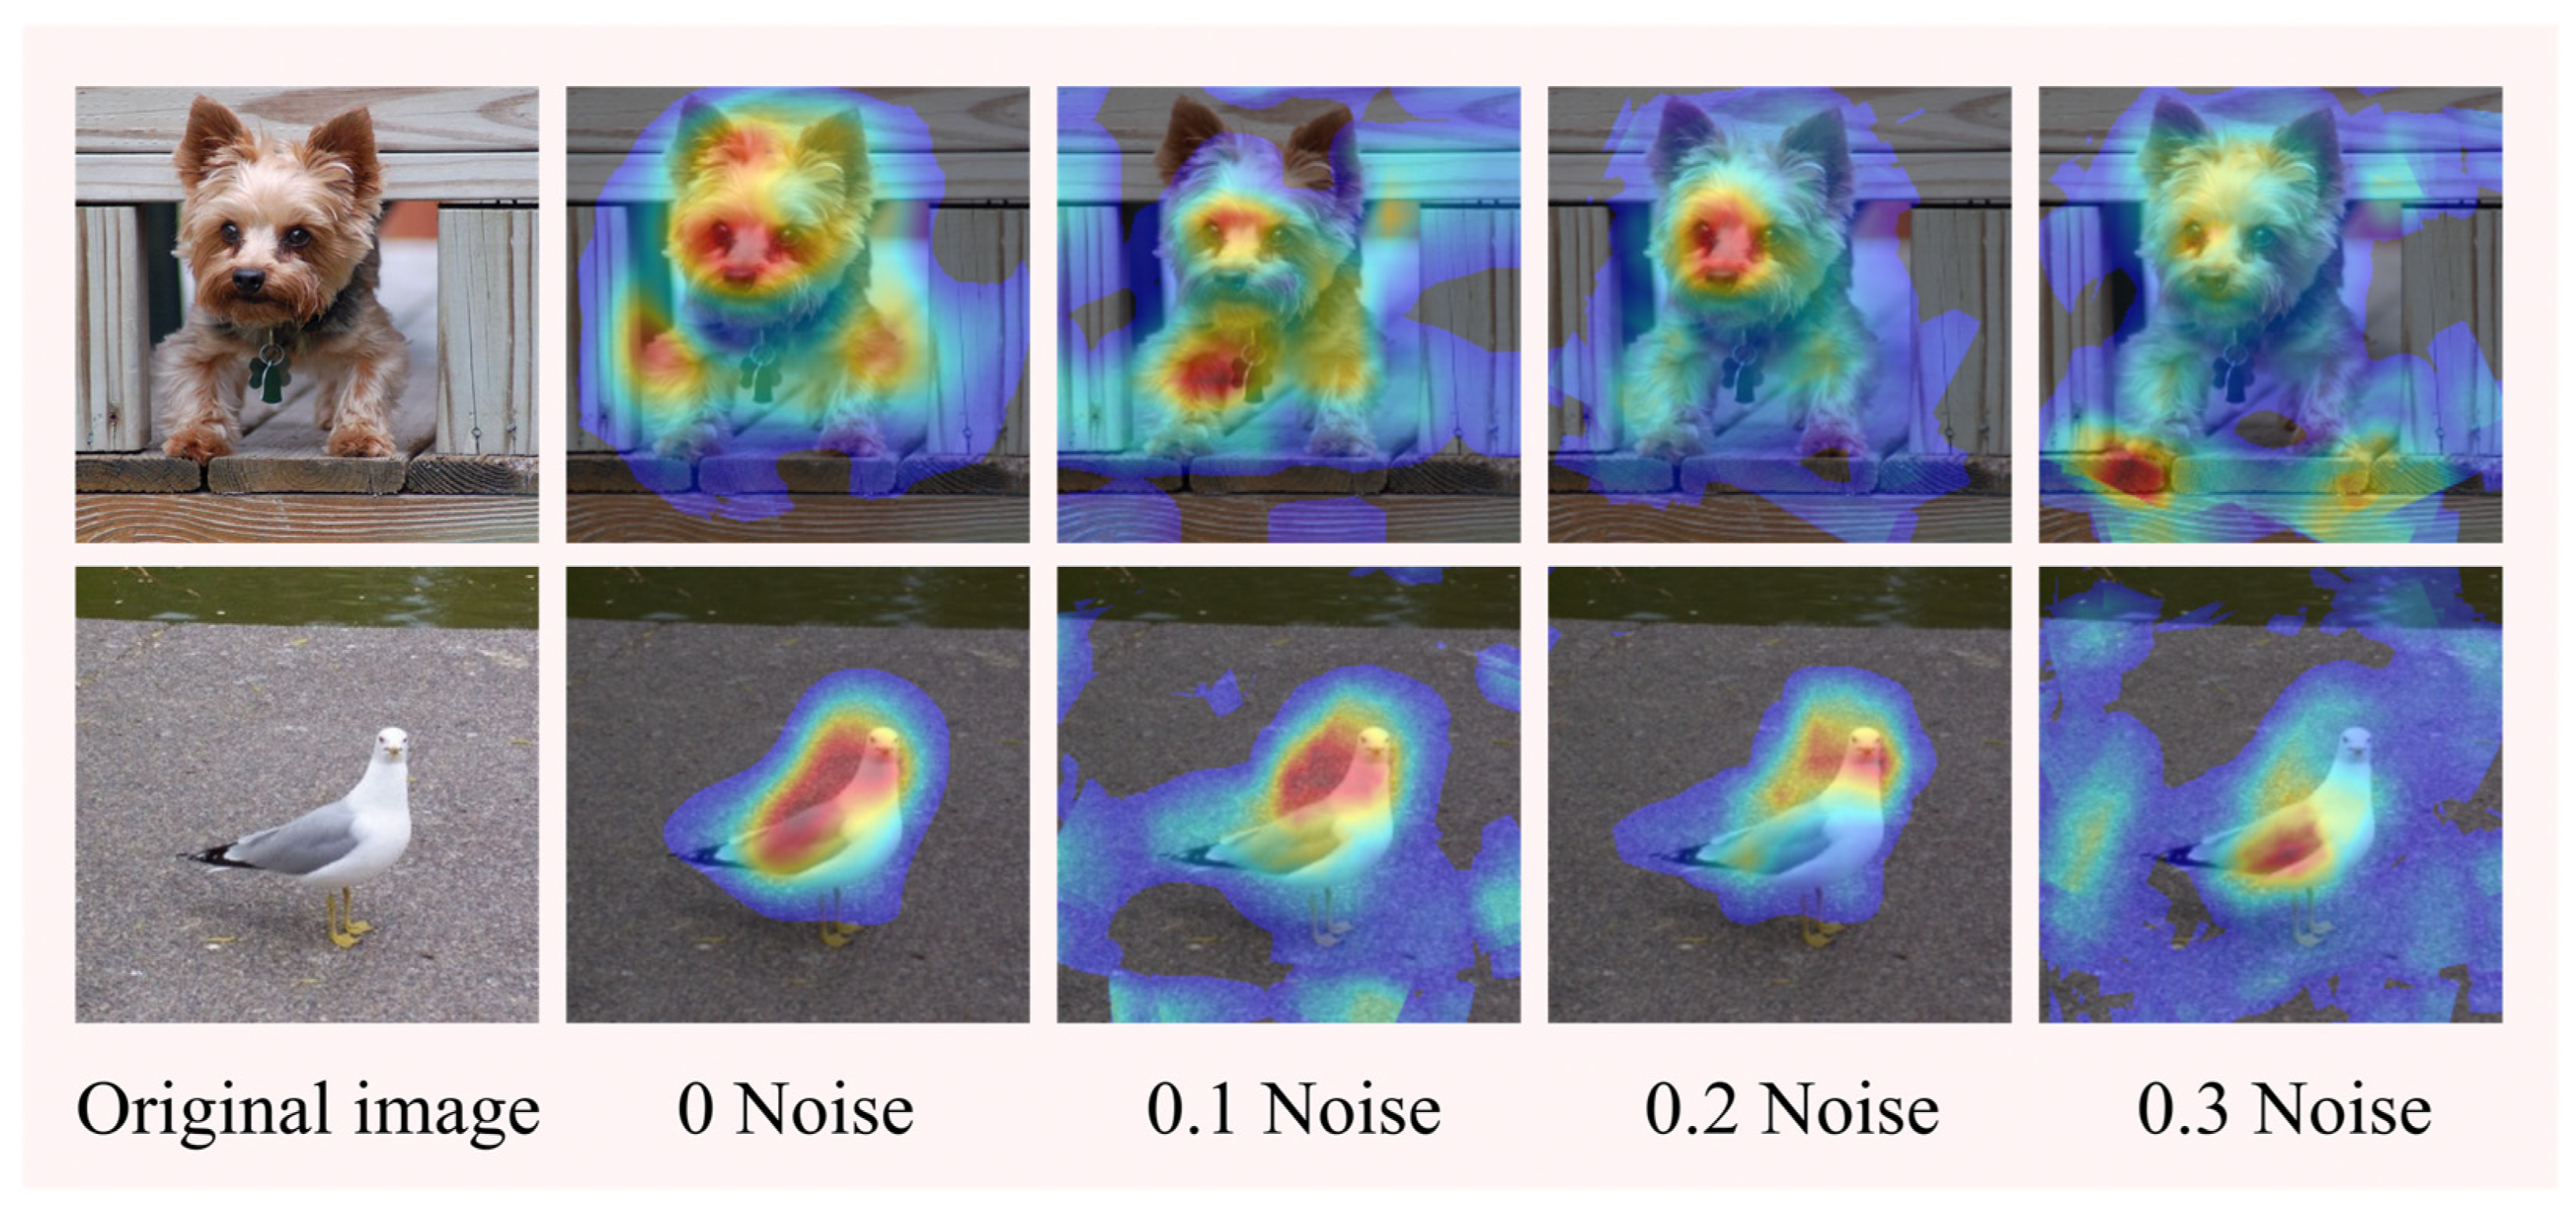
In this section, experiments were conducted using pre-trained models with different parameters. First, four VGG-19 models were pre-trained with one model weighted randomly, and Gaussian noise of 0.1, 0.2, and 0.3 was added to the weights of the other three pre-trained models [55]. The validation of the four pre-trained models was first performed in the ImageNet (ILSVRC2012) validation set. The results show that the model accuracy decreases after adding noise, and Table 6 shows the noise and accuracy of the pre-trained models.
Table 6.
Effect of different noise on model accuracy.
The experiments use four pre-trained models with different accuracies to create Augmented Grad-CAM++ activation mappings for the same images. As shown in the figure showing the original image and the saliency maps with added noise, it can be seen that as the model accuracy decreases, the focus of the generated saliency maps decreases, but the target object can still be identified, and the model has good stability and robustness. Figure 10 shows the saliency maps created by the different models.

Figure 10.
Model randomization for integrity checking.
The integrity check experiment shows that Augmented Grad-CAM++ can effectively identify the target object in the case of data and model randomization. The integrity check experiments demonstrate that Augmented Grad-CAM++ can effectively localize the target objects in images and generate saliency maps in different cases, and Augmented Grad-CAM++ can be used as a fully reliable interpretation of the pre-trained model.
4.7.3. Scalability of the Model
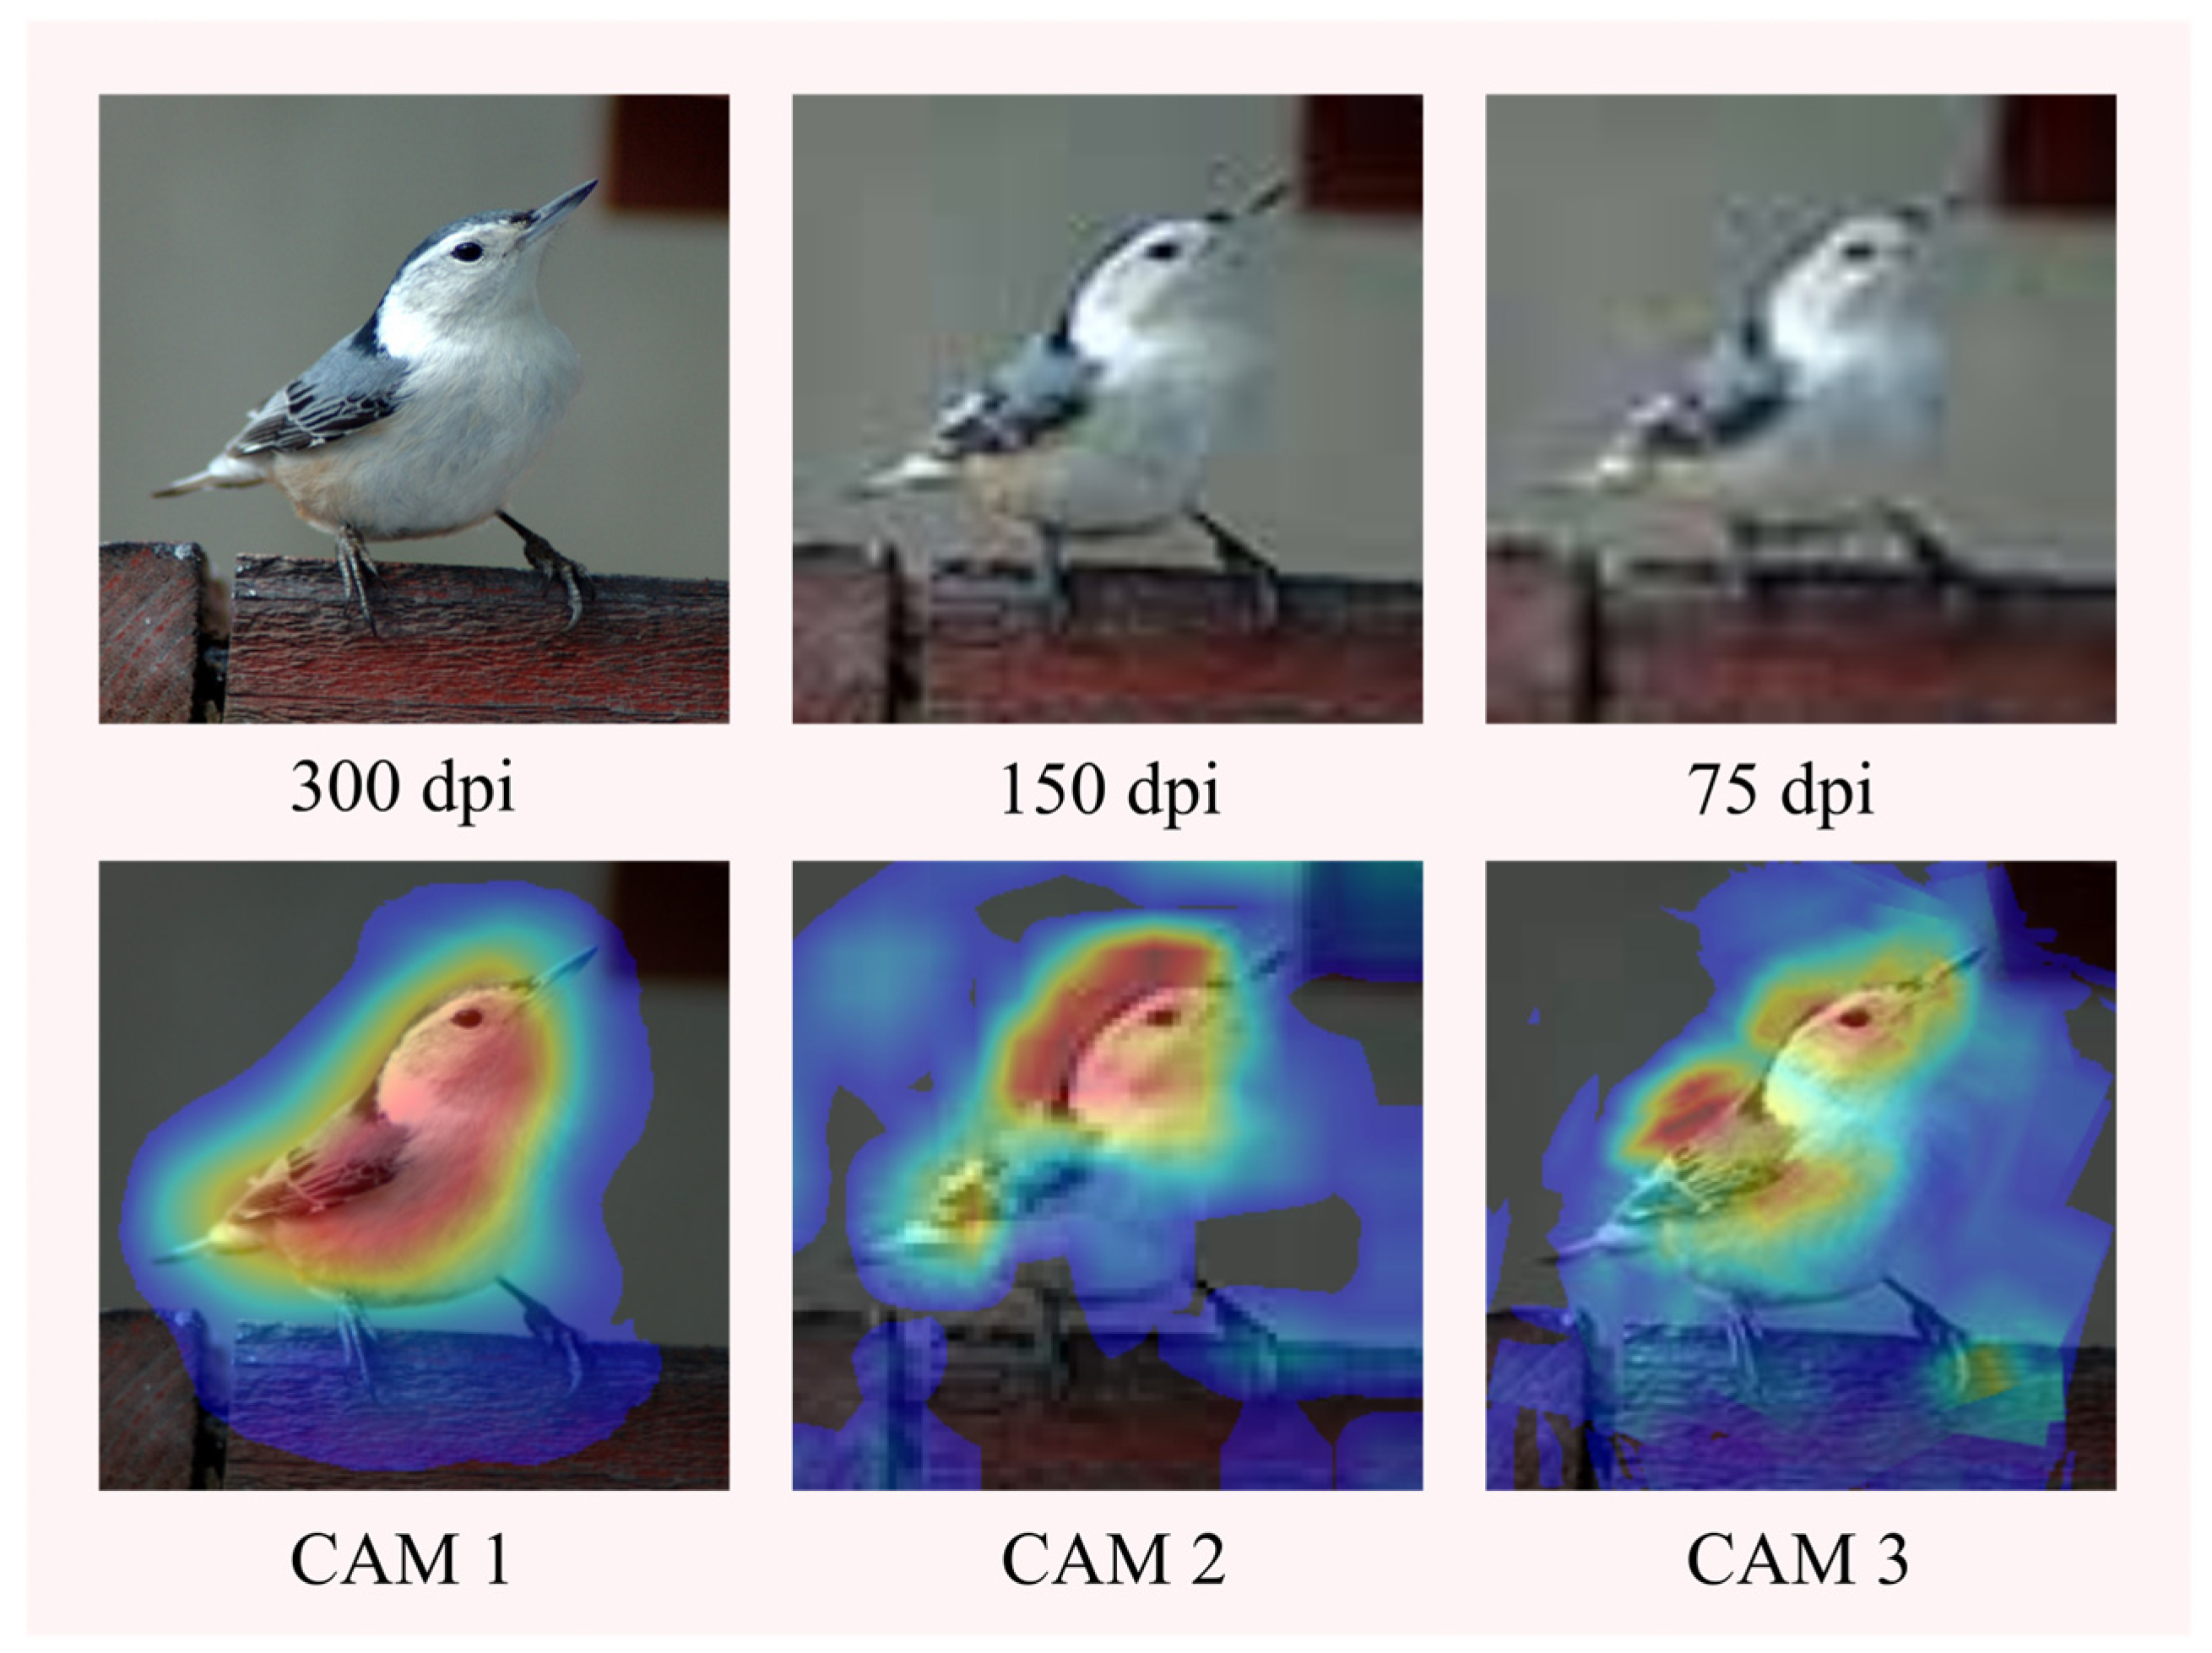
In this section, we use the pre-trained VGG-19 model to test the effect of different numbers of augmented images on the execution time of Augmented Grad-CAM++ and the effect of different resolution images on the quality of the saliency maps. For different numbers of augmented images, 100, 150, and 200 augmented images were generated for testing the runtime, and the resolution was set differently at 300 dpi, 150 dpi, and 75 dpi for the three kinds of high, medium, and low resolution images, respectively, to generate saliency maps. The significance mapping for different image resolutions is shown in Figure 11. The effect of different resolutions and number of images on time is shown in Table 7.
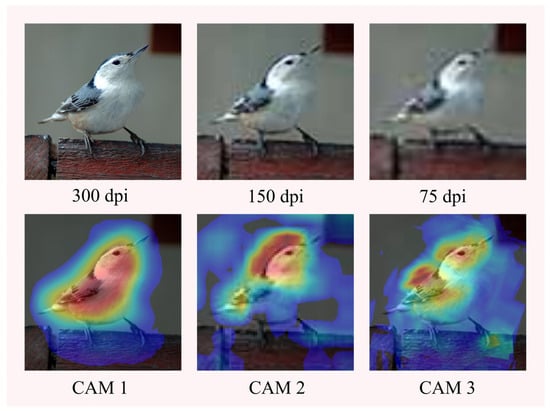
Figure 11.
Significance mapping for different image resolutions.
Table 7.
Effect of different resolutions and number of images on time.
Scalability analysis shows that changing the image resolution does not affect the execution time, which becomes progressively longer as the number of augmented images grows. Augmented Grad-CAM++ generates well-focused saliency maps for high-resolution images, and as the resolution decreases, the quality of the saliency maps decreases, but the target objects can be identified.
The integrity check experiment shows that Augmented Grad-CAM++ can effectively identify the target object in the case of data and model randomization. The execution time is the same when the number of augmented images is the same and the resolutions are different. In the case of high, medium, and low-resolution images, the execution time is 56.59 s when the number of augmented images is 100; in the case of high, medium, and low-resolution images, the execution time is 84.67 s when the number of augmented images is 150; and in the case of high, medium, and low-resolution of images, the execution time is 120.72 s, and the target object can be recognized in all three cases. The Integrity check experiments demonstrate that Augmented Grad-CAM++ can effectively localize the target objects in images and generate saliency maps in different cases, and Augmented Grad-CAM++ can be used as a fully reliable interpretation of the pre-trained model.
4.8. Analysis of Complexity
In conventional models, saliency maps are typically generated based on a single input image. In contrast, this paper introduces an iterative approach wherein the model progressively enhances the dataset by iterating over several enhanced images denoted as “n.” For each enhanced image, the model extracts features to generate activation maps, subsequently amalgamating them into a comprehensive saliency map. The complexity analysis of the model’s iteration time is conducted using the big O notation and FLOPs method, offering insights into its computational efficiency. Firstly, Grad-CAM++ first computes the category confidence score of each category based on the neuron weights continuously iteratively, then computes the feature mapping weights, and then performs the ReLU operation to combine them into the final significant mapping map . Therefore, the complexity of Grad-CAM++ is , which indicates that it is related to the number of pixels of the input image. Compute the complexity of Augmented Grad-CAM++. The computational model complexity is , which is proportional to the size of the input image and the number of augmentations and is squared. The FLOPs comparison for different methods is presented in Table 8.
Table 8.
Values of FLOPs for different methods.
Due to the introduction of image augmentation and super-resolution in Augmented Grad-CAM++, FLOPs are slightly higher compared to other methods.
4.9. Visualization of Industrial Surface Defect Detection
Due to the superior feature learning capabilities of deep learning models, which can automatically learn high-level representations relevant to the task and adapt to complex image data and diverse defect types while also providing an end-to-end learning framework, deep learning methods are extensively applied in industrial defect detection, simplifying the overall system design.
In this section, an experimental study on the localization of industrial surface defects is conducted, comparing it with traditional class activation mapping methods. The objective is to validate the interpretability of the proposed approach in the industrial domain, demonstrating that Augmented Grad-CAM++ can identify object localization information in fine-grained images. This capability allows for the localization and visualization of various shapes of minor defects in industrial images [56]. The experiment is performed using a dataset of 431 images of wind turbine damage, and it is conducted on the pre-trained VGG19 model.
Grad-CAM, Grad-CAM++, Score-CAM, and Augmented Grad-CAM++ were applied to VGG19 to generate saliency maps of industrial defect images, respectively. Augmented grad-CAM++ was measured by human trust assessment, pointing games, mIoU values, and pixel deletion and insertion experiments for industrial defect localization in small sizes and multiple damage shapes.
4.9.1. Human Trust Assessment
The saliency maps created by each of the four methods were presented to 40 participants from different industries, 20 males and 20 females, to make a choice among the four saliency maps. Table 9 shows the results of the human trust assessment experiment on an industrial surface.
Table 9.
Human trust method assessment.
The results indicate that the Augmented Grad-CAM++ model of industrial surface defects visualization results is more trusted by humans and more helpful for human decision-making processes and results analysis.
4.9.2. Pointing Game
The pointing game was used to evaluate the quality of the significant mapping maps of industrial defects generated by Augmented Grad-CAM++, and the experimental results are presented in Table 10.
Table 10.
Percentage distribution of energy extremes within object boundaries.
From Table 10, it can be seen that the energy value distribution of Augmented Grad-CAM++ is 45.8%, which is higher than that of other methods, and the distribution of the generated significant mapping map is more concentrated than that of other methods, which is better for the visualization of defects on industrial surfaces.
4.9.3. Insertion and Deletion of Pixel Tests
This section performs experiments on the insertion and deletion of pixels in images to evaluate the effectiveness of different methods for creating significant mapping maps of industrial defect images. Figure 12 shows examples of inserted and deleted images and curves. Table 11 shows the confidence scores for the different methods of inserting and deleting curves.
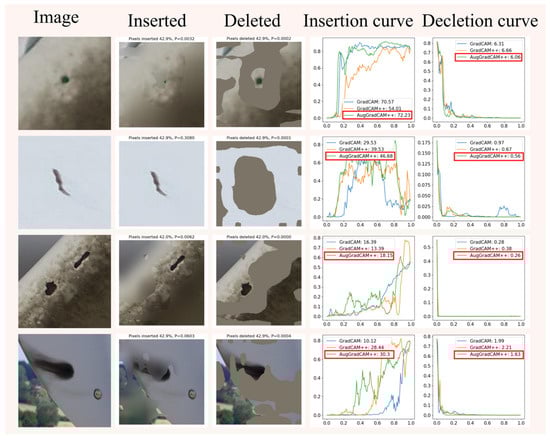
Figure 12.
Examples and curves of inserted and deleted pixels for industrial images.
Table 11.
AUC composite scores for inserted and deleted pixels.
The experimental results show that Augmented Grad-CAM++ is more adept at capturing important features in an image than other methods, allowing for more accurate visualization of defects in industrial images.
4.9.4. Weakly Supervised Target Localization Experiments
Weakly supervised target localization experiments were used to evaluate the effectiveness of the model in locating target defects in industrial defect images. The experimental results are shown in Table 12.
Table 12.
Miou of different methods.
From the experimental results in Table 12, it can be seen that Augmented Grad-CAM++ has a higher mIoU value for defect localization than the other methods, and the visualization of defects on industrial surfaces is more accurate than Grad-CAM, Grad-CAM++, and ScoreCAM.
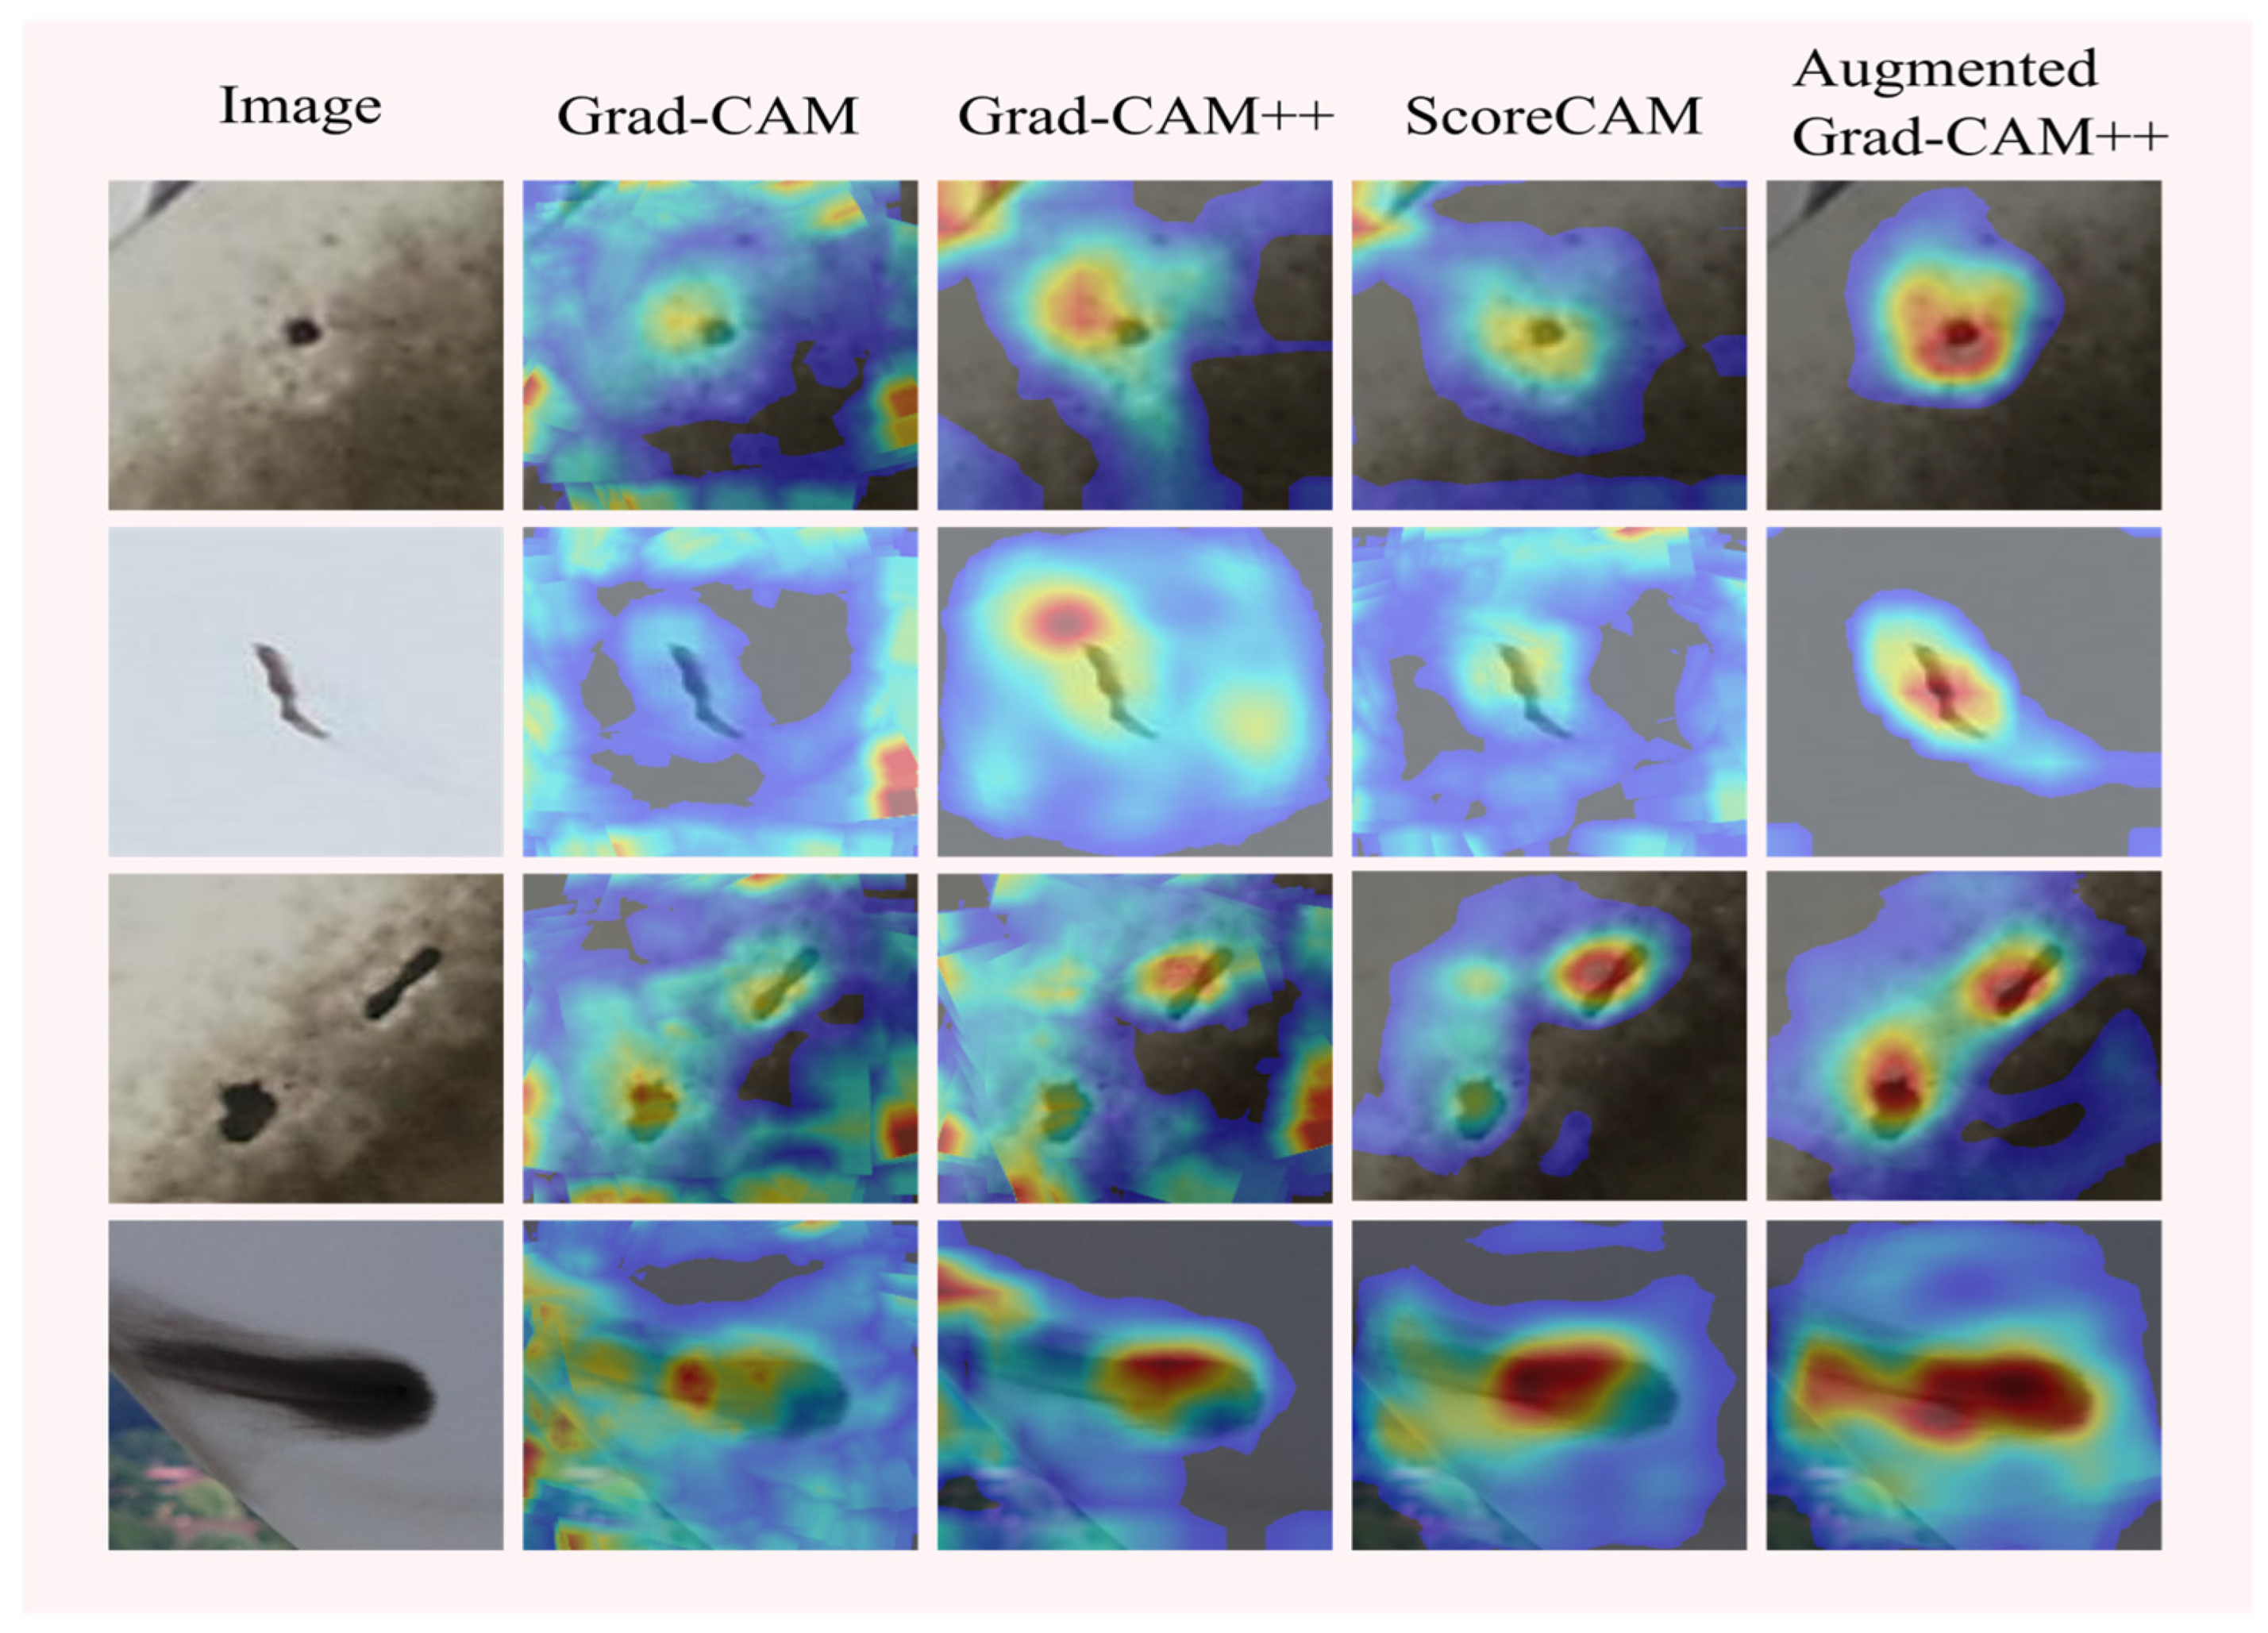
Figure 13 illustrates the comparison between different methods. The first column shows the input images, and on the right side are the saliency maps generated by four different methods. From the figure, it can be observed that Grad-CAM, Grad-CAM++, and ScoreCAM fail to achieve precise visualization of defects in the images. In contrast, Augmented Grad-CAM++ accurately visualizes defects of various shapes.
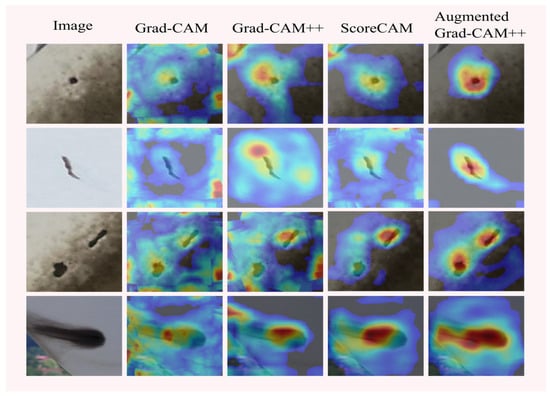
Figure 13.
Saliency maps of industrial defects.
The experimental results of defect localization on industrial surfaces show that Augmented Grad-CAM++ locates and visualizes single defects and multiple defects occurring in industry, with saliency maps distributed centrally at the defect locations, while the saliency maps of the traditional method are scattered in the images, and Augmented Grad-CAM++ has better interpretability of the model than the traditional method. The visualization perspective explains that the deep learning network model focuses on the location of the defect in the image during the learning of industrial surface defect features, pays more attention to the central features in the defect during localization, makes the detection results match the real location of the defect better, establishes the connection between the output class of the deep learning network and the target class, and realizes the interpretability study of the deep learning network model in the field of industrial surface defect detection from the visualization perspective [57].
5. Conclusions
In this paper, a new method for visual interpretation of deep learning models, Augmented Grad-CAM++, is proposed. By combining image geometry augmentation and super-resolution techniques, the created saliency maps are not only able to accurately locate and visualize target objects but also have higher resolution, are more interpretative while providing critical feature selection information, and can better reflect the focus and decision process of deep neural networks on images. By introducing image geometry augmentation techniques, it is possible to extract more comprehensive and accurate features from multiple augmented images to capture the subtle differences of the target objects. Meanwhile, the introduction of super-resolution techniques enables the reconstruction of the pixels of the saliency maps to improve their details and sharpness, making them more interpretable. The experimental results show that the Augmented Grad-CAM++ method outperforms existing conventional methods in terms of target localization and saliency map resolution. In practical applications, this paper verifies the effectiveness of the Augmented Grad-CAM++ method in the field of industrial surface defect detection. By analyzing industrial defect images, defects can be accurately identified and localized, providing strong support for quality control and defect detection. This demonstrates the great potential and application prospects of the method in the industrial field.
Author Contributions
Conceptualization, Y.G. and J.L.; methodology, Y.G.; software, M.H.; validation, Y.G., W.L. and M.H.; formal analysis, Y.L.; investigation, M.H.; resources, H.Z.; data curation, J.L.; writing—original draft preparation, Y.G.; writing—review and editing, W.L. and H.Z.; visualization, Y.L.; supervision, M.H.; project administration, H.Z.; funding acquisition, H.Z. All authors have read and agreed to the published version of the manuscript.
Funding
This research was funded by National Natural Science Foundation of China, grant number 52372436, and the Research and Innovation Funding Project for Postgraduates of Civil Aviation University of China under Grant 2022YJS015.
Institutional Review Board Statement
Not applicable.
Informed Consent Statement
Not applicable.
Data Availability Statement
Data are contained within the article.
Acknowledgments
The authors would like to thank all the reviewers for their constructive comments.
Conflicts of Interest
Authors Jie Liu and Yang Li was employed by the company Anhui CQC-CHEARI Technology Co., Ltd. The remaining authors declare that the research was conducted in the absence of any commercial or financial relationships that could be construed as a potential conflict of interest.
References
- Ibrahim, I.R.; Shafiq, M.O. Augmented Score-CAM: High resolution visual interpretations for deep neural networks. Knowl.-Based Syst. 2022, 252, 109287. [Google Scholar] [CrossRef]
- Teng, Q.; Liu, Z.; Song, Y.; Han, K.; Lu, Y. A survey on the interpretability of deep learning in medical diagnosis. Multimed. Syst. 2022, 28, 2335–2355. [Google Scholar] [CrossRef] [PubMed]
- Ibrahim, I.R.; Shafiq, M.O. Explainable Convolutional Neural Networks: A Taxonomy, Review, and Future Directions. ACM Comput. Surv. 2023, 55, 206. [Google Scholar] [CrossRef]
- Zhou, X.; Cai, X.; Zhang, H.; Zhang, Z.; Jin, T.; Chen, H.; Deng, W. Multi-strategy competitive-cooperative co-evolutionary algorithm and its application. Inform. Sci. 2023, 635, 328–344. [Google Scholar] [CrossRef]
- Li, X.; Zhao, H.; Deng, W. BFOD: Blockchain-based privacy protection and security sharing scheme of flight operation data. IEEE Internet Things J. 2023. [Google Scholar] [CrossRef]
- Xiao, Y.; Shao, H.; Feng, M.; Han, T.; Wan, J.; Liu, B. Towards trustworthy rotating machinery fault diagnosis via attention uncertainty in Transformer. J. Manuf. Syst. 2023, 70, 186–201. [Google Scholar] [CrossRef]
- Chen, X.; Shao, H.; Xiao, Y.; Yan, S.; Cai, B.; Liu, B. Collaborative fault diagnosis of rotating machinery via dual adversarial guided unsupervised multi-domain adaptation network. Mech. Syst. Signal Process. 2023, 198, 110427. [Google Scholar] [CrossRef]
- Yan, S.; Shao, H.; Min, Z.; Peng, J.; Cai, B.; Liu, B. FGDAE: A new machinery anomaly detection method towards complex operating conditions. Reliab. Eng. Syst. Saf. 2023, 236, 109319. [Google Scholar] [CrossRef]
- Voulodimos, A.; Doulamis, N.; Doulamis, A.; Protopapadakis, E. Deep learning for computer vision: A brief review. Comput. Intell. Neurosci. 2018, 2018, 7068349. [Google Scholar] [CrossRef]
- Dong, S.; Wang, P.; Abbas, K. A survey on deep learning and its applications. Comput. Sci. Rev. 2021, 40, 100379. [Google Scholar] [CrossRef]
- Li, X.H.; Cao, C.C.; Shi, Y.; Bai, W.; Gao, H.; Qiu, L.; Wang, C.; Gao, Y.; Zhang, S.; Xue, X.; et al. A survey of data-driven and knowledge-aware explainable ai. IEEE Trans. Knowl. Data Eng. 2020, 34, 29–49. [Google Scholar] [CrossRef]
- Du, M.; Liu, N.; Hu, X. Techniques for interpretable machine learning. Commun. ACM 2019, 63, 68–77. [Google Scholar] [CrossRef]
- Zachary, C.L. The mythos of model interpretability. Queue 2018, 16, 31–57. [Google Scholar]
- Shu, Y.; Jin, T. Stability in measure and asymptotic stability of uncertain nonlinear switched systems with a practical application. Int. J. Control. 2023, 96, 2917–2927. [Google Scholar] [CrossRef]
- Zhao, H.; Wu, Y.; Deng, W. An interpretable dynamic inference system based on fuzzy broad learning. IEEE Trans. Instrum. Meas. 2023, 72, 2527412. [Google Scholar] [CrossRef]
- Zhen, Y.; Yang, H.; Guo, D.; Lin, Y. Improving airport arrival flow prediction considering heterogeneous and dynamic network dependencies. Inf. Fusion 2023, 100, 101924. [Google Scholar]
- Li, M.; Zhang, W.; Hu, B.; Kang, J.; Wang, Y.; Lu, S. Automatic assessment of depression and anxiety through encoding pupil-wave from HCI in VR scenes. ACM Trans. Multimed. Comput. Commun. Appl. 2023, 20, 1–22. [Google Scholar] [CrossRef]
- Yang, J.; Zhang, Y.; Jin, T.; Lei, Z.; Todo, Y.; Gao, S. Maximum Lyapunov exponent-based multiple chaotic slime mold algorithm for real-world optimization. Sci. Rep. 2023, 13, 12744. [Google Scholar] [CrossRef]
- Xie, C.; Zhou, L.; Ding, S.; Liu, R.; Zheng, S. Experimental and numerical investigation on self-propulsion performance of polar merchant ship in brash ice channel. Ocean. Eng. 2023, 269, 113424. [Google Scholar] [CrossRef]
- Zhao, H.; Liu, J.; Chen, H.; Chen, J.; Li, Y.; Xu, J.; Deng, W. Intelligent diagnosis using continuous wavelet transform and gauss convolutional deep belief network. IEEE Trans. Reliab. 2023, 72, 692–702. [Google Scholar] [CrossRef]
- Zeiler, M.D.; Fergus, R. Visualizing and understanding convolutional networks. In Proceedings of the Computer Vision–ECCV 2014: 13th European Conference, Zurich, Switzerland, 6–12 September 2014; Proceedings, Part I 13. Springer International Publishing: Berlin/Heidelberg, Germany, 2014; pp. 818–833. [Google Scholar]
- Pezeshkpour, P.; Tian, Y.; Singh, S. Investigating robustness and interpretability of link prediction via adversarial modifications. arXiv 2019, arXiv:1905.00563. [Google Scholar]
- Shwartz-Ziv, R.; Tishby, N. Opening the black box of deep neural networks via information. arXiv 2017, arXiv:1703.00810. [Google Scholar]
- Ribeiro, M.T.; Singh, S.; Guestrin, C. “Why should i trust you?” Explaining the predictions of any classifier. In Proceedings of the 22nd ACM SIGKDD International Conference on Knowledge Discovery and Data Mining, San Francisco, CA, USA, 13–17 August 2016; pp. 1135–1144. [Google Scholar]
- Zhou, B.; Khosla, A.; Lapedriza, A.; Oliva, A.; Torralba, A. Learning deep features for discriminative localization. In Proceedings of the IEEE Conference on Computer Vision and Pattern Recognition, Las Vegas, NV, USA, 26 June–1 July 2016; pp. 2921–2929. [Google Scholar]
- Selvaraju, R.R.; Cogswell, M.; Das, A.; Vedantam, R.; Parikh, D.; Batra, D. Grad-cam: Visual explanations from deep networks via gradient-based localization. In Proceedings of the IEEE International Conference on Computer Vision, Venice, Italy, 22–29 October 2017; pp. 618–626. [Google Scholar]
- Chattopadhyay, A.; Sarkar, A.; Howlader, P.; Balasubramanian, V.N. Grad-CAM: Improved visual explanations for deep convolutional networks. arXiv 2017, arXiv:1710.11063. [Google Scholar]
- Wang, H.; Wang, Z.; Du, M.; Yang, F.; Zhang, Z.; Ding, S.; Mardziel, P.; Hu, X. Score-CAM: Score-weighted visual explanations for convolutional neural networks. In Proceedings of the IEEE/CVF Conference on Computer Vision and Pattern Recognition Workshops, Seattle, WA, USA, 14–19 June 2020; pp. 24–25. [Google Scholar]
- Jiang, P.T.; Zhang, C.B.; Hou, Q.; Cheng, M.M.; Wei, Y. Layercam: Exploring hierarchical class activation maps for localization. IEEE Trans. Image Process. 2021, 30, 5875–5888. [Google Scholar] [CrossRef]
- Zhang, Q.; Rao, L.; Yang, Y. Group-cam: Group score-weighted visual explanations for deep convolutional networks. arXiv 2021, arXiv:2103.13859. [Google Scholar]
- Zhang, L.; Chen, D.; Ma, J.; Zhang, J. Remote-sensing image superresolution based on visual saliency analysis and unequal reconstruction networks. IEEE Trans. Geosci. Remote Sens. 2020, 58, 4099–4115. [Google Scholar] [CrossRef]
- Liu, Z.; Tian, J.; Chen, L.; Wang, Y. Saliency adaptive super-resolution image reconstruction. Opt. Commun. 2012, 285, 1039–1043. [Google Scholar] [CrossRef]
- Liu, B.; Zhao, L.; Li, J.; Zhao, H.; Liu, W.; Li, Y.; Wang, Y.; Chen, H.; Cao, W. Saliency-guided remote sensing image super-resolution. Remote Sens. 2021, 13, 5144. [Google Scholar] [CrossRef]
- Li, X.; Zhao, H.; Yu, L.; Chen, H.; Deng, W.; Deng, W. Feature Extraction Using Parameterized Multisynchrosqueezing Transform. IEEE Sens. J. 2022, 22, 14263–14272. [Google Scholar] [CrossRef]
- Gu, Y.; Zhou, L.; Ding, S.; Tan, X.; Gao, J.; Zhang, M. Numerical simulation of ship maneuverability in level ice considering ice crushing failure. Ocean. Eng. 2022, 251, 111110. [Google Scholar] [CrossRef]
- Wu, X.; Wang, Z.; Wu, T.; Bao, X. Solving the family traveling salesperson problem in the Adleman–Lipton model based on DNA Computing. IEEE Trans. NanoBiosci. 2022, 21, 75–85. [Google Scholar] [CrossRef] [PubMed]
- Deng, W.; Li, Z.; Li, X.; Chen, H.; Zhao, H. Compound fault diagnosis using optimized MCKD and sparse representation for rolling bearings. IEEE Trans. Instrum. Meas. 2022, 71, 3508509. [Google Scholar] [CrossRef]
- Zhang, Z.; Guo, D.; Zhou, S.; Zhang, J.; Lin, Y. Flight trajectory prediction enabled by time-frequency wavelet transform. Nat. Commun. 2023, 14, 5258. [Google Scholar] [CrossRef]
- Wang, Z.; Wang, Q.; Wu, T. A novel hybrid model for water quality prediction based on VMD and IGOA optimized for LSTM. Front. Environ. Sci. Eng. 2023, 17, 88. [Google Scholar] [CrossRef]
- Yao, Z.; Wang, Z.; Wang, D.; Wu, J.; Chen, L. An ensemble CNN-LSTM and GRU adaptive weighting model based improved sparrow search algorithm for predicting runoff using historical meteorological and runoff data as input. J. Hydrol. 2023, 625, 129977. [Google Scholar] [CrossRef]
- Morbidelli, P.; Carrera, D.; Rossi, B.; Fragneto, P.; Boracchi, G. Augmented Grad-CAM: Heat-maps super resolution through augmentation. In Proceedings of the ICASSP 2020—2020 IEEE International Conference on Acoustics, Speech and Signal Processing (ICASSP), Barcelona, Spain, 4–8 May 2020; pp. 4067–4071. [Google Scholar]
- Li, M.; Zhang, J.; Song, J.; Li, Z.; Lu, S. A clinical-oriented non severe depression diagnosis method based on cognitive behavior of emotional conflict. IEEE Trans. Comput. Soc. Syst. 2022, 10, 131–141. [Google Scholar] [CrossRef]
- Zhao, H.M.; Zhang, P.P.; Zhang, R.C.; Yao, R.; Deng, W. A novel performance trend prediction approach using ENBLS with GWO. Meas. Sci. Technol. 2023, 34, 025018. [Google Scholar] [CrossRef]
- Xu, J.J.; Zhao, Y.L.; Chen, H.Y.; Deng, W. ABC-GSPBFT: PBFT with grouping score mechanism and optimized consensus process for flight operation data-sharing. Inf. Sci. 2023, 624, 110–127. [Google Scholar] [CrossRef]
- Mundhenk, T.N.; Chen, B.Y.; Friedland, G. Efficient saliency maps for explainable AI. arXiv 2019, arXiv:1911.11293. [Google Scholar]
- Rai, A. Explainable AI: From black box to glass box. J. Acad. Mark. Sci. 2020, 48, 137–141. [Google Scholar] [CrossRef]
- Taylor, L.; Nitschke, G. Improving deep learning with generic data augmentation. In Proceedings of the 2018 IEEE Symposium Series on Computational Intelligence (SSCI), Bengaluru, India, 18–21 November 2018; IEEE: New York, NY, USA, 2018; pp. 1542–1547. [Google Scholar]
- Bloice, M.D.; Roth, P.M.; Holzinger, A. Biomedical image augmentation using Augmentor. Bioinformatics 2019, 35, 4522–4524. [Google Scholar] [CrossRef] [PubMed]
- Deng, J.; Dong, W.; Socher, R.; Li, L.J.; Li, K.; Fei-Fei, L. Imagenet: A large-scale hierarchical image database. In Proceedings of the 2009 IEEE Conference on Computer Vision and Pattern Recognition, Miami, FL, USA, 20–25 June 2009; IEEE: New York, NY, USA, 2009; pp. 248–255. [Google Scholar]
- Russakovsky, O.; Deng, J.; Su, H.; Krause, J.; Satheesh, S.; Ma, S.; Huang, Z.; Karpathy, A.; Khosla, A.; Bernstein, M.; et al. Imagenet large scale visual recognition challenge. Int. J. Comput. Vis. 2015, 115, 211–252. [Google Scholar] [CrossRef]
- Van der Maaten, L.; Hinton, G. Visualizing data using t-SNE. J. Mach. Learn. Res. 2008, 9, 2579–2605. [Google Scholar]
- Samek, W.; Binder, A.; Montavon, G.; Lapuschkin, S.; Müller, K.R. Evaluating the visualization of what a deep neural network has learned. IEEE Trans. Neural Netw. Learn. Syst. 2016, 28, 2660–2673. [Google Scholar] [CrossRef] [PubMed]
- Petsiuk, V.; Das, A.; Saenko, K. Rise: Randomized input sampling for explanation of black-box models. arXiv 2018, arXiv:1806.07421. [Google Scholar]
- Kupferman, O. Sanity checks in formal verification. In Proceedings of the CONCUR 2006–Concurrency Theory: 17th International Conference, CONCUR 2006, Bonn, Germany, 27–30 August 2006; Proceedings 17. Springer: Berlin/Heidelberg, Germany, 2006; pp. 37–51. [Google Scholar]
- Goodfellow, I.J.; Shlens, J.; Szegedy, C. Explaining and harnessing adversarial examples. arXiv 2014, arXiv:1412.6572. [Google Scholar]
- Martin, D.; Heinzel, S.; von Bischhoffshausen, J.K.; Kühl, N. Deep learning strategies for industrial surface defect detection systems. arXiv 2021, arXiv:2109.11304. [Google Scholar]
- Lakkaraju, H.; Kamar, E.; Caruana, R.; Leskovec, J. Interpretable & explorable approximations of black box models. arXiv 2017, arXiv:1707.01154. [Google Scholar]

Disclaimer/Publisher’s Note: The statements, opinions and data contained in all publications are solely those of the individual author(s) and contributor(s) and not of MDPI and/or the editor(s). MDPI and/or the editor(s) disclaim responsibility for any injury to people or property resulting from any ideas, methods, instructions or products referred to in the content. |
© 2023 by the authors. Licensee MDPI, Basel, Switzerland. This article is an open access article distributed under the terms and conditions of the Creative Commons Attribution (CC BY) license (https://creativecommons.org/licenses/by/4.0/).