Abstract
Varistors processed from mixtures of certain metal oxides (as additives to the main component, zinc oxide, ZnO), called MOVs, represent the devices most used for overvoltage protection and are integrated into the construction of high-performance surge arresters. The manufacturing process of these powerful electronic devices is crucial for their electronic performance. For manufacturing temperature-related studies, we used two seven-varistor experimental series: one based on two added oxides and the other on five ones. The main goal of these series was to identify the suitable sintering temperature in the case of each chemical composition from the point of view of assessing the most important electric/electronic behavioral parameters. A simple study considering mass losses after the sintering process was carried out in order to provide a brief reference for the manufacturing engineers. Before performing these studies, each varistor was sintered at a different temperature. In order to draw a general set of conclusions about the impact of the sintering pressure on the main electrical and electronic performances, a second activity involved producing two additional smaller varistors series with similar chemical compositions (two main oxides and five main oxides as additives) all processed at two different sintering pressures 4900 N/cm2 and 9800 N/cm2. The electrical/electronic parameters considered for the assessment are the main current–voltage characteristics, the non-linearity logarithmic coefficient, and the normal operational leakage current. All electrical/electronic behavioral tests were performed according to the IEC standards and regulations for both types of varistor devices (seven different temperatures and two pressure values). We concluded that a sintering temperature of 1300 °C and a pressure of 4900 N/cm2 are optimal for both types of varistors (with two and five additives).
1. Introduction
Surge protection equipment that uses metal oxide varistors (also known as MOVs or ZnO-based varistors) is a relatively recent development that can be directly attributed to the current global push to boost the reliability and stability of power grids, strengthen the security of electrical power supply grids, and fulfill the needs and requirements of diverse groups of power consumers [1]. The main functional improvements that can be made to these varistors, integrated into surge protection equipment, result from changing their manufacturing technology by changing the initial chemical composition and some parameters of the sintering cycle (temperature and pressure) [2]. One problem that arises during their service is ensuring the optimal electrical parameters (the nominal leakage current, the main electrical characteristics, the non-linearity coefficient, and the energy absorption capacity) [3]. This study is meant to maintain the electric equipment in an optimized service condition for as long as practically feasible, given that a certain electric current passing through a ZnO-based varistor is greatly impacted by temperature [1].
This paper aims to offer some technical solutions regarding the improvement of the physical or chemical properties of varistor materials from the perspective of creating new products.
The solutions aimed at the actual varistor belong to the field of chemistry and physics of materials, but they are in direct correlation with the field of applicability, namely the energetical one, which dictates both the values of these quantities and the testing techniques of these materials [1].
MOVs consist of a round or rectangular body of zinc oxide sintered with the appropriate additives. Other uses include tubular shapes and multilayer structures. Varistors have electrodes with metal particles consisting of an alloy of silver or another metal. Electrodes may have been applied to the body by screening and sintering or other processes, depending on the metal used. Varistors also often have wire or thread leads or a sub-type of termination that could have been attached to the electrode.
The basic MOV conduction mechanism results from semiconducting junctions (made of additive oxides) at the boundary of zinc oxide grains formed during the sintering process. The varistor can be considered a multiple-junction device, with many grains acting in series-parallel combinations between the terminals.
Varistors have the property of maintaining a relatively small voltage change across their terminals, while the surge current flowing through them varies over several periods. This non-linear action allows them to divert the current of a surge when it is shunted across the line and limit the voltage across the line to values that protect the equipment connected to that line.
First, the main operations of the manufacturing process of MOVs will be briefly detailed below [4,5].
1.1. Manufacturing Technology of MOVs
Pure crystalline powders of oxides used as ingredients are provided as raw materials. ZnO crystals form the backbone of the composition [6], and their sizes vary depending on the oxides used [7], although they are always less than 10 μm. Other oxides, including Ba, Pr, Bi, La, Mn, Sr, Ni, Co, Sb, B, Ti, Cr, and Si, may be introduced into the varistor material to highlight its unique features [8].
Reference is made in this article to the technology we developed at the “Génie Électrique—LAPLACE” lab, at the Paul Sabatier III University of Toulouse (in France) [8], that is used to fabricate a set of varistors for use in subsequent experiments and become acquainted with manufacturing.
The field of use of ZnO-based varistors is extremely vast and is included in the construction of surge protection equipment designed to operate at any voltage level, both in direct and alternating current.
The applications that call for this protection equipment are extremely numerous, from the electricity transport and distribution networks to the urban, railway, civil, and military telecommunications networks.
Recently, research has been performed on the use of ZnO-based varistors for the protection against overvoltage of power electronic devices. The conclusions issued in this article are valid for the entire range of existing varistors, regardless of the field of application and their nominal voltage [1].
Each varistor producer has its unique “recipe” for producing varistors, beginning with the original chemical composition and finishing with the technical production process activities [2,3]. Only the methods of testing the quality of the finished material are standardized [4,5], providing the user with a set of well-determined sizes through standardized procedures [6].
The whole traditional varistor production cycle is shown in Figure 1.
Listed below are the key points [9].
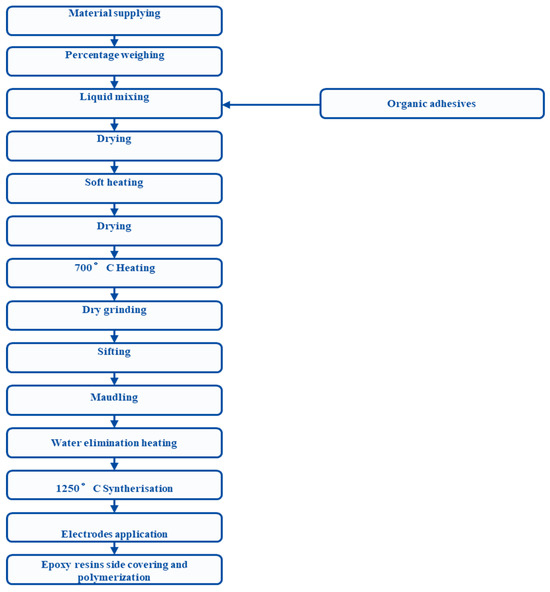
Figure 1.
The manufacturing process of an MOV.
Figure 1.
The manufacturing process of an MOV.

The chemical composition is the main factor affecting the electrical behavior of the MOV (ZnO-based) varistor.
All manufacturing process operations affect the final product, but for a certain chemical composition, sintering parameters (temperature and pressure) are the most important because they establish the spatial growth of the ZnO grain.
All main electrical parameters (current–voltage characteristic, non-linearity coefficient, opening voltage or leaking current) are mainly affected by the thermal cycles related to the syntherization of the varistor material and the pressure associated, as part of the material structural formation, as described in the literature [5,7,8].
The technological process operations for manufacturing MOVs (with particular/original improvements) are the following [5].
1.1.1. Weighing of All Components
The component weighing is made utilizing an electronic balance, with a sensibility of 0.1 mg [10]. All the oxides are sent as powders, and their granulometry is easily measured, making this a straightforward process [11]. We will explore the specifics of the investigated varistors’ original chemical composition with two and five additives.
The original molar concentrations are presented in Table 1 and Table 2, as proposed in many other papers by our team [5,7,8].

Table 1.
The two oxides material’s initial chemical mixture (+ZnO base).
Table 2.
The five oxides material’s initial chemical structure (+ZnO base).
The role of each additive/dopant is briefly described below:
- Non-linearity enhancer: Mn and Co;
- Non-linearity inducer: Bi;
- Grain growth retardant: Sb and Si;
- Varistor conductivity enhancer: Al;
- Grain growth enhancer: Al.
1.1.2. Fine Grinding and Homogenous Mixing
This is largely about obtaining the mixture of oxides as consistently as possible. To achieve this, milling is an absolute must. Following the procedure of being weighed, the oxides are next crushed inside a cylinder with heavy balls. The inclusion of pure water and a certain organic polymerization additive (original one) greatly facilitates our mixing process in the liquid phase [12]. This optimized procedure takes roughly 30 h. Due to the ball mix-restricted capacity, less material is generated. Normally, mixing is performed for 24 h in industrial facilities.
1.1.3. Drying, Light Heating, and Dry Grinding
A plastic-like material with a high viscosity is the result of the preceding process. When the water in the paste from the previous step has evaporated, the paste is dried in an oven or over a hot plate. The resulting powder has an irregular grain size [13]. As a consequence, it has to be milled once again; however, on this occasion, a dry grinding process lasts, on average, 8 to 10 h. Again, the homogeneous powder is preheated to roughly 200 °C before being milled [14]. A thermostatic oven is utilized to conduct this preheating.
1.1.4. Mixture Pressing
After placing the powder in a cylinder, it is compressed between 400 and 600 bar. The pressure applied differs from the pressing phase used for the main sintering [15]. The intended nominal leakage current (varistor diameter) and the threshold nominal voltage (varistor height) are used for assessing the dimensions of the desired pills (and the pressing molds, of course) (pillow height). We have chosen disk varistors with practical widths of 30 mm and a 3 mm height for our investigation.
1.1.5. Preheating
Before pressing and casting, the mixture is preheated once more, but this time to a temperature above 700 °C. Screening is still used to separate the granules from the powder that is larger than 200 μm after the dry grinding [16], even if it results in a generally adequate granulation. When shapes have been filled, this process makes it simpler to press the powder into them.
1.2. Sintering and Post-Sintering Procedures for MOVs
The most significant process is the physicochemical interaction between the different elements, influencing the final structure and all major characteristics of the varistor [17].
The sintering temperature is used to adjust the microstructure and improve the varistor ceramic material characteristics. Any increase in the sintering temperature would lead to improved grain growth for better electrical properties, as we will demonstrate. Various varistor manufacturers employ different temperature cycles. However, in terms of magnitude, they are the same. The first step entails performing a low-speed increase in the temperature gradient (at least 10 h) up to a level of 400 °C and holding the temperature constant for 3 h. Any remaining effluent is removed at this time.
The temperature is then increased to 840 °C for at least an hour while the pitching takes place. The material’s crystalline structure is achieved during this phase. The third step is a climb to 1250 °C again, followed by a moderate cooling to ambient temperature. All physicochemical processes appearing during this stage, inside the varistor, are not well described in the literature [18,19] due to the multiple components, the complexity of the thermal process, and the diversity of temperatures involved. When heated to 1250 °C, the additional oxides, beginning with bismuth oxide, partially evaporate.
The varistor heats up unevenly, with the surface having a greater impact than the center. The thermodynamic cycle parameters remain constant in industry regardless of the varistors’ chemical mixture [20]. This procedure causes the pill’s original volume [10] to be reduced by around 20% and its density to rise to the final density, which is around 5.7 g/cm3. A higher percentage of 98 up to 99% of this empirical value is reached via density correction. This will be emphasized by the reduced final pill size, which will see a reduction of 10% in diameter across all manufacturing series and a loss of 15% in height. The varistor body is finished at this point and is dark grey in color. Although slightly quicker than after pressing, it is more resistant [21]. Its color will turn light grey after being heated, and its mechanical strength will rise.
1.2.1. Deposition of Face Electrodes
Serigraphy or brush application of a conductive paste with an Ag or, less typically, an Al base is used to coat both sides of the cylindrical tablet after the samples have been sintered, creating the varistors or varistor cylinder electrodes.
1.2.2. Varistor Final Heating
The organic polymer is a component of the paste that was previously applied. An additional heat treatment higher than 600 °C is required for the electrode polymerization on both frontal faces in order to become metallic and, therefore, be the disk electrodes. Polymerization occurs on the electrodes as the solvent evaporates, incorporating Ag and Al in the resultant substance [13]. The layer will be completed by welding or gluing the bonding wires into position.
1.2.3. Resin Side Surface Covering
The sample’s edge is coated with an insulating epoxy resin. This liner is designed to shield the varistor from environmental influences and chemical aggressions, but it is most important to prevent any overburden that may happen while applying higher amplitude currents or high-voltage pulses. The device is preheated at 220 °C for 2 to 3 h to ensure the resin is deposed homogenously and polymerizes on the side surface. The MOV could be entirely integrated inside the epoxy resin, or epoxy may simply be deposed on the lateral side of the varistor. For this approach, 3 cm disc MOVs were utilized, and at 20 mm, complete coverage was accomplished. In the case of low-voltage devices, the thickness of the epoxy layer is typically 1 mm thick.
Afterward, the varistors will be put through quality control and assurance checks before being presented to the public. All specific details are well described in the literature [2,13,21].
2. Materials and Methods
Now that the manufacturing of MOVs has resumed, we noticed that grinding balls are used to evenly distribute zinc oxide throughout the powder, and those additional oxides are added as impurities (“doping”) in powder creation, having diameters of several microns. After the addition of organic compounds, like certain binders or lubricants used to enable the following processes, this operation lasts for several hours in a damp environment. With this last procedure, a powder with a 100 μm diameter that is “spheroids-based” can be obtained. When the powder is pressed into a suitable mold, it is sintered at temperatures between 1000 °C and 1300 °C to solidify the material. This process is crucial because it ensures ZnO grain crystallization and the development of the microstructure that determines the electrical behavior of the varistor [5]. While increasing the electrical properties of the resultant material, the insertion of additional dopants does not affect the internal electronic diagram of the energy levels [22].
As a result, Ti or Si encourages the expansion of the granules, while Cr and Sb oxides limit their size.
Through its associated oxides, aluminum lowers the MOV material’s resistivity, whereas lithium has the opposite effect. It is not possible to systematize how each component affects the physicochemical and electrical properties [5].
Major potential barriers arising inside intergranular regions control even the varistor’s electrical conduction. As we have demonstrated in earlier papers [5,7], this basic composition’s preparation is heavily reliant on empirical research and trials.
By controlling the concentration of each component and changing the thermal sintering cycle’s parameters, varistors’ electrical characteristics can be enhanced. It should be emphasized that these authors’ varistors are artisanal and made to be relatively coarse; thus, they cannot be sold. However, their electrical capabilities are sufficient.
2.1. Varistor Materials Used for Tests
We will talk about a simple original material that is built on a base of five additive oxides—Bi2O3, Co3O4, MnO2, Cr2O3, and Sb2O3—and another material that just has 2 additive oxides. The writers worked on this final piece over the course of several years at the PAUL SABATIER University’s Génie Electrique Laboratory—LAPLACE [8]. Together with new manufacturing techniques, the authors have perfected this formulation. General-purpose MOVs are made for civil applications using this comparatively straightforward production technology, but less so for military, electrical, or communications ones.
Table 1 and Table 2 detail the approximate initial chemical composition of some new original varistors produced by the authors at the L.G.E.T., the Laplace Lab, with 2 and 5 additional oxides, respectively, when all manufacturing procedures have been fully completed. In the 1950s and 1960s, ZnO was combined only with a single dopant (SiO2, TiO2, or SnO2) to generate the first varistors. The inclusion of Bi2O3, which successfully established a dual link at the intergranular layer, is generally acknowledged as a fundamental improvement [21]. Authors have tried to dope the zinc oxide base with single metal oxides (La or Pr), and have achieved outstanding performances; nevertheless, this complex technique was extremely costly and not practical for widespread use [23].
Improving electrical performance is universally agreed upon as requiring more additives, raising their concentration, and developing optimal thermal cycles.
The term “varistor” comes from the fact that varistors are principally composed of ZnO, to which a wide variety of other oxides are added.
Beginning in 1968, M. Matsuoka developed the simplest chemical composition for varistor materials. Despite its remarkable simplicity and high quality, it continues to serve as a standard against which all other manufacturing methods are measured.
In theory, additives can be split into two categories. Bi, Co3+, and occasionally Mn are examples of oxides in the first group whose cations directly contribute to the formation of the intergranular layer. Ti3+ and other trivalent ions with an ionic radius can be created by titanium in a manner similar to this. The remaining ions that diffuse into the ZnO crystal and help the varistor function well are contained in the second group [13].
Some of these dopants might combine with the first group to generate intermediary compounds during the sintering process, encouraging or discouraging crystal formation. As an example, MnO and CoO promote the formation of certain intermediate phases that fix Bi2O3 in order to avoid the loss of this element by means of evaporation occurring at these high sintering temperatures [24].
The technical and industrial procedure is lengthy. The manufacturing facilities are still obstructed at some stages in the process, causing modest interruptions in the production stream, which might last for days from the moment of component weighing until the final phase of coating with epoxy resin. Because of this, the quantity of these electrical components produced has an impact on their pricing. The price lowers more as the quantity increases, yet the contrary is also true—a small amount results in a high price.
2.2. Varistor Devices Used for Tests
Varistors built from the two materials mentioned above (with 2 and 5 oxides of additions) and sintered at various temperatures are the subject of the first set of measurements. The impact of sintering temperature was usually ignored until recently, with the majority of varistor producers using consistent sintering temperatures of roughly 1200–1300 °C that were drawn from the common ceramics region and used for both semiconductor ceramics and as such.
The varistors were as follows when sintered at 4900 N/cm2 pressure:
- Having only two additive oxides, seven disk varistors sintered at 1100, 1150, 1200, 1250, 1300, 1350, and 1400 °C at the end (as observed in Figure 2a);
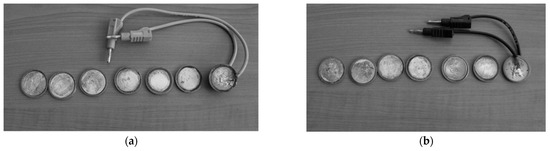 Figure 2. Seven varistors were produced in two series, one with two additives (a) and the other with five (b), and both series were sintered at seven different temperatures.
 - Having five additive oxides, we manufactured seven disk varistors sintered at 1100, 1150, 1200, 1250, 1300, 1350, and 1400 °C at the end (as observed in Figure 2b).
One may analyze each varistor by tracing the current–voltage characteristics and obtaining a graphical representation of the variation of the non-linear coefficient. This can be performed for each varistor. These characteristics are thought to be crucial for describing the varistor material. The goal of the entire strategy was to determine how temperature affected the best material taken into consideration.
Since the test equipment and apparatus at the Laplace L.G.E.T. Lab are somewhat small, the authors opted to focus only on the construction and testing of low-voltage disc MOVs. High-voltage MOVs with a cylindrical shape provide more testing challenges. In the end, they cared only about the tangibles, which are unaffected by the MOV’s size. All tests were carried out using the aforementioned instruments according to normative test standards and instructions.
We utilized varistors that had a 30 mm diameter (without insulation) and a 3 mm height (final thickness). The method briefly explained earlier was used to produce these varistors at L.G.E. Toulouse. To maintain a uniform height when sintered at temperatures exceeding 1250 °C, we compensate by offsetting by around 5–10% (by adding more mixing material). In each picture, you can see a varistor connected to the wires that carry its signal to the polarization testing lab. All of these variations have been created, including lateral coatings with blue epoxy resin and metallic deposition on both sides. The values for the sintering temperature are visible on them.
We found that all 14 of these varistors would be comparable if we had no knowledge of their production procedure.
3. Results
The manufacturing process of all these varistors will be the subject of many improvements, verified in practice by some dedicated measurements.
3.1. MOV Losses in Mass
The issue of mass losses (due mainly to the decomposition and the vaporization of certain components) is still significant, especially at higher temperatures, in the metal oxide-based varistor production process. Earlier chapters detailed the exact masses of the mixture or the initial plusses to be added to make up for the losses. Due to the aforementioned factors, we find that there is a persistent dissimilarity.
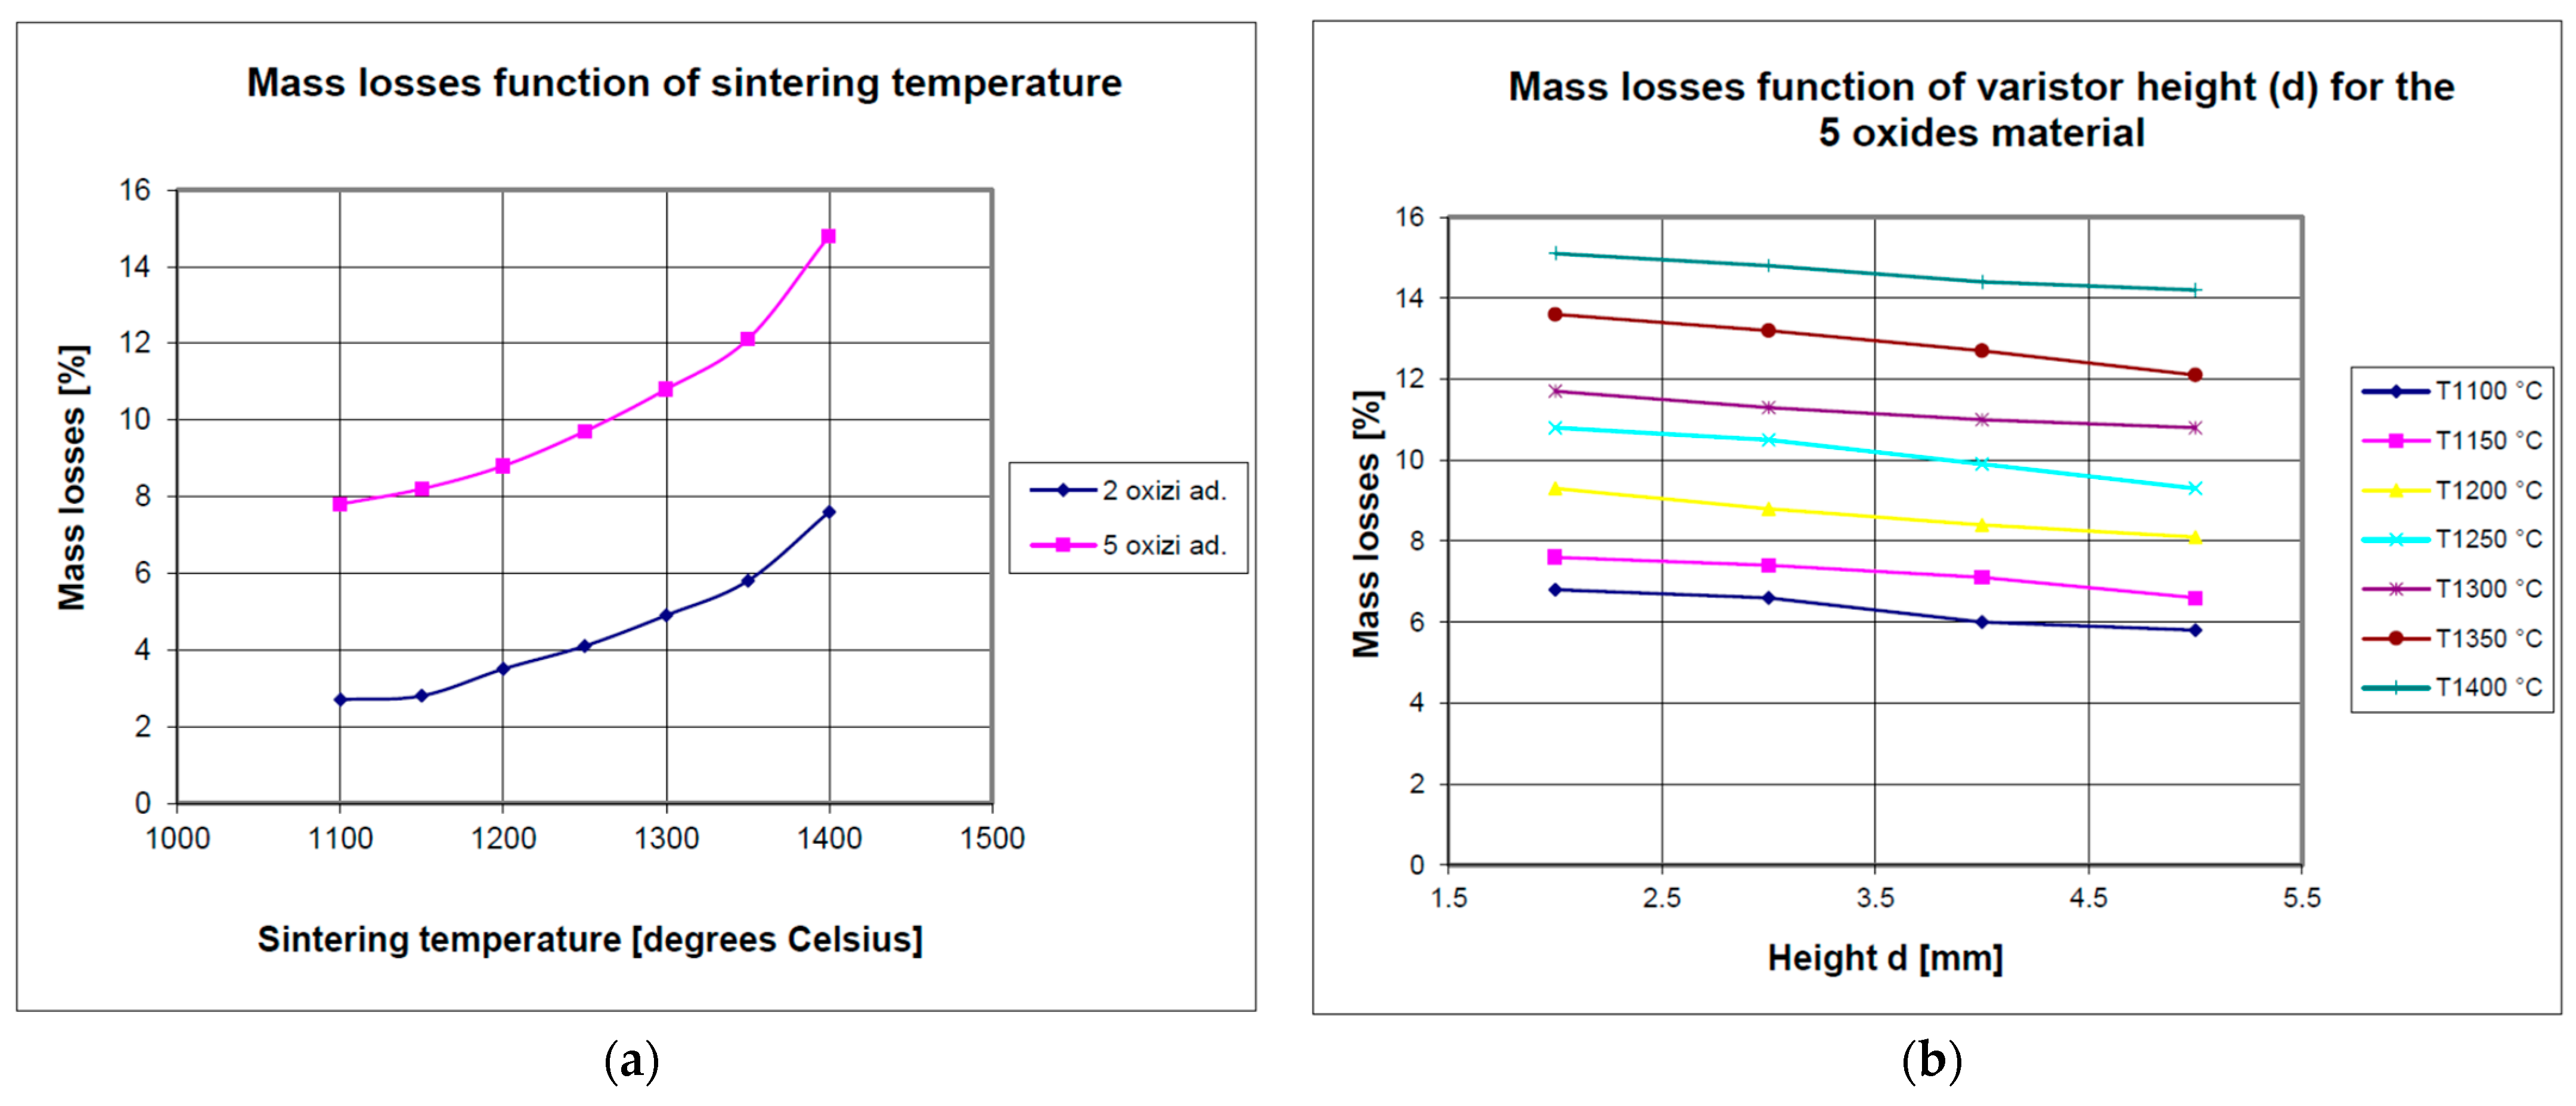
Figure 3 is a graph depicting the percentage of mass lost as a consequence of subjecting the MOV material to all these different sintering temperatures. It highlights the fact that chemical instability reaches its worst when there are five more oxides.
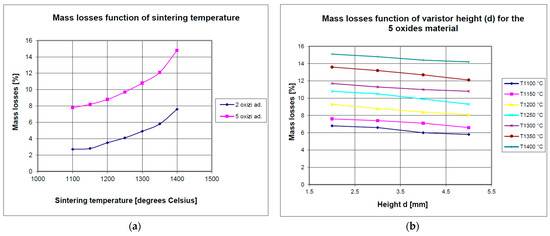
Figure 3.
In conclusion, the principal mass losses in the case of MOV-dedicated materials are (a) dependent on the specific sintering temperature for a fixed height in the case of both materials and (b) dependent on the varistor height for the five oxides material at different sintering temperatures.
The mass loss ranges from roughly 5% to 7% between the materials using two additive oxides and those using five additive oxides. This is something to think about while making five additive oxide varistors in a series, particularly if a very large quantity of the sintering mixture is needed.
Figure 3a depicts the mass loss as a function of the sintering temperature in the case of a simple 3 mm-tall varistor composed of both two and five additional oxides each. Figure 3b, using sintering temperatures as a parameter, displays mass losses as a function of varistor main height in the case of five oxides (which are susceptible to degradation at high temperatures). For the examined sintering temperature (1300 °C), we obtain the previous numbers for the 3 mm height, which amounts to losses of around 11–12%, which are very significant. The mass losses decrease as the varistor becomes thicker (higher); this connection between mass losses and thickness is approximately linear. The losses reach a saturation limit at a thickness of about 5 mm, beyond which they cannot decrease, regardless of the thickness of the MOV. That simple characteristic aids in the design of MOVs dedicated to high-voltage use.
Because the mass losses in the case of small MOVs designed for low-voltage operation are high, they must be carefully studied in order to safeguard the other features of the final varistors. From a physicochemical and theoretical standpoint, the addition of even more oxides causes further mass losses that result in a range of relatively stable or unstable chemical forms that break down or volatilize at high temperatures.
The reference temperature of around 1300 °C is appropriate for the sintering process since it is evident that as the sintering temperature of the mixture increases, so do the mass losses. Further measurements are necessary to determine this.
3.2. Main Electrical Parameters and Tests for MOVs
Most importantly, the I-V characteristic must be measured to assess the performance of the varistor material. All relevant varistor parameters are computed from these readings.
The method’s basic idea is to gauge the varistor current at various polarization voltage levels. Continuous tensions are used. The extremely low measured currents indicate the use of very precise instruments that adhere to strict requirements. To prevent their influence on the varistor, wires, not electrodes, are mounted to connect the varistor.
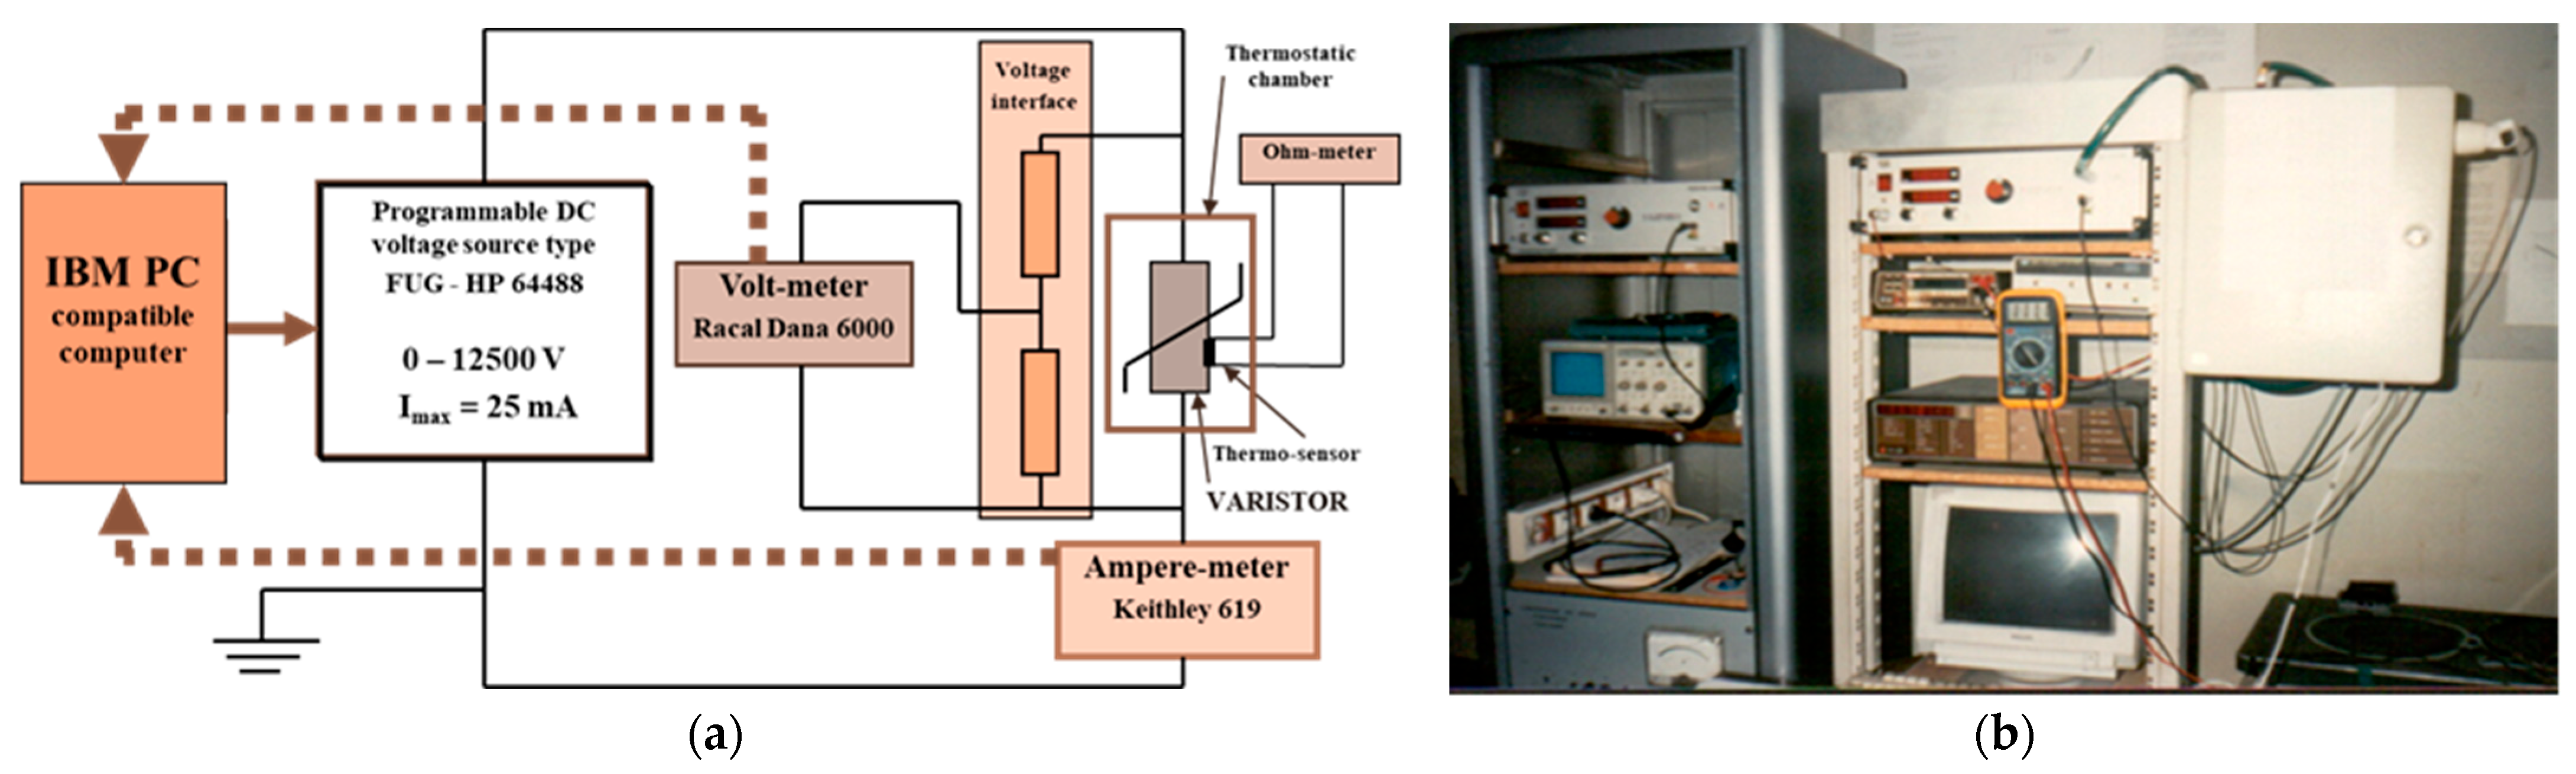
The apparatus used for these types of measurements is explained in Figure 4 [5]. Figure 4a describes the installation’s electrical layout, and Figure 4b shows a broad image of the setup existing at the LAPLACE Lab.
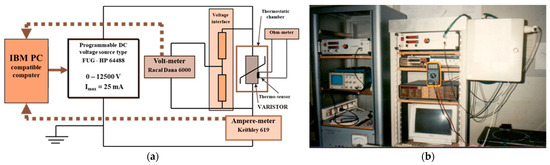
Figure 4.
MOV assessment facility: (a) electrical testing devices; (b) complete image.
On the basis of the current–voltage (I-V) characteristics, we may make several important assessments about the varistor (or the varistor material):
- Nominal leakage current is defined as the crossing current registered at the nominal voltage Un (or the nominal field intensity En) (less than 1 mA for medium or high voltage). Its proper name is the If-then statement (or the current density Jf);
- The nominal threshold voltage, noted as Us, often registered for a conventional current density of 1 mA/cm2 or, for practical measurements, with a current of 1 mA, is one of the reference values. Voltage and current will be used instead of field strength and current density for the purpose of clarity;
- The coefficient of non-linearity, which represents the expected electrical behavior of the MOV. The higher this parameter, the more closely the MOV’s protective characteristic approaches the optimal value. One may easily determine the non-linearity exponent by noticing that it reflects the slope of the characteristic I-V on the non-linear area in logarithmic-specific coordinates. A straight-line equation is provided by the above relation, which represents the line’s slope. As this direction is specified by two main points, we will examine two points located on that characteristic, with coordinates of namely (I1, V1) and (I2, V2) from which it derives;
- Both locations of the characteristic as determined are typically set at current densities as J = 1 and 10 mA/cm2. For simple measurements, we only considered currents of 1 and 10 mA for this conclusion.
3.3. The Influence of the Sintering Temperature on MOV’s Electric Behavior
Before drawing some dedicated conclusions regarding the material’s effectiveness from the perspective of electric power, we shall attempt to characterize it in terms of its electrical qualities. The same 30 mm diameter and 3 mm thickness varistors were used for the tests for the 230 V AC voltage used in home applications. These varistors will be used to trace the current–voltage characteristics of each varistor and depict the variance of the non-linear coefficient.
It is believed that these features are essential for characterizing the varistor material. The complete plan was developed to learn the effects of the sintering temperature on this novel MOV material. This testing was performed in a range from 50 to 400 VDC since the opening nominal voltage for all these varistors is about 300 VDC.
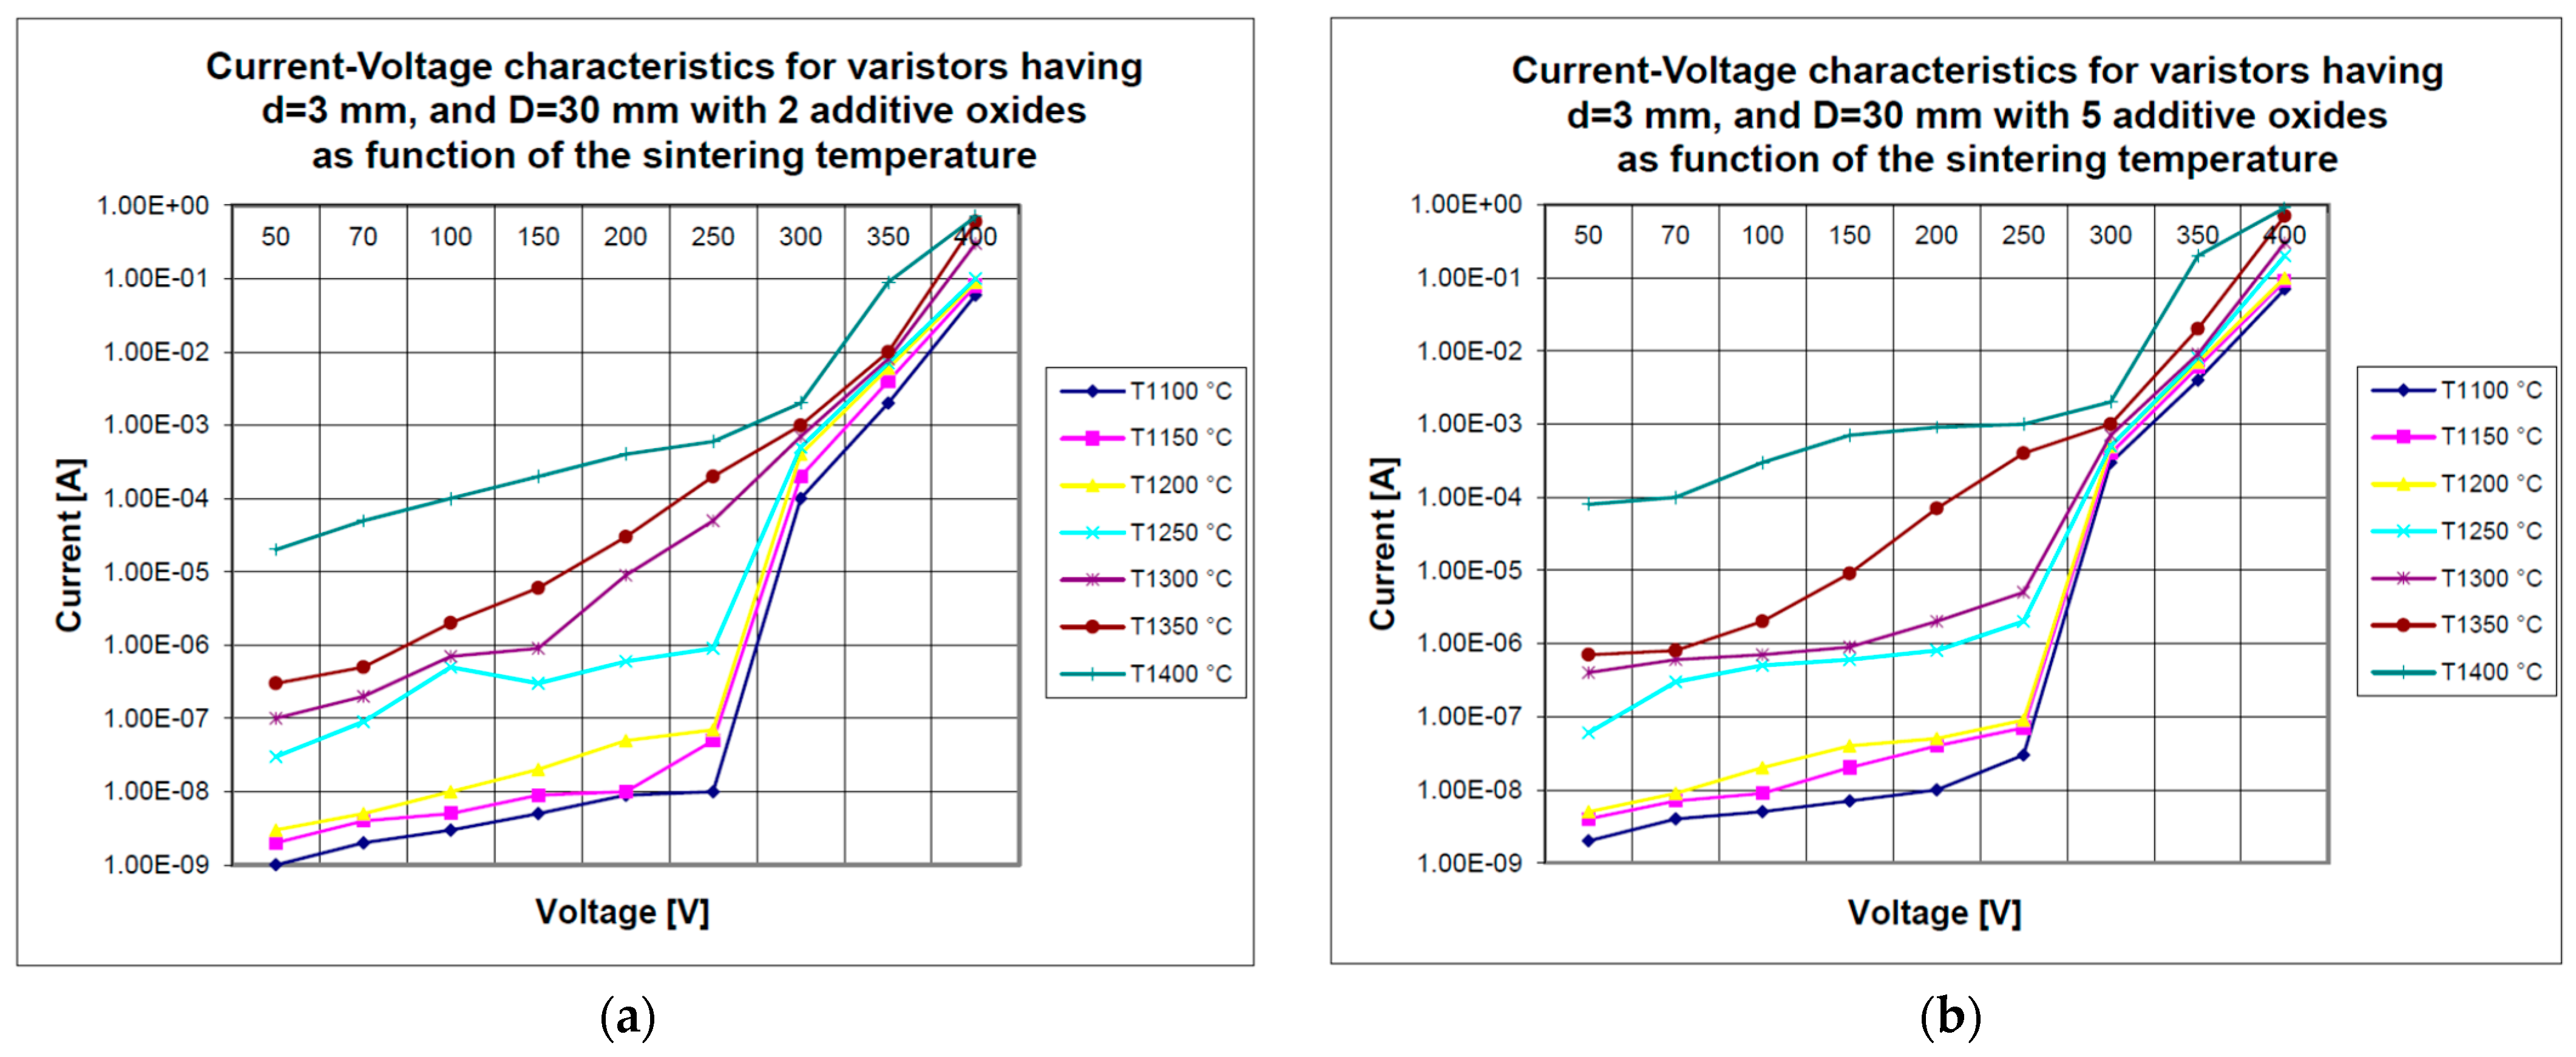
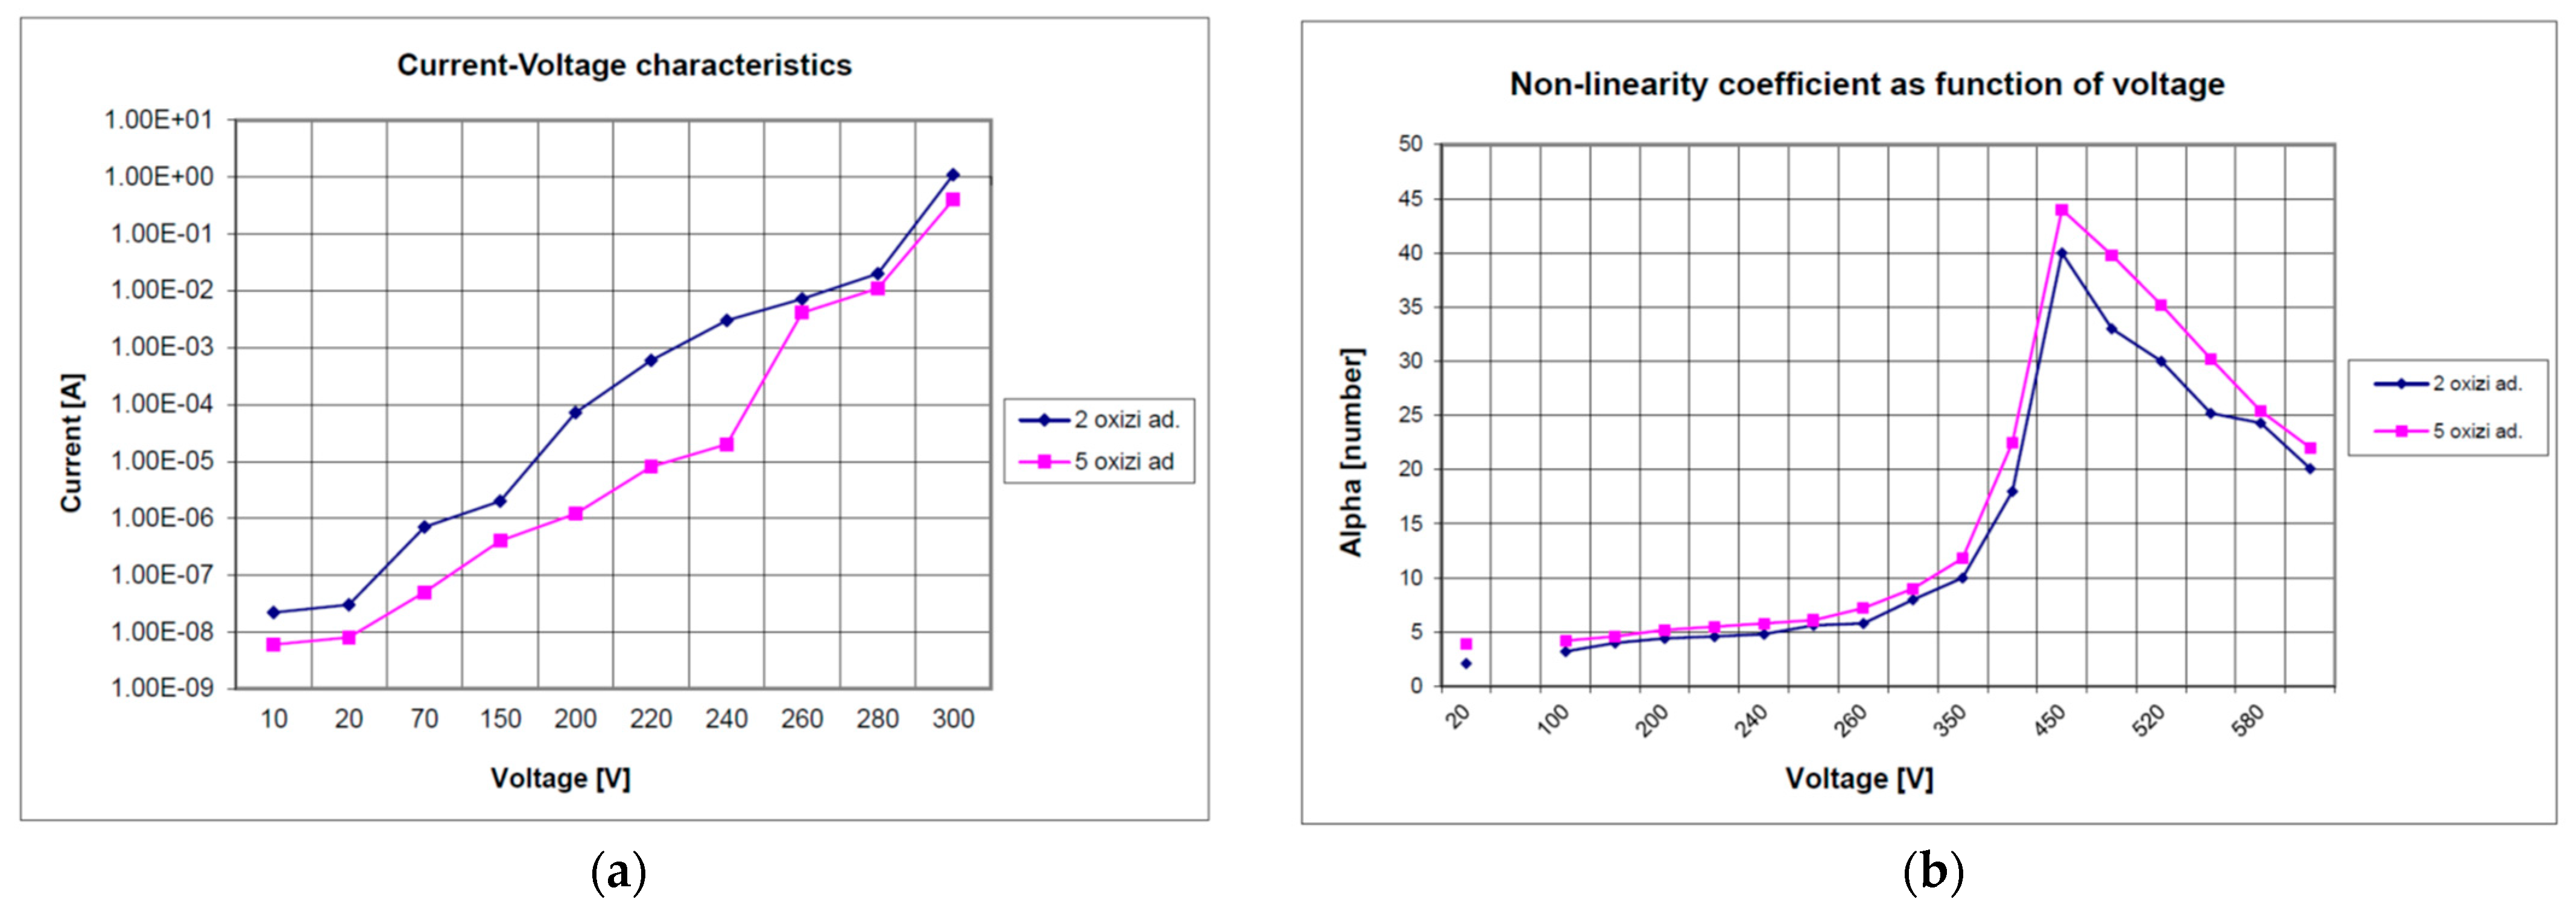
The current–voltage characteristics for seven varistors with two additional oxides sintered at different temperatures are shown in Figure 5a. Figure 5b provides the same behavior for all seven versions, including the five extra dopants.
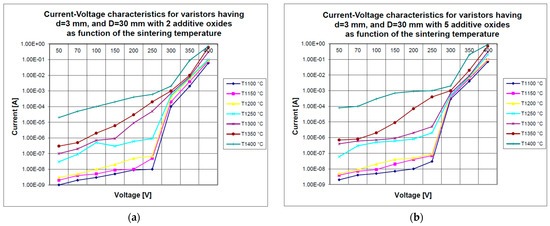
Figure 5.
Principal current–voltage characteristics in the case of a seven-piece series of MOVs sintered at various temperatures: (a) with two additive oxides; (b) with five additive oxides.
With the use of the measurements combined in Figure 5a,b, as below, we can make a first set of observations:
- Because of the sensitivity of that material in case of high temperatures, MOVs sintered between 1300 and 1400 °C have high I-V characteristics. This prevents the sensitivity of these materials from increasing, which may be beneficial in theory but can lead to unwarranted heating of the varistor;
- Sintered materials at 1100 °C differ by four orders of magnitude from those obtained at 1400 °C. The varistor opens at 300 VDC, shortening this distance. This should only be considered to boost varistor sensitivity;
- At 1 mA, the varistor opening voltage is 300–315 V. This shows that these varistors were appropriately sized;
- After opening, varistors behave consistently, ensuring protection regardless of sintering temperature;
- The ideal sintering temperature for opening voltage is about 1300 °C, providing varistors a minor sensitivity but not threatening their safety in a range from 1250 °C to 1350 °C. Compared to our five additive MOVs, the two-oxide varistors have somewhat lower characteristics. To demonstrate the genuine variance of measured data, the features are raw, not interpolated.
Because of the presence of two extra oxides, the quality and purity of this material are lower than they could be, but it can still be used successfully in the construction of varistors made to operate in case of medium- or high-voltage devices, where the accurate sensitivity to applied voltages situated below the threshold value is not as important.
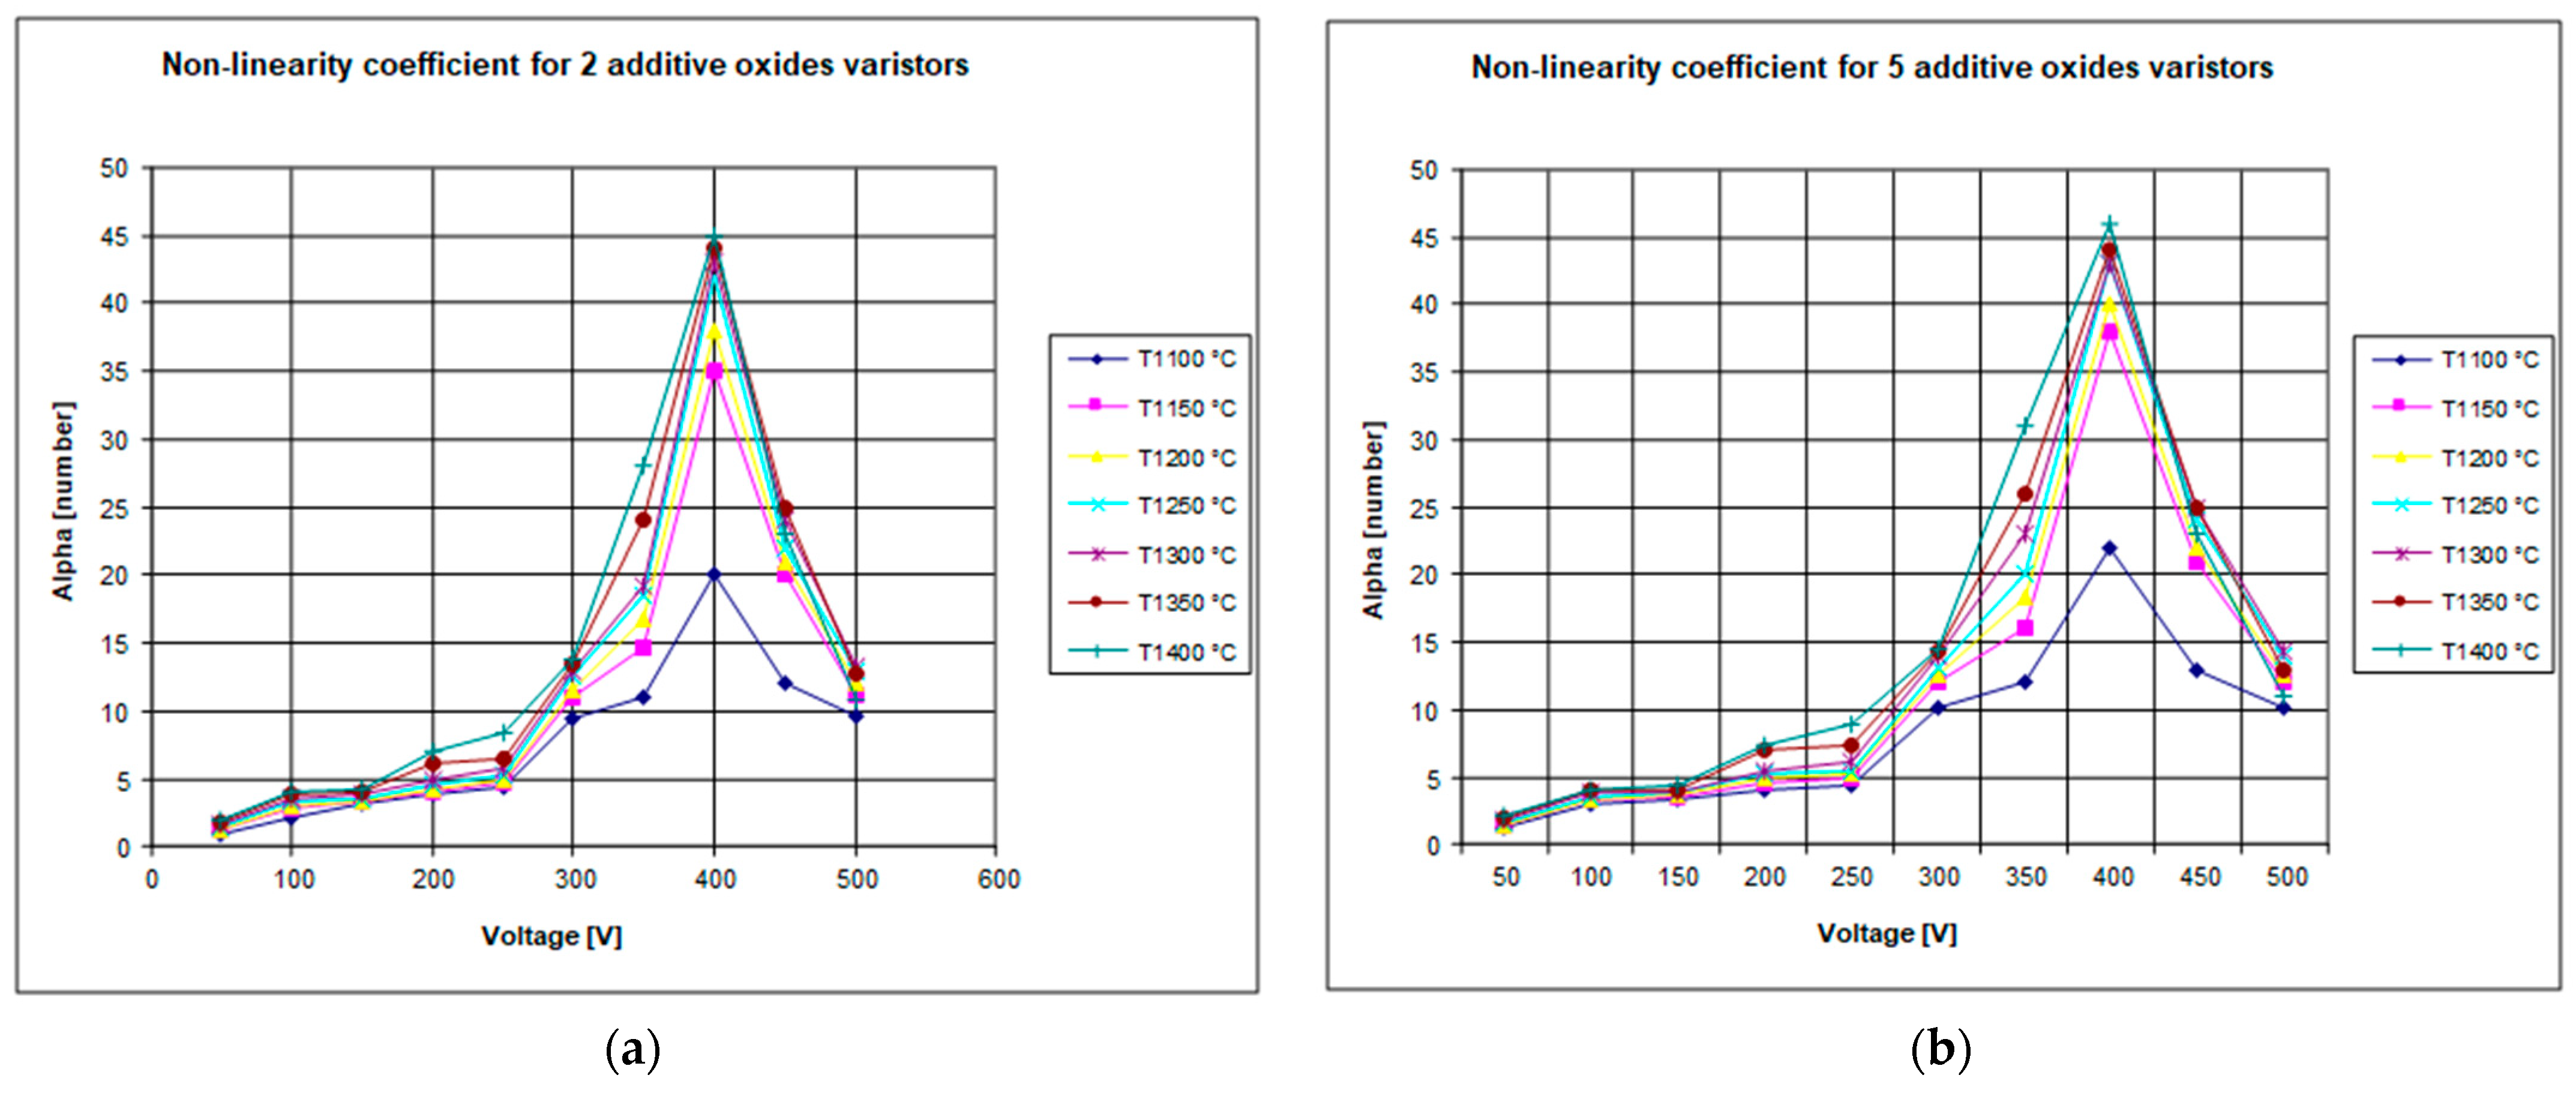
Since each material can be helpful in a certain application, it is necessary to characterize varistor materials in both scenarios to avoid labeling certain combinations as unnecessary. Seven MOVs were sintered at different temperatures with two additional oxides, and their current–voltage characteristics are shown in Figure 6a. Next, Figure 6b will provide the same information for the seven MOVs with five additional oxides.
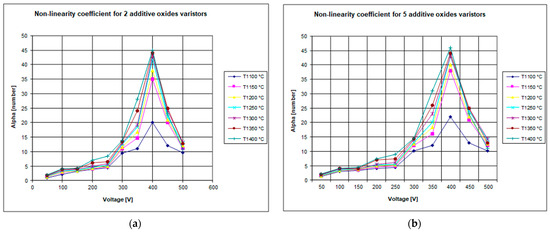
Figure 6.
Evolution of the non-linearity coefficient for our seven original MOVs sintered at various temperatures: (a) with two additional oxides; (b) with five additional oxides.
We can draw the following conclusions by examining the measurements summarized in the graph in Figure 6:
- Although it was to be predicted, the more complex and elaborated material having five additive oxides much outperforms its simpler counterpart with only two additional oxides in terms of all of its homologous attributes;
- Due to the extreme sensitivity of the MOV material at high temperatures, the non-linearity coefficient characteristic is high for sintered varistors between 1300 and 1400 °C (because of our previous set of conclusions, we maintain the same temperature range in order to obtain a dedicated optimized value);
- As a result of the sensitivity of MOVs at high temperatures, the non-linearity coefficient characteristic is very high for sintered varistors operating at 1300–1400 °C;
- The non-linearity coefficient features rise with increasing sintering temperature, avoiding an increase in the sensitivity of these devices, which is theoretically good but might converge to uncontrolled heating of the MOV;
- This maximum point falls somewhere between about two and three volts of direct current;
- Non-linearity reaches its highest value somewhere between 430 and 450 VDC for all varistors and dramatically rises to the threshold voltage, which is around 315 VDC;
- Below the opening, the non-linearity is small and close to the value for low voltages, and the varistors’ behavior is about the same;
- Protection is ensured at any sintering temperature for the varistors;
- To maintain a modest sensitivity in the varistors without compromising device safety, the optimal sintering remains at approximately 1300 °C, which is determined by the opening voltage (the same temperature value as in the last case).
In order to perform a thorough comparison between these two obtained materials without needlessly confounding the characteristics, we must compare two homologous MOVs sintered at 1300 °C: one with two additional oxides and the other with five additional ones.
In this research, the current–voltage characteristics and the evolution of the non-linearity coefficient are the primary metrics studied for general-purpose varistors.
The results of these experiments, shown in Figure 7a, compare the obtained current–voltage characteristics of corresponding MOV materials sintered at 1300 °C.
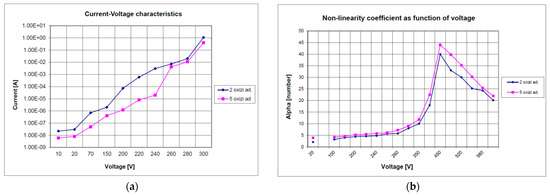
Figure 7.
Two varistors, one with two additives and the other with five, were sintered at 1300 °C, and the following primary electrical measurements were taken: the non-linearity coefficient (b) and the current–voltage characteristics (a).
Assessments were performed between 10 V DC and 300 V DC on the premise that the threshold voltage of all these varistors is around 300 V DC. The varistors have not been placed in the prologue since it would be more accurate to define their sensitive zone than the conduction region.
Because it determines the UN threshold stress, the average ZnO granule width is crucial for varistor manufacturers and users (opening voltage). Granules of various sizes make up a ZnO-based varistor.
As a result, the ZnO grains with the lowest electrical resistance will be preferred in order to pass the current in the path with the least amount of resistance.
Due to the five-oxide structure, the diameter of these grains is slightly reduced, increasing the varistor’s general sensitivity.
The same varistors (two pieces), which had a final thickness (height) of roughly 3 mm and a final diameter (without insulation) of 30 mm, were used. A similar method previously mentioned was used to create these varistors.
This comparison is essential since it more clearly illustrates how the two materials can be applied.
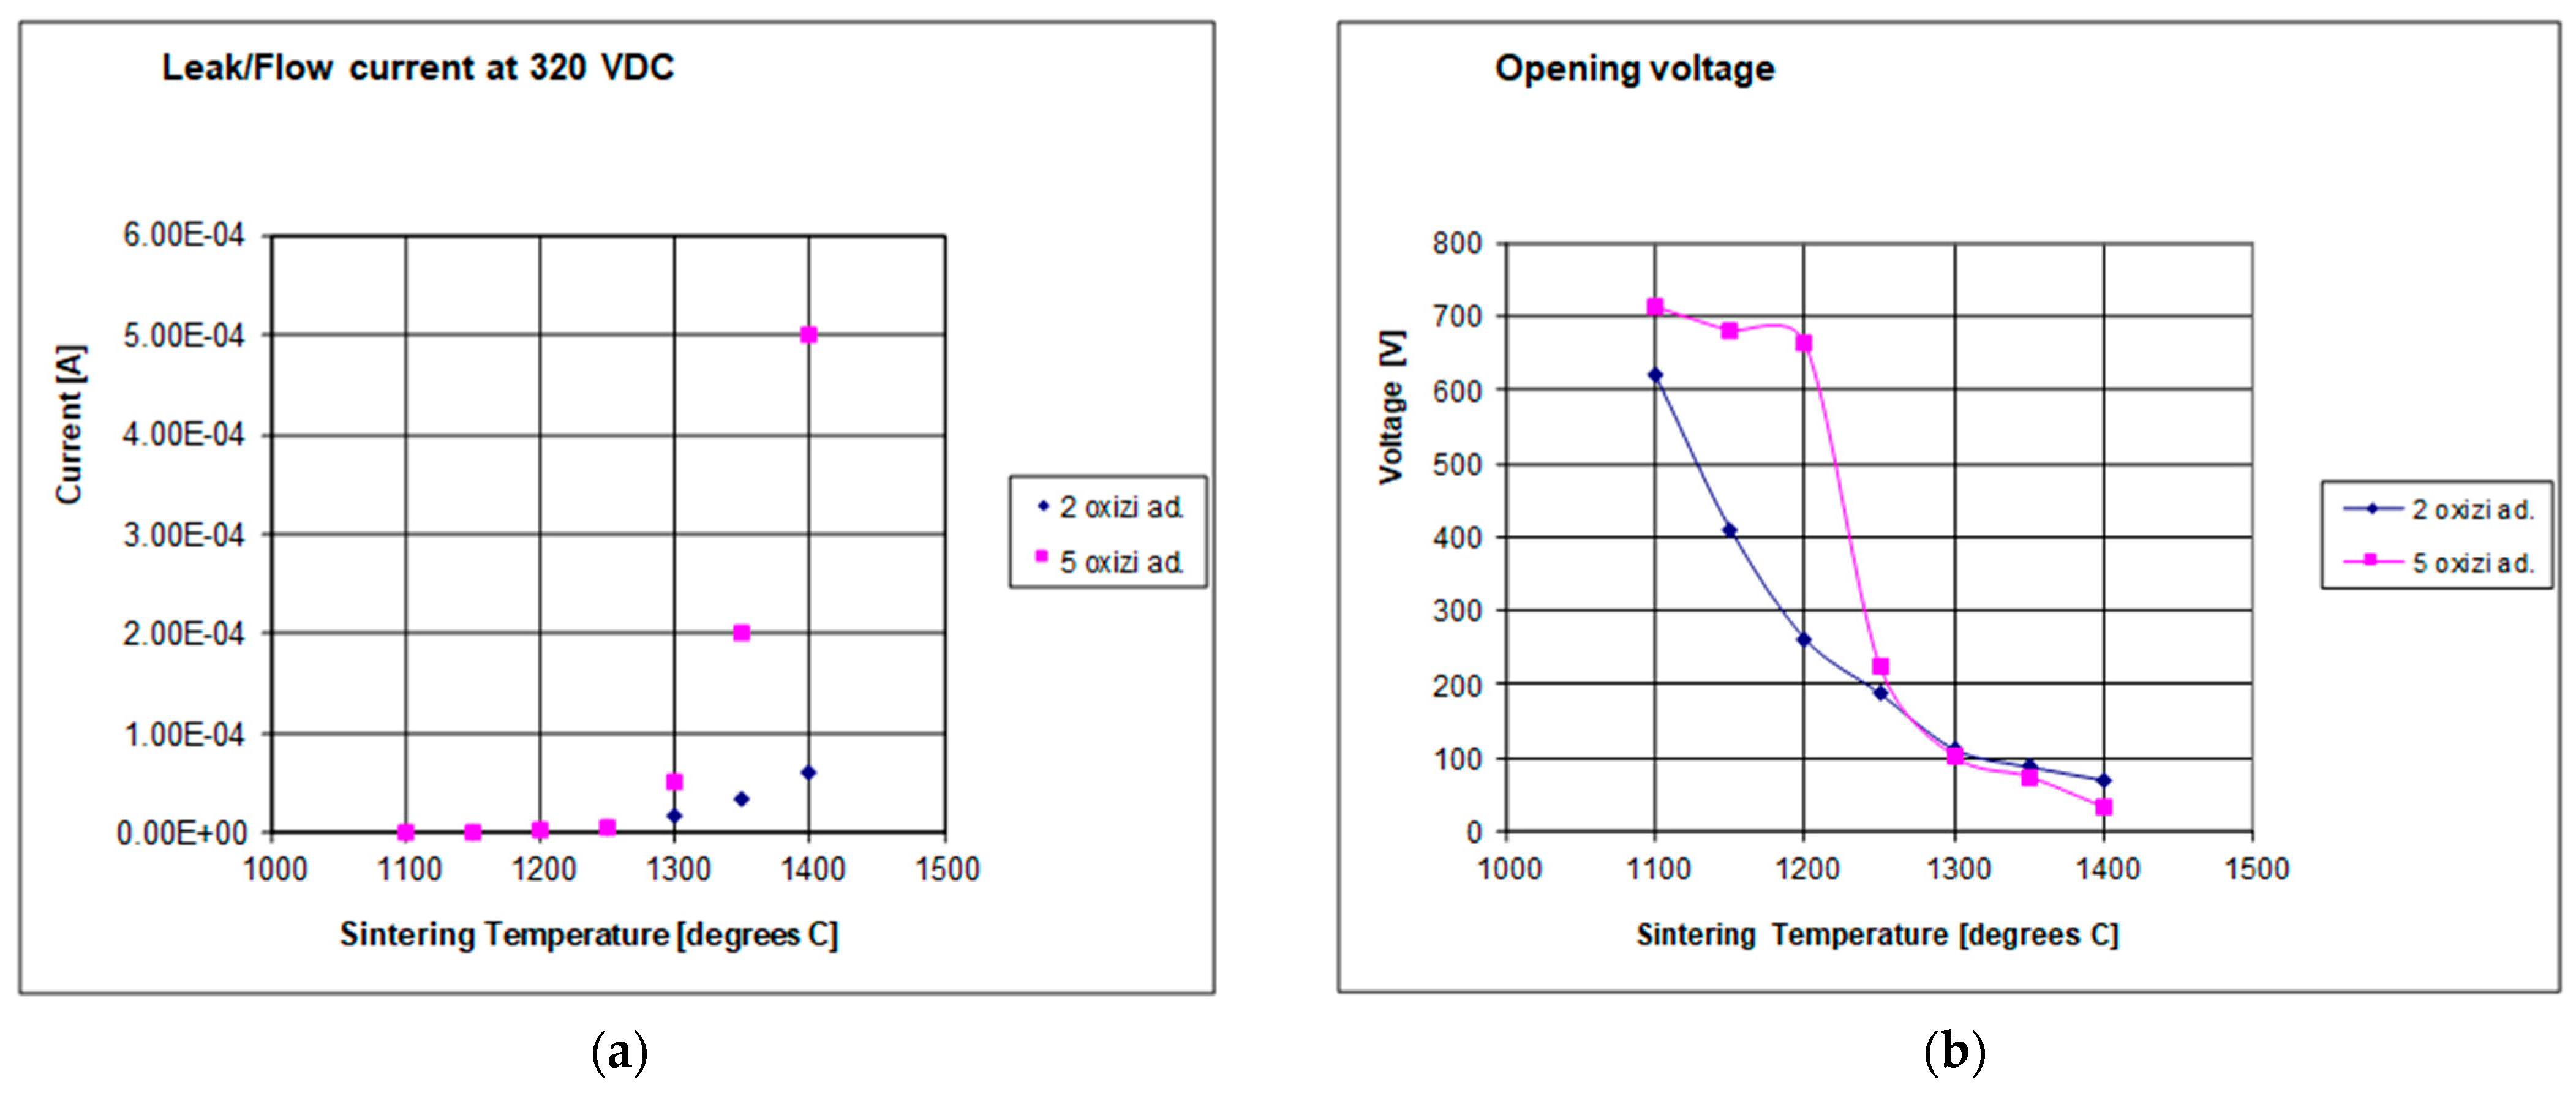
At 320 VDC, which is rated as being close to the peak voltage for the AC domain (in Europe for a 230 AC voltage), Figure 8a shows how the If (flow/leakage current) varies with the sintering temperature.

Figure 8.
The primary material parameters measured for our sets of varistors (two and five) as a function of sintering temperature are as follows: (a) leakage current; (b) opening voltage.
Figure 8b depicts the change in VD (the opening voltage) as a function of the sintering temperature, as determined for a 1 mA current in DC mode.
Following an examination of the measurements included in Figure 8a, the following conclusions can be made:
- With MOVs sintered from 1100 to 1250 °C, the nominal leakage current is mostly unaffected by the number of additional oxides involved;
- However, varistors sintered from 1300 to 1400 °C have a nominal leakage current that increases and reaches considerable levels around 1400 °C, preventing their sensitivity from increasing. It may assist, but it heats the varistor unnecessarily;
- From the drainage current’s perspective, the optimal sintering temperature is still about 1300 °C, which offers varistors a modest sensitivity without compromising their safety;
- This increase in the constant drainage current worsens the conditions for the MOVs with five extra additives, which are naturally more sensitive;
- When sintered at roughly 1300 °C, varistor material with five oxide additions becomes somewhat more sensitive.
Following an examination of the measurements included in Figure 8b, the following conclusions can be made:
- When sintered from 1250 to 1400 °C, the threshold voltage of varistors will be rather constant, regardless of the number of oxides or additives used;
- While the opening voltage of varistors increases with increasing temperature between 1250 and 1400 °C, the threshold voltage starts to decrease, reaching some low values for the ones attained around 1400 °C. There is a mixed reception to this;
- The varistors may be made somewhat sensitive without jeopardizing their safety by sintering them at about 1300 °C, which is the optimal sintering temperature in relation to the threshold voltage;
- The situation is exacerbated at varistors with five additional oxides, where the tendency toward increased sensitivity is evident and maybe undesirable due to the already reduced permanent opening voltage;
- It has been shown that sintered varistor material with five oxide additions is somewhat more sensitive at temperatures of about 1300 °C and higher.
3.4. The Influence of the Sintering Pressure on MOV’s Electric Parameters
Sintering pressure is another crucial factor in the manufacturing process.
A greater sintering pressure yields a superior material from a physicochemical standpoint. However, installing a high-pressure sintering system is very expensive. As a result, measurements are required to determine how the sintering pressure affects the varistor material.
Varistors have so far been sintered at 4900 N/cm2 of pressure (500 kgf/cm2). The sintering of the varistors was also attempted through the aforementioned equipment, which is capable of a maximum pressure of 9800 N/cm2 (1000 kgf/cm2). The sintering temperature is 1300 °C, which is what prior experiments have shown to be ideal.
Only the volatilization of particular chemicals in the environment (caused by temperature) affects mass losses, even when the sintering pressure is increased. Density changes are not visible by means of direct visualization (measurements are required).
High sintering pressure results in smaller granules and intergranular junctions at the varistor’s crystalline structure, which sometimes results in undesirable enhanced sensitivity of the varistor material.
In this experiment, we employed four MOVs with h = 3 mm and D = 30 mm:
- Sintering was performed on two distinct materials, each of which had an additional oxide added to it at a pressure of 4900 N/cm2 for one of the older materials and 9800 N/cm2 for the newer materials, respectively;
- Two variations of the same material, each with five different additional oxides, were sintered at different pressures: one at 4900 N/cm2 and the other at 9800 N/cm2.
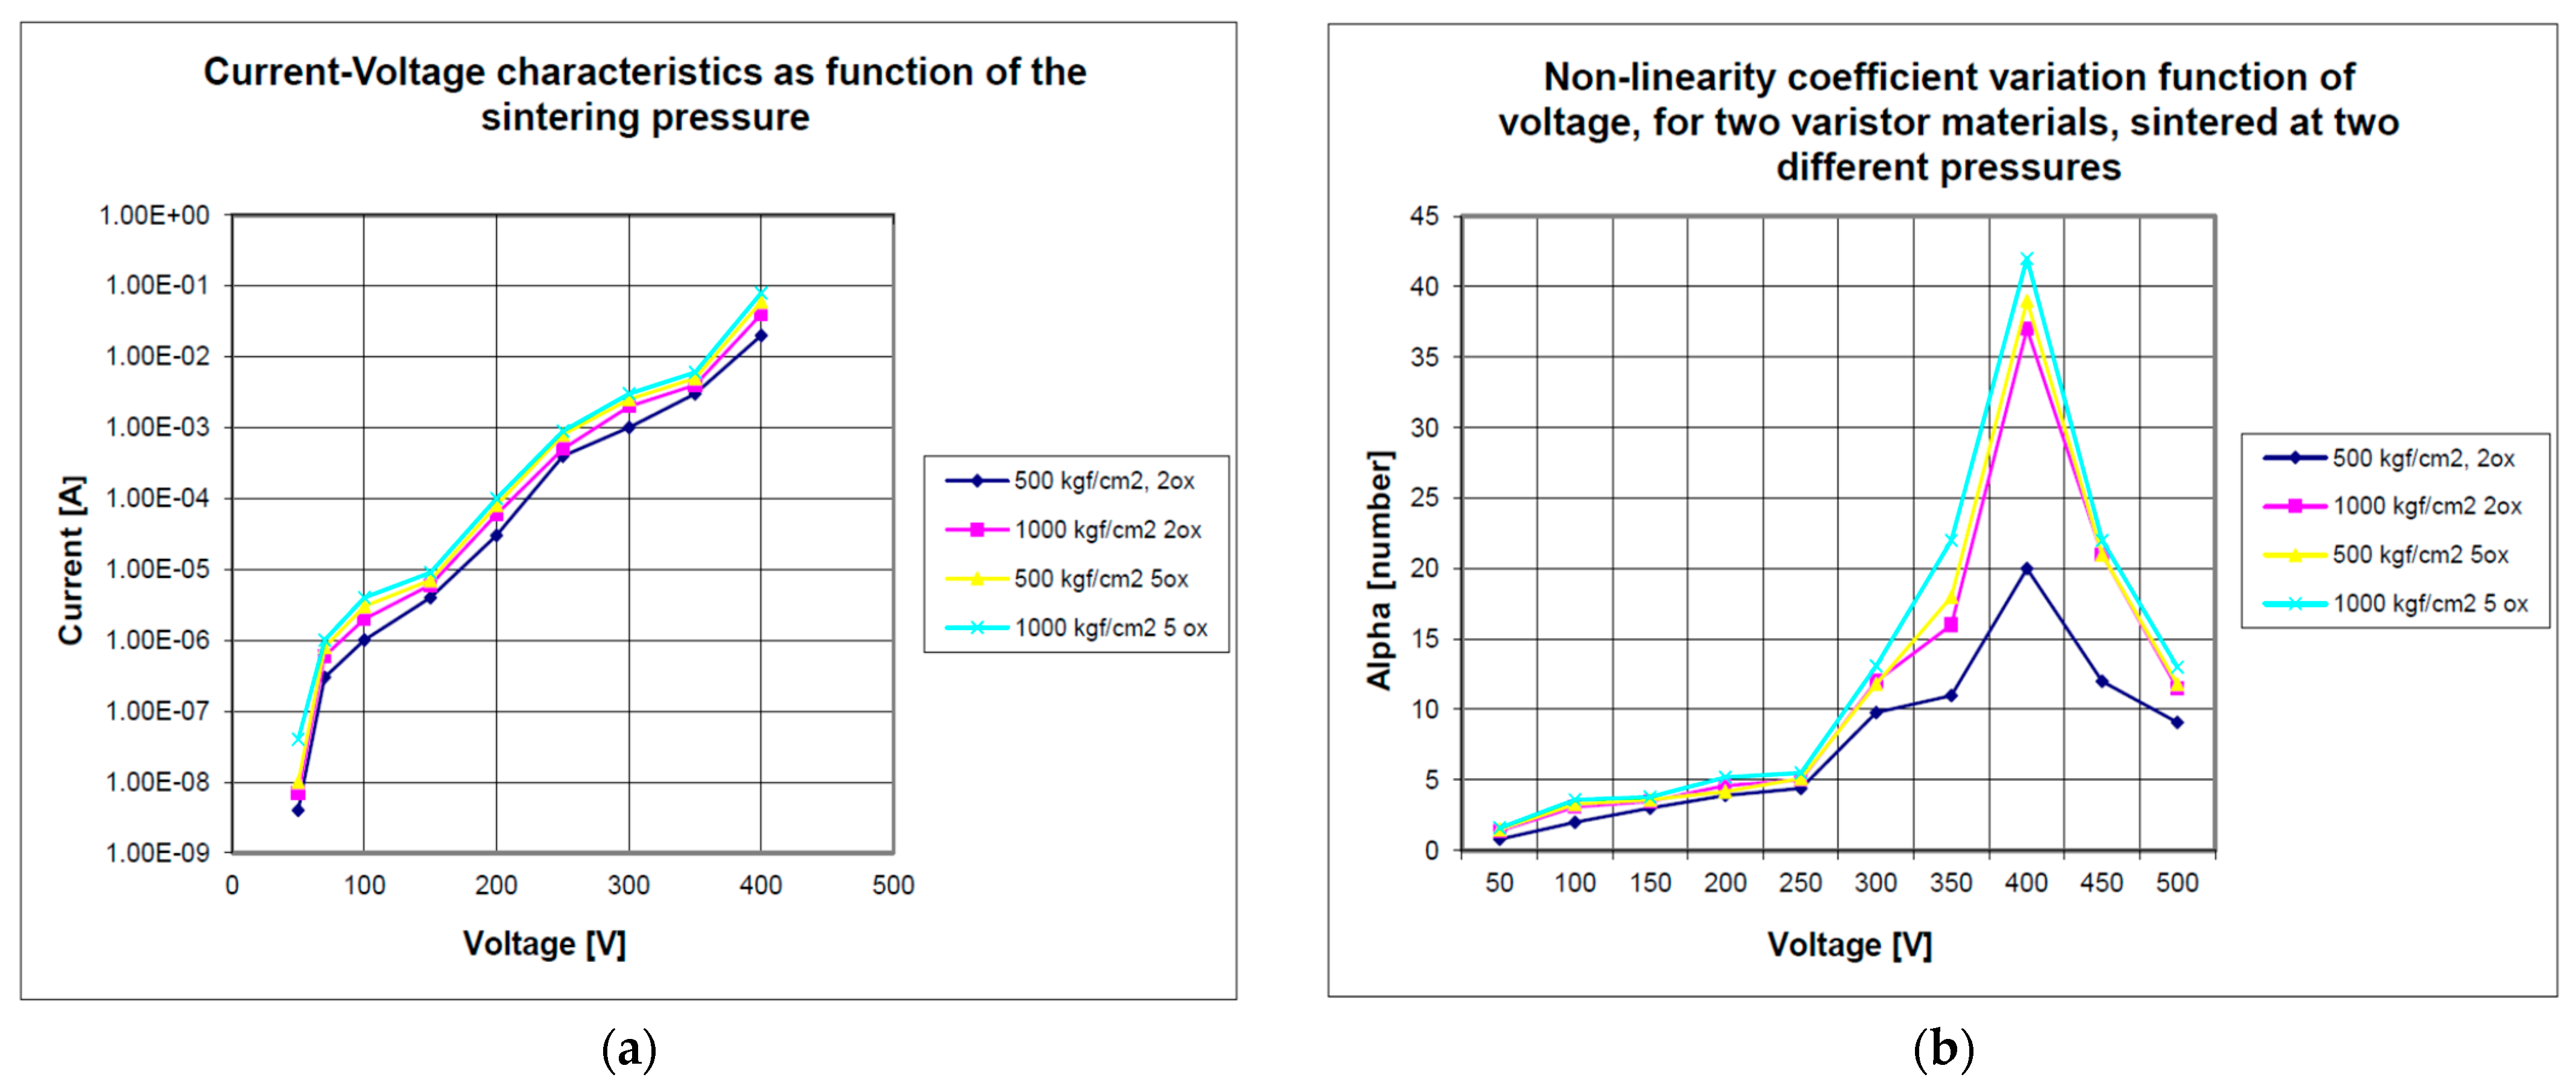
Since it can be assumed from the sintering pressure that the threshold voltage of these MOVs is about 300 VDC, all tests were performed in the DC domain between 50 and 400 V, as shown in Figure 9a.
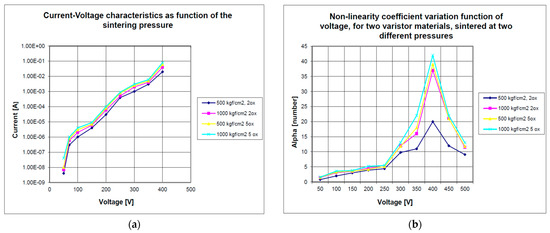
Figure 9.
Principal data for two varistors (with two and five oxides, respectively) sintered at 4900 N/cm2 and 9800 N/cm2 (500 and 1000 kgf): (a) current–voltage characteristics; (b) non-linearity coefficient.
In Figure 9a, we can see the group of current–voltage characteristics that were determined from these experiments using the sintering pressure as a variable. The tests were performed in the DC regime between 50 and 400 V since it is assumed that the opening voltage of these MOVs is about 300 VDC.
Figure 9b depicts a class of features of the voltage-dependent non-linearity coefficient derived from these experiments. Two materials, one with two added oxides and the other with five, and two sintering pressures (4900 and 9800 N/cm2) define this set of properties. Assuming that these varistors’ opening voltage is somewhere around 300 VDC, the tests were conducted in the DC regime between 50 and 600 V.
The varistors are those that have already been created and put through routine tests using the method previously outlined.
Following an examination of the measurements included in Figure 9a, some original conclusions can be made:
- Because the four curves for this sintering temperature are so similar, practically speaking, we cannot choose one over the other for slightly better electrical performance;
- Practically speaking, the sintering pressure has no discernible or dramatic impact on the electrical behavior of these MOVs;
- High-temperature sensitivity of sintered material results in a large current–voltage characteristic for all MOVs sintered at 1300 °C, using the two or five oxides at varied pressures;
- From a tensile standpoint, the quality of materials with two and five oxide additions is fairly comparable since there are very few distinguishing features between them;
- The prior assertion that the opening voltage of a varistor is approximative is supported by our findings;
- The protection function is guaranteed by the fact that varistors behave in roughly the same way after being opened, regardless of the sintering pressure;
- The characteristics are shown roughly rather than interpolated so as to more accurately reflect the true range of the observed parameters;
- Because it can also be created on less complex facilities, like construction, cutting down on production time and costs, the optimal sintering pressure, in terms of opening voltage, stays about 4900 N/cm2;
- The additional cost that would be incurred owing to a negligible variation in electrical quality does not justify the additional expense of a high-pressure installation (apparatus, molds, etc.).
Following an examination of the results included in Figure 9b, the following conclusions can be made:
- A material with five oxides of additions has a visible non-linearity value of 43 immediately after opening, making it appropriate for low-voltage or domestic 230 VAC applications;
- In this particular instance, the disparity in non-linearity performance is also rather apparent;
- An increase in the given sintering pressure causes the non-linearity of varistors to rise, and this occurs independently of the number of oxides that are present in the component additives;
- The value of this limit may vary anywhere from around 23 to about 45, with a significant spread between the two materials;
- After reaching its peak, the non-linearity continues to decline until it reaches values in the 10–15 range;
- We verified that pressure does not affect the material’s electrical properties from these features. These characteristics remain steady despite rising stress;
- The optimal opening voltage sintering pressure is 4900 N/cm2, which may be achieved on smaller installations, like construction, cutting varistors’ production costs;
- Thus, materials with five additives sintered at higher pressures have the highest non-linearity coefficient around the MOV threshold voltage;
- It is not economically reasonable to base the cost of a dedicated high-pressure manufacturing installation (equipment, molds, etc.) on a negligible variation in electrical quality; thus, any necessary cost differential in sales must be absorbed by the customer. The prior evidence also backed up this conclusion.
4. Discussion
The majority of the debates in this article took place after the results were presented.
When discussing the materials and processes used to create varistors, it is important to highlight the following points:
- Thin varistors designed for low-voltage operation have high mass losses and require careful consideration to ensure that other properties are not compromised;
- These mass losses, which must be compensated for by adding a supplementary initial mixture in the situation of five additive oxide MOVs, can reach up to 10–15% of the total mass;
- Any improvement in production methods raises the non-linearity coefficient and, also, the current–voltage characteristics, avoiding another increase in the materials’ sensitivity. Theoretically, this might lead to unnecessary heating of the varistor, despite the fact that it has certain possible benefits;
- The two-oxide material is stronger and may be used for medium and high voltage, whereas the five-additive oxide MOV material is far more electrically sensitive, particularly at low voltages below the varistor opening threshold voltage;
- The optimal sintering temperature for both MOV compositions has been confirmed and stabilized between 1250 °C and 1300 °C due to the achievement of a reasonable current–voltage characteristic without increasing the sensitivity of the varistor unnecessarily, which could lead to thermal runout or thermally unstable operation later;
- An opening tension and a non-linearity coefficient both suggest that a sintering pressure of roughly 4900 N/cm2 is optimal; however, the cost difference necessitated by the difference in electrical characteristics does not justify the cost of a high-pressure dedicated installation with all fixtures. Preliminary measurements also supported this result;
- After opening, the conduct of the varistors remains relatively stable, which guarantees that the protection function will be carried out, regardless of the value of the voltage to which the varistors are subjected, the initial mixing composition, or all the parameters of the sintering cycle;
- We were limited to testing low-voltage disc varistors because of the tools available at the LAPLACE Lab; high-voltage cylindrical varistors presented more of a challenge;
- The qualities of the material were the primary focus of attention, and these qualities are largely unaffected by the size of the varistor piece that is manufactured out of that material;
- All tests were administered with the aforementioned tools in accordance with standardized examination regulations.
5. Conclusions
The effects of sintering temperature and pressure on the electrical characteristics of varistors containing two additives and those containing five additives are briefly investigated in this article.
The parameters were developed with the aim of generating a chemical composition that could be both reliable and safe when assessing their electrical behavior.
These chemical mixtures have an increased degree of novelty, and they are unique, created to provide a straightforward version of varistor fabrication, and they are simple to replicate by any maker of such electronic power components.
Everyday usage of varistors is not based on any one mathematical model that would dictate a single method of production that would guarantee a given set of characteristics. Neither silicate chemistry nor solid body physics theories can provide a complete explanation for the process of the sintering of varistors made of metal oxide mixtures, and furthermore, the physicochemical processes that result in the formation of the crystalline structure of the varistor are not yet well understood.
Thus, the mass production of these semiconductor-based electronic power devices is an entirely experimental endeavor predicated on a straightforward investigation into the optimization of the key manufacturing process parameters by means of experiments and subsequent tests, sometimes supplemented by solid-state physics and silicate compound technology.
Since there are so many variables to consider, making varistors still entails a series of trials and errors. Additionally, even with the industrial automation of the manufacturing process, many processes are still performed manually, which results in an increase in the final price, even for the large varistor manufacturers.
Future research will be focused on more details concerning the physical structure of these materials as well as on impulse regime behavior.
As observed in this work, this field of activity is a cross-border one; it is transdisciplinary, multidisciplinary, and interdisciplinary and involves the expertise of chemists, physicists, material engineers, and electric and electronic engineers.
Therefore, producing varistors continues to be a series of more empirical processes. This empiricism can be helpful from an engineering perspective until an effective technology is produced and the scientific models are further improved. Without impairing the work’s scientific integrity, this method defines our whole approach to this study. By controlling the concentration of each component and changing the thermal sintering cycle’s parameters, varistors’ electrical characteristics can be enhanced.
Author Contributions
Conceptualization, F.M.F.-I. and M.F.-I.; methodology, F.M.F.-I.; software, A.S.; validation, P.A., M.F.-I. and A.S.; formal analysis, A.S.; investigation, M.F.-I.; resources, P.A.; data curation, A.S.; writing—original draft preparation, F.M.F.-I.; writing—review and editing, F.M.F.-I.; visualization, M.F.-I.; supervision, A.S.; project administration, P.A.; funding acquisition, P.A. All authors have read and agreed to the published version of the manuscript.
Funding
This research received no external funding.
Data Availability Statement
Data are contained within the article.
Conflicts of Interest
The authors declare no conflict of interest.
References
- Nguyen, H.; Bui, A.; Loubiere, A. Role of Additives in the High-field ZnO based Varistors. In Proceedings of the International Conference on Electronic Ceramics, Aachen, Germany, 5–7 September 1994. [Google Scholar]
- Lungu, M.V. Effects of Dopants and Processing Parameters on the Properties of ZnO-V2O5-Based Varistors Prepared by Powder Metallurgy: A Review. Materials 2023, 16, 3725. [Google Scholar] [CrossRef] [PubMed]
- Korchagin, S.; Romanova, E.; Nikitin, P.; Serdechnyy, D.; Bublikov, K.V.; Bystrenina, I. Mathematical Modeling of Dielectric Permeability and Volt-Ampere Characteristics of a Semiconductor Nanocomposite Conglomerate. Mathematics 2022, 10, 596. [Google Scholar] [CrossRef]
- Matsuoka, M. Nonohmic Properties of Zinc Oxide Ceramics. Jpn. J. Appl. Phys. 1971, 10, 736–746. [Google Scholar] [CrossRef]
- Frigura-Iliasa, F.M.; Musuroi, S.; Sorandaru, C.; Vatau, D. Case Study about the Energy Absorption Capacity of Metal Oxide Varistors with Thermal Coupling. Energies 2019, 12, 536. [Google Scholar] [CrossRef]
- Sedky, A.; El-Brolossy, T.A.; Mohamed, S.B. Correlation between sintering temperature and properties of ZnO ceramic varistors. J. Phys. Chem. Solids 2012, 73, 505–510. [Google Scholar] [CrossRef]
- Simo, A.; Frigura-Iliasa, F.M.; Frigura-Iliasa, M.; Andea, P.; Musuroi, S. Service Limits for Metal Oxide Varistors Having Cylindrical Symmetry as Function of the Ambient Temperature. Symmetry 2022, 14, 1351. [Google Scholar] [CrossRef]
- Frigura-Iliasa, F.M.; Musuroi, S.; Sorandaru, C.; Vatau, D. New Technical Parameters and Operational Improvements of the Metal Oxide Varistors Manufacturing Process. Processes 2019, 7, 18. [Google Scholar] [CrossRef]
- Latiff, N.A.A.; Illias, H.A.; Bakar, A.H.A.; Dabbak, S.Z.A. Measurement and Modelling of Leakage Current Behaviour in ZnO Surge Arresters under Various Applied Voltage Amplitudes and Pollution Conditions. Energies 2018, 11, 875. [Google Scholar] [CrossRef]
- Tarfulea, N.; Frigura-Iliasa, F.M.; Vatau, D.; Andea, P.; Balcu, F.; Macarie, A. A new Algorithm for the Design of Metal Oxide Varistor Surge Arresters. In Proceedings of the 2016 IEEE 16th International Conference on Environment and Electrical Engineering (EEEIC), Florence, Italy, 7–10 June 2016. [Google Scholar]
- Loncar, B.; Vujisic, M.; Stankovic, K.; Osmokrovic, P. Stability of Metal-Oxide Varistor Characteristics in Exploitation Conditions. Acta Phys. Pol. 2009, 116, 1081–1084. [Google Scholar] [CrossRef]
- Cheng, L.; Li, G.; Yuan, K.; Meng, L.; Zheng, L. Improvement in Nonlinear Properties and Electrical Stability of ZnO Varistors with B2O3 Additives by NanoCoating Method. J. Am. Ceram. Soc. 2012, 95, 1004–1010. [Google Scholar] [CrossRef]
- Masoumeh, D.; Azmi, Z.; Yadollah, A.; Mansor, H.; Seyedehmaryam, M. Optimization of Bi2O3, TiO2, and Sb2O3 Doped ZnO-Based Low-Voltage Varistor Ceramic to Maximize Nonlinear Electrical Properties. Sci. World J. 2014, 2014, 741034. [Google Scholar] [CrossRef]
- Kulawik, J.; Skwarek, A. Electrical and microstructural characterization of doped ZnO based multilayer varistors. Microelectron. Int. 2017, 34, 110–115. [Google Scholar] [CrossRef]
- Li, S.T.; He, J.Q.; Lin, J.J.; Wang, H.; Liu, W.F.; Liao, Y.L. Electrical-Thermal Failure of Metal-Oxide Arrester by Successive Impulses. IEEE Trans. Power Deliv. 2016, 6, 2538–2545. [Google Scholar] [CrossRef]
- Seyyedbarzegar, S.M.; Mirzaie, M. Thermal balance diagram modelling of surge arrester for thermal stability analysis considering ZnO varistor degradation effect. IET Gen. Transm. Distrib. 2016, 7, 1570–1581. [Google Scholar] [CrossRef]
- Seyyedbarzegar, S.M. A new approach to electrical modeling of surge arrester considering temperature effect on V-I characteristic. Measurement 2017, 111, 295–306. [Google Scholar] [CrossRef]
- Lu, J.; Xie, P.; Fang, Z.; Hu, J. Electro-Thermal Modeling of Metal-Oxide Arrester under Power Frequency Applied Voltages. Energies 2018, 11, 1610. [Google Scholar] [CrossRef]
- Christodoulou, C.A.; Vita, V.; Mladenov, V.; Ekonomou, L. On the Computation of the Voltage Distribution along the Non-Linear Resistor of Gapless Metal Oxide Surge Arresters. Energies 2018, 11, 3046. [Google Scholar] [CrossRef]
- Fang, Z.; Wang, B.; Lu, J.; Jiang, Z. Study on Impulse Breakdown Characteristics of Internal-Gap Lightning Protection Device Applied to 35 kV Distribution Line. Energies 2018, 11, 1758. [Google Scholar] [CrossRef]
- Wan Abdullah, W.R.; Zakaria, A.; Ghazali, M.S.M. Synthesis Mechanism of Low-Voltage Praseodymium Oxide Doped Zinc Oxide Varistor Ceramics Prepared Through Modified Citrate Gel Coating. Int. J. Mol. Sci. 2012, 13, 5278–5289. [Google Scholar] [CrossRef]
- Pronin, I.; Yakushova, N.; Averin, I.; Karmanov, A.; Moshnikov, V.; Dimitrov, D. Development of a Physical Model of Thermovoltaic Effects in the Thin Films of Zinc Oxide Doped with Transition Metals. Coatings 2018, 8, 433. [Google Scholar] [CrossRef]
- McBride, M.; Persson, N.; Reichmanis, A.; Grover, C.D. Solving Materials’ Small Data Problem with Dynamic Experimental Databases. Processes 2018, 6, 79. [Google Scholar] [CrossRef]
- Li, S.; Mirlekar, G.; Ruiz-Mercado, G.J.; Lima, F.V. Development of Chemical Process Design and Control for Sustainability. Processes 2016, 4, 23. [Google Scholar] [CrossRef]

Disclaimer/Publisher’s Note: The statements, opinions and data contained in all publications are solely those of the individual author(s) and contributor(s) and not of MDPI and/or the editor(s). MDPI and/or the editor(s) disclaim responsibility for any injury to people or property resulting from any ideas, methods, instructions or products referred to in the content. |
© 2023 by the authors. Licensee MDPI, Basel, Switzerland. This article is an open access article distributed under the terms and conditions of the Creative Commons Attribution (CC BY) license (https://creativecommons.org/licenses/by/4.0/).