Article

A Novel Classification Model of Date Fruit Dataset Using Deep Transfer Learning

by
Amjad Alsirhani
1,2,
Muhammad Hameed Siddiqi
1,
Ayman Mohamed Mostafa
1,3,*,
Mohamed Ezz
1,4 and
Alshimaa Abdelraof Mahmoud
5
1
College of Computer and Information Sciences, Jouf University, Sakaka 72388, Aljouf, Saudi Arabia
2
Faculty of Computer Science, Dalhousie University, Halifax, NS B3H 4R2, Canada
3
Faculty of Computers and Informatics, Zagazig University, Zagazig 44519, Egypt
4
Faculty of Engineering, Al-Azhar University, Cairo 11884, Egypt
5
Department of Information Systems, MCI Academy, Cairo 00202, Egypt
*
Author to whom correspondence should be addressed.
Electronics 2023, 12(3), 665; https://doi.org/10.3390/electronics12030665
Submission received: 29 December 2022 / Revised: 15 January 2023 / Accepted: 26 January 2023 / Published: 28 January 2023

Abstract

:
Date fruits are the most common fruit in the Middle East and North Africa. There are a wide variety of dates with different types, colors, shapes, tastes, and nutritional values. Classifying, identifying, and recognizing dates would play a crucial role in the agriculture, commercial, food, and health sectors. Nevertheless, there is no or limited work to collect a reliable dataset for many classes. In this paper, we collected the dataset of date fruits by picturing dates from primary environments: farms and shops (e.g., online or local markets). The combined dataset is unique due to the multiplicity of items. To our knowledge, no dataset contains the same number of classes from natural environments. The collected dataset has 27 classes with 3228 images. The experimental results presented are based on five stages. The first stage applied traditional machine learning algorithms for measuring the accuracy of features based on pixel intensity and color distribution. The second stage applied a deep transfer learning (TL) model to select the best model accuracy of date classification. In the third stage, the feature extraction part of the model was fine-tuned by applying different retrained points to select the best retraining point. In the fourth stage, the fully connected layer of the model was fine-tuned to achieve the best classification configurations of the model. In the fifth stage, regularization was applied to the classification layer of the best-selected model from the fourth stage, where the validation accuracy reached 97.21% and the best test accuracy was 95.21%.

1. Introduction

Date fruits are the most common fruit in the Middle East and North Africa. Many dates have different types, colors, shapes, tastes, and nutritional values. Statistics from the Ministry of Agriculture in Saudi Arabia (SA) show that the annual volume of production of dates in SA is approximately one million tons from an estimated 2425 million palm trees. This indicates that 15 percent of global production is from SA [1,2].
Date fruits occupy the first place in terms of consumption and commercial value among other fruits in SA. A palm tree is a perennial tree that has lived for over a hundred years. The palm tree is called palm X; therefore, its produced dates are called date X. The date remains the same every year for the period of the tree’s age, in which the type and shape do not change.
For farmers to preserve the right varieties, the shoots are transported, distributed, and planted again. Interestingly, regarding palm trees, plantations use seeds to grow palms, and a new variety rarely becomes similar to the mother. Each region of the kingdom is famous for one or two types of dates. There may be rare species that do not have commercial value and are not widespread among farmers. This type may have a high nutritional value and quality, and this variety is not included in the database. The volume of sales and trade exchange of dates in SA is very high. There is no comparison with any other fruit as well as the amount of production of dates. Additionally, still, many stages of date production work in a manual and nonautomatic manner. Moreover, there is no harmony between the volume of sales and the amount of research presented on dates’ value. On the other hand, many people are ignorant of good dates and their actual nutritional value. With this obstruction, there is little or no research in the classification, identification, and recognition of dates. Development of this research may double the quantity of production and the value of sales and give a clear scientific perception of the nutritional value of dates, which must be followed during consumption. Building databases for dates scientifically allows for research into development and continuity, and thus for a scientific, socio-economic benefit.
Fruit classification adds a crucial role in the agriculture, commercial, food, and health sectors [3]. Date fruit contains several characteristics, including color, shape, and size. Pollen begins in April when it is pollinated manually by farmers or naturally by wind and insects. Dates start out green and then turn red or yellow, as shown in Figure 1, where at the equator, the color turns from red to black, and dates that are yellow turn from yellow to brown. These stages are called Khalal, Rutab, and Tamar, respectively. The date may be consumed as Tamar, Rutab, or Khalal.
On the commercial aspect, this dataset may build models that provide competitive prices and determine approximate prices. It represents the estimated average annual dates for each palm tree in SA, which is approximately 48.0 kg, with a sale price ranging between 3 and 10 SAR/kg. This dataset has potential in many aspects, including commercial, agricultural, and health. From the agricultural perspective, this dataset may be used to build models for the classification and identification of dates, which enriches the farmers’ knowledge. This dataset may be used to construct models for classifying and identifying date species’ nutritional content from a health perspective. The developed dataset will provide the research community with a new research direction as researchers can develop their classification or identification model on this dataset. The classification application can be used for harvesting or commercial purposes.
The contribution of the paper is proposed as follows:
  • We design a novel date fruit dataset collected by picturing 3228 date images classified into 27 classes.
  • We provide a comprehensive review of existing date fruit datasets with their characteristics, limitations, and proposed classification method.
  • We manage and process the imbalanced classes using a class weight approach that assigns a higher value to a minority population.
  • The overall weight is calculated by measuring the weight for each assigned class and their training samples. The weighted average is calculated by calculating all assigned class weights.
  • We apply different machine learning algorithms as a baseline score for the classification of date fruit.
  • We apply deep transfer learning using DenseNet architecture based on CNN that provides efficient overhead with less than half the number of parameters compared to other models.
  • We perform fine-tuning on the feature extraction model to enhance the validation accuracy.
  • The fully connected layer of the model is fine-tuned to achieve the best classification configurations of the model.
  • We perform a regularization process on the classification layer to reduce the complexity of the deep learning network.
The remaining paper sections are organized as follows. In Section 2, the date fruit dataset is reviewed with recently published date classification. Section 3 presents the image acquisition method for date fruits. Section 4 proposes the experimental results and performance of the model. Section 5 explores the overall classification of the dates’ classes. Finally, the paper is concluded in Section 6.

2. Related Works

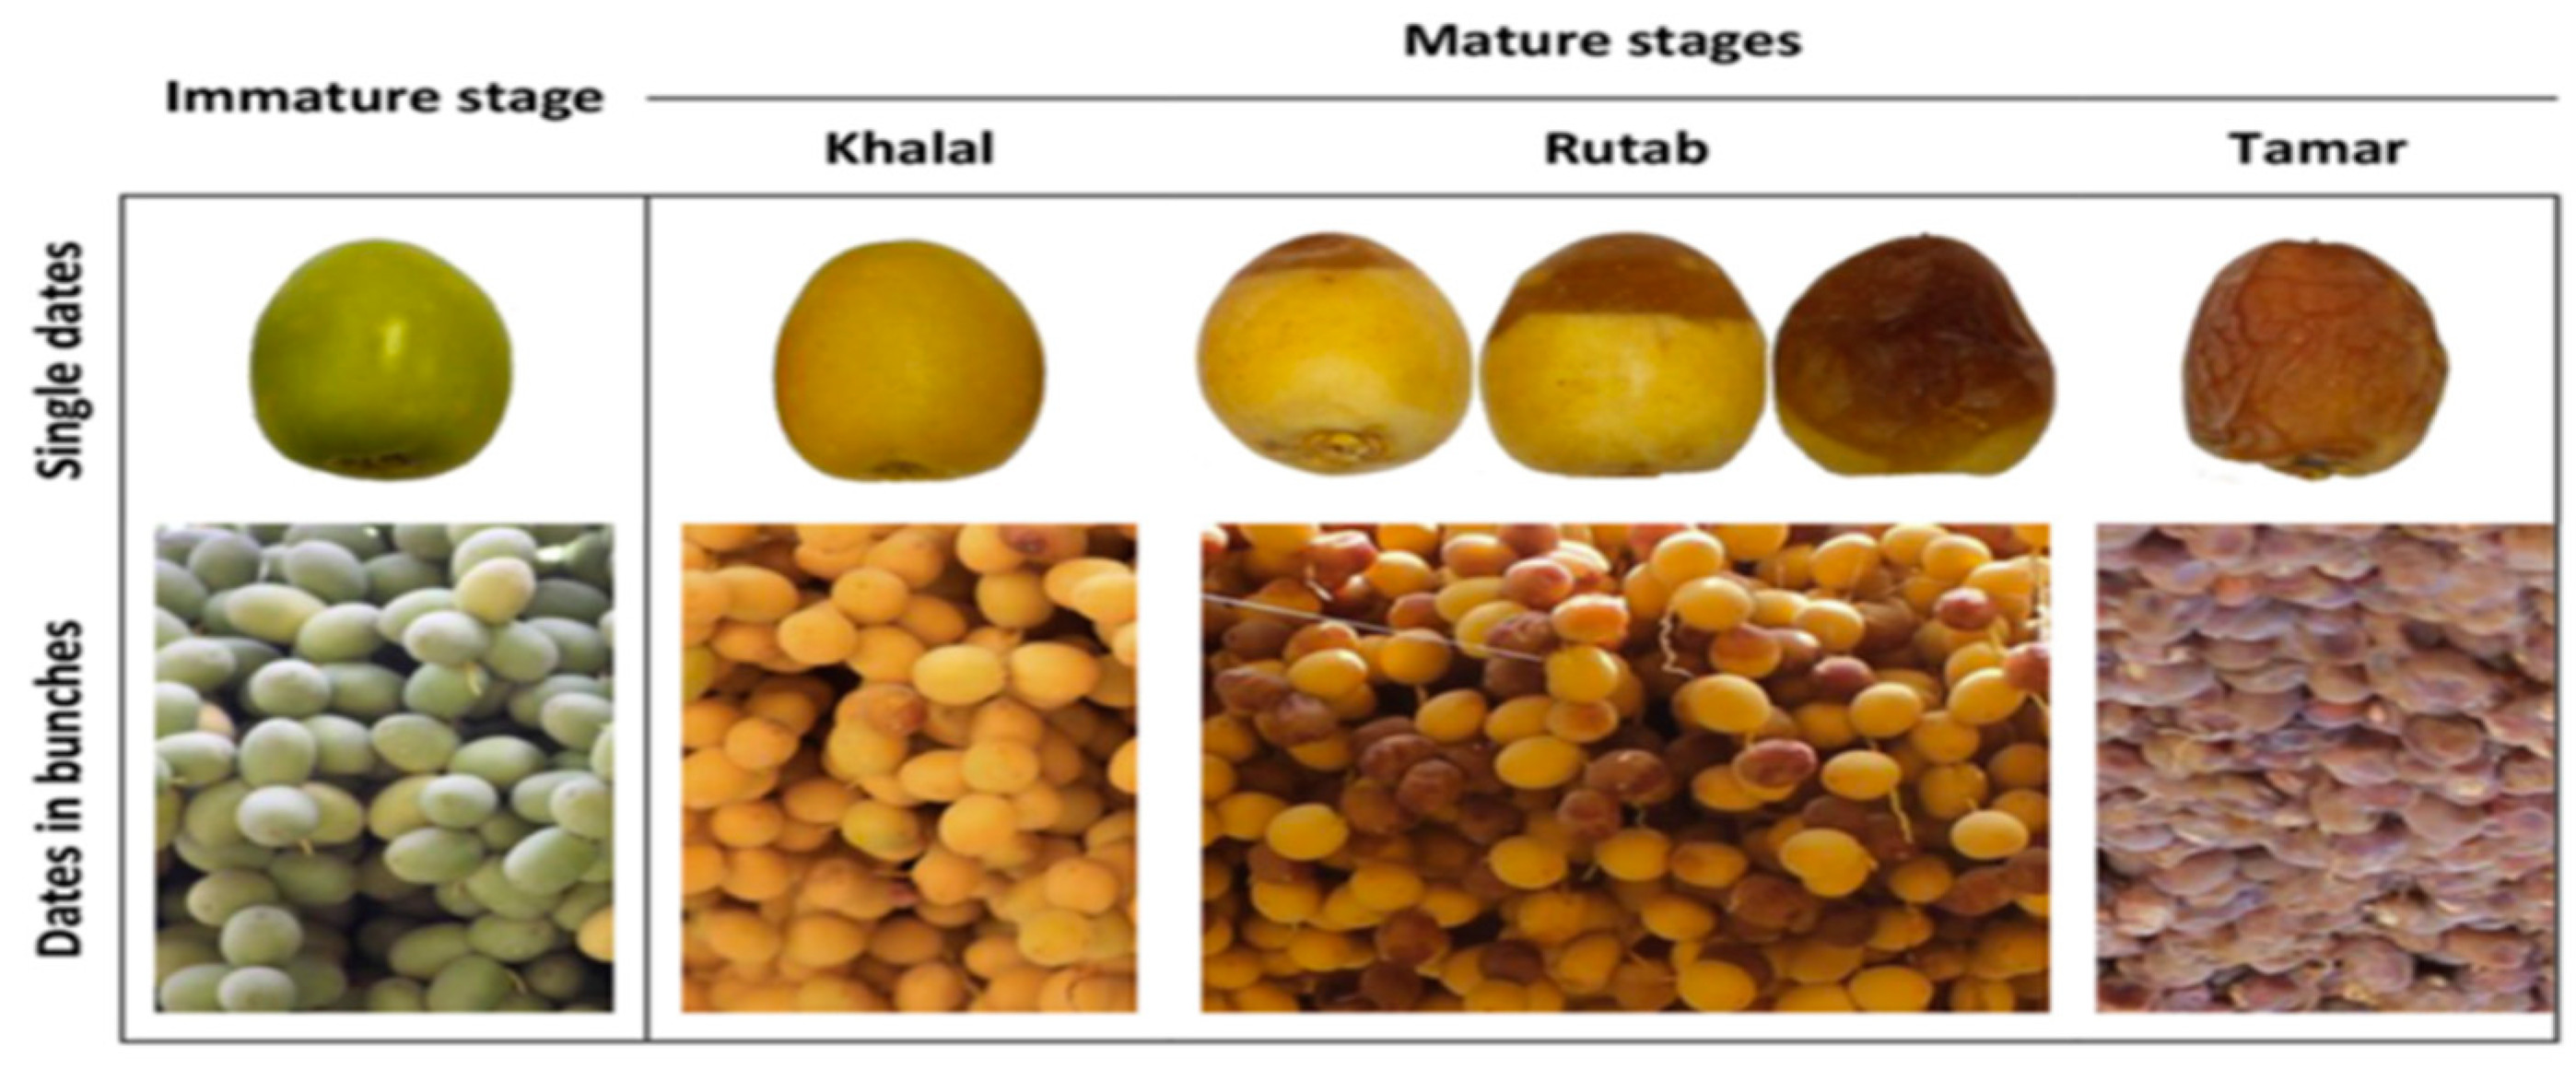
2.1. Background of Date Fruit

Dates are the fruit produced from palm trees. It is a summer fruit that is widespread in the Arab world. The characteristics of dates include taste and texture, which differ and can only be predicted if they have been tasted before. Fruit classification has been widely researched in image recognition and image classification. Table 1 shows examples of fruit datasets used for classification applications.
Tang et al. [20] proposed an application that applied harvesting robots for picking and collecting the fruits. The methods reviewed were localization, fault tolerance of complex agricultural environments, 3D reconstruction, and target recognition. The technology of digital image processing and algorithms of deep learning were considered the main and recent methods for analyzing fruits. For these classification approaches to achieve high classification accuracy, they must be based on an accurate dataset. In the literature, there are many publicly available standard datasets; however, each has its limitations. Table 2 presents the existing datasets with their characteristics and limitations.

2.2. State of the Art in Datasets

This section discusses the state-of-the-art approaches in the date fruit dataset, and each approach is discussed separately with its complete methodology. The authors of [2] proposed a classification method that models the process of harvesting and collecting fruits using deep learning models. The dataset used had 8000 images; however, these images belonged to only five classes. Moreover, the small number of the class will not provide robustness in the classification accuracy for harvesting decision-making model accuracy.
Mohammed et al. [21] proposed a similar approach as in [2]. They proposed a decision system that collected date fruits with an intelligent way of using different models of computer visions. The dataset was applied based on the estimation of weight that contained more than 152 date bunches from 13 palms, where the images were collected with a white background. In addition, the size of the dataset was relatively small. The authors of [22] proposed a classification method for processing images of date fruits. They intensively studied one kind of date fruit, considering the growth stages as the classes. The features they focused on were the date’s color, size, and skin texture. These features, as they claim, can help evaluate both the maturity status and defects. It is also possible to classify the date category and evaluate the defects by evoking the fruit size. However, the date fruit has wide varieties in which the testing and validation of different models might not be generalized against small data. Altaheri et al. [23] built a date fruit dataset for intelligent harvesting in their previous proposal [2]. Date-fruit-harvesting processes, including sorting, quality checking, and inspection, become challenging tasks for the farmer–owners and laborers. Scaria et al. [24] reviewed a robotic system for manipulating the quality of the palm date fruits and other fruit classification. Diboun et al. [25] built an immature-date-fruit dataset to reach the field of such a dataset as there is a limited offer of collecting such a dataset. They used metabolomics techniques to sample the dataset. They collected 109 classes of different dates that were not unique; that is, if the exact date variety was collected from a different country, it was counted twice. The focus of this study can benefit the nutritional analysis of dates. However, they had only ten classes that can be considered date classes.
Table 3 shows a summary of existing publicly available date fruit datasets, including their limitations, and how the proposed dataset overcame those limitations. Table 4 summarizes dataset classes’ details including the date’s name, number of images, color, shape, texture, and the percentages of the image collection environment.

2.3. Major Limitations of the Existing Datasets

It can be seen from Table 4 that most of the existing datasets had a limited number of classes. Thus, building a model based on these datasets is quite unrealistic. On the other hand, some of the datasets relied on one kind of camera, which might be something other than a real-world case. Furthermore, most of the datasets were collected in controlled environments, which means the domains for most of these datasets were not naturalistic. Accordingly, in this paper, we created a novel date fruit dataset that considered most of the limitations of the existing datasets. The dataset was collected from various environments such as farms and shops (such as an online or local market) and offered to guests. The dataset was collected through different resources under various environments such as morning, midday, evening, and cloudy. The built dataset has 27 classes, whereas none of the existing datasets has reached that number of instances. The proposed dataset can be used for many applications, such as classification, identification, and regression, bringing financial benefit to various fellowships. The last column of Table 4 presents the strength of the proposed dataset.

2.4. Research Gap Finding

In this section, the research gap of recent research methodologies is provided. As explained in Table 5, different research models for classifying date fruit are compared, and the applied methodology, used datasets, and classification accuracy are provided.
In the IHDS [23], the authors utilized computer vision (CV) methods and deep learning (DL) techniques using a CSRR dataset; the accuracy achieved was 99.4%. In the CADF approach [30], the author utilized SVM, decision tree (DT), random forest classifier (RF), and neural network (NN) using a self-built dataset. The accuracy was 91%, 65%, 56%, and 69%, respectively. In DMSC [22], the authors utilized MATLAB’s built-in function for classifying the self-built dataset, which was unavailable. They claimed that they achieved 100%. In HW/SW co-design [28], the authors employed the ANN algorithm to classify the self-built dataset, consisting of 600 images of 6 classes. The classification accuracy achieved was 97.26%. In the AIEQDF approach [29], the authors utilized a key-point detection method, a bag of the feature classification algorithm, and a support vector machine (SVM) to classify a self-built dataset that contained only 2 classes and 500 images. The accuracy achieved was 99%. In the ADFCLT approach [12], the author used an SVM classifier to classify a self-built dataset that contained only 80 images of 4 classes. The achieved accuracy was 99%. In the APCP approach [27], the authors identified a stereomicroscope and microscopic observation of seven-day colonies. They used a self-built dataset that had 20 samples of two classes. The achieved accuracy was 94%. In the DLASDF framework [26], the authors utilized deep convolutional neural networks (CNNs) and transfer learning with fine-tuning using two pre-trained CNN models.

3. Proposed Date Fruit Dataset

3.1. Image Acquisition

This research was carried out to collect a unique and comprehensive dataset to correctly identify the desired date fruit for a different variety. The dataset collection for a research objective signifies its strength and works as the fundamental evaluation metric to achieve the desired results. The existing datasets are monotonic and have limitations in representing a variety of conditions in a natural environment. We collected this dataset after a long struggle by selecting appropriate images with an appropriate situation and surroundings based on existing datasets’ limitations. Images of dates were mostly collected during the date harvest period in the Al-Jouf region from June to November 2022. We took several steps in collecting data and focused on collating the images from a photorealistic environment. The pictures were collected in different lighting, such as night and day. The photographing side was also considered so that the photograph was taken vertically and horizontally with different angles. The pictures’ distances were also accounted for, with a maximum distance of 10 cm to 3 m. Three different environments were considered while images were collected. The first environment was the agricultural environment; the second was the commercial and social environment. In the agricultural environment, images were collected from more than thirteen farms distributed in the Al-Jouf region as they were collected on different days.
In the commercial environment, dates were collected from shops and markets in Al-Jouf, and social media platforms were used to collect some advertisements for dates. Whatever was offered at an event or a visit was considered to be in a social setting. The dates were served with coffee, as the authors benefited from collecting date images. That is a social custom in the northern region of SA called Al-Jouf. Table 4 shows the specs of the cameras used in collecting our dataset.

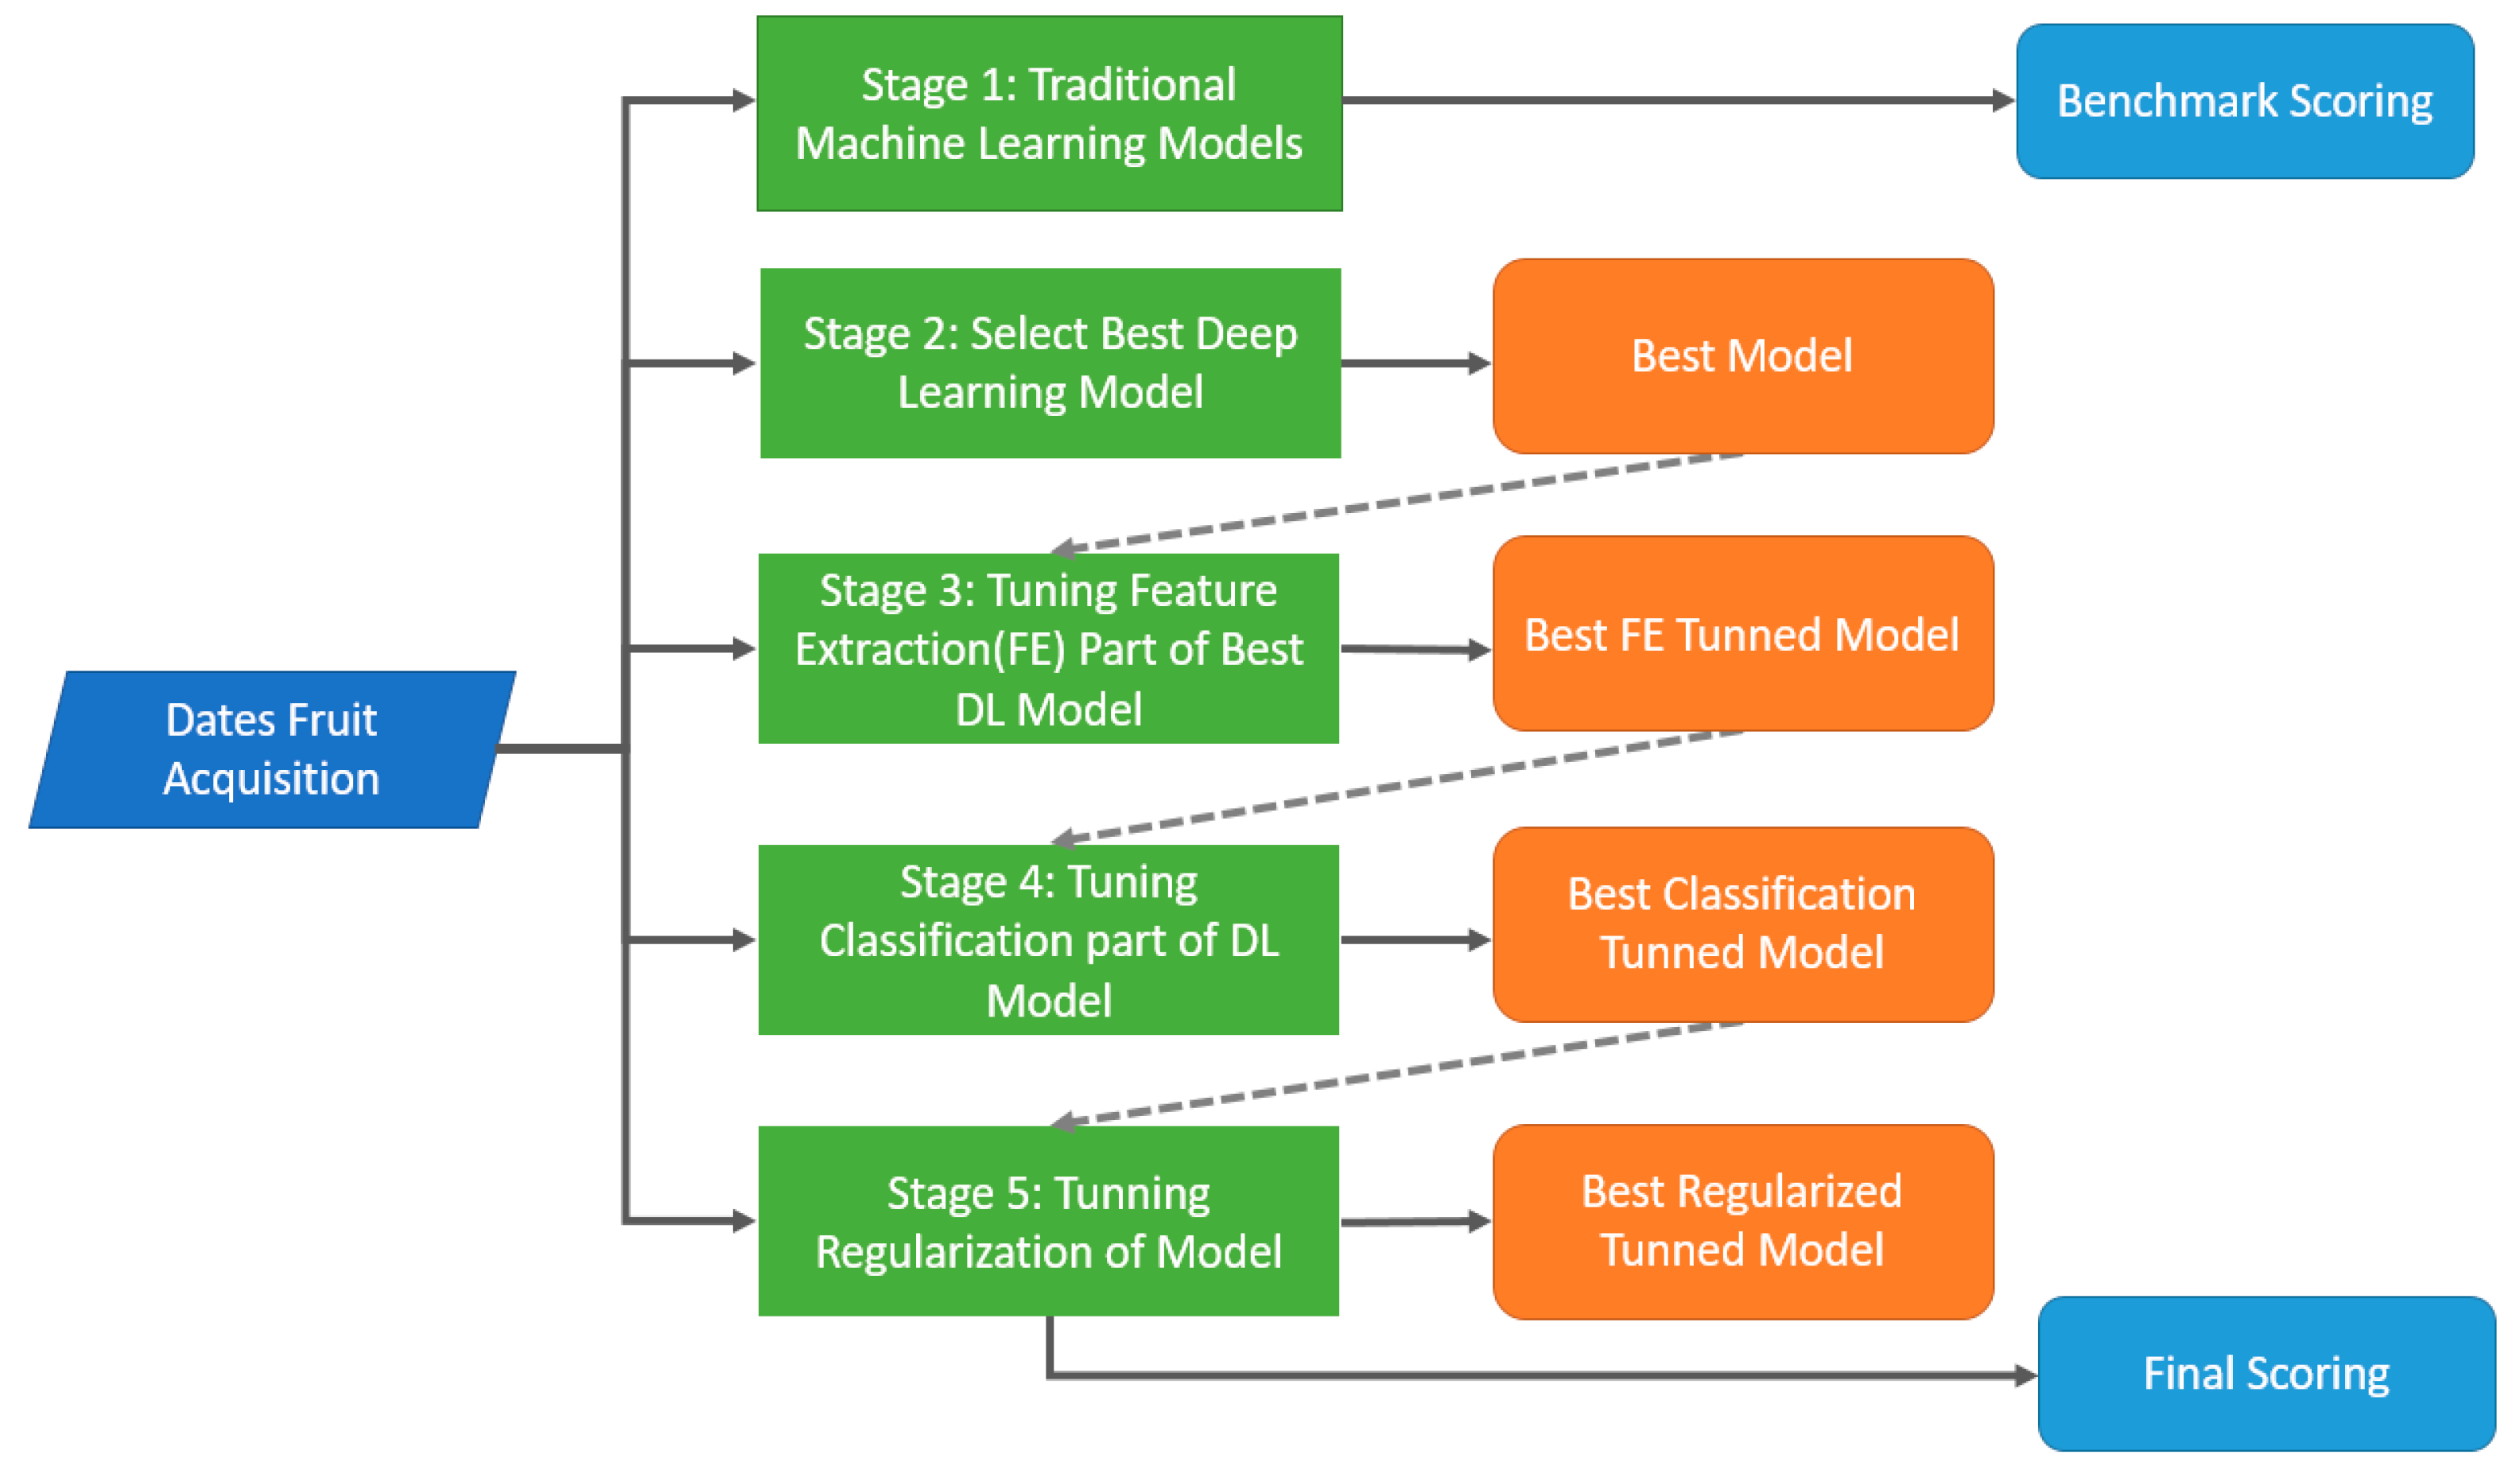
3.2. Proposed Model Flowchart

As shown in Figure 2, the flowchart of the proposed approach provides a comprehensive view of the major steps of date fruit classification. The process starts by acquiring the date fruit dataset with different classes. Different data classification and accuracy steps are processed to measure the performance starting from applying traditional machine learning algorithms. Deep transfer learning is applied to select the best model; then, fine-tuning is executed on the feature extraction to select the best model. The feature extraction part of the model is fine-tuned by applying different retrained points and then measuring the accuracy to select the best-retrained point of the selected model. Finally, the regularization of the classification layer is applied to the best-selected model that achieves the lower complexity overhead.

3.3. Dataset Classes

In this section, all classes are described in short with one sample. Three aspects, color, shape, and texture, are described in each of these classes. This dataset is made publicly available for future research to the research community and can be accessed at http://doi.org/10.5281/zenodo.4639543 (accessed on 20 November 2022).
Al-ajwa is one of the most sold dates in SA for cultural reasons and eating dates in the morning flushes toxins out of the body. Its color is red in the Khalal stage and turns dark black at full maturity (i.e., the Tamar stage). Its shape is ovoid, and the texture is a sheen crust that breaks down over time. Figure 3 shows a sample of Al-ajwa dates. The number of instances in this class is 112 images.
The Al-helwa dates is among the most popular varieties in the north of SA. It has a sweet taste and will be considered the best if it is fair between the Tamar and Khalal stages. Al-Kanz stores date fruits after they become Tamar, as they are dried in the sun for two or five days. They are then stored for a period of up to a few months. The color turns black when it becomes Tamar, when it is entrusted or dried and treasured. The shape of this kind is cylindrical and has a soft and mushy texture. Figure 4 shows a sample of Al-helwa dates. The number of instances in this class is 100 images.
Al-helwa Macnooz date is also sweeter when it turns to Tamar. When dates are stored after harvest, some varieties can be stored, whereas others can be only frozen. Al-helwa can be stored to produce more molasses. Therefore, the shape and the taste are different. Its color is black. This date has a cylindrical shape with a solid and sticky texture. Figure 5 shows a sample of Al-helwa Macnooz dates. The number of instances in this class is 155 images.
The Al-husseiniya date is the second most popular type of date in the northern region of SA, and it is not mentioned for its spread in other regions. It possesses an excellent taste. The Khalal is not edible because the bitter taste is rare and barely known in the northern regions. It is distinguished by its sweet taste, as the mixture of dates with the Khalal makes it more harmonious. It cannot be treasured, which is due to the large proportion of water in it. It is eaten directly at harvest time and cannot be refrigerated. Nevertheless, it can be eaten when only moist, must be or hoarded. Its color is yellow in the Khalal stage, whereas in the Tamar stage, it is dark brown. It is smaller in size than Al-helwa. The shape of Al-helwa is cordate, and the texture is solid and dry. Figure 6 shows a sample of Al-husseiniya dates. The number of instances in this class is 91 images.
Al-hyza is a rare species and is barely known except in the northern regions of SA. It is characterized by its sweet taste, as the mixture of dates with the Khalal makes it more harmonious. It cannot be treasured due to the large proportion of water in it. It is eaten directly at harvest time and cannot be refrigerated. They are yellow in the Khalal stage and dark brown in the Tamar stage. The shape of these dates is cylindrical. Its shape is a crust that makes them unpleasant to eat if they become entirely Tamar. Its texture is a soft crust. Figure 7 shows a sample of Al-hyza dates. The number of instances in this class is 50 images.
Al-barhi is one of the most famous types of dates in SA. It is characterized and described as being consumed during the crushing stage due to its distinctive taste. Nevertheless, it does not have the same taste when it becomes Tamar. It is not one of the types of dates that are treasured. Its price in recent years has become low due to its extensive spread in different SA regions. Its color is bright yellow. On the other hand, the shape of this kind of date is cordate, similar to the size of a large olive. This type has a soft solid texture. Figure 8 shows a sample of Al-barhi dates, and the number of instances of this class is 120 images.
The Al-bowytha date is a type of date characterized by the quality of its taste and the durability of the atmosphere. It is assigned dry or hoarded, but it is rare for a unit due to its low water percentage. It is also stored frozen, more than it is consumed at harvest time, to be consumed in the winter. Al-bowytha’s color is brown. It has a fusiform shape and its size ranges between 3 and 4 cm. The soft crimped texture makes the Al-bowytha dates unique. Figure 9 shows a sample of Al-bowytha dates. The number of instances in this class is 180 images.
The Al-kelas date is one of the most famous dates in SA and is also spread in neighboring countries. It is distinguished by its high price, quality, and distinctive taste. It can be eaten in the Khalal stage, and it can be treasured and served hoarded. Its color is yellow, and it changes to a bright brown when it reaches the Tamar stage. The ovoid is the closest shape that describes this kind of date. The Al-kelas date is small and has a soft and sticky texture. Figure 10 shows a sample of Al-kelas dates. The number of instances in this class is 152 images.
Al-khasab has a limited spread restricted to the Jouf region of SA. The taste of this date is terrific and pleasant. Al-khasab has similarities to Al-hilalia dates in shape and texture but not color or taste. The color of the Al-khasab date is shiny black. Al-khasab dates are small in size, and they have a globose shape. The texture rapidly changes from soft solid to crimp. Figure 11 shows a sample of Al-khasab dates. The number of instances of the Al-khasab class is 106 images.
Al-khasab has abundant distribution that is limited to the Jouf region of SA. The taste of this date is tremendous and pleasant. Al-khasab has similarities to Al-hilalia dates in two aspects: shape and texture, but not color or taste. The color of the Al-khasab date is shiny red. Al-khasab dates are small in size, and they have a globose shape. The texture is a soft solid. Figure 12 shows a sample of Al-khasab Khalal dates. The number of instances of the Al-khasab Khalal class is 139 images.
Al-maktoumi date is spread in several areas of SA. It is eaten in the Khalal and Tamar stages. However, it is not preferable if it becomes Tamar due to the high molasses content. Likewise, it is not preferable to eat it secretly as it has passed through the taste stage. The Al-maktoumi tree is an early fruiting palm with high market value. This kind is yellow in the Khalal stage and turns brown in the Routab stage. The shape of this date is cordate. On the other hand, the texture of the Al-maktoumi date is solid. Figure 13 shows a sample of Al-maktoumi dates. The number of instances in this class is 126 images.
Al-mabroum is spread in large parts of SA. It contains a medium molasses content, which means it is best eaten when the dates become Tamar entirely. Its color is dark yellow and turns dark brown, close to black, upon maturity. The dates are long and thin with a cylindrical shape. The texture of the date is crimped and soft but stiff. Figure 14 shows a sample of Al-mabroum dates. The number of instances in this class is 118 images.
Al-madjool is similar to Al-sagai to some extent in terms of shape, but not the color, which tends to be black at the Tamar stage. There is no similarity in all the tastes, and Al-sagai is considered much better than it. It is characterized by its cold taste, meaning very little sugar; thus, it is liked by many people with diabetes. The color of Al-majdool dates is primarily brown. It is almost a fusiform shape with increased size. Figure 15 shows a sample of Al-majdool dates. The number of instances of this class is 115 images.
Al-masyihia date is very soft, as its name indicates. It is eaten when it is Tamar, but it is consumed sparingly. However, it is not preferred to eat because it is rich in molasses, which indicates a high percentage of sugar and the taste of molasses. It is impossible to eat the Khalal from it because of its bitter taste. Al-masyihia is a yellow date. The shape of this kind is globose. In another aspect, it is very soft and syrupy in texture. Figure 16 shows a sample of Al-masyihia dates. The number of instances of this class is 31 images.
The Al-muraaya date is a rare species that only spreads north of SA. It is considered a late palm date which increases its market value. It has a concentrated molasses taste due to the richness of molasses and high sugar, which makes its consumption better when half-ripe. It cannot be stored or cooled due to the high molasses content. The color of the Khalal stage is yellow, while at the ripe stage, it turns brown. The shape of the date is close to the Al-barhi date and can be described as an ovoid. In another regard, it is soft and even-textured. Figure 17 shows a sample of Al-muraaya dates. The number of instances of this class is 50 images.
The Salma date has a terrific taste at the Khalal stage. However, the Tamar stage is not preferred by consumers compared to the taste of Khalal. This kind of date’s production period is shorter than many other dates, resulting in fewer offers with high demand and, therefore, high market values. The date is shiny-yellow-colored and close to an ovoid shape. The texture, on the other hand, is soft, satiny, and even-textured. Figure 18 shows a sample of Salma dates. The number of instances in this class is 236 images.
Soor is a type of dry date with a meager percentage of molasses. As with all types of dry dates, the advantage is that it can remain for a long time and is not affected by the weather. It tastes moderate and does not contain high sugar. At the Khalal stage, the color is yellow for this date, whereas it turns yellow-gray in the Tamar stage. The shape is conical; however, the date has a coarse chewy texture. Figure 19 shows a sample of Soor dates. The number of instances of this class is 142 images.
The Al-shagra date is blond in the Khalal stage and blueberry in the Tamar stage. It is very similar to the Al-helwa dates in shape and texture. However, they have different tastes and colors. It is considered one of the dates rich in molasses. They can be hoarded but not cooled. It has a brown color at most of the late maturity stage. It is cylindrical if it is not tangled at the storage stage. It has a resin-like texture. Figure 20 shows a sample of Al-shagra dates. The number of instances of this class is 112 images.
The Al-sagai date is one of the most famous dates in SA. Al-sagai palm is grown in different regions. It is considered one of the most expensive varieties of dates. It is characterized by its cold sweet taste, which makes it a distinct type. It is mostly consumed when it is in the Ratoob stage. Its color is yellow, and it becomes blond in later stages. Its shape is cylindrical, and the texture is resin-like. Figure 21 shows a sample of Al-sagai dates. The number of instances of this class is 146 images.
The Al-skari date is considered one of the most popular dates in SA and is exported to other countries. It is characterized by its nutritional value and sweet, nonburning taste. What distinguishes this species is its ability to withstand different atmospheres after being harvested. The price per kilo ranges from SAR 30 to 100. Its color is yellow in the Khalal stage and turns light brown after ripening. The shape is cordate, and the dates resemble a large head of almond. The Al-skari date’s texture is soft in the Khalal period and becomes even-textured in the Tamar stage. Figure 22 shows a sample of Al-skari dates. The number of instances of this class is 131 images.
Al-skari Macnooz is considered one of the highest-consumption dates in SA due to its availability year-round. The color of this date is mostly golden; even some call it the gold date. It is conical in shape. On the other hand, the texture is sticky. Figure 23 shows a sample of Al-skari Macnooz dates. The number of instances of this class is 102 images.
The Al-asylaa date is a dry, sweet date, and its distribution is limited to the northern region of SA. Al-asylaa has a dark-yellow color. Even though the shape is described as cylindrical, the size and thickness get smaller as time passes due to the dryness of the dates. Al-asylaa date has a sleek texture. Figure 24 shows a sample of Al-asylaa dates. The number of instances of this class is 121 images.
Sagai, in the Arabic language, means dry date fruit. IRAQ is the original region for this kind of date and its distribution. It has a unique taste that makes it distinguishable from other dates. It is spread in many countries. It is shiny yellow in the Khalal stage and turns brown in the Tamar stage. Its shape can be described as cylindrical. However, the texture changes based on the maturity stage; it is soft in the Kala stage but scabrous in the Tamar stage. Figure 25 shows a sample of Sagai dates. The number of instances of this class is 69 images.
NbotAli is one of the most well-known dates. It is a dry, sweaty date which increases its affordability since its expiration dates are longer. The color of this kind is light brown and has a conical shape. Scabrous is the closest texture that can describe the NbotAli date. Figure 26 shows a sample of them. The number of instances of this class is 141 images.
Al-rashudia is one of the most well-known kinds of dates. It is dry sweaty, dates, and widely grows in the middle area of SA. The date’s color is brown in most of the stages. The shape is long and cylindrical, approximately 5 cm for one date. The texture is satiny, and it becomes crusty as time passes. Figure 27 shows a sample of Al-rashudia dates. The number of instances of this class is 162 images.
The Ruthant Al-Shrq date is one of the most popular dates in the city of Medina of SA. It is one of the types of dates with less molasses. The color of the Khalal is yellow and turns brown at the Tamar stage. It is distinguished by its color, as it becomes yellow with red lines. One date’s size is approximately 3 cm, whereas the weight is roughly 40 g, and it has a fusiform shape. Their texture is satiny and contains a crust after drying, and they are tough to touch and tough to eat. Figure 28 shows a sample of Ruthant Al-Shrq dates. The number of instances of this class is 132 images.
Al-hilalia is a small and shiny date. It is not sweaty but tasty. It is rare for a palm tree to produce dates in the winter. However, uniquely, this type of palm tree continuously produced dates until the middle of the winter season. Al-hilalia tends to be shiny yellow. The shape of the date is roughly globose, and its texture is soft and mild. Figure 29 shows a sample of Al-hilalia dates. The number of instances of this class is 104 images.
Photos of dates were collected during the date harvest period in the Al-Jouf region from June to November. We took several steps in collecting data and focused on collating the images from a photorealistic environment. The pictures were collected in different lighting, such as night and day. The photographing side was also considered so that the photograph was taken vertically and horizontally with different angles. The pictures’ distances were also accounted for, with a maximum distance of 10 cm to 3 m. Three different environments were considered while images were collected. The first environment was the agricultural environment; the second was the commercial and social environment. In the agricultural environment, images were collected from more than thirteen farms distributed in the Al-Jouf region as they were collected on different days. In the commercial environment, dates were collected from shops and markets in Al-Jouf, and social media platforms were used to collect some advertisements for dates. In social events, authors have taken advantage of what people offer to collect images. That is a social custom in the northern region of the Kingdom (i.e., Al-Jouf), where dates are served with coffee, as the authors benefited from collecting different varieties.
The collection of all datasets started at the beginning of May 2022 and finished by the end of November 2022. Video to Pic software [32] was used to capture the videos’ images. Most of the images were resized using ColorSync Utility software [33] to make the expression images consistent. Due to the distinct features of the collected datasets, the standard date fruit classification methodologies can be tested and validated more rigorously.

4. Experimental Results

The experimental results are conducted based on five main stages to measure the highest accuracy on the collected dataset. The dataset of 27 classes with 3228 images is split into 80% for training, 10% for validation, and 10% for testing.
There are different approaches for managing and processing the imbalanced classes, such as oversampling, undersampling, GAN (generative adversarial network) [34], and class weights. In this paper, we employed the class weights approach as a loss function that assigned a higher value to these classes with a minority population. The loss function is measured using the weighted average, where the weight of each sample is specified by class_weight with its corresponding class. The approach of the class weight is simple to apply. In addition, it is computationally an effective method to address the class imbalance, where the approach is applied during the model training.
To address the multiclass imbalance, the class weight is calculated using the following equation to give the highest weight for a small population and the smallest weight for a high population. This process is explained in equations:
N —The number of training samples.
C —The number of assigned classes C = { C 1 ,   C 2 ,   . ,   C n } .
S —The number of samples in each class S = { S 1 ,   S 2 ,   . ,   S n } .
  S i   S   &   C i   C   s u c h   t h a t     W e i g h t   [ C i ] = i = 1 n N C i   [ S i ]
Figure 30 shows a plotting diagram for the date fruit dataset divided into 27 classes ranging from 31 images for the Al-masyihia date class to 244 images for the Salma date class. Most remaining classes of date fruits ranged from 91 to 181 images. The diverse number of images was due to the different types of dates that grow at different times throughout the year.

4.1. Stage 1: Traditional Machine Learning Models

In this stage, different machine learning algorithms result in the baseline score of the dates’ classification dataset. Two feature types are used in this stage: the image raw pixel intensity and the histogram of the color distribution of the pixels in the image. The performance of the baseline models is shown in Table 6, where the random forest (RF) and support vector machine (SVM) obtained the best score of 85% accuracy based on color distribution features.

4.2. Stage 2: Deep Transfer Learning Model

In this stage, the most common deep learning models [33] are scored on the dates dataset to select the best model. Deep learning methods are used to improve the accuracy of dates’ classification [35,36]. The transfer learning (TL) technique that is intensively trained on the ImageNet dataset is used to benefit from the already trained model. The transfer learning (TL) technique is employed by removing the last classification layer of models, which classifies the 1000 classes of ImageNet and is replaced by the 27 classes of date fruit classes. The performance of the transfer learning models is shown in Table 7, which shows that the DenseNet201 achieved the highest validation accuracy of 95.67%. The best model will be tuned in the following stages to achieve the best performance by tuning the feature extraction and classification layers. The validation dataset was used to select the winning model on the dataset.
The DenseNet provides an architecture based on the convolutional neural network (CNN) with superior technology for improving accuracy on both ImageNet and CIFAR10/100 datasets without data augmentation. Furthermore, it provides an efficient computational overhead due to using fewer than half the parameters compared to other models. As presented in Figure 31, the architecture of DenseNet provides interconnectivity between layers based on a feed-forward method. This method is implemented for each dense block or between the blocks where each block will connect with all preceding blocks. Deep CNN is considered an accurate and efficient method for training data where the network obtains short connections between the layers where the layers must be close to the input or output. The N layers in the traditional CNN have different N connections between the network layers, while the DenseNet architecture provides ( N + 1 ) / 2 connections that can provide more efficiency in the experimental results.
The proposed methodology can provide different advantages. Firstly, the data propagation will increase due to the interconnection between the network layers. Secondly, avoiding the problem of vanishing gradient and the reusability of features may cause conflicting results. Finally, the size of the DenseNet network will be minimized. The DenseNet201 model that is applied in this experiment contains 201 interconnected layers for the deep CNN.
Figure 32 shows different transfer learning models are applied to the dates’ dataset to explore the highest validation performance and select the best winning model. As stated, the DenseNet201 model achieved the best results, while the DenseNet121 and DenseNet169 models achieved the second-best results with 94.12% for validation data.

4.3. Stage 3: Tuning Feature Extraction Part of Deep Learning Model

After selecting the best TL model to classify the dates’ classes, the feature extraction part of the model was fine-tuned by applying different retrained points and then measuring the accuracy to select the best-retrained point of the selected model. The retrained points started only from the model’s top for the convolutional layers. The best retrained-point results and validation accuracies are shown in Table 8. Table 8 shows that the retrained points of the model DenseNet201 (the best-performing model in stage 2) at layer 695 obtained the best validation accuracy with 95.67%. As shown in Figure 33, the DenseNet201 model with layer 695 achieved the best performance. With layer 695, the highest validation accuracy was recorded as 95.67%.
As presented in Figure 34 and Figure 35, a plotting diagram for the training accuracy and training losses for the deep transfer learning model are proposed.

4.4. Stage 4: Model-Tuning Classification

In this stage, the fully connected layer of the model is fine-tuned to achieve the best classification configurations of the model that have been obtained in stage 3 (the model with the best retrain points). Using the fine-tuned classification part, different dense layers are added after the feature extraction layers to select the best model. Then, the validation accuracy is measured for selecting the best classification configurations. The classification performance for the models using different configurations is shown in Table 9. With the dense layers 1024 and 512, the validation accuracy achieved 95.36%.
As shown in Figure 36, the overall performance is explored in the DenseNet201 model with different dense layers. The highest performance was started with dense layers 1024 and 512, while the second-highest performance was recorded 95.05% for validation accuracy.

4.5. Stage 5: Regularization of Model Classification Layers

In this stage, the regularization of the classification layer is applied to the best-selected model in stage 4. Regularization is a technique that lowers the complexity of a deep learning network during training, thus preventing overfitting. The L2 regularization employed in this research is the most common regularization technique known as weight decay. During the regularization process, the loss function is defined as Ω. The mathematical derivation of this regularization is explained below:
Ω   ( W ) =   W   = 2 2   i j w i j 2
The regularization term Ω is defined with the parameter to sum the square of the weights of the weight matrix. The value is added to the division of scalar α to the value of 2. This will formulate the following equation:
Ĺ   ( W ) = α 2     W   2 2 + L   ( W ) = α 2   i j w i j 2 + L   ( W )
The alpha parameter α is considered an additional parameter that determines the regularization of the proposed model. The classification performance for models using different regularization rates is shown in Table 10. We obtained the best score with 97.21% validation accuracy at the reg_rate 0.00015.
This final model which achieves the best retrained point, best classification configuration, and best regularization gave the best test accuracy of 95.21%.

5. Overall Classification of Dates’ Fruit Classes

As shown in Table 11, the classification report for the final model (i.e., achieved the best retrained point, best classification configuration, and best regularization) of the date classes’ performance precision, recall, F1-score, and average accuracy is explained.

6. Conclusions and Future Works

Date fruit is the most common fruit in the Middle East and North Africa. There are a wide number of different varieties of dates. They are different in color, shape, taste, and nutritional values. These differences refer to many things, such as the date’s kind, quality, and age. Dates are of high marketing value in the Middle East and the Gulf region. Nevertheless, there is inadequate effort to collect a reliable dataset for many classes. In this paper, we present our built extensive dataset of date fruits. Moreover, it achieved the best test accuracy of 95.21% after applying five stages of experiments; the first stage applied traditional machine learning algorithms and achieved 85% accuracy using RF, while in stage 2, after applying deep transfer learning, it achieved 95.67% for the DenseNet201 model. Stage 3 achieved 95.67% accuracy after selecting the best retrained points at layer 695. In the fourth stage, the best classification configuration of 1024 and 512 achieved 95.36% accuracy. Then, in the final stage, the best regularization at 0.00015 rates achieved the best accuracy of 97.21%, and the best test accuracy of 95.21% in the fully connected layer of the model will be fine-tuned to achieve the best classification configurations of the model. In the fifth stage, the regularization of the classification layer was applied to the best-selected model in the fourth stage, where the validation achieved 97.21% and the best test accuracy of 95.21%. In the future, newly collected date fruit datasets will be processed using different deep learning algorithms such as CNN to explore the performance.

Author Contributions

Data curation, A.A.; formal analysis, M.H.S.; investigation, A.A., machine learning, A.A.M.; deep transfer learning, M.E.; tuning feature extraction, A.M.M.; regularization, A.A.M.; writing original draft, A.A.; writing final draft, A.M.M.; grammar checking, M.E. All authors have read and agreed to the published version of the manuscript.

Funding

This research was funded by the DEANSHIP OF SCIENTIFIC RESEARCH—JOUF UNIVERSITY, grant number DSR2020-06-3673.

Institutional Review Board Statement

Not applicable.

Informed Consent Statement

Not applicable.

Data Availability Statement

Furnished on request.

Acknowledgments

The authors acknowledge the Deanship of Scientific research at Jouf University.

Conflicts of Interest

The authors declare no conflict of interest.

References

  1. The Food and Agriculture Organization. Available online: http://www.fao.org/faostat/en/#data/QC/visualize (accessed on 28 November 2022).
  2. Altaheri, H.; Alsulaiman, M.; Muhammad, G. Date Fruit Classification for Robotic Harvesting in a Natural Environment using Deep Learning. IEEE Access 2019, 7, 117115–117133. [Google Scholar] [CrossRef]
  3. Sa, I.; Ge, Z.; Dayoub, F.; Upcroft, B.; Perez, T.; McCool, C. DeepFruits: A Fruit Detection System using Deep Neural Networks. Sensors 2016, 16, 1222. [Google Scholar] [CrossRef] [PubMed] [Green Version]
  4. Castro, W.; Oblitas, J.; De-La-Torre, M.; Cotrina, C.; Bazan, K.; Avila-George, H. Classification of Cape Gooseberry Fruit According to its Level of Ripeness using Machine Learning Techniques and Different Color Spaces. IEEE Access 2019, 7, 27389–27400. [Google Scholar] [CrossRef]
  5. Cardenas-Pérez, S.; Chanona-Pérez, J.; Méndez, J.; Domínguez, G.; Santiago, R.; Perea-Flores, M.; Vazquez, I. Evaluation of the Ripening Stages of Apple (Golden Delicious) by Means of Computer Vision System. Biosyst. Eng. 2017, 159, 46–58. [Google Scholar] [CrossRef]
  6. Lal, S.; Behera, S.; Sethy, P.K.; Rath, A. Identification and Counting of Mature Apple Fruit Based on Bp Feed Forward Neural Network. In Proceedings of the IEEE Third International Conference on Sensing, Signal Processing and Security (ICSSS), Chennai, India, 19 October 2017. [Google Scholar] [CrossRef]
  7. Yu, Y.; Velastin, S.; Yin, F. Automatic Grading of Apples Based on Multi-Features and Weighted K- Means Clustering Algorithm. Inf. Process. Agric. 2019, 7, 556–565. [Google Scholar] [CrossRef]
  8. Jaramillo-Acevedo, C.; Choque-Valderrama, W.; Guerrero-Álvarez, G.; Meneses-Escobar, C. Hass Avocado Ripeness Classification by Mobile Devices using Digital Image Processing and Ann Methods. Int. J. Food Eng. 2020, 16, 1–8. [Google Scholar] [CrossRef]
  9. Huang, P.; Zhu, L.; Zhang, Z.; Yang, C. Row End Detection and Head Land Turning Control for An Autonomous Banana-Picking Robot. Machines 2021, 9, 103. [Google Scholar] [CrossRef]
  10. Kipli, K.; Zen, H.; Sawawi, M.; Noor, M.; Julai, N.; Junaidi, N.; Razali, M.; Chin, L.; Masra, S.H. Image Processing Mobile Application for Banana Ripeness Evaluation. In Proceedings of the IEEE International Conference on Computational Approach in Smart Systems Design and Applications (ICASSDA), Kuching, Malaysia, 30 September 2018. [Google Scholar] [CrossRef]
  11. Mazen, F.; Nashat, A. Ripeness Classification of Bananas Using an Artificial Neural Network. Arab. J. Sci. Eng. 2019, 44, 6901–6910. [Google Scholar] [CrossRef]
  12. Muhammad, G. Automatic Date Fruit Classification by Using Local Texture Descriptors and Shape-Size Features. In Proceedings of the IEEE European Modelling Symposium, Pisa, Italy, 13 July 2015. [Google Scholar] [CrossRef]
  13. Luo, L.; Liu, W.; Lu, Q.; Wang, J.; Wen, W.; Yan, D.; Tang, Y. Grape Berry Detection and Size Measurement Based on Edge Image Processing and Geometric Morphology. Machines 2021, 9, 233. [Google Scholar] [CrossRef]
  14. Pourdarbani, R.; Ghassemzadeh, H.; Seyedarabi, H.; Nahandi, F.; Vahed, M. Study on an Automatic Sorting System for Date Fruits. J. Saudi Soc. Agric. Sci. 2015, 14, 83–90. [Google Scholar] [CrossRef] [Green Version]
  15. Abdulkadir, A. Application of Image Processing and Neural Networks in Determining the Readiness of Maize. In Proceedings of the ACM 2nd International Conference on Machine Learning and Soft Computing, New York, NY, USA, 2–4 February 2018. [Google Scholar] [CrossRef]
  16. Nandi, C.; Tudu, B.; Koley, C. A Machine Vision-Based Maturity Prediction System for Sorting of Harvested Mangoes. IEEE Trans. Instrum. Meas. 2014, 63, 1722–1730. [Google Scholar] [CrossRef]
  17. Thinh, N.; Thong, N.; Cong, H.; Phong, T. Mango Classification System based on Machine Vision and Artificial Intelligence. In Proceedings of the IEEE International Conference on Control, Mechatronics and Automation (ICCMA), Delft, The Netherlands, 10 February 2020. [Google Scholar] [CrossRef]
  18. Arthur, Z.; Hugo, E.; Juliana, A. Computer Vision based Detection of External Defects on Tomatoes using Deep Learning. Biosyst. Eng. 2020, 190, 131–144. [Google Scholar] [CrossRef]
  19. Kaur, S.; Girdhar, A.; Gill, J. Computer Vision-based Tomato Grading and Sorting. Adv. Data Inf. Sci. 2018, 38, 75–84. [Google Scholar] [CrossRef]
  20. Chen, M.; Tang, Y.; Zou, X.; Huang, Z.; Zhou, H.; Chen, S. 3D Global Mapping of Large Scale Unstructured Orchard Integrating Eye-In-Hand Stereo Vision and Slam. Comput. Electron. Agric. 2021, 187, 106237. [Google Scholar] [CrossRef]
  21. Faisal, M.; Alsulaiman, M.; Arafah, M.; Mekhtiche, M. IHDS: Intelligent Harvesting Decision System for Date Fruit Based on Maturity Stage using Deep Learning and Computer Vision. IEEE Access 2020, 8, 167985–167997. [Google Scholar] [CrossRef]
  22. Najeeb, T.; Safar, M. Dates Maturity Status and Classification using Image Processing. In Proceedings of the IEEE International Conference on Computing Sciences and Engineering (ICCSE), Kuwait, Kuwait, 7 June 2018. [Google Scholar] [CrossRef]
  23. Altaheri, H.; Alsulaiman, M.; Muhammad, G.; Amin, S.; Bencherif, M.; Mekhtiche, M. Date Fruit Dataset for Intelligent Harvesting. Data Brief 2019, 26, 104514. [Google Scholar] [CrossRef]
  24. Scaria, B.; Aziz, N.; Siddiqi, M. AI based Robotic Systems for the Quality Control of Date Palm Fruits-A Review. In Proceedings of the IEEE International Conference on Digitization (ICD), Sharjah, United Arab Emirates, 2 June 2020. [Google Scholar] [CrossRef]
  25. Diboun, I.; Mathew, S.; Al-Rayyashi, M.; Elrayess, M.; Torres, M.; Halama, A.; Meret, M.; Mohney, R.; Karoly, E.; Malek, J. Metabolomics of Dates (Phoenix Dactylifera) Reveals a Highly Dynamic Ripening Process Accounting for Major Variation in Fruit Composition. BMC Plant Biol. 2015, 15, 291. [Google Scholar] [CrossRef] [Green Version]
  26. Nasiri, A.; Garavand, A.; Zhang, Y. Image-Based Deep Learning Automated Sorting of Date Fruit. Postharvest Biol. Technol. 2019, 153, 133–141. [Google Scholar] [CrossRef]
  27. Quaglia, M.; Santinelli, M.; Sulyok, M.; Onofri, A.; Covarelli, L.; Beccari, G. Aspergillus, Penicillium and Cladosporium Species Associated with Dried Date Fruits Collected in the Perugia (Umbria, Central Italy) Market. Int. J. Food Microbiol. 2020, 322, 108585. [Google Scholar] [CrossRef]
  28. Ammari, A.; Khriji, L.; Awadalla, M. HW/SW Co-‘esign For Dates Classification on Xilinx Zynq Soc. In Proceedings of the IEEE International Conference on Open Innovations Association (FRUCT), Yaroslavl, Russia, 20–24 April 2020. [Google Scholar] [CrossRef]
  29. Hakami, A.; Arif, M. Automatic Inspection of the External Quality of the Date Fruit. Procedia Comput. Sci. 2019, 163, 70–77. [Google Scholar] [CrossRef]
  30. Abi Sen, A.; Bahbouh, N.; Alkhodre, A.; Mohammed, A.; Aldham, F.; Aljabri, M. A Classification Algorithm for Date Fruits. In Proceedings of the IEEE International Conference on Computing for Sustainable Global Development (INDIACom), New Delhi, India, 4 May 2020. [Google Scholar] [CrossRef]
  31. Tan, K.; Lee, W.; Gan, H.; Wang, S. Recognizing Blue Berry Fruit of Different Maturity using Histogram Oriented Gradients and Color Features in Outdoor Scenes. Biosyst. Eng. 2018, 176, 59–72. [Google Scholar] [CrossRef]
  32. Video to Pic- Share Nice Photo. Available online: https://apps.apple.com/us/app/video-to-pic-share-nice-photo/id1438004105 (accessed on 22 November 2022).
  33. Colorsync Utility. Available online: https://support.apple.com/en-ca/guide/colorsync-utility/welcome/mac (accessed on 24 November 2022).
  34. Hamdi, M.; Ksibi, A.; Ayadi, M.; Elmannai, H.; Alzahrani, A. Machine-Learning-Based COVID-19 Detection with Enhanced cGAN Technique Using X-ray Images. Electronics 2022, 11, 3880. [Google Scholar] [CrossRef]
  35. Tang, Y.; Chen, M.; Wang, C.; Luo, L.; Li, J.; Lian, G.; Zou, X. Recognition and Localization Methods for Vision-Based Fruit Picking Robots: A Review. Front. Plant Sci. 2020, 11, 510. [Google Scholar] [CrossRef] [PubMed]
  36. Ezz, M.; Mostafa, A.; Elshenawy, A. Challenge-Response Emotion Authentication Algorithm Using Modified Horizontal Deep Learning. Intell. Autom. Soft Comput. (IASC) 2023, 35, 3659–3675. [Google Scholar] [CrossRef]
Figure 1. Immature stages for Al-barhi Date fruit in three mature stages (Khalal, Rutab, and Tamar). Adopted from [2].
Electronics 12 00665 g001
Figure 2. Proposed model flowchart.
Electronics 12 00665 g002
Figure 3. Sample of Al-ajwa dates.
Electronics 12 00665 g003
Figure 4. Sample of Al-helwa dates.
Electronics 12 00665 g004
Figure 5. Sample of Al-helwa Macnooz dates.
Electronics 12 00665 g005
Figure 6. Sample of Al-husseiniya dates.
Electronics 12 00665 g006
Figure 7. Sample of Al-hyza dates.
Electronics 12 00665 g007
Figure 8. Sample of Al-barhi dates.
Electronics 12 00665 g008
Figure 9. Sample of Al-bowytha dates.
Electronics 12 00665 g009
Figure 10. Sample of Al-kelas dates.
Electronics 12 00665 g010
Figure 11. Sample of Al-khasab dates.
Electronics 12 00665 g011
Figure 12. Sample of Al-khasab Khalal dates.
Electronics 12 00665 g012
Figure 13. Sample of Al-maktoumi dates.
Electronics 12 00665 g013
Figure 14. Sample of Al-mabroum dates.
Electronics 12 00665 g014
Figure 15. Sample of Al-majdool dates.
Electronics 12 00665 g015
Figure 16. Sample of Al-masyihia dates.
Electronics 12 00665 g016
Figure 17. Sample of Al-muraaya dates.
Electronics 12 00665 g017
Figure 18. Sample of Salma dates.
Electronics 12 00665 g018
Figure 19. Sample of Soor dates.
Electronics 12 00665 g019
Figure 20. Sample of Al-shagra dates.
Electronics 12 00665 g020
Figure 21. Sample of Al-sagai dates.
Electronics 12 00665 g021
Figure 22. Sample of Al-skari dates.
Electronics 12 00665 g022
Figure 23. Sample of Al-Skari Macnooz dates.
Electronics 12 00665 g023
Figure 24. Sample of Al-asylaa dates.
Electronics 12 00665 g024
Figure 25. Sample of SagaiIRAQ dates.
Electronics 12 00665 g025
Figure 26. Sample of NbotAli dates.
Electronics 12 00665 g026
Figure 27. Sample of Al-Rashudia dates.
Electronics 12 00665 g027
Figure 28. Sample of Ruthant Al-Shrq dates.
Electronics 12 00665 g028
Figure 29. Sample of Al-hilalia dates.
Electronics 12 00665 g029
Figure 30. Plotting diagram for date fruit distribution of classes.
Electronics 12 00665 g030
Figure 31. DenseNet-201 prediction model.
Electronics 12 00665 g031
Figure 32. Transfer learning models’ accuracy.
Electronics 12 00665 g032
Figure 33. Tuning accuracy for different DenseNet layers.
Electronics 12 00665 g033
Figure 34. Training accuracy curve.
Electronics 12 00665 g034
Figure 35. Training losses curve.
Electronics 12 00665 g035
Figure 36. Dense layers performance.
Electronics 12 00665 g036
Table 1. Examples of fruit datasets.
ReferenceClassification
[4]Cape gooseberry
[5,6,7]Apple
[8]Hass avocado
[9,10,11]Banana
[12]Blueberry
[13]Grape Berry
[14]Dates
[15]Maize
[16,17]Mangoes
[18,19]Tomato
Table 2. Used cameras’ specs.
KindSpecs
CanonEOS 4000D DSLR EF-S 18–55 mm
iPhone 1212 megapixel, f/1.6, 26 mm (wide), 1.4 mm, dual pixel PDAF, OIS
Samsung Galaxy S912 megapixel, f/1.5–2.4, 26 mm (wide), 1/2.55″, 1.4 mm, dual-pixel PDAF, OIS
Table 3. Summary of existing date fruit datasets.
SourceDatasetCharacteristicsLimitationsThe Proposed Dataset Strength
CSRR [2]Two Canon cameras (EOS-1100D and EOS-600D) The dataset has 8079 images.Few classes.Overcame the limitations of CSRR by increasing the number of classes.
DMSC [22] Canon Camera fitted with EFS 18–55 mm lens They considered the growth stages as classes. Could not differentiate the background area from being a cold area.Increasing the number of classes and having more image collection methods.
DLASDF [26] RGB video cameraThey considered the maturity stages of date fruits.Only five classes, namely, Naboot Saif, Khalals, Barhi, Meneifi, and Sullaj.Overcame the limitations of DLASDF by increasing the number of classes and having more image collection methods.
APCP [27] N/AAnalyzed the possibility of fungal species and relevant infection by fungal secondary metabolites of dates.It had a total of 20 dried-date samples of two classes.It overcame the limitations of APCP by increasing the number of classes and having more image collection methods.
HW/SW Co- Design [28]Camera and two fluores- cent lightsDate features were categorized using color, size shape, and skin features.It had 600 images presenting six classes.Increasing the number of classes and the number of class instances.
AIEQDF [29] Nikon digital camera, two fluorescent lights, white pallet566 images: 275 images for good-quality dates and 291 images for sugaring dates. The dataset had only two classes.Increasing the number of classes and having more accurate images.
CADF [30] Google ImagesIt had a total of 325 images representing four classes. The dataset had four classes only, with an unbalanced number of images in each class.Having more realistic image collection methods.
ADFCLT [31]iPhone 5 mobile cameraIt had 80 different images belonging to four date types.The dataset was quite small.Overcame the limitations of the paper by increasing the classes’ number with more scientific image collection methods.
Table 4. The dataset classes’ details including the date’s name, number of images, color, shape, texture, and the percentages of the image collection environment.
#Date NameNumber of ImagesColorShapeTexturePercentages of Image
Collection Environment
FarmsShopsSocial Event
1Al-ajwa112RedOvoidSheen crust77%20%13%
2Al-helwa100RedCylindricalSoft and mushy88%5%7%
3Al-helwa macnooz155BlackCylindricalSolid and sticky10%77%13%
4Al-husseiniya91BrownCordateSolid and dry80%9%11%
5Al-hyza50YellowCylindricalSoft crust74%11%15%
6Al-barhi120YellowCordateSoft solid70%13%17%
7Al-bowytha180BrownFusiformSoft crimped60%17%23%
8Al-kelas152BrownOvoidSoft sticky22%50%28%
9Al-khasab106BlackGloboseSolid sheen55%20%25%
10Al-khasab Khalal139RedGloboseSolid sheen67%14%19%
11Al-maktoumi126YellowCordateSolid54%20%26%
12Al-mabroum118Dark yellowCylindricalSoft crimped and resin-like10%77%13%
13Al-majdool115BrownFusiformResin-like79%9%12%
14Al-masyihia31YellowGloboseSoft and syrupy66%15%19%
15Al-muraaya50YellowOvoidEven-textured64%16%20%
16Salma236YellowOvoidEven-textured90%4%6%
17Soor142YellowConicalCoarse, chewy9%79%12%
18Al-shagra112BlondCylindricalResin-like13%69%18%
19Al-sagai146BlondCylindricalResin-like20%55%25%
20Al-skari131BrownCordateEven-textured50%42%8%
21Al-skri magrosh102GoldenConicalSlimy82%8%10%
22Al-asylaa121YellowCylindricalSleek27%51%22%
23SagaiIRAQ69YellowCylindricalSatiny76%10%14%
24NbotAli141BrownConicalScabrous50%30%20%
25Al-rashudia162BrownCylindricalSatiny50%35%15%
26Ruthant Al-Shrq132BrownFusiformSatiny92%3%5%
27Al-hilalia104YellowGloboseMild67%14%19%
Table 5. Accuracy Comparison for different classification models.
DFC SystemsMethodologyApplied DatasetsClassification Accuracy
IHDS [23]CV—DLCSRR99.4%
CADF [30]SVM—DT—RF—NNSelf-built dataset CADF91% for SVM
65% for DT
56% for RF
69% for NN
DMSC [22]MATLAB built-in functionUnavailable self-built dataset100%
HW/SW co-design [28]ANN networkSelf-built dataset with 6 classes of 600 images97.26%
AIEQDF [29]Key-point detection methods,
feature classification algorithms, and SVM
Self-built dataset with 2 classes of 500 images99%
ADFCLT [12]SVMSelf-built dataset with 4 classes of 80 images99%
APCP [27]Identified through stereomicroscope
and microscopic observation
of seven-day colonies
Self-built dataset with 2 classes of 20 images94%
DLASDF [26]CNNs—transfer learning with fine-tuning using two pretrained CNN models: AlexNet and VGGNetSelf-built dataset with 5 classes and 8000 images>97.25%
Table 6. Performance of machine learning algorithms.
ModelFeatures
(Pixel Intensity)
Features
(Color Distribution)
K-nearest neighbor (KNN)0.360.82
Decision tree (DT)0.210.60
L2 logistic regression (LR)0.340.66
Random forest (RF)0.490.85
Adaptive boosting (AB)0.110.15
Support vector machine (SVM)0.430.85
Gaussian NB0.310.48
Table 7. Validation of transfer learning.
ModelValidation Accuracy
VGG190.8421
VGG160.8483
DenseNet1210.9412
Inception0.8916
ResNet152V20.8947
InceptionResNetV20.8793
DenseNet1690.9412
EfficientNetV2M0.13
DenseNet2010.9567
Table 8. DenseNet layers’ accuracy.
ModelValidation Accuracy
DenseNet201(702)0.9505
DenseNet201(699)0.9443
DenseNet201(695)0.9567
DenseNet201(692)0.9536
Table 9. Model classification configuration.
ModelDense LayerValidation Accuracy
DenseNet201(695)10240.9505
DenseNet201(695)1280.9102
DenseNet201(695)1,024,5120.9536
DenseNet201(695)30000.9474
Table 10. Regularization rate.
Regularization RateValidation Accuracy
0.0000900.9567
0.000110.9628
0.000120.9598
0.000150.9721
Table 11. Overall date fruit classes’ performance.
Dataset NamePrecisionRecallF1-Score
Al-ajwa1.001.001.00
Al-asylaa0.920.850.88
Al-barhi0.711.000.83
Al-bowytha0.901.000.95
Al-helwa1.000.900.95
Al-helwa_macnooz0.941.000.97
Al-hilalia1.001.001.00
Al-husseiniya1.001.001.00
Al-hyza1.000.800.89
Al-kelas0.941.000.97
Al-khasab0.921.000.96
Al-khasab_Khalal1.001.001.00
Al-mabroum1.000.830.91
Al-majdool1.001.001.00
Al-maktoumi1.000.850.92
Al-masyihia1.000.750.86
Al-muraaya0.831.000.91
Al-rashudia1.000.880.94
Al-sagai0.881.000.94
Al-sakari_majrosh1.001.001.00
Al-shagra0.900.750.82
Al-skari0.931.000.96
NbotAli1.000.860.92
Ruthant_Al-Shrq1.001.001.00
SagaiIRAQ1.001.001.00
Salma1.001.001.00
Soor1.001.001.00
Macro AVG0.960.940.95
Weighted AVG0.960.950.95
Disclaimer/Publisher’s Note: The statements, opinions and data contained in all publications are solely those of the individual author(s) and contributor(s) and not of MDPI and/or the editor(s). MDPI and/or the editor(s) disclaim responsibility for any injury to people or property resulting from any ideas, methods, instructions or products referred to in the content.

