Abstract
This article investigates the possibilities of gas detection using a tapered optical fiber coated with a graphene oxide layer. Measurement is based on changes in light beam propagation depending on the process of gas absorption to the graphene oxide layer. In this paper, we investigated the light change in a double-clad tapered optical fiber in a wide optical range. We present a special platform constructed for the deposition of additional functional materials that enable the preparation of the sensor module. Our results present differences in light transmission for three different kinds of gasses pure nitrogen, pure hydrogen, and a mixture of propane–butane. Measurements were provided in a wide range of 500 nm–1800 nm to find the most sensitive ages for which we are able to detect mentioned absorption and their interaction with light. Obtained results for pure gasses for which the refractive indices are similar to the air show the greatest changes for the visible range 750 nm–850 nm, and for propane–butane, changes are much visible in the whole investigated range.
1. Introduction
The development of optical fiber technology over 40 years is a significant and dynamic process. This is due to optical fiber characteristic properties such as from nano to micro dimensions, immunity to electromagnetic interference, flexibility, sensitivity, and fast response for measuring factors []. These properties of optical fibers are widely used in the sector of telecommunications to advanced optoelectronic devices, which are useful in constructing, for example, very popular optical sensors. Optical fiber sensors measure chemical and physical parameters such as refractive index (RI), temperature, pressure, vibration, chemical substances, and gases [,,]. New trends in research show many possibilities for using functional materials in fiber optic sensor technology, such as liquid crystals [,], alkanes [], polymers [], metals [], graphene, and graphene oxide [,]. In addition, due to the current development of technology for making various fiber optic structures, the base element of the sensors are changed. Sensors can be built on the basis of a tapered optical fiber [], could be created by side-polished fiber [], by bending the fiber (for example, U-shape fiber) [], or fiber cladding could be etched []. In the next step of technology, fiber Bragg grating can be created on an etched cladding []. Much research is about long-period gratings structure on fibers [], new structures based on different kinds of interferometers [], and couplers []. The mentioned geometric structures of the sensors obtained through various physical phenomena that enable detection and the possibility of combining with functional materials allowed for obtaining interesting results. Thanks to the developed technology and conducted laboratory tests, it is possible to build sensitive, dynamic, and compact sensors of various parameters.
In the article, the basic structure of a new gas sensor was TOF. TOFs are well-known as the basis of highly sensitive sensors of refractive index changes []. TOF has a reduced fiber diameter which causes the propagation of the electromagnetic wave throughout the structure and partially outside the fiber in the form of an evanescent wave [,,,]. This modification of the boundary conditions creates a very sensitive element of environmental changes. To obtain increased sensitivity of the in-line sensor, it is possible to use an additional material on the TOF surface. Basic elements such as TOFs are very popular in the literature for building a gas sensor []. TOF, combined with an oxide layer, TiO2, allowed the construction of an ammonia sensor based on the phenomenon of Lossy Mode Resonance (LMR) []. Another example is a hydrogen sensor with a layer of MnO2 oxide and palladium []. The combination of oxide and metal is also described in the article [], where the Pd/ZnO layer was used to detect hydrogen. TOF was also combined with a layer of polymers, an example of which is ferrocenylenesilylene polymer, which allowed the detection of ammonia and carbon dioxide []. A layer of tetrakis-(4-sulfophenyl) porphine (TSPP) and poly(allylamine hydrochloride) (PAH) was used to create an ammonia gas sensor []. Another material used in connection with a TOF is the metal palladium, which strongly absorbs hydrogen. This sensor works on the basis of the phenomena of surface plasmon resonance (SPR) [].
The extra materials selection range connected with TOF is very wide. The functional material that was selected in our research is graphene oxide (GO). Currently, graphene-based materials attract great attention due to their interesting features, such as high mechanical strength (graphene), chemical stability, and significant optical properties []. Recently, graphene oxide (GO) has been of interest to many scientific groups due to its hydrophilicity and increased sensitivity resulting from oxygen functional groups such as carboxyl, hydroxyl, or epoxy groups []. These promising properties have already been used in the detection of ethanol [], humidity [], and ammonia []. Due to the hydrophilic properties of graphene oxide, it is possible to deposit GO layers onto specific surfaces [,], and it can be a base for different factors measurement or as a storage material [].
Tapered optical fiber coated with a graphene oxide layer seems to be a very promising example of the sensing platform [,,]. In 2016, the M. A. A. Rosli group reported a highly sensitive aqueous ethanol sensor based on TOF covered with a graphene oxide sensing layer []. In 2021, Saad Hayatu Girei’s team reported a very sensitive ammonia gas sensor []. This sensor responds to changes in NH3 concentrations, and its sensitivity reached 26.99 AU/% in the visible region and 61.78 AU/% in the near-infrared wavelength region.
Creating new sensor solutions for various gases is important for the safety of people. Thanks to sensors, we can monitor and find gas leaks, which allows us to improve industrial processes. The article presents research on gas sensors that detect gases such as LPG, H2, and N2 [,]. The propane–butane gas mixture, also known as LPG (liquefied petroleum gas) is dangerous due to the fact that it is flammable. Forms flammable and explosive mixtures with air. Hydrogen is highly flammable, and its leaks pose a fire hazard. Hydrogen is odorless, colorless, and tasteless, so leaks are difficult to detect with the human senses. Nitrogen can cause poisoning in various chemical reactions. In addition, it is worth controlling the concentration of gases during various technological processes. The human safety factor is important nowadays, which is why improving gas sensors is so important.
In our paper, tapered optical fibers were prepared to be used as a base element for measurement sensors using the low-pressure flame technique. The tapered optical fiber manufacturing is based on a heating process, where the temperature of the burner reaches about 1100–1200 °C (softening temperature) and pulling the fiber in both directions at the same time to achieve a reduced diameter and obtain an adiabatic taper with low internal losses []. In the following work, the possibility of detecting gases on TOF coated with a graphene oxide layer based on transmission measurements in the two wide ranges connected with the optical spectrum analyzers ranges, 500–1200 nm and 1200–1800 nm, were investigated. To achieve good adhesion between GO and TOF, an additional agent, an adhesion promoter, was used. Changes in spectral characteristics for each sample are presented. The main purpose of provided measurement was to show the influences of different gasses, nitrogen, hydrogen, and propane–butane, in a constant volume on light propagation in a wide range.
2. Materials and Methods
2.1. Materials
Tapered optical fibers were manufactured from the single-mode optical fiber for the telecommunication wavelength range. Preliminary work showed a very low adhesion of graphene oxide to the pure glass; therefore, APTES ((3-Aminopropyl) triethoxysilane) was used as a coupling agent.
The basic properties of SMF and APTES are presented in Table 1.

Table 1.
APTES and SMF 28 properties [,].
Graphene oxide was made at the Łukasiewicz Research Network—Institute of Microelectronics and Photonics. The chemical composition is given in Table 2.
Table 2.
Composition of the graphene oxide (GO) [].
Graphene oxide (G-Flake) was produced at Łukasiewicz—Institute of Microelectronics and Photonics. To obtain graphene oxide, graphite oxidation was carried out using the modified Hummers’ method. Four liters of sulfuric acid (95% H2SO4—pure H2SO4, Chempur, Poland) was poured into a glass reactor (Reactor-ReadyTM UK). An amount of 60 g of graphite with flakes with a diameter from 100 to 120 μm (Asbury Carbons, USA) and 34 g of potassium nitrate (101.10 g/mol KNO3—pure KNO3 Chempur, Poland) were then added to the acid. After 30 min, 360 g of potassium permanganate (158.04 g/mol KMnO4—pure KMnO4, Chempur, Poland) was added []. The reaction was carried out at 50 °C for 4 h. After this time, the suspension was added to deionized water together with hydrogen peroxide (30% H2O2—pure 30% H2O2, Chempur, Poland). The suspension thus prepared was subjected to a purification process. The concentration of the obtained aqueous suspensions of graphene oxide was about 4 g/L [,,,].
Surface visualization of the graphene oxide flake was performed using Auriga (Zeiss) in the backscattered electron (BSD) mode with a detector (0.5 kV) (Figure 1). A drop with an aqueous solution of graphene oxide was placed on a silicon substrate and then dried (40 °C for 24 h). The sample was mounted on a measuring table. As the material had dried earlier, there was no need for additional drying. The GO flake itself does not need spraying for good surface visualization.
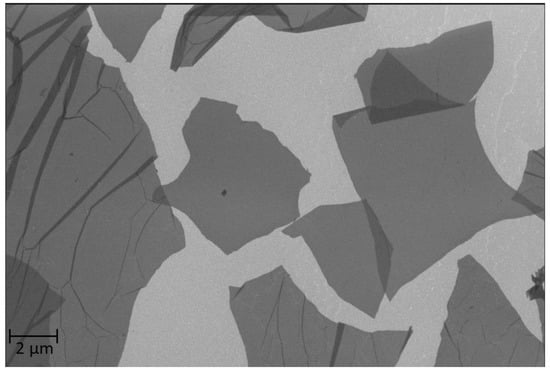
Figure 1.
Photo of graphene oxides from the SEM microscopy.
In our work, we decided to compare two diatomic gases, nitrogen (N2) and hydrogen (H2), as well as the propane–butane mixture (LPG—Liquid Petroleum Gas) commonly used in industry, tourism, and households. We analyzed gases differing in reactivity, “ease” of compound formation, or their importance to humans and the environment, as well as harmfulness/toxicity.
Nitrogen is a major part of the atmosphere but does not support life itself; it is used in food processing, to purify air conditioning and refrigeration systems, and to pressurize aircraft tires. It is chemically passive, which is due to the very high triple bond energy in the N2 molecule. The gas is slightly lighter than air. At elevated temperatures, it reacts, can cause suffocation by displacing air, and can cause symptoms of poisoning in people who are in the air with increased pressure. Under such conditions, nitrogen dissolves better in body fluids and lipid-rich tissues (e.g., in the brain), leading to the appearance of poisoning symptoms.
Even more dangerous than the dissolution of nitrogen in the tissues is its release in the form of gas bubbles during pressure reduction. This can lead to life-threatening decompression sickness. In case of prolonged exposure to fire or high temperatures, containers may rupture violently and shatter.
Hydrogen is easily ignited. When ignited, it burns with a pale blue, almost invisible flame. It is flammable over a wide range of vapor/air concentrations. Hydrogen is not toxic but is a simple asphyxiant by displacing oxygen from the air. In case of prolonged exposure to fire or intense heat, containers can violently rupture and shatter. Hydrogen is used in the production of other chemicals and oxy-hydrogen welding and cutting. It forms an explosive mixture with oxygen. The gas is lighter than air. H2 is hardly reactive under standard conditions but forms compounds with most elements. Many works with graphene and hydrogen are connected to a storage
LPG (Propane 80%–Butane 20% mixture). Propane–butane is harmful, low concentrations of the gas cause coughing, pain, dizziness, nausea, sometimes psychomotor agitation, drowsiness, and unconsciousness, as it displaces oxygen from the air, and it is not advisable to inhale it. Generally, it is an odorless gas, but ethanethiol is specially added, which is specific and noticeable. It is heavier than air and will accumulate in the lowest places if it flows out of a leaking system. Extremely flammable gas, heating risks an explosion. When mixed with air at a volume ratio of 1.5 to 10%, it forms an explosive mixture, so it is particularly important to strictly adhere to safety rules.
It is practically insoluble in water, with an upper explosive limit of 9.6% and lower explosive limit of 1.9%, and for a vapor pressure of −15 °C, not less than 0.10 Mpa; for 70 °C, not more than 2.55 MPa.
The main parameters of gases used during the measurements are presented in Table 3.
Table 3.
Composition of the graphene oxide (GO).
2.2. Preparation of a Tapered Optical Fiber
Tapered optical fibers were manufactured using FOTET (fiber optic tapered element technology) [,,]. FOTET station uses a movable torch based on a gas mixture (propane–butane–oxygen) to obtain the required fiber elongation temperature. The flame is obtained in a low-pressure technique. The temperature of the flame depends on a gas mixing ratio that is set by gas regulators. The obtained tapered optical fibers were characterized by an elongation of 15.05 ± 0.04 mm, losses of 0.12 ± 0.06@1550 nm, and a taper waist diameter of 20.5 ± 0.5 μm, which corresponds to a double-clad taper element widely described in the literature [,]. In such a structure, it should be considered that a part of the light guided in the optical fiber core penetrates the cladding as the evanescent field, which is described by the parameter of the light beam—penetration depth (dp) described by the formula [] (Figure 2):
where ncore is the RI of a core of the fiber, ncladding is the RI of the cladding of fiber or external surround of fiber, θ is the angle of incidence of the light at the core/cladding interface, and is the wavelength.
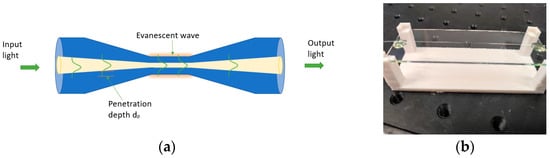
Figure 2.
Scheme of the secured tapered optical fiber and picture of control and applying of APTES and GO layers. (a)The scheme of Tapered Optical Fiber, (b) the secure of taper for the deposition of APTES and GO layers.
During the tapering process, the light penetrates the cladding increase until the light is propagated in the whole area of the taper waist Figure 2a. This process allows for obtaining an optical element that is sensitive to changes in the external optical parameters of the environment in which the TOF is located. Thus, the most important parameter is RI []. Many materials change RI when one of the parameters of the environment where they are located is changed. The value of RI is addicted to temperature, humidity, etc., and processes such as absorption. The use of additional material in the TOF area and the conscious use of its properties, in particular, changes in material and optical parameters depending on an external factor influence light propagating in TOF. TOFs were properly secured with UV glue (NOA 81) at both ends of the un-tapered region to avoid mechanical destruction and make it available for proper application of the GO material. Figure 2b presents a picture of a secure taper for the deposition of APTES and GO layers.
The fiber optic taper prepared in this way was subjected to spot application of APTES, cleaning with isopropyl alcohol, and application of a GO layer. Figure 3a presents the arrangement for application materials. Figure 3b presents a picture of the taper and drop of APTES.
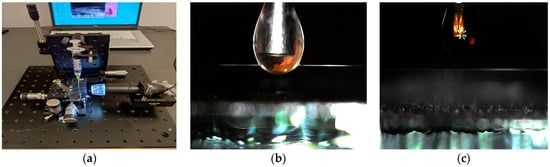
Figure 3.
Picture of the setup for materials application and picture of APTES and GO drop application. (a) The arrangement for application of materials (b), drop of APTES on TOF (c) Tapered Optical Fiber.
The development of graphene film deposition technology was developed at the institute during the initial research. After the fiber optic taper was protected against mechanical damage, it was treated with APTES for a period of 150 s, followed by a cleaning process with isopropyl alcohol. On such a prepared fiber optical taper waist, part of this region was placed in a drop of GO, keeping the taper for 20 min surrounded by this drop and then allowed drying for a period of 24 h at room temperature. Figure 4a shows randomly placed graphene oxide residues on the TOF surface after deposition without APTES, and Figure 4b presents the structure of the optical fiber taper after the process of APTES deposition. As can be observed, the structure of the optical fiber taper waist is porously facilitating the application of graphene layers. Figure 4c,d present the obtained structure of graphene layers. Pictures were obtained on scanning electron microscopy SEM Phenom FEI G2 (Hillsboro, OR, USA).
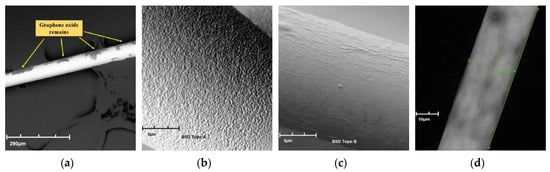
Figure 4.
SEM photo of graphene oxide residues on the tapered optical fiber surface without APTES (a), after APTES activation (b), with a GO layer (c,d).
In the next step, such prepared TOF was placed in an arrangement for measurement of gas influences on the light propagation see Figure 5.
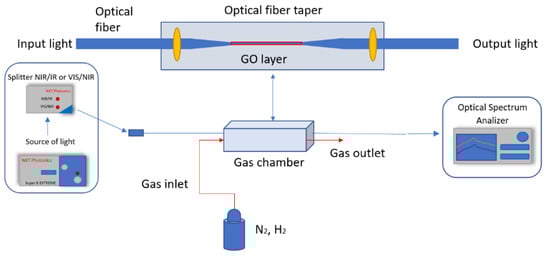
Figure 5.
Scheme of the experimental setup for gas sensors.
A measurement system consisting of a SuperK Extreme EXR-15 laser (NKT Photonics, Birkerød, Denmark) operating in the wavelength range of 400–2400 nm set at 12% power, a splitter (NKT Photonics, Birkerød, Denmark) with two split ranges: NIR/IR and VIS/NIR, optical spectrum analyzer AQ6373B (Yokogawa, Tokyo, Japan) for wavelength 350–1200 nm, and optical spectrum analyzer AQ6375 (Yokogawa, Tokyo, Japan) for wavelength 1200–2400 nm.
Pure nitrogen and hydrogen were connected to the gas chamber with a flow of 800 mL/s.
The secured taper was placed in a gas chamber with a volume of about 800 mL. During measurement, all volume was filled with the measured gas maintaining the atmospheric pressure.
We use a broadband source to enable us to check the changes over the widest possible range. The fabricated sensor is connected to the source and a spectrum analyzer in which we detect changes occurring during the interaction of gases with the graphene oxide layer. The sensor is located in a chamber that allows rapid filling of the entire volume with the measured gas. Reference measurements are made without the measured gas, and then the influence characteristics are recorded depending on the exposure times of the layer to the gas.
3. Results
In our research, we take advantage of the fact that GO has adsorption properties. GO’s very good adsorption properties are due not only to its huge surface area but also to the presence of numerous oxygen functional groups (40% of GO’s composition can be oxygen atoms). The method used to obtain graphene oxide used in this work is a modified Hummers method. This method is characterized by the introduction of a large number of functional groups formed by exfoliation and oxidation of graphite. This process destroys the unsaturated structure of graphene and changes the hybridization of individual carbon atoms from sp2 to sp3. As a result, numerous functional groups containing oxygen atoms are formed on the sheets of individual graphite layers (known as graphene). Among the most common are hydroxyl (-OH), epoxy (-O-), carbonyl (-C=O), and carboxyl (-COOH) groups. Their occurrence gives GO a hydrophilic character (compared to reduced graphene oxide), making it easily dispersible in water. To understand the adsorption process on the surface of graphene oxide flakes, it is necessary to assume that the surface of a solid adsorbent (GO) has a certain number of so-called active centers, i.e., sites on which the adsorption process takes place and that each active site can adsorb only one molecule, which means that a monomolecular layer is formed on the surface of the adsorbent. Molecules adsorbed on the active centers do not interact with each other, while during the adsorption process, a dynamic equilibrium is established, i.e., as many molecules are adsorbed on the graphene surface per unit of time.
Such properties relate to the physical properties of gas absorption into the graphene layer. The process of gas adsorption is determined mainly by two adsorption processes. One is physical adsorption due to Van der Walls forces, and the other is chemisorption due to C-X bond formation. Therefore, it is likely that complete desorption and reapplication of the material will be impossible [,].
The refractive index of the layer (a new cladding of taper) during the process of absorption is changed, so the boundary condition of propagating light also changes. Due to the application of a new layer, we observed the transmission power changes.
The principle of measurement is to detect changes occurring in the GO layer occurring through the absorption of individual gases. In the literature, the principle of absorption described by changes in the fiber transmittance can be found (P), described by the formula [,]:
where L is the length of the fiber sensor, P0 is the initial light power (before interaction with gas), α is the absorption coefficient of the gas, and r is the ratio of the power of the evanescent wave to that of the total propagating wave, c is the [,].
The procedure of full measurement was divided into a few steps. First, there were provided measurements of a pure taper and influences of gasses on light propagation. For all measurements, there were no observed changes during the time measurement for all kinds of investigated gases.
All measurements were repeated at least five times to be sure of changes in the propagation of the light beam depending on the used gasses. All results were repeatable. We observed only a change in the intensity in all spectrums, which is connected with the losses introduced as the tapers, as well as FC/PC connectors spliced to the tapers.
For visible range due to the optical fiber parameters, source characteristics, etc., correct measurement can be provided over 600 nm. Below this value, high attenuation can be observed, which makes it unable to provide good measurement. Additionally, close to the end range, there are also visible fluctuations that are not connected with measurement but with the equipment properties. For the IR spectrum, all range was investigated. For all ranges, we have chosen only that part in which the changes are repeatable and possible to observe.
The purpose of this article was to investigate the influence of different gasses, such as nitrogen N2, hydrogen H2, and propane–butane (LPG), on light propagation in a wide range. The measurement was provided on how the spectral characteristic will change in time of impact of gasses surrounded by taper with GO layer. For measurement of the effect of gasses on sensors, 0, 1, 5, and 60 min were chosen. For presentation, the differences between the acquired characteristics of gasses to the reference characters in the air were presented to show the real impact of gasses. Due to the optical parameters of gasses, as well as the process of absorption of mentioned gasses to the GO layer, it should be mentioned that investigated changes should be rapid.
Figure 6, Figure 7, Figure 8 and Figure 9 presented the spectral differences characteristics of TOFs coated with graphene oxide exposed to gases at 0 min, 1 min, 5 min, and 60 min for two different wave ranges, 600–1100 nm and 1200–1800 nm.
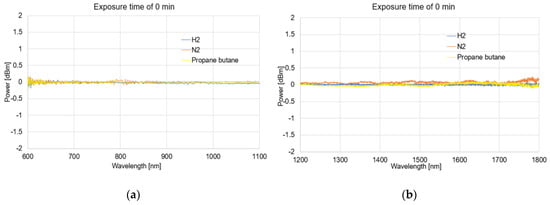
Figure 6.
The spectral differences characteristics of TOFs coated with graphene oxide exposed to gases on 0 min (a) and (b).
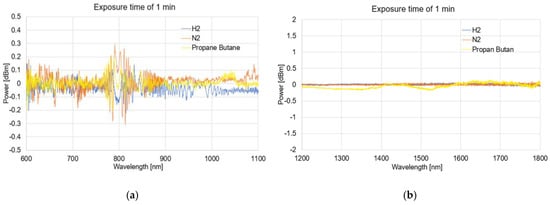
Figure 7.
The spectral differences characteristics of TOFs coated with graphene oxide exposed to gases on 1 min (a) and (b).
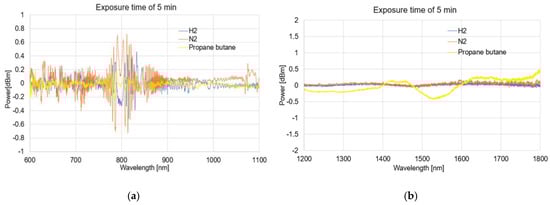
Figure 8.
The spectral differences characteristics of TOFs coated with graphene oxide exposed to gases on 5 min (a) and (b).
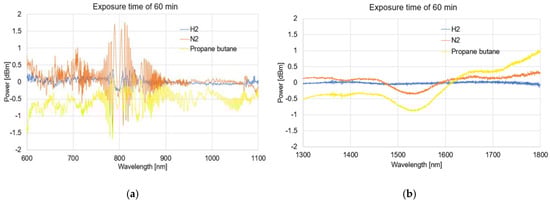
Figure 9.
The spectral differences characteristics of TOFs coated with graphene oxide exposed to gases on 60 min (a) and (b).
The obtained spectra presented as the dependence of the power transmission (dBm) on the wavelength (nm) revealed no significant influence of using APTES on light propagation while simultaneously activating the TOF surface for a proper GO deposition.
As can be observed from Figure 6, Figure 7, Figure 8, and Figure 9, due to the time exposure of investigated gasses, it is possible to measure their influences and absorbance to the graphene layer. For measurement in a wide range, it can be observed that much bigger changes are observed for visible and NIR ranges, especially close to the range 750–850 nm. For this range, the created optical fiber taper possesses multimode propagation, and the penetration depth is much higher than for single-mode propagation. For the IR propagation, due to the pure gasses’ parameters, such as the air changes, the refractive indices are especially negligible. For LPG, which is the mixture of propane–butane gasses for which each individual has a refractive index approaching about 1.3 (see Table 3), the changes are more significant.
For the presented range of 750–850 nm, we provided additional analyzes of the position and change in power of the middle picks. Figure 10 presents changes in the power of the main pics from the range 750–850 nm and their increase depending on the time of deposition of the gasses. The ordinate scale presented in this figure is logarithmic.
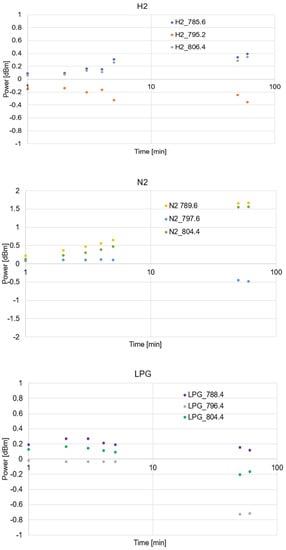
Figure 10.
The spectral changes in power of the main pics from the range 750–850 nm and their increase depending on the time of deposition of the gasses.
As can be noticed for all kinds of measurements, the greatest changes do not transverse 5% of the initial power; therefore, differences between the spectral characteristic of an optical fiber taper with GO layer in the air to the optical fiber taper with GO layer surrounded by different gasses were used. As can be observed, an initial increase in power is rapid and maintains a linear trend. After 5 min of deposition, changes slow down and become a stable level. For each gas, small shifts in the position of measurement pick and the width of the central minimum exu = ixt. For hydrogen, we obtained the widest minimum over 20.8 nm pro LGP; the width is 16.0 nm, and for nitrogen, the width is the smallest and is equal to 14.8 nm. The minimum of the center is similar for all gases, and the change appears at the position of the highest peaks around this minimum. For measurement in the visible range, it can be observed that the greatest dynamic change is observed for the nitrogen, and the lowest is for LPG. For the IR range, observed changes can be seen for the LPG mixture for which the RI is highest, and it is different from AIR.
The research presented in this paper allows for the following summary:
- It is possible to detect a variety of gases and their mixtures using GO layered optical fiber technology;
- It is possible to distinguish absorbed gases;
- To obtain the correct layers on an optical fiber taper surface, APTES should be used as a reagent;
- For different gasses, we observed small shifts in the position of measurement picks and the width of the central minimum;
- The greatest changes in absorption are observed for nitrogen; for LPG, there are additional changes in the IR range.
4. Conclusions
The experimental research shown in the article concerns the subject of the possibility of detection of different kinds of gasses using the effects of absorption to the thin layer of graphene oxides deposited on a tapered surface. The conducted research on such a hybrid combination creates the potential for the construction of many new optoelectronic devices with fast and online detection. Considering the fact that many research trends related to the discipline of materials engineering are aimed at improving the parameters of existing materials, the performance of tests confirms the possibility of creating a low-cost and reliable sensor, and its construction requires the use of state-of-the-art methods. The hybrid combination of an optical fiber taper and graphene oxides requires the use of APTES reagents to obtain a proper surface that will be adhesive to the GO materials. Obtain results show that obtained layers enable gas detection. The most visible changes are observed in the range 750–850 nm and shown that absorption to the GO layer of the different layers occurs most visibly up to 5 min, then there is a process of stabilization. For the IR range, there are observed greater changes for LPG gas which possess the highest difference of refractive indices to the RI of air.
The presented solution of combining a TOF with a GO layer provides an opportunity to produce a simple, all-fiber sensor for various gases. The sensor has a small size, so it can be used in very tight or hard-to-reach places. The mentioned sensor does not affect the properties of the measured gas. In addition, it can operate in hazardous areas, is non-invasive, and the technology is proven. In addition, SMF fiber optics are cheap to manufacture and operate. Hence, the cost of the sensor is not high.
Author Contributions
Conceptualization, K.A.S. and I.J.; methodology, K.A.S. and J.M.; formal analysis, K.A.S.; investigation, K.A.S., I.J., R.K. and J.M.; resources, K.A.S., K.K. and I.J.; data curation, K.A.S., I.J. and R.K; writing—original draft preparation, R.K., K.K. and K.A.S.; writing—review and editing, J.M. and I.J; visualization, R.K., K.A.S. and I.J.; supervision, K.A.S.; funding acquisition, K.A.S. All authors have read and agreed to the published version of the manuscript.
Funding
This research was funded by the Ministry of Science and Higher Education as a statutory activity UGB 22-800 of the Technical Physics Applications Department of the Military University of Technology.
Data Availability Statement
The data presented in this study are available on request from the corresponding author.
Conflicts of Interest
The authors declare no conflict of interest.
References
- Taha, B.A.; Ali, N.; Sapiee, N.M.; Fadhel, M.M.; Mat Yeh, R.M.; Bachok, N.N.; Al Mashhadany, Y.; Arsad, N. Comprehensive Review Tapered Optical Fiber Configurations for Sensing Application: Trend and Challenges. Biosensors 2021, 11, 253. [Google Scholar] [CrossRef]
- Przybysz, N.; Marc, P.; Tomaszewska, E.; Grobelny, J.; Jaroszewicz, L.R. Pure and Au nanoparticles doped higher alkanes for an optical fiber temperature threshold sensor. In Optical Sensors 2017; SPIE: Prague, Czech Republic, 2017. [Google Scholar] [CrossRef]
- Zhang, Y.; Su, H.; Ma, K.; Zhu, F.; Guo, Y.; Jiang, W. Optic-Fiber Temperature Sensor In Temperature Sensing; Stanimirović, I., Ed.; Institute for Telecommunications and Electronics IRITEL a.d. Belgrade: Belgrade, Serbia, 2018; pp. 5–21. [Google Scholar] [CrossRef]
- Rodriguez, G.; Sandberg, R.; McCulloch, Q.; Jackson, S.I.; Vincent, W.; Udd, E. Chirped fiber Bragg grating detonation velocity sensing. Rev. Sci. Instrum. 2013, 84, 015003. [Google Scholar] [CrossRef]
- Korec, J.; Stasiewicz, K.A.; Jaroszewicz, L.R.; Piecek, W.; Kula, P. Temperature and voltage sensing based on a tapered optical fiber device with the liquid crystal cladding. Opt. Fiber Technol. 2020, 56, 102190. [Google Scholar] [CrossRef]
- Mrukiewicz, M.; Kowiorski, K.; Perkowski, P.; Mazur, R.; Djas, M. Threshold voltage decrease in a thermotropic nematic liquid crystal doped with graphene oxide flakes. Beilstein J. Nanotechnol. 2019, 10, 71–78. [Google Scholar] [CrossRef]
- Moś, J.; Stasiewicz, K.A.; Matras-Postołek, K.; Jaroszewicz, L.R. Thermo-Optical Switching Effect Based on a Tapered Optical Fiber and Higher Alkanes Doped with ZnS:Mn. Materials 2020, 13, 44. [Google Scholar] [CrossRef]
- Espada, L.I.; Shadaram, M.; Robillard, J.; Pannell, K.H. Ferrocenylenesilylene Polymers as Coatings for Tapered Optical-Fiber Gas Sensors. J. Inorg. Organomet. Polym. 2000, 10, 169–176. [Google Scholar] [CrossRef]
- Korec, J.; Garbat, K.; Stasiewicz, K.A.; Jaroszewicz, L.R. SPR Effect Controlled by an Electric Field in a Tapered Optical Fiber Surrounded by a Low Refractive Index Nematic Liquid Crystal. Materials 2020, 13, 4942. [Google Scholar] [CrossRef]
- Zhu, Y.; Murali, S.; Cai, W.; Li, X.; Suk, J.W.; Potts, J.R.; Ruoff, R.S. Graphene and graphene oxide: Synthesis, properties, and applications. Adv. Mater. 2010, 22, 3906–3924. [Google Scholar] [CrossRef]
- Zhao, Y.; Li, X.; Zhou, X.; Zhang, Y. Review on the graphene based optical fiber chemical and biological sensors. Sensor Actuat. B Chem. 2016, 231, 324–340. [Google Scholar] [CrossRef]
- Waechter, H.; Litman, J.; Cheung, A.H.; Barnes, J.A.; Loock, H.-P. Chemical Sensing Using Fiber Cavity Ring-Down Spectroscopy. Sensors 2010, 10, 1716. [Google Scholar] [CrossRef]
- Azkune, M.; Ruiz-Rubio, L.; Aldabaldetreku, G.; Arrospide, E.; Pérez-Álvarez, L.; Bikandi, I.; Zubia, J.; Vilas-Vilela, J.L. U-Shaped and Surface Functionalized Polymer Optical Fiber Probe for Glucose Detection. Sensors 2018, 18, 34. [Google Scholar] [CrossRef]
- Misbakhov, R.S.; Vasev, A.N.; Sakhabutdinov, A.Z.; Nureev, I.I.; Morozov, O.G.; Lipatnikov, K.A.; Vasilets, A.A. Address Fiber Optical Sensor for Relative Humidity Measuring in a Switchgear. In Optical Technologies for Telecommunications; Andreev, V.A., Bourdine, A.V., Burdin, V.A., Morozov, O.G., Sultanov, A.H., Eds.; SPIE: Prague, Czech Republic, 2020; Volume 11516. [Google Scholar] [CrossRef]
- Liang, W.; Huang, Y.; Xu, Y.; Lee, R.K.; Yariv, A. Highly Sensitive Fiber Bragg Grating Refractive Index Sensors. Appl. Phys. Lett. 2005, 86, 151122. [Google Scholar] [CrossRef]
- Li, B.; Chen, J.; Xu, F.; Lu, Y. Periodic micro-structures in optical microfibers ancluded by Plateau-Rayleigh instability and its applications. Opt. Express 2017, 25, 4326–4334. [Google Scholar] [CrossRef]
- Ni, K.; Chiu, C.; Dong, X.; Poh, C.; Li, T. Temperature-independent refractometer based on a tapered photonic crystal fiber interferometer. Opt. Commun. 2013, 291, 238–241. [Google Scholar] [CrossRef]
- Wei, F.; Mallik, A.; Liu, D.; Wu, Q.; Peng, G.-D.; Farrell, G.; Semenova, Y. Magnetic field sensor based on a combination of a microfiber coupler covered with magnetic fluid and a Sagnac loop. Sci. Rep. 2017, 7, 4725. [Google Scholar] [CrossRef]
- Zhao, Y.; Zhang, S.; Wen, G.; Han, Z. Optical Fiber Gas Sensor Based on Graphene Nanometer Functional Materials. Instrum. Sci. Technol. 2017, 46, 12–27. [Google Scholar] [CrossRef]
- Girei, S.H.; Alkhabet, M.M.; Kamil, Y.M.; Lim, H.N.; Mahdi, M.A.; Yaacob, M.H. Wavelength Dependent Graphene Oxide-Based Optical Microfiber Sensor for Ammonia Gas. Sensors 2021, 21, 556. [Google Scholar] [CrossRef]
- Lim, K.S.; Harun, S.W.; Arof, H.; Ahmad, H. Fabrication and Applications of Microfiber. Sel. Top. Opt. Fiber Technol. 2012, 17, 473–508. [Google Scholar] [CrossRef]
- Ahmad, M.; Hench, L. Effect of taper geometries and launch angle on evanescent wave penetration depth in optical fibers. Biosens. Bioelectron. 2005, 20, 1312–1319. [Google Scholar] [CrossRef]
- Stasiewicz, K.A.; Krajewski, Z.; Jaroszewicz, L.R.; Kujawińska, M. Influence of tapering process on changes of optical fiber refractive index distribution along a structure. Opto-Electron. Rev. 2009, 18, 102–109. [Google Scholar] [CrossRef]
- Hodgkinson, J.; Tatam, R.P. Optical gas sensing: A review. Meas. Sci. Technol. 2013, 24, 012004. [Google Scholar] [CrossRef]
- Tiwari, D.; Mullaney, K.; Korposh, S.; James, S. Ammonia sensing using lossy mode resonance in a tapered optical fiber coated with porphyrin-incorporated titanium dioxide. In Proceedings of the Sixth European Workshop on Optical Fibre Sensors (EWOFS’2016), Limerick, Ireland, 31 May–3 June 2016; Volume 9916. [Google Scholar] [CrossRef]
- Akmar, N.; Yahyaa, M.; Rash, M.; Hamidc, Y.; Ibrahim, S.; Ongc, B.; Rahmanb, N.; Zainf, A.; Mahdia, M.; Yaacob, M. H2 sensor based on tapered optical fiber coated with MnO2 nanostructure. Sens. Actuat. B-Chem. 2017, 246, 421–427. [Google Scholar] [CrossRef]
- Akmar Mohd Yahya, N.; Rashid Yusof Hamid, M.; Hoong Ong, B.; Abdul Rahman, N.; Adzir Mahd, M.; Hanif Yaacob, M. H2 Gas Sensor Based on Pd/ZnO Nanostructures Deposited on Tapered Optical Fiber. IEEE Sens. J. 2020, 20, 2982–2990. [Google Scholar] [CrossRef]
- Jarzebinska, R.; Korposh, S.; James, S.; Batty, W.; Tatam, R.; Lee, S.W. Optical Gas Sensor Fabrication Based on Porphyrin-Anchored Electrostatic Self-Assembly onto Tapered Optical Fibers. Anal. Lett. 2012, 45, 1297–1309. [Google Scholar] [CrossRef]
- Silva, S.; Coelho, L.; Frazão, O.; Santos, J.; Malcata, F. A Review of Palladium-Based Fiber-Optic Sensors. IEEE Sens. J. 2012, 12, 93–102. [Google Scholar] [CrossRef]
- Yang, Q.; Zhu, G.; Singh, L.; Wang, Y.; Singh, R.; Zhang, B.; Zhang, X.; Kumar, S. Highly sensitive and selective sensor probe using glucose oxidase/gold nanoparticles/graphene oxide functionalized tapered optical fiber structure for detection of glucose. Optik 2020, 208, 164536. [Google Scholar] [CrossRef]
- Girei, S.H.; Shabaneh, A.A.; Ngee-Lim, H.; Hamidon, M.N.; Mahdi, M.A.; Yaacob, M.H. Tapered optical fiber coated with graphene-based nanomaterials for measurement of ethanol concentrations in water. Opt. Rev. 2015, 22, 385–392. [Google Scholar] [CrossRef]
- Bi, H.; Yin, K.; Xie, X.; Ji, J.; Wan, S.; Sun, L.; Terrones, M.; Dresselhaus, M.S. Ultrahigh humidity sensitivity of graphene oxide. Sci. Rep. 2013, 3, 2714. [Google Scholar] [CrossRef]
- Kumar, R.; Ghosh, R. Selective determination of ammonia, ethanol and acetone by reduced graphene oxide based gas sensors at room temperature. Sens. Bio-Sens. Res. 2020, 28, 100336. [Google Scholar] [CrossRef]
- Zhu, C.; Tao, L.Q.; Wang, Y.; Zheng, K.; Yu, J.; Li, X.; Chen, X.; Huang, Y. Graphene oxide humidity sensor with laser-induced graphene porous electrodes. Sens. Actuat B Chem. 2020, 325, 128790. [Google Scholar] [CrossRef]
- Chowdhury, F.A.; Morisaki, T.; Otsuki, J.; Sahabul Alam, M. Annealing effect on the optoelectronic properties of graphene oxide thin films. Appl. Nanosci. 2012, 3, 477–483. [Google Scholar] [CrossRef]
- Warga, T.; Zawadzki, P.; Makowicz, M.; Bucholc, B.; Kula, P. The influence of the hydrogenation degree on selected properties of graphene as a material for reversible H2 storage. Int. J. Hydrogen Energy 2019, 44, 23149–23159. [Google Scholar] [CrossRef]
- Xu, B.; Huang, J.; Xu, X.; Zhou, A.; Ding, L. Ultrasensitive NO Gas Sensor Based on the Graphene Oxide-Coated Long-Period Fiber Grating. ACS Appl. Mater. Interfaces 2019, 11, 40868–40874. [Google Scholar] [CrossRef] [PubMed]
- Singh, M.; Raghuwanshi, S.K.; Prakash, O. Ultra-sensitive Fiber Optic Gas Sensor Using Graphene Oxide Coated Long Period Gratings. IEEE Photon. Technol. Lett. 2019, 31, 1473–1476. [Google Scholar] [CrossRef]
- Rosli, M.A.A.; Arasu, P.T.; Lim, H.N.; Noor, A.S.M. Dynamic response of tapered optical fiber coated with graphene oxide for detecting aqueous ethanol. In Proceedings of the IEEE 6th International Conference on Photonics (ICP), Kuching, Malaysia, 14–16 March 2016; pp. 1–3. [Google Scholar] [CrossRef]
- Sai Bhargava Reddy, M.; Kailasa, S.; Geeta Rani, B.; Jayarambabu, N.; Bikshalu, K.; Munindra, P.; Venkateswara Rao, K. MgO@CeO2 chemiresistive flexible sensor for room temperature LPG detection. J. Mater. Sci. Mater. Electron. 2019, 30, 17295–17302. [Google Scholar] [CrossRef]
- Wang, G.; Dai, J.; Yang, M. Fiber-Optic Hydrogen Sensors: A Review. IEEE Sens. J. 2021, 21, 12706–12718. [Google Scholar] [CrossRef]
- Jauregui-Vazquez, D.; Lozano-Sotomayor, P.; Mejía-Benavides, J.E.; Díaz-Cervantes, E. Binding Analysis of Functionalized Multimode Optical-Fiber Sandwich-like Structure with Organic Polymer and Its Sensing Application for Humidity and Breath Monitoring. Biosensors 2021, 11, 324. [Google Scholar] [CrossRef]
- Chlanda, A.; Kowiorski, K.; Małek, M.; Kijeńska-Gawrońska, E.; Bil, M.; Djas, M.; Strachowski, T.; Swieszkowski, W.; Lipińska, L. Morphology and Chemical Purity of Water Suspension of Graphene Oxide FLAKES Aged for 14 Months in Ambient Conditions. A Preliminary Study. Materials 2021, 14, 4108. [Google Scholar] [CrossRef]
- Chlanda, A.; Walejewska, E.; Kowiorski, K.; Heljak, M.; Swieszkowski, W.; Lipińska, L. Investigation into morphological and electromechanical surface properties of reduced-graphene-oxide-loaded composite fibers for bone tissue engineering applications: A comprehensive nanoscale study using atomic force microscopy approach. Micron 2021, 146, 103072. [Google Scholar] [CrossRef] [PubMed]
- Salasinska, K.; Leszczyńska, M.; Celiński, M.; Kozikowski, P.; Kowiorski, K.; Lipińska, L. Burning Behaviour of Rigid Polyurethane Foams with Histidine and Modified Graphene Oxide. Materials 2021, 14, 1184. [Google Scholar] [CrossRef]
- Nasiłowska, B.; Bogdanowicz, Z.; Hińcza-Nowak, K.; Mierczyk, Z.; Góźdź, S.; Djas, M.; Kowiorski, K.; Bombalska, A.; Kowalik, A. Graphene Oxide Aerosol Deposition and its Influence on Cancer Cells. Preliminary Results. Materials 2021, 13, 4464. [Google Scholar] [CrossRef]
- Lemire-Renaud, S.; Strupler, M.; Benboujja, F.; Godbout, N.; Boudoux, C. Double-clad fiber with a tapered end for confocal endomicroscopy. Biomed. Opt. Express 2011, 2, 2961–2972. [Google Scholar] [CrossRef]
- Filippov, V.; Chamorovskii, Y.; Kerttula, J.; Golant, K.; Pessa, M.; Okhotnikov, O. Double clad tapered fiber for high power applications. Opt. Express 2008, 16, 1929–1944. [Google Scholar] [CrossRef] [PubMed]
- Tian, Y.; Wang, W.; Wu, N.; Zou, X.; Wang, X. Tapered optical fiber sensor for label-free detection of biomolecules. Sensors 2011, 11, 3780–3790. [Google Scholar] [CrossRef]
- Brambilla, G.; Xu, F.; Horak, P.; Jung, Y.; Koizumi, F.; Sessions, N.P.; Koukharenko, E.; Feng, X.; Murugan, G.S.; Wilkinson, J.S.; et al. Optical fiber nanowires and microwires: Fabrication and applications. Adv. Opt. Photonics 2009, 1, 107–161. [Google Scholar] [CrossRef]
- Tai, H.; Tanaka, H.; Yoshino, T. Fiber-optic evanescent-wave methane-gas sensor using optical absorption for the 3.392-Mm line of a He-Ne laser. Optics Lett. 1987, 12, 437–439. [Google Scholar] [CrossRef] [PubMed]
Disclaimer/Publisher’s Note: The statements, opinions and data contained in all publications are solely those of the individual author(s) and contributor(s) and not of MDPI and/or the editor(s). MDPI and/or the editor(s) disclaim responsibility for any injury to people or property resulting from any ideas, methods, instructions or products referred to in the content. |
© 2023 by the authors. Licensee MDPI, Basel, Switzerland. This article is an open access article distributed under the terms and conditions of the Creative Commons Attribution (CC BY) license (https://creativecommons.org/licenses/by/4.0/).