Abstract
A cancer diagnosis is one of the most difficult medical challenges. Leukemia is a type of cancer that affects the bone marrow and/or blood and accounts for approximately 8% of all cancers. Understanding the epidemiology and trends of leukemia is critical for planning. Specialists diagnose leukemia using morphological analysis, but there is a possibility of error in diagnosis. Since leukemia is so difficult to diagnose, intelligent methods of diagnosis are required. The primary goal of this study is to develop a novel method for extracting features hierarchically and accurately, in order to diagnose various types of acute leukemia. This method distinguishes between acute leukemia types, namely Acute Lymphocytic Leukemia (ALL) and Acute Myeloid Leukemia (AML), by distinguishing lymphocytes from monocytes. The images used in this study are obtained from the Shahid Ghazi Tabatabai Oncology Center in Tabriz. A type-II fuzzy deep network is designed for this purpose. The proposed model has an accuracy of 98.8% and an F1-score of 98.9%, respectively. The results show that the proposed method has a high diagnostic performance. Furthermore, the proposed method has the ability to generalize more satisfactorily and has a stronger learning performance than other methods.
1. Introduction
Cancer is a widespread disease that can occur at any time and in any location, and it is the world’s second leading cause of death. A large number, though not all, of hematopoietic tissue tumors can be identified today at the level of genetic abnormalities and the resulting intracellular pathway disorders. These findings have created appropriate methods for the targeted treatment of certain disorders. Bone marrow is a soft, spongy substance in the center of many bones in the body, and blood cells are produced in this area. Blood stem cells that have not yet matured can become myeloid stem cells or lymphatic stem cells. Leukemia is the most common type of cancer. Leukemia usually begins in the bone marrow and results in the formation of a large number of abnormal white blood cells (Putzu, Lorenzo et al. [1]). These white blood cells are completely undifferentiated and are called “blast” or “leukemia” cells. Symptoms of this condition include bleeding and bruising, extreme tiredness, fever, and an increased risk of infection. These symptoms are caused by a lack of normal blood cells. A diagnosis of leukemia is made using blood tests and bone marrow biopsies [2]. Although the exact cause of leukemia is unknown, scientists and doctors believe that it is caused by a combination of genetic and environmental factors [3]. Smoking, ionizing radiation, certain chemicals such as benzene, a history of chemotherapy, and Down syndrome are all known to increase the risk of leukemia [3,4]. In addition, people who have had leukemia before are also at a higher risk [4].
Lymphocytes are a type of white blood cell involved in the immune system of vertebrates. In terms of appearance, they are divided into two categories: large and granular lymphocytes, and small lymphocytes. Most large lymphocytes are the same as natural killer cells. Small lymphocytes are composed of T cells and B cells. T cells attack and fight themselves, while B cells produce antibodies and fight foreign cells with antibodies. Which one these cells turn into is genetically defined. In a person with leukemia, this stage stops, and this conversion does not happen. A 20% increase in the blast cells in the peripheral blood is called leukemia. It should be noted that if a person becomes ill, a blast may be seen, but its presence in the peripheral blood is transient and may disappear; however, this is not the case in leukemia. Up to 5% blast and below is normal, but if the blast accumulates in the bone marrow to more than 20%, then leukemia is inevitable. The more immature the cell, the larger the cell becomes, and as it matures, it becomes smaller and its function becomes more normal and defined. When the cell is large and immature and the blood moves slowly, the oxygen supply is disrupted; these cells eat whatever reaches them, causing a lack of sugar, potassium, etc., in the body. As a result, deficiency occurs in the body and can affect all organs; therefore, the patient becomes symptomatic. The presence of these cells in the bone marrow limits the space for other cells and causes them to produce less stem cells that comprise platelets, neutrophils, erythroid cells, and red blood cells, causing anemia (red blood cell deficiency), thrombocytopenia (low platelets/bleeding), and neutropenia (neutrophil cell deficiency/infection and fever). An error may occur in the form of saprogenous tumors, and gene-inhibiting genes detect and eliminate these errors. BRCA1 and BRCA2 are tumor inhibitors. However, if these genes have a mutation problem, they can no longer achieve this, and the person becomes prone to tumors. Further, a stimulus such as radiation or chemicals—including benzene—may cause the tumor to become public [5,6].
Carefully observing blood samples by operators is an accessible method of diagnosing various diseases. Human visual inspection is time-consuming and repetitive, and it is heavily reliant on the operator’s skill, limiting statistical achievement and increasing human error. There are various systems on the market for automatic blood cell counting, which count the number of different types of cells in a bloodstain. Although the count results are very accurate, this device does not detect morphological abnormalities in the cells; thus, accurate analysis under a microscope is required. Images are an important part of cancer clinical protocols because they can provide functional, metabolic, structural, and morphological information, and when combined with other diagnostic tools, they can help with clinical decision making [6]. Image processing methods can be used to count cells in human blood and learn about their morphology. These methods necessitate a precise image to provide the correct criteria for disease diagnosis. Machine learning algorithms have been widely used in various fields of medicine in recent years to improve and accelerate the timely diagnosis and treatment of diseases and conditions such as lung and breast cancer tumors, where time is an important factor in the disease’s diagnosis. The available machine learning approaches involve two main tasks: feature extraction/selection and classification. The proper performance of such methods strongly depends on the extraction of the desired features, as well as the training of appropriate classifiers. In general, if fixed manual features or illogical classifiers are used in these methods, they may perform improperly in detection. However, implementing appropriate requirements is challenging and needs high academic and technical expertise, which may be costly due to scarce human resources. Moreover, there is no guarantee that a particular feature/classifier is set to be the optimal approach for all types of problems. Image processing techniques and the machine learning approach as a decision-making tool assists doctors in the early detection of cancer. The most important contribution to reducing mortality from a specific cancer is early detection via image screening. The Artificial Neural Network (ANN) is a collection of machine learning algorithms used for data modeling. The two broad categories of ANNs are Shallow Neural Networks (SNN) and Deep Neural Networks (DNN). DNNs have been widely used with great success in image analysis. The ability of DNNs to extract optimal features from raw data is their primary advantage [6]. To date, various methods based on image processing and machine learning algorithms for automatically analyzing and detecting leukemia have been investigated, as is discussed further below.
Lezoray et al. [7] investigated the ability to combine two-color segmentation in microscopic images. This paper investigated the ability of two-color pixel classification schemes to collaborate with a color watershed using Bayesian and K-means classification. As color pixel classification alone does not provide sufficient accuracy in extracting color regions, this study proposed a three-step strategy based on simplification, classification, and color watershed. The strategy was tested using microscopic images. The segmentations that resulted were evaluated quantitatively using a learning set of reference images. Image processing was used by Madhloom et al. [8] to classify and detect leukemia cells. The algorithm was trained to detect various types of leukemia in the study. The traditional method of diagnosing leukemia with a microscope is time-consuming and prone to error, and the equipment required is costly and not available in all laboratories. This method was used for image processing in contrast, and it was faster and allowed for more data to be examined. The results showed that the accuracy of this method ranged between 85 and 98%. Cheewatanon et al. [9] demonstrated a new white blood cell segmentation method that employs a mean shift filter and a region-growing algorithm. This study found that white blood cells provide hematologists with useful information for diagnosing and treating a variety of diseases. The proposed new image segmentation algorithm performs two functions: it eliminates distortion using the mean-pass filter (MS) and it provides a regional growth algorithm for image segmentation. The mentioned algorithm was tested in the RGB and CIEL * a * b * color spaces, and the experimental results demonstrated very high performance in the two-color spaces mentioned. Putzu et al. [1] presented a method for leukemia detection using image processing techniques. This study discovered that leukemia is a deadly disease that threatens both children and adults and is a malignant neoplasm in the blood or bone marrow. The purpose of this method was to improve the diagnosis and increase the accuracy of the morphological analysis and features of blood cell tissue using image processing, because ocular examination of blood samples has low accuracy and speed and is dependent on the skill of the hematologist. In addition, the aim of this method was to propose a way to distinguish diseased cells from healthy ones in blood and bone marrow samples, and to help spread computer achievements in acute lymphoid leukemia. In this study, image segmentation, feature extraction, and classification on the microscopic images of blood cells were used to detect lymph cells. Raje et al. [10] used image processing to present a new method for detecting leukemia in microscopic images. An increase in the number of white blood cells in human blood, according to this study, is a symptom of leukemia. Using initial segmentation and statistical parameters such as median and standard deviation, this study distinguished white blood cells from other blood components such as erythrocytes and platelets. Cell geometric features, such as the area and peripheral of the cell nucleus, image enhancement, threshold setting, and mathematical morphology, were also used in this study to diagnose leukemia. Himali et al. [11] investigated methods for detecting leukemia. Various image processing techniques were used in this study to identify red blood cells and immature white cells. The goal was to identify and count leukemia cells. Based on the presence of immature blast cells, leukemia can be identified and classified as chronic or acute. In this study, immature cells were detected using a variety of techniques, including histogram equalization, linear contrast stretching, and morphological techniques such as area opening, area closing, erosion, and dilation. The accuracy for watershed transform and K means, histogram equalization and linear contrast stretching, and shape-based features were obtained to be 72.2 percent, 73.7 percent, and 97.8 percent, respectively. Madhloom et al. [12] described an innovative image segmentation method for detecting acute leukemia blast cells in peripheral blood. The first goal was to use color transformation and mathematical morphology to segment the leukemic cells. In addition, to address the issue of non-homogeneous nuclear chromatin patterns, this study presented a powerful method for separating the nucleus region from the cytoplasm region using a seeded region growing algorithm powered by histogram equalization and arithmetic addition. The proposed method’s robustness was tested using two datasets of 1024 peripheral blood images obtained from two different medical centers. According to the quantitative evaluation, the proposed method outperformed its competitors in terms of segmentation performance, achieving remarkable segmentation results of approximately 96 percent in blast cell extraction and 94 percent in nucleus/cytoplasm separation. Bibi et al. [13] presented an Internet of Medical Things (IoMT)-based framework to improve and provide quick and safe leukemia identification. Cloud computing was used to connect clinical devices to network resources in this system. The framework for this study was built using DenseNet-121 and ResNet-34. This study used two publicly available leukemia datasets: ALL-IDB and ASH image bank. According to the findings, the presented models outperformed other well-known machine learning algorithms in identifying healthy versus leukemia subtypes. Zhou et al. [14] used deep learning in real-world clinical scenarios to develop a leukemia diagnosis system. New deep learning techniques were used in this study, and an end-to-end leukemia diagnosis system was built using raw images with no pre-processing. In this system, 1732 bone marrow images were used to train a Convolutional Neural Network (CNN). The system cleverly mimicked a hematologist’s workflow by detecting and excluding uncountable and crushed cells, then classifying and counting the remaining cells to arrive at a diagnosis. The CNN classified white blood cells with an accuracy of 82.93 percent, a precision of 86.07 percent, and an F1 score of 82.02 percent. Furthermore, the accuracy, sensitivity, and specificity in diagnosing acute lymphoid leukemia were 89 percent, 86 percent, and 95 percent, respectively. With an average accuracy of 82.93 percent, the system also performed well in detecting lymphoma and neuroblastoma bone marrow metastasis. A method for diagnosing acute myeloid leukemia was presented by Nazari et al. [15]. The Gene Expression Omnibus repository was used to obtain the leukemia microarray gene data for this study, which included 22,283 genes. A normalization test and PCA were used to perform preliminary preprocessing. The data were then fed into a DNN, with the final results being cross-validated using classifiers. The results of the normalization test were significant (p > 0.05), demonstrating the ability of the PCA gene to segregate, as well as showing the independence of cancer and healthy cells. A single-layer neural network and DNNs (with three hidden layers) produced results that were accurate to 63.33 and 96.67 percent, respectively.
A review of leukemia diagnosis studies reveals that, while numerous studies have been conducted in this area to date, these studies have limitations. The majority of these studies have focused on leukemia diagnosis rather than the various types of leukemia. In addition, traditional image processing methodologies, rather than smart algorithms, were used to extract features and diagnose leukemia in the majority of these studies. Finding an acceptable method for every case study in order to extract features is often time-consuming and involves a high volume of calculations. The majority of the proposed algorithms have low detection accuracy for various types of leukemia diagnoses. Furthermore, in the majority of these studies, no valid database was gathered. To address these concerns, based on a type-II fuzzy Deep Convolution Neural Network (DCNN) model, this study presents for the first time a new method for diagnosing two types of acute leukemia: Acute Lymphocytic Leukemia (ALL) and Acute Myeloid Leukemia (AML). A valid database is obtained from the Shahid Ghazi Tabatabai Oncology Center in Tabriz in order to achieve this goal. The proposed method can intelligently extract optimal features and detect the type of acute leukemia, and it can be used in hospital and laboratory systems. The advantage of this model over comparative models is in reducing the volume of calculations and increasing the accuracy of detection.
The contribution of this research can be summarized as follows:
- a.
- Compilation of a standardized database of acute leukemia images.
- b.
- Presenting an automatic method based on the combination of type-II fuzzy networks with deep learning networks in order to solve the problem of uncertainties in model training.
- c.
- Providing an automatic end-to-end model with high speed and accuracy without the need for feature extraction/selection block.
The remainder of this paper is organized as follows. Section 2 provides an overview of the DCNN model and the type-II fuzzy set. Section 3 presents the proposed method for diagnosing acute leukemia. Section 4 demonstrates how the proposed method can be used to diagnose various types of acute leukemia. The conclusion is presented in Section 5 at the end.
2. Materials and Methods
This section shows the materials and methods used in this study. Section 2.1 provides a brief description of the DCNN model. Section 2.2 explains the type-II fuzzy set.
2.1. Brief Description of DCNN Model
DCNNs have proven to be a highly successful replacement for traditional neural networks in the development of machine learning classification algorithms. DCNN learns in two stages: feed forward and reverse propagation. In general, DCNN is composed of three major layers: convolutional, pooling, and connected layers [16]. The output of a convolutional layer is referred to as feature mapping. The max-pooling layer is typically employed after each convolutional layer that chooses the maximum values in each feature map. A dropout layer is employed to prevent overfitting; hence, each neuron is thrown out of the network at each stage of training with a probability. A Batch Normalization (BN) layer is commonly used to normalize data within a network and expedite network training [17].
One of the most significant components of DNN is the performance of activation functions, as these play an important role in the learning process. An activation function is used after each convolutional layer [18]. Various activation functions, such as ReLU, Leaky-ReLU, ELU, and softmax, are available to increase learning performance on DNN networks. Since the discovery of the ReLU activation function, which is presently the most often used activation unit, DNNs have come a long way. The ReLU activation function overcomes the gradient removal problem while simultaneously boosting learning performance [16]. A loss function is used in the prediction stage of DNN models to learn the error ratio. The loss function is a means of measuring and describing model efficiency in machine learning approaches. The error criteria are then minimized using an optimization strategy. Indeed, the optimization findings are employed to update the hyperparameters [16].
2.2. Type-II Fuzzy Set
In 1975, type-II fuzzy sets were introduced as an extension of type-I fuzzy sets [19]. In contrast to type-I fuzzy systems, the belonging functions in type-II fuzzy systems have fuzzy membership degrees. In comparison to conventional fuzzy systems (type-I of fuzzy functions), the use of type-II fuzzy belonging functions improves fuzzy systems’ ability to deal with uncertainty (such as measurement noise). This capability of type-II fuzzy systems has been used in research to design systems with high uncertainty and complexity (such as control systems), and its efficiency has been demonstrated in theoretical and practical applications. The type-II fuzzy activation function has recently been used to improve the performance of neural networks [19].
The total number of learnable/adjustable parameters when using the type-II fuzzy activation function is only ( is the number of hidden units), indicating that this number is relatively small when compared to the total number of ordinary DNN weights. Due to the mentioned abilities of type-II fuzzy sets, the belonging functions of type-II fuzzy activation functions are used instead of the usual activation functions in the proposed model’s hidden layers to deal with uncertainties, measurement noises, and improve detection accuracy [19,20,21].
3. Suggested Method
This section describes the proposed method for diagnosing acute leukemia, including ALL and AML, using images of lymphocytes and monocytes. This approach is divided into three stages, which are as follows: (1) data collection, (2) the pre-processing of data, and (3) the proposed type-II fuzzy DCNN model design. Figure 1 depicts the proposed method block diagram at a glance. Each of the expressed steps is presented in detail in the subsections that follow.
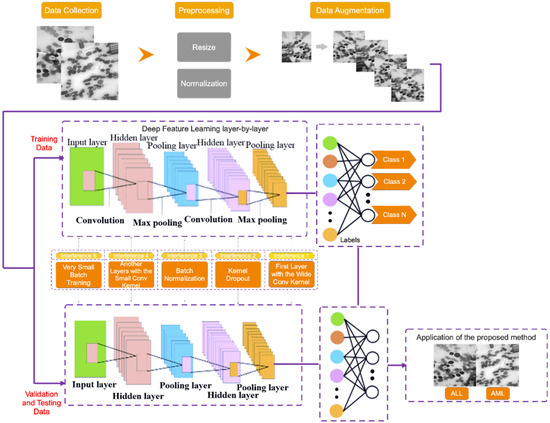
Figure 1.
The proposed method block diagram.
3.1. Data Collection
Three steps are taken in this study to collect a dataset. In the first step, data on healthy or suspected leukemia is separated using clinical symptoms and blood tests. If a person’s data are suspected of indicating leukemia, the number of healthy cells and blast cells in the peripheral blood smear and bone marrow smear is counted in the second step, and if there is a minimum chance of leukemia, the person’s data will be referred to the third step to diagnose the leukemia type. In the third step, a physician examines the characteristics of lymphocyte and monocyte cells to determine the type of acute leukemia (i.e., ALL and AML) and label them.
The dataset in this study consists of images of ALL and AML obtained from the Shahid Ghazi Tabatabai Oncology Center in Tabriz using the three steps described above. This dataset is collected from 44 patients at various time intervals. Twelve of the forty four patients are male and 32 are female, with varying average ages. The collected dataset from 44 patients includes 184 images of ALL and 469 images of AML. Figure 2 shows these two different types, i.e., ALL and AML. As can be seen, there is no discernible difference between the ALL and AML groups. As a result, this disease is not visually discernible.
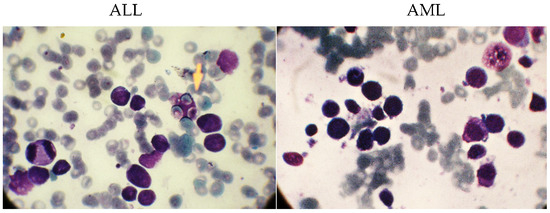
Figure 2.
The images related to the two types, including ALL and AML.
3.2. Data Pre-Processing
The preprocessing operations on the collected dataset have several steps, which are described in this section. Since the collected images differ in color and format, they are all resized to 224 × 224 and then converted to grayscale to reduce the computational volume. They are then scaled between 0 and 1. The number of images in the collected database is not balanced because the number of images of ALL is limited. As a result, it can result in poor classification performance and over fitting issues; thus, the Data Augmentation method (DA) is used to overcome these issues. According to this, the number of images in the ALL group is artificially increased. During training, this process improves the model’s generalization ability. The rotation range refers to the range of randomly rotated images used during training, which is set to 50 degrees in the proposed method. Furthermore, both the width shift (horizontal translation of the images) and the height shift (vertical translation of the images) are 0.3%. The number of ALL samples before and after DA is 184 and 469, respectively, which equals the AML group.
3.3. Proposed Type-II Fuzzy DCNN Model Design
The following architecture has been chosen for the proposed type-II fuzzy DCNN model: I. a dropout layer with the value p = 0.3; II. a convolution layer with the type-II fuzzy activation function, followed by the max-pooling layer and the BN layer; III. the previous step is repeated three times; IV. a convolution layer with the type-II fuzzy activation function, followed by the BN layer; V. the previous step is repeated once. In order to calculate scores, the FC layer is used in conjunction with the nonlinear softmax activation function. The number of filters, stride size, and architectural details of the proposed type-II fuzzy DCNN model are shown in Table 1. In the proposed model, the dimensionality of the hidden layers is reduced from 224 × 224 (input size) to 2 (number of classes). The architectural details of the proposed type-II fuzzy DCNN model are shown in Figure 3. It is worth noting that the hyperparameter values have been adjusted based on a review of related works and tests conducted on them. Finally, in the proposed model, the best hyperparameters are chosen. In the BN layer, the momentum and gamma parameters are set to 0.8, and the weight decay rate is set to 5e-5. Most functions, including Stochastic Gradiant Descend (SGD) [22,23], Adam [24], StepLR [25,26], CyclicLR [27], and ReduceLR, are investigated as optimizers. However, because the proposed model performs better in practice with the RMSProp algorithm, this algorithm is used as the optimizer with a learning rate of 0.0001 and batch size 64. In addition, the MSE loss function [28] manages the training process. The use of cross-entropy is more useful in classification problems than MSE. Moreover, MSE is more useful in regression-related problems. However, MSE works faster than cross-entropy in classification problems. Considering that the accuracy of classification is above 95%, a compromise between the speed and accuracy of classification should be established. Accordingly, in this study, MSE is as the loss function. Table 2 shows the optimal hyperparameters for the proposed model.

Table 1.
Details of the layers in the construction of the proposed network.
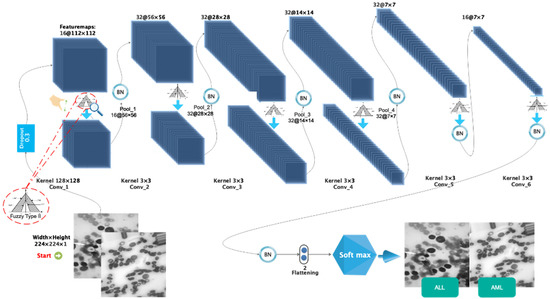
Figure 3.
The images related to the two types including ALL and AML.
Table 2.
Selected parameters in the construction of the proposed network.
Out of the total number of samples collected (938), 657 are used for training (70 percent), 94 are used for validation (10 percent), and 187 are used for testing (20 percent). In addition, all samples for the training and evaluation sets are chosen at random. Figure 4 depicts the sample allocation for the training, validation, and testing datasets.
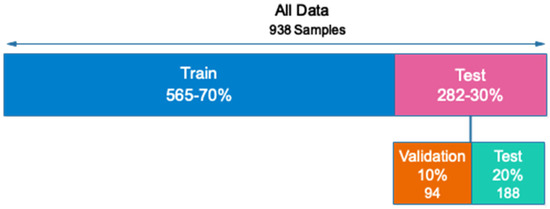
Figure 4.
Allocation of data to evaluate the proposed network.
4. Results
The results of the proposed method for acute leukemia diagnosis from images of lymphocytes and monocytes based on the proposed type-II fuzzy deep network are presented in this section. All simulations are run on the Google Club system, which has the following specifications: Tesla k90 GPU and 25 GB RAM.
Figure 5 depicts the accuracy and error diagrams of the proposed type-II fuzzy DCNN model (based on training and validation data), as well as bar chart diagrams of accuracy, precision, sensitivity, specificity, kappa, f-score, confusion matrix, and ROC diagram (based on testing data), to assess the effectiveness of the proposed method.
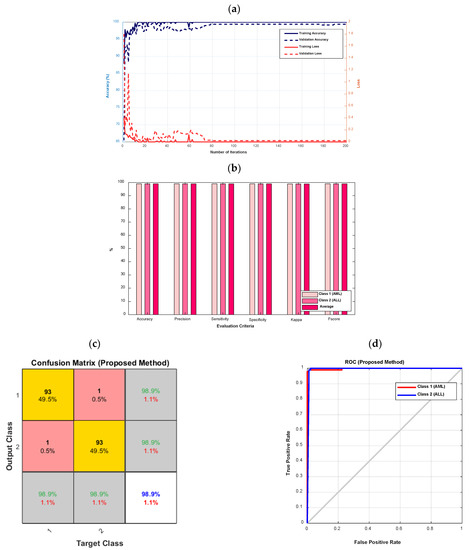
Figure 5.
The accuracy and error diagrams of the proposed type-II fuzzy DCNN model (based on training and validation data), as well as the bar chart diagrams of accuracy, precision, sensitivity, specificity, kappa, f-score, confusion matrix, and ROC diagram (based on testing data); (a) accuracy and error diagrams, (b) bar chart diagram, (c) confusion matrix, and (d) ROC diagram.
According to Figure 5a, as the number of iterations increases, the error of the proposed model decreases until it reaches its steady-state value after 80 iterations. In addition, after 80 iterations, the proposed model’s accuracy for validation data is almost 99%. The accuracy, precision, sensitivity, specificity, kappa, and f-score of the proposed model are all 98.9%, as shown in Figure 5b. According to Figure 5c, the proposed model’s diagnostic performance for different types of leukemia, namely AML (class 1) and ALL, is the same (class 2). The ROC diagram in Figure 5d has a value in the range of 0.9 to 1 and is located in the left hemisphere, depicting the desired performance of the proposed model.
Figure 6 shows the t-SNE method’s visualization of the extracted features from the second layer of convolution and the softmax layer for the testing data, in order to further evaluate the proposed method’s performance. Figure 6 shows that the testing data in the softmax layer are correctly identified, with only one sample from each class misdiagnosed. This demonstrates that the proposed model can extract desired features from raw data and classify different classes effectively.
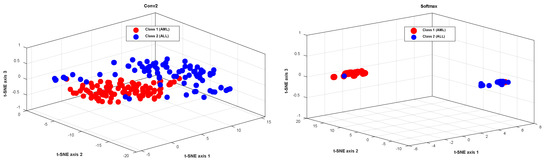
Figure 6.
The visualization of the extracted features from the second layer of convolution, and the softmax layer for the testing data, using the t-SNE method.
In Figure 7, the accuracy and error diagrams of the proposed method based on the DCNN model with type-II fuzzy activation function (for validation data and different iterations) are compared with the DCNN model with Relu and Leaky-Relu activation functions, in order to demonstrate its desired performance. Figure 8 also depicts bar chart diagrams of accuracy, precision, sensitivity, specificity, kappa, and f-score for the proposed method, compared to the DCNN model with Relu and Leaky-Relu activation functions.
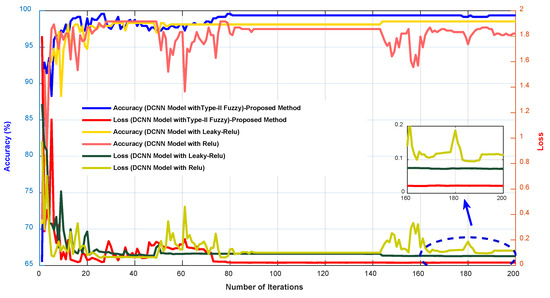
Figure 7.
The accuracy and error diagrams of the proposed method based on the DCNN model with type-II fuzzy activation function, compared to the DCNN model with Relu and Leaky-Relu activation functions.

Figure 8.
The bar chart diagrams of accuracy, precision, sensitivity, specificity, kappa, and f-score for the proposed method, compared to the DCNN model with Relu and Leaky-Relu activation functions.
As shown in Figure 7 and Figure 8, the DCNN model in combination with the fuzzy-II activation function, i.e., the proposed method, has better performance and less error than the DCNN model in combination with the Relu and Leaky-Relu activation functions, indicating the desirability of the proposed method for acute leukemia diagnosis. Figure 9 depicts the confusion matrices and ROC diagrams based on testing data for the DCNN model with Relu and Leaky-Relu activation functions.
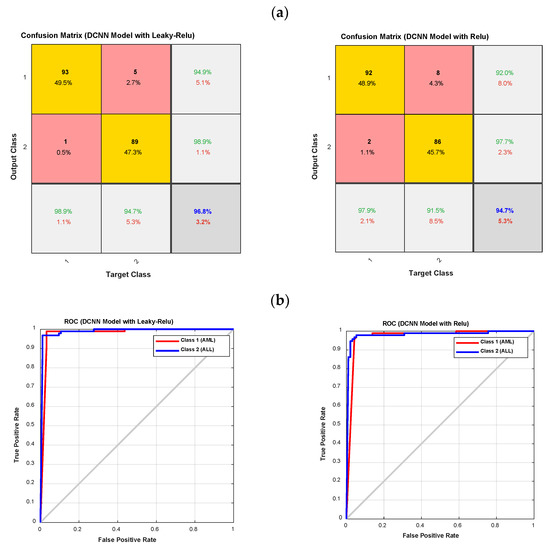
Figure 9.
The confusion matrixes and ROC diagrams for the DCNN model with Relu and Leaky-Relu activation functions; (a) the confusion matrixes; and (b) the ROC diagrams.
As shown in Figure 9, the DCNN model with the Leaky-Relu activation function outperforms the DCNN model with the Relu activation function. It has also been observed that the DCNN model with Relu and Leaky-Relu activation functions for class 1, i.e., AML, outperforms class 2, i.e., ALL. In order to clarify the computational efficiency of type-II fuzzy, Leaky ReLU, and ReLU activation functions, the performance of each is shown in Table 3. According to Table 3, as it is known, the computational efficiency of type-II fuzzy function is lower compared to ReLU and Leaky ReLU, and it can be used in real-time applications. Finally, the accuracy of various methods for leukemia diagnosis is presented in Table 4, with the proposed method’s results highlighted in bold. As can be seen from Table 4, most previous studies have only been able to distinguish the type of ALL, while the proposed method in this study enables the diagnosis of different types of acute leukemia, i.e., ALL and AML. The accuracy of the proposed method for the diagnosis of ALL and AML is 98.94%, which is higher than in previous studies. Furthermore, in most previous studies, benchmark datasets have been used, while in the present study, a database was collected.
Table 3.
Comparison of network training time with different functions.
Table 4.
The accuracy of various methods for leukemia diagnosis.
As the current study uses an automated method to extract the features hierarchically, the time-consuming problem of selecting the appropriate method for selecting the features has been solved. However, due to differences in datasets, methods, categories, and simulation environments, a one-to-one comparison of these studies is usually not feasible. In this work, instead of the presented network, we could use pre-learned networks for data classification. Using pre-learned networks can reduce the computational efficiency of the model. However, if the number of data increases, these networks are not suitable for real-time applications. Moreover, in recent years, multi-task learning networks have been widely used in classification problems, which provide a more accurate training process than classic CNN networks. However, because this network provides multi-class feature extraction/selection from data, it has high computational efficiency [34].
5. Conclusions
Due to the spread of cancer, particularly acute leukemia, the automatic and rapid detection of acute leukemia is regarded as critical in order to assist patients and the medical community. The goal of this study was to present a new method for diagnosing different types of leukemia, such as AML and ALL, using images of lymphocytes and monocytes. According to this, a dataset with various types of acute leukemia, including ALL and AML, was provided. A type-II fuzzy DCNN model was designed with the goal of extracting desired features from raw images in a hierarchical fashion. The current study shows that the proposed method can extract desired features from raw images and diagnose acute leukemia with acceptable accuracy. According to the results, the proposed method for automatically diagnosing acute leukemia is very satisfactory and appropriate, and it could be a good assistant physician once it enters the field of application. Future research should explore the analysis and effectiveness of the features extracted from the images.
Author Contributions
Conceptualization, S.A.; methodology, A.H.N. and A.B.S.; software, S.A. and J.V.G.; validation, S.D. and S.A.; writing—original draft preparation, A.H.N. and S.A. All authors have read and agreed to the published version of the manuscript.
Funding
This research received no external funding.
Institutional Review Board Statement
The study was conducted in accordance with the Declaration of Helsinki and approved by the Ethics Committee of Tabriz University of Medical Sciences. (Protocol code 1399.45.AC and date of approval 1399.4).
Informed Consent Statement
Informed consent was obtained from all subjects involved in the study.
Data Availability Statement
The data related to this article are publicly available on the GitHub platform under the title Ansari acute leukemia images.
Conflicts of Interest
The authors declare no conflict of interest.
References
- Putzu, L.; Caocci, G.; Di Ruberto, C. Leucocyte classification for leukaemia detection using image processing techniques. Artif. Intell. Med. 2014, 62, 179–191. [Google Scholar] [CrossRef]
- Urbano, T.; Vinceti, M.; Wise, L.A.; Filippini, T. Light at night and risk of breast cancer: A systematic review and dose–response meta-analysis. Int. J. Health Geogr. 2021, 20, 1–26. [Google Scholar] [CrossRef] [PubMed]
- Labati, R.D.; Piuri, V.; Scotti, F. The Acute Lymphoblastic Leukemia Image Database for Image Processing; Universita Degli Studi Di Milano: Milan, Italy, 2011. [Google Scholar]
- Putzu, L.; Di Ruberto, C. White blood cells identification and classification from leukemic blood image. In Proceedings of the International Work-Conference on Bioinformatics and Biomedical Engineering, Granada, Spain, 18–20 March 2013; pp. 99–106. [Google Scholar]
- Liu, F.; Xue, S.; Zhang, Y.; Yang, J.; Hu, J.; Li, D.; Ma, X.; Wang, J. Clostridium perfringens sepsis in three patients with acute leukemia and review of the literature. Int. J. Hematol. 2021, 113, 508–517. [Google Scholar] [CrossRef] [PubMed]
- Ghaderzadeh, M.; Asadi, F.; Hosseini, A.; Bashash, D.; Abolghasemi, H.; Roshanpour, A. Machine learning in detection and classification of leukemia using smear blood images: A systematic review. Sci. Program. 2021, 2021, 9933481. [Google Scholar] [CrossRef]
- Lezoray, O.; Cardot, H. Cooperation of color pixel classification schemes and color watershed: A study for microscopic images. IEEE Trans. Image Process. 2002, 11, 783–789. [Google Scholar] [CrossRef] [PubMed]
- Madhloom, H.; Kareem, S.; Ariffin, H.; Zaidan, A.; Alanazi, H.; Zaidan, B. An automated white blood cell nucleus localization and segmentation using image arithmetic and automatic threshold. J. Appl. Sci. 2010, 10, 959–966. [Google Scholar] [CrossRef]
- Cheewatanon, J.; Leauhatong, T.; Airpaiboon, S.; Sangwarasilp, M. A new white blood cell segmentation using mean shift filter and region growing algorithm. Int. J. Appl. Biomed. Eng. 2011, 4, 31. [Google Scholar]
- Raje, C.; Rangole, J. Detection of Leukemia in microscopic images using image processing. In Proceedings of the 2014 International Conference on Communication and Signal Processing, New York, NY, USA, 3–5 April 2014; pp. 255–259. [Google Scholar]
- Vaghela, H.P.; Modi, H.; Pandya, M.; Potdar, M. Leukemia detection using digital image processing techniques. Leukemia 2015, 10, 43–51. [Google Scholar]
- Madhloom, H.T.; Kareem, S.A.; Ariffin, H. Computer-aided acute leukemia blast cells segmentation in peripheral blood images. J. Vibroengineering 2015, 17, 4517–4532. [Google Scholar]
- Bibi, N.; Sikandar, M.; Ud Din, I.; Almogren, A.; Ali, S. IoMT-based automated detection and classification of leukemia using deep learning. J. Healthc. Eng. 2020, 1, 12. [Google Scholar] [CrossRef]
- Zhou, M.; Wu, K.; Yu, L.; Xu, M.; Yang, J.; Shen, Q.; Liu, B.; Shi, L.; Wu, S.; Dong, B. Development and evaluation of a leukemia diagnosis system using deep learning in real clinical scenarios. Front. Pediatr. 2021, 616. [Google Scholar] [CrossRef]
- Nazari, E.; Farzin, A.H.; Aghemiri, M.; Avan, A.; Tara, M.; Tabesh, H. Deep learning for acute myeloid leukemia diagnosis. J. Med. Life 2020, 13, 382. [Google Scholar] [CrossRef]
- Sheykhivand, S.; Rezaii, T.Y.; Meshgini, S.; Makoui, S.; Farzamnia, A. Developing a Deep Neural Network for Driver Fatigue Detection Using EEG Signals Based on Compressed Sensing. Sustainability 2022, 14, 2941. [Google Scholar] [CrossRef]
- Sabahi, K.; Sheykhivand, S.; Mousavi, Z.; Rajabioun, M. Recognition COVID-19 cases using deep type-2 fuzzy neural networks based on chest X-ray image. Comput. Intell. Electr. Eng. 2022, 2, 12. [Google Scholar]
- Sheykhivand, S.; Rezaii, T.Y.; Mousavi, Z.; Meshgini, S.; Makouei, S.; Farzamnia, A.; Danishvar, S.; Teo Tze Kin, K. Automatic Detection of Driver Fatigue Based on EEG Signals Using a Developed Deep Neural Network. Electronics 2022, 11, 2169. [Google Scholar] [CrossRef]
- Beke, A.; Kumbasar, T. Learning with type-2 fuzzy activation functions to improve the performance of deep neural networks. Eng. Appl. Artif. Intell. 2019, 85, 372–384. [Google Scholar] [CrossRef]
- Shahini, N.; Bahrami, Z.; Sheykhivand, S.; Marandi, S.; Danishvar, M.; Danishvar, S.; Roosta, Y. Automatically Identified EEG Signals of Movement Intention Based on CNN Network (End-To-End). Electronics 2022, 11, 3297. [Google Scholar] [CrossRef]
- Seyed Alizadeh, S.M.; Bagherzadeh, A.; Bahmani, S.; Nikzad, A.; Aminzadehsarikhanbeglou, E.; Tatyana Yu, S. Retrograde gas condensate reservoirs: Reliable estimation of dew point pressure by the hybrid neuro-fuzzy connectionist paradigm. J. Energy Resour. Technol. 2022, 144, 063007. [Google Scholar] [CrossRef]
- Sheykhivand, S.; Yousefi Rezaii, T.; Mousavi, Z.; Meshini, S. Automatic stage scoring of single-channel sleep EEG using CEEMD of genetic algorithm and neural network. Comput. Intell. Electr. Eng. 2018, 9, 15–28. [Google Scholar]
- Johnson, R.; Zhang, T. Accelerating stochastic gradient descent using predictive variance reduction. In Proceedings of the 26th International Conference on Neural Information Processing Systems, Red Hook, NY, USA, 5–10 December 2013. [Google Scholar]
- Sheykhivand, S.; Rezaii, T.Y.; Saatlo, A.N.; Romooz, N. Comparison between different methods of feature extraction in BCI systems based on SSVEP. Int. J. Ind. Math. 2017, 9, 341–347. [Google Scholar]
- Hajipour Khire Masjidi, B.; Bahmani, S.; Sharifi, F.; Peivandi, M.; Khosravani, M.; Hussein Mohammed, A. CT-ML: Diagnosis of breast cancer based on ultrasound images and time-dependent feature extraction methods using contourlet transformation and machine learning. Comput. Intell. Neurosci. 2022, 2022, 1493847. [Google Scholar] [CrossRef] [PubMed]
- Wójcik, B.; Maziarka, Ł.; Tabor, J. LOSSGRAD: Automatic learning rate in gradient descent. arXiv 2019, arXiv:1902.07656. [Google Scholar] [CrossRef]
- Dang, Y.; Anand, D.; Sethi, A. Pixel-wise Segmentation of right ventricle of heart. In Proceedings of the TENCON 2019–2019 IEEE Region 10 Conference (TENCON), Kochi, India, 17–20 October 2019; pp. 1797–1802. [Google Scholar]
- Mousavi, Z.; Ettefagh, M.M.; Sadeghi, M.H.; Razavi, S.N. Developing deep neural network for damage detection of beam-like structures using dynamic response based on FE model and real healthy state. Appl. Acoust. 2020, 168, 107402. [Google Scholar] [CrossRef]
- Kassani, S.H.; Kassani, P.H.; Wesolowski, M.J.; Schneider, K.A.; Deters, R. A hybrid deep learning architecture for leukemic B-lymphoblast classification. In Proceedings of the 2019 International Conference on Information and Communication Technology Convergence (ICTC), Jeju Island, Republic of Korea, 16–18 October 2019; pp. 271–276. [Google Scholar]
- Agaian, S.; Madhukar, M.; Chronopoulos, A.T. A new acute leukaemia-automated classification system. Comput. Methods Biomech. Biomed. Eng. Imaging Vis. 2018, 6, 303–314. [Google Scholar] [CrossRef]
- Umamaheswari, D.; Geetha, S. A framework for efficient recognition and classification of acute lymphoblastic leukemia with a novel customized-KNN classifier. J. Comput. Inf. Technol. 2018, 26, 131–140. [Google Scholar] [CrossRef]
- Ahmed, N.; Yigit, A.; Isik, Z.; Alpkocak, A. Identification of leukemia subtypes from microscopic images using convolutional neural network. Diagnostics 2019, 9, 104. [Google Scholar] [CrossRef]
- Al-jaboriy, S.S.; Sjarif, N.N.A.; Chuprat, S.; Abduallah, W.M. Acute lymphoblastic leukemia segmentation using local pixel information. Pattern Recognit. Lett. 2019, 125, 85–90. [Google Scholar] [CrossRef]
- Li, M.; Li, X.; Jiang, Y.; Zhang, J.; Luo, H.; Yin, S. Explainable multi-instance and multi-task learning for COVID-19 diagnosis and lesion segmentation in CT images. Knowl. Based Syst. 2022, 252, 109278. [Google Scholar] [CrossRef]


Disclaimer/Publisher’s Note: The statements, opinions and data contained in all publications are solely those of the individual author(s) and contributor(s) and not of MDPI and/or the editor(s). MDPI and/or the editor(s) disclaim responsibility for any injury to people or property resulting from any ideas, methods, instructions or products referred to in the content. |
© 2023 by the authors. Licensee MDPI, Basel, Switzerland. This article is an open access article distributed under the terms and conditions of the Creative Commons Attribution (CC BY) license (https://creativecommons.org/licenses/by/4.0/).