1. Introduction
The spread of novel infectious COVID-19 necessitates an appropriate definition of cases, which are important for clinical diagnosis and health care surveillance. Monitoring the number of cases over time is essential for the development of effective therapies and the rate of dissemination. The World Health Organization (WHO) proclaimed the pandemic of coronavirus on 11 March 2020 [
1]. The COVID-19 epidemic has wreaked havoc on the social and economic conditions of nations all over the world. It is one of the worst pandemics the entire planet has ever experienced. This COVID-19 pandemic has had a significant impact on every human’s life [
2].
The COVID-19 pandemic had a significant impact on each nation’s medical and financial position. According to WHO, this pandemic will have an impact on the healthcare systems of about 75% of the world’s nations by 2020. Beginning with a few Asian and European nations, COVID-19 will eventually extend to 220 nations worldwide by the second part of 2020. The most tragic aspect of this virus is that its new COVID-19 form multiplies rapidly and eventually overtakes all other causes of mortality in many nations. By the end of June 2021, this terrible virus will have claimed 3,901,071 lives [
3]. Every nation enforces a rigorous lockdown to protect people’s lives from harm. As of right now, there have been a growing number of COVID-19-positive instances, including examples of people who have just been infected, people who have died, and those who have recovered from the virus.
The way we interact with and communicate with people has undergone constant change in the modern world, which has undergone a total transformation [
4]. Regarding control, reaction, preparation, government upgrades, and media broadcasting, it is difficult to share data advancement concerning the pandemic with the general public [
4,
5]. There are certain unusual situations for the health-related groups as a result of the emergency scenario brought on by COVID-19 [
6]. The technology connected to communication and information has substantially improved in the advanced world in which we live [
7]. Similar to this, COVID-19-related misleading material and critical remarks are widely disseminated online. Public stress and concern are increased, and the health authorities’ information is tainted [
8].
Lockdown encourages users to read and post about COVID-19 experiences on various social media websites. People spent the majority of their time on social media sites because there was so much information available, both true and fraudulent [
4]. On social media, people discuss the COVID-19 epidemic, its treatment, and the responses of various nations to this worldwide pandemic. The majority of COVID-19 data are produced on a minute-by-minute basis. There is currently no promising method for analyzing and categorizing the thoughts expressed in text tweets concerning COVID-19. Positive to negative attitudes were found in the sentiment analysis of COVID-19 tweets [
9]. An urgent global problem is the increase of false information spread via social media platforms. The public is really upset as a result of these statements.
Online data about the COVID-19 pandemic have significantly increased, yet erroneous and unfavorable information is changing people’s perspectives. Such false information has the potential to skew the messages that the government and authority deliver [
10]. Authorities need to validate original and authentic information since false information might scare COVID patients and other individuals and cause panic [
11]. Researchers have studied the public’s perception of social media news stories about a coronavirus-caused pandemic in the literature [
12,
13,
14]. Twitter is a social networking and microblogging site where users may post messages called “tweets”.
Twitter has received over 500 million tweets and 200 billion tweets annually, making it a substantial data communication medium used by the general population worldwide [
15]. Sadly, because rumors and unfavorable facts are being circulated, it is also the major cause of creating a panic scenario. Although a significant portion of COVID-19 tweets express good feelings, Chakraborty et al. highlighted that users are mostly focused on amplifying the negative tweets that contain offensive terms in the word frequency of tweets [
16].
Researchers said that the COVID-19 pandemic condition caused stories and conspiracies to spread quickly, just like the virus did, and that this caused a profound change in the world [
17].
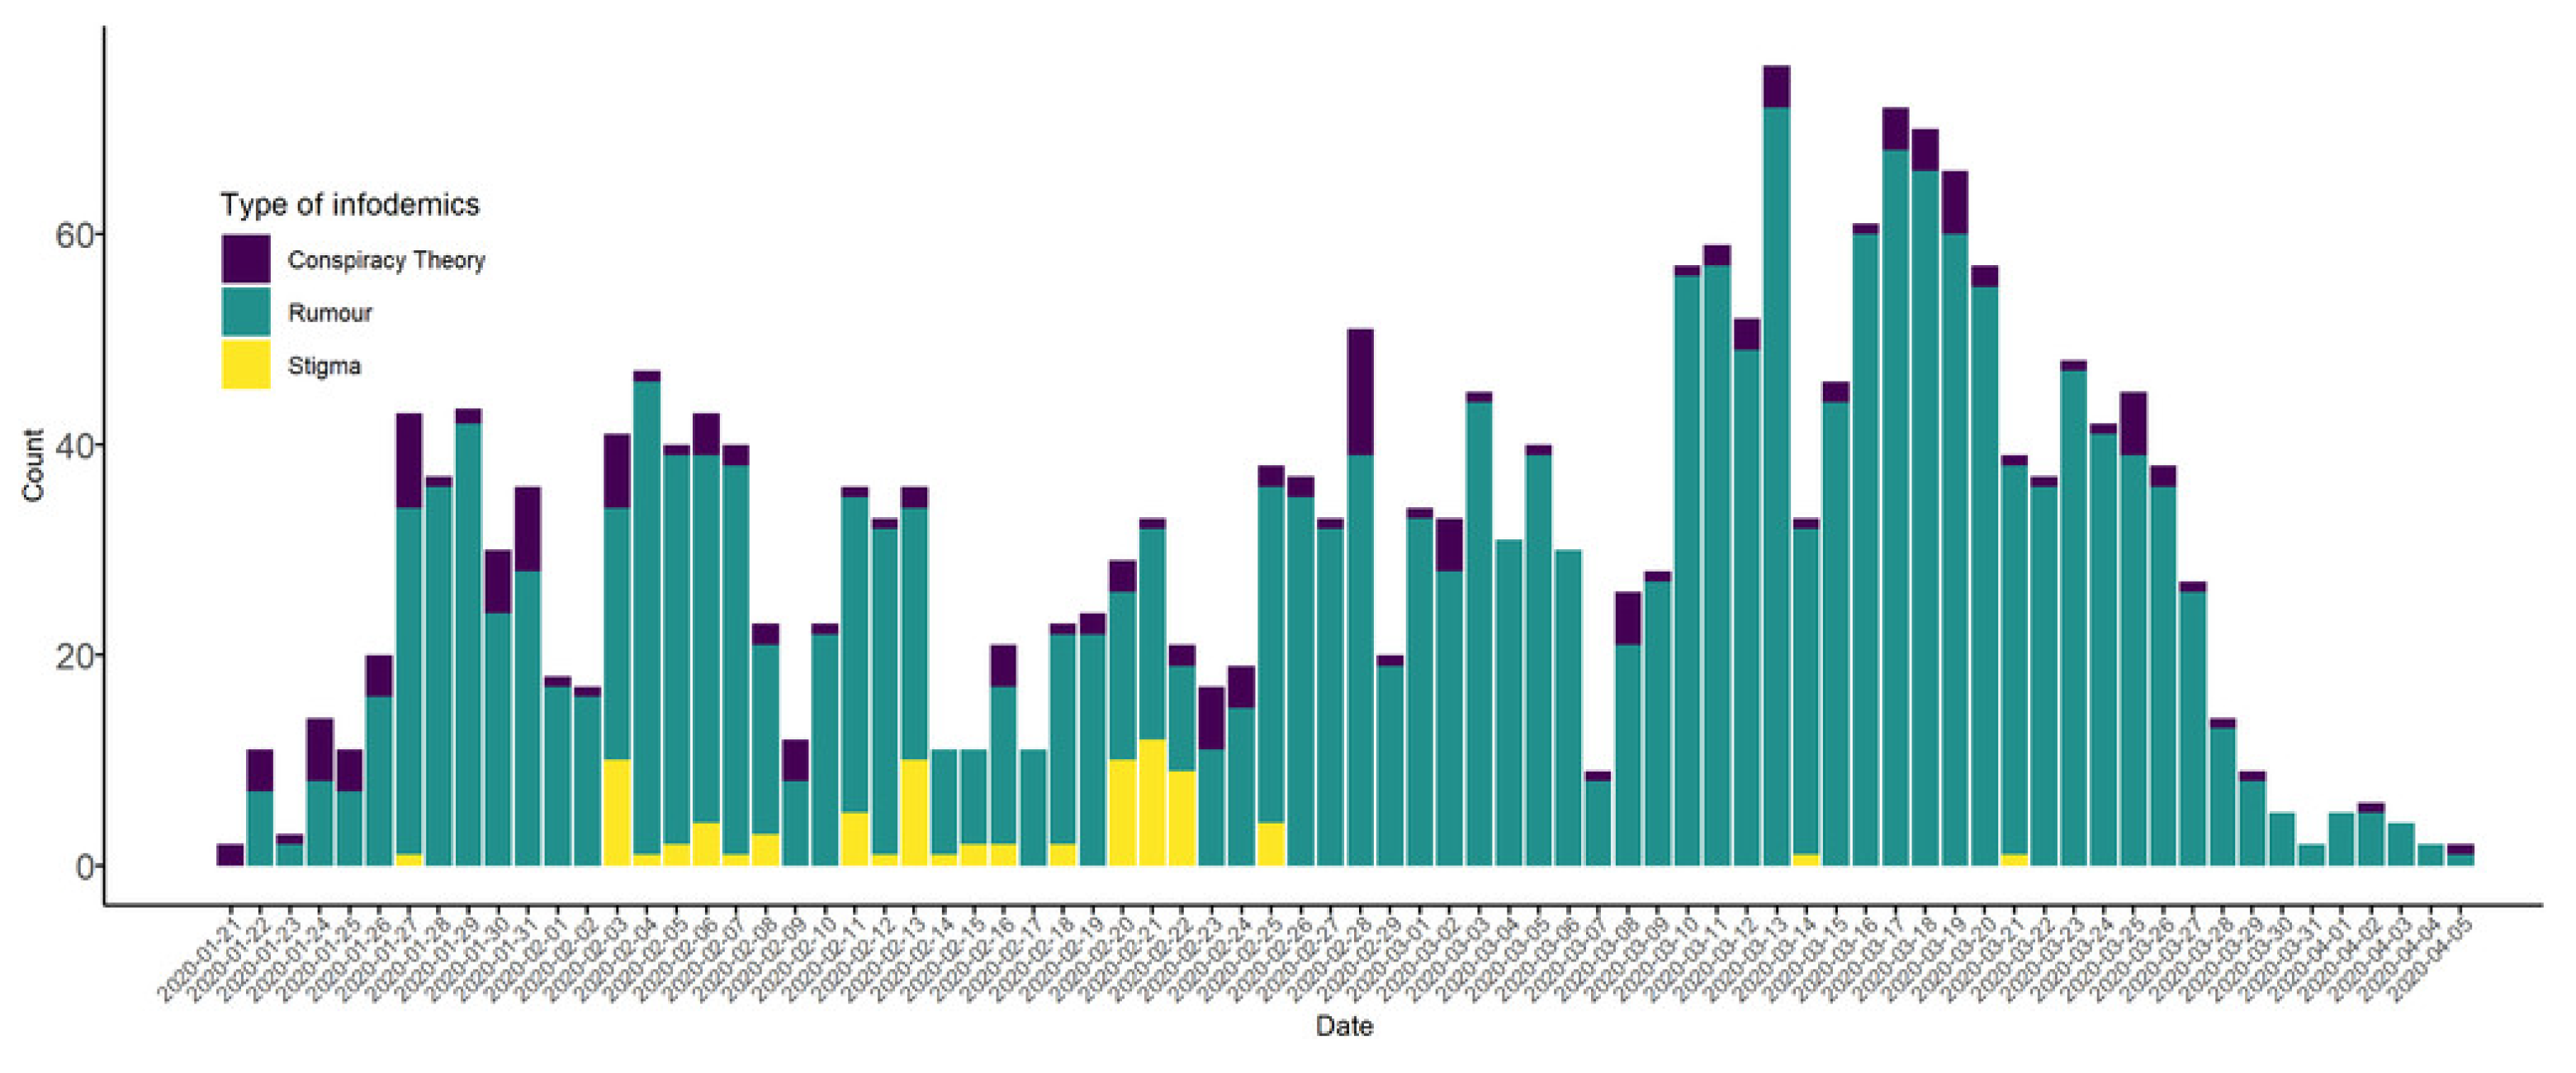
Figure 1 depicts the spread of COVID-19-related rumors, stigma, and conspiracy theories that were discovered in 2020, according to the American Journal of Tropical Medicine and Hygiene [
18]. The researchers provided computer models for recognizing this bogus messaging. Additionally, they looked at how misinformation regarding COVID-19’s political implications influenced public health [
19].
Huynh 2020 stated that there are several false reports and speculations concerning COVID-19 circulating on social media sites, making it exceedingly challenging to separate fact from fiction [
20]. The public, the government, and healthcare practitioners can avoid needless anxiety if such bad material on social networking sites is authenticated and accurate. These techniques offer accurate information in every scenario involving routine events and are simple to include in conspiracy theories. For these reasons, we used machine learning models to assess textual tweets, filling the research vacuum. We also used the comparison to validate the performance of the models.
How did social media tweets impact people’s mental health? How do machine learning models help in analyzing public moods and emotions? A dataset comprising the opinions of the general population is necessary to respond to these queries. The significant features that could aid in the precise classification of COVID tweets into positive, negative, and neutral classes are extracted in this study using a tweet-based dataset, various feature engineering techniques individually, feature fusion with multiple textual pre-processing techniques, and diverse feature engineering techniques.
The impact of various classifiers, including the random forest Classifier (RF), extra tree classifier (ETC), gradient boosting machine (GBM), logistic regression (LR), Naive Bayes (NB), stochastic gradient descent classifier (SGD), multi layer perceptron (MLP), Recurrent neural network (RNN), Long short term memory (LSTM), convolutional neural network (CNN), and two voting classifiers, will also be examined in this study. Among voting classifiers, one combines SGD and LR and is known as VC(LR+SGD), while the other combines ETC and CNN and is known as VC(ETC+CNN). Analysis has also been conducted on other feature engineering approaches including term frequency (TF), term frequency-inverse document frequency (TF-IDF), feature fusion of both feature-generating methods (TF + TF-IDF), and Word2vec. The accuracy, precision, recall, and F1-score of the classifiers have all been assessed.
The remaining part of the paper is divided into the following sections: The relevant research is outlined in
Section 2 along with a description of their approach. The description of the dataset, the preparation procedures, the specifics of the suggested methodologies, and some background information on the state-of-the-art models that we have utilized are included in
Section 3. Results and discussion are given in
Section 4. The study concluded in
Section 5 with a review of the findings from our research and recommendations for the future.
2. Related Work
Natural Language Processing (NLP) is essential to the advancement of people. Almost every aspect of life makes considerable use of AI-based sentiment analysis algorithms. Many sentiment analyses have been conducted during the COVID-19 pandemic to learn more about this infectious illness. This part will provide emotive and textual analysis of tweets relating to COVID-19, as well as machine learning models, natural language processing, and Twitter. To manage Twitter data effectively, there are a few major problems. Textual analytics deals with character analysis and evocation, text visualization, semantics, and grammatical issues, as well as the endogenous and exogenous elements of these tools. Sarcasm and irony recognition [
21], sentiment and opinion mining [
22], false news detection [
23], medical-related text mining and many more applications have made substantial use of text analysis.
Emotion analysis using Twitter data is common practice. For gathering, health-related feedback Twitter maintains the top position. Sentiment analysis of 24,000 tweets on COVID-19 was conducted in India [
24]. The psychological impact of COVID-19 on human behavior was analyzed in another study [
25]. Due to the COVID-19 news, it appears that the individuals are in a particularly difficult condition and have a significant degree of despair. Information with short text and lengthy text has been classified using a variety of methods. NB and LR perform poorly on the long text, yielding average scores on the short text of 91% and 74%, respectively [
26]. The 4 million COVID-19 tweets from the time frame of 1 March 2020, to 21 April 2020 were examined by Xue et al. [
27] using 25 distinct hashtags. Five courses were created utilizing the 13 subjects that were determined. The identification of uni-grams, bi-grams, themes, silent subjects, and feelings in tweets is conducted using LDA (Latent Dirichlet Allocation). When addressing health-related concerns, accuracy and outcomes are crucial. Another research study used 2500 short text adverts and 2500 lengthy text messages to identify mood [
28]. Depression is the more prevalent feeling. Long-term residence at home, COVID-19 testing results, and unemployment are the key contributors to depression [
29]. A model known as Bidirectional Encoder Representations for Transformers (BERT) was developed to investigate emotions. BERT is capable of assigning both single and multiple labels [
30]. The model’s key selling point is that it can take into account emoticons, which are useful tools for expressing emotions. Pattern-based sentiment analysis using the FP-growth method was developed by Drias et al. [
31].
For a certain amount of time, Chakraborty et al. [
16] focused on the sentiment analysis of COVID-19 tweets. The fact that they included re-tweets in their analysis is a plus for it. In their research, there are two intervals. The majority of tweets in the first period are negative or neutral, whereas those in the second interval are positive or neutral. The classifier built using deep learning obtained an accuracy of 81%. Support Vector Machine (SVM) is one of the supervised machine learning techniques that Balahur et al. [
32] used to analyze the Twitter dataset (SVM). Their methods’ performance on Twitter data conclusively demonstrates that the uni-gram and bi-gram method produces superior outcomes than the SVM. Modifiers, tags, and emotional words are included in the findings, which can improve how well the movements are doing. Leskovec et al. [
33] presented a network for social media analysis, modeling, and optimization. Their study included a brief explanation of the methods for gathering data from social media sites, analyzing that data, and drawing conclusions from that analysis. They also keep an eye on the way emotions move across the network, and they analyze how polarization is developing in that process to evaluate the tweets’ emotional content.
To examine the sentiment, authors [
34] used the Malayalam Twitter dataset and several machine learning methods. The classification of the tweets into positive and negative classes using a variety of machine learning algorithms, including NB, SVM, and RF. Working on the sentiment analysis for Twitter were Imamah and Rachman [
35]. They view the tweets as being directly about COVID-19. The COVID-19 tweets dataset, which was compiled on 30 April 2020, was the source of the data for this study. The word weighting Term Frequency-Inverse Document Frequency (TF-IDF) and Logistic Regression (LR) techniques were used to categorize the 355,384 tweets that were composed and connected to COVID-19. Their maximum level of accuracy was 94.71%. Those responsible for the COVID-19-related tweets were Shahsavari et al. [
17]. The primary goal of their study is to identify false propaganda news in tweets about COVID-19. Therefore, their study is the finest resource to deal with false information on COVID-19.
As false information on COVID-19 might quickly harm public health, Chintalapudi et al. [
36] worked on the sentiment analysis of COVID-19 tweets. They used a variety of deep learning and machine learning models in their investigation. They used the BERT (bi-directional encoder representation from the transformer) model to analyze the data in their investigation. BERT is a deep learning model for text analysis, and its performance is compared with other models. They have employed supervised machine learning algorithms such as SVM, LR, and LSTM for comparison. The accuracy of the BERT is 89%, compared to the accuracy of the SVM, LR, and LSTM, which is 74.75%, 75%, and 65%, respectively.
To gather, store, organize, and analyze Twitter and Twitter user data, Carvalho et al. [
37] presented an effective system called MISNIS (intelligent mining of public social networks influence on society). With the help of this technology, a non-technical user may rapidly mine the data and readily record tweets in Portuguese that are in the flow. The COVID-19 public sentiment insights for the categorization of tweets were developed by Samuel et al. [
26]. They use tweets to gradually reveal information about equity among the community members in the US throughout the COVID-19 epidemic.
On these lengthy tweets, neither model does well. Government policies about the COVID-19 conversation on Twitter were developed by Lopez et al. [
38]. In this research, multilingual Twitter data from many groups and nations are studied to determine the widely-accepted course of action in the epidemic. Kaila et al. [
39] worked on the subject of modeling for COVID-19. Out of the 18,000 tweets about COVID-19, they choose a random selection. They also compute the emotions using the NRC sentiment lexicon. Han et al. [
40]’s subsequent study focused on Chinese citizens’ opinions on COVID-19. They categorize the tweets about COVID-19 into 7 themes. Thirteen subtopics are further broken down into these seven main topics. Depoux et al. [
10]’s study on the COVID-19 postings that generate fear among individuals was successful since their panic-instigating post propagated more quickly than other comparable posts. This type of message, which can make people frightened, has a long-lasting impact on the neighborhood. To quickly address the panic, they designed a system that could recognize these rumors, attitudes, and public behavior.
Naseem et al. [
41] worked on the benchmark dataset of tweets connected to COVID-19. They made use of information from 90,000 tweets about COVID-19 during February and March 2020. These tweets are divided into three categories: neutral, negative, and positive. This work uses a variety of machine learning models for classification, including SVM, RF, NB, and DT. Word2vec is employed to create the baseline for machine learning classifier feature extraction techniques such as TF-IDF. In their efforts, several deep learning models are also utilized. The BERT and its variation outperform more established techniques such as TF-IDF and word embedding, according to the results.
Table 1 summarized the existing studies.
3. Methods and Techniques
The experiment’s methodologies and procedures are discussed in this section. In addition, the dataset description, preparation procedures, classifiers, and performance assessment matrices utilized in the trials are covered in depth.
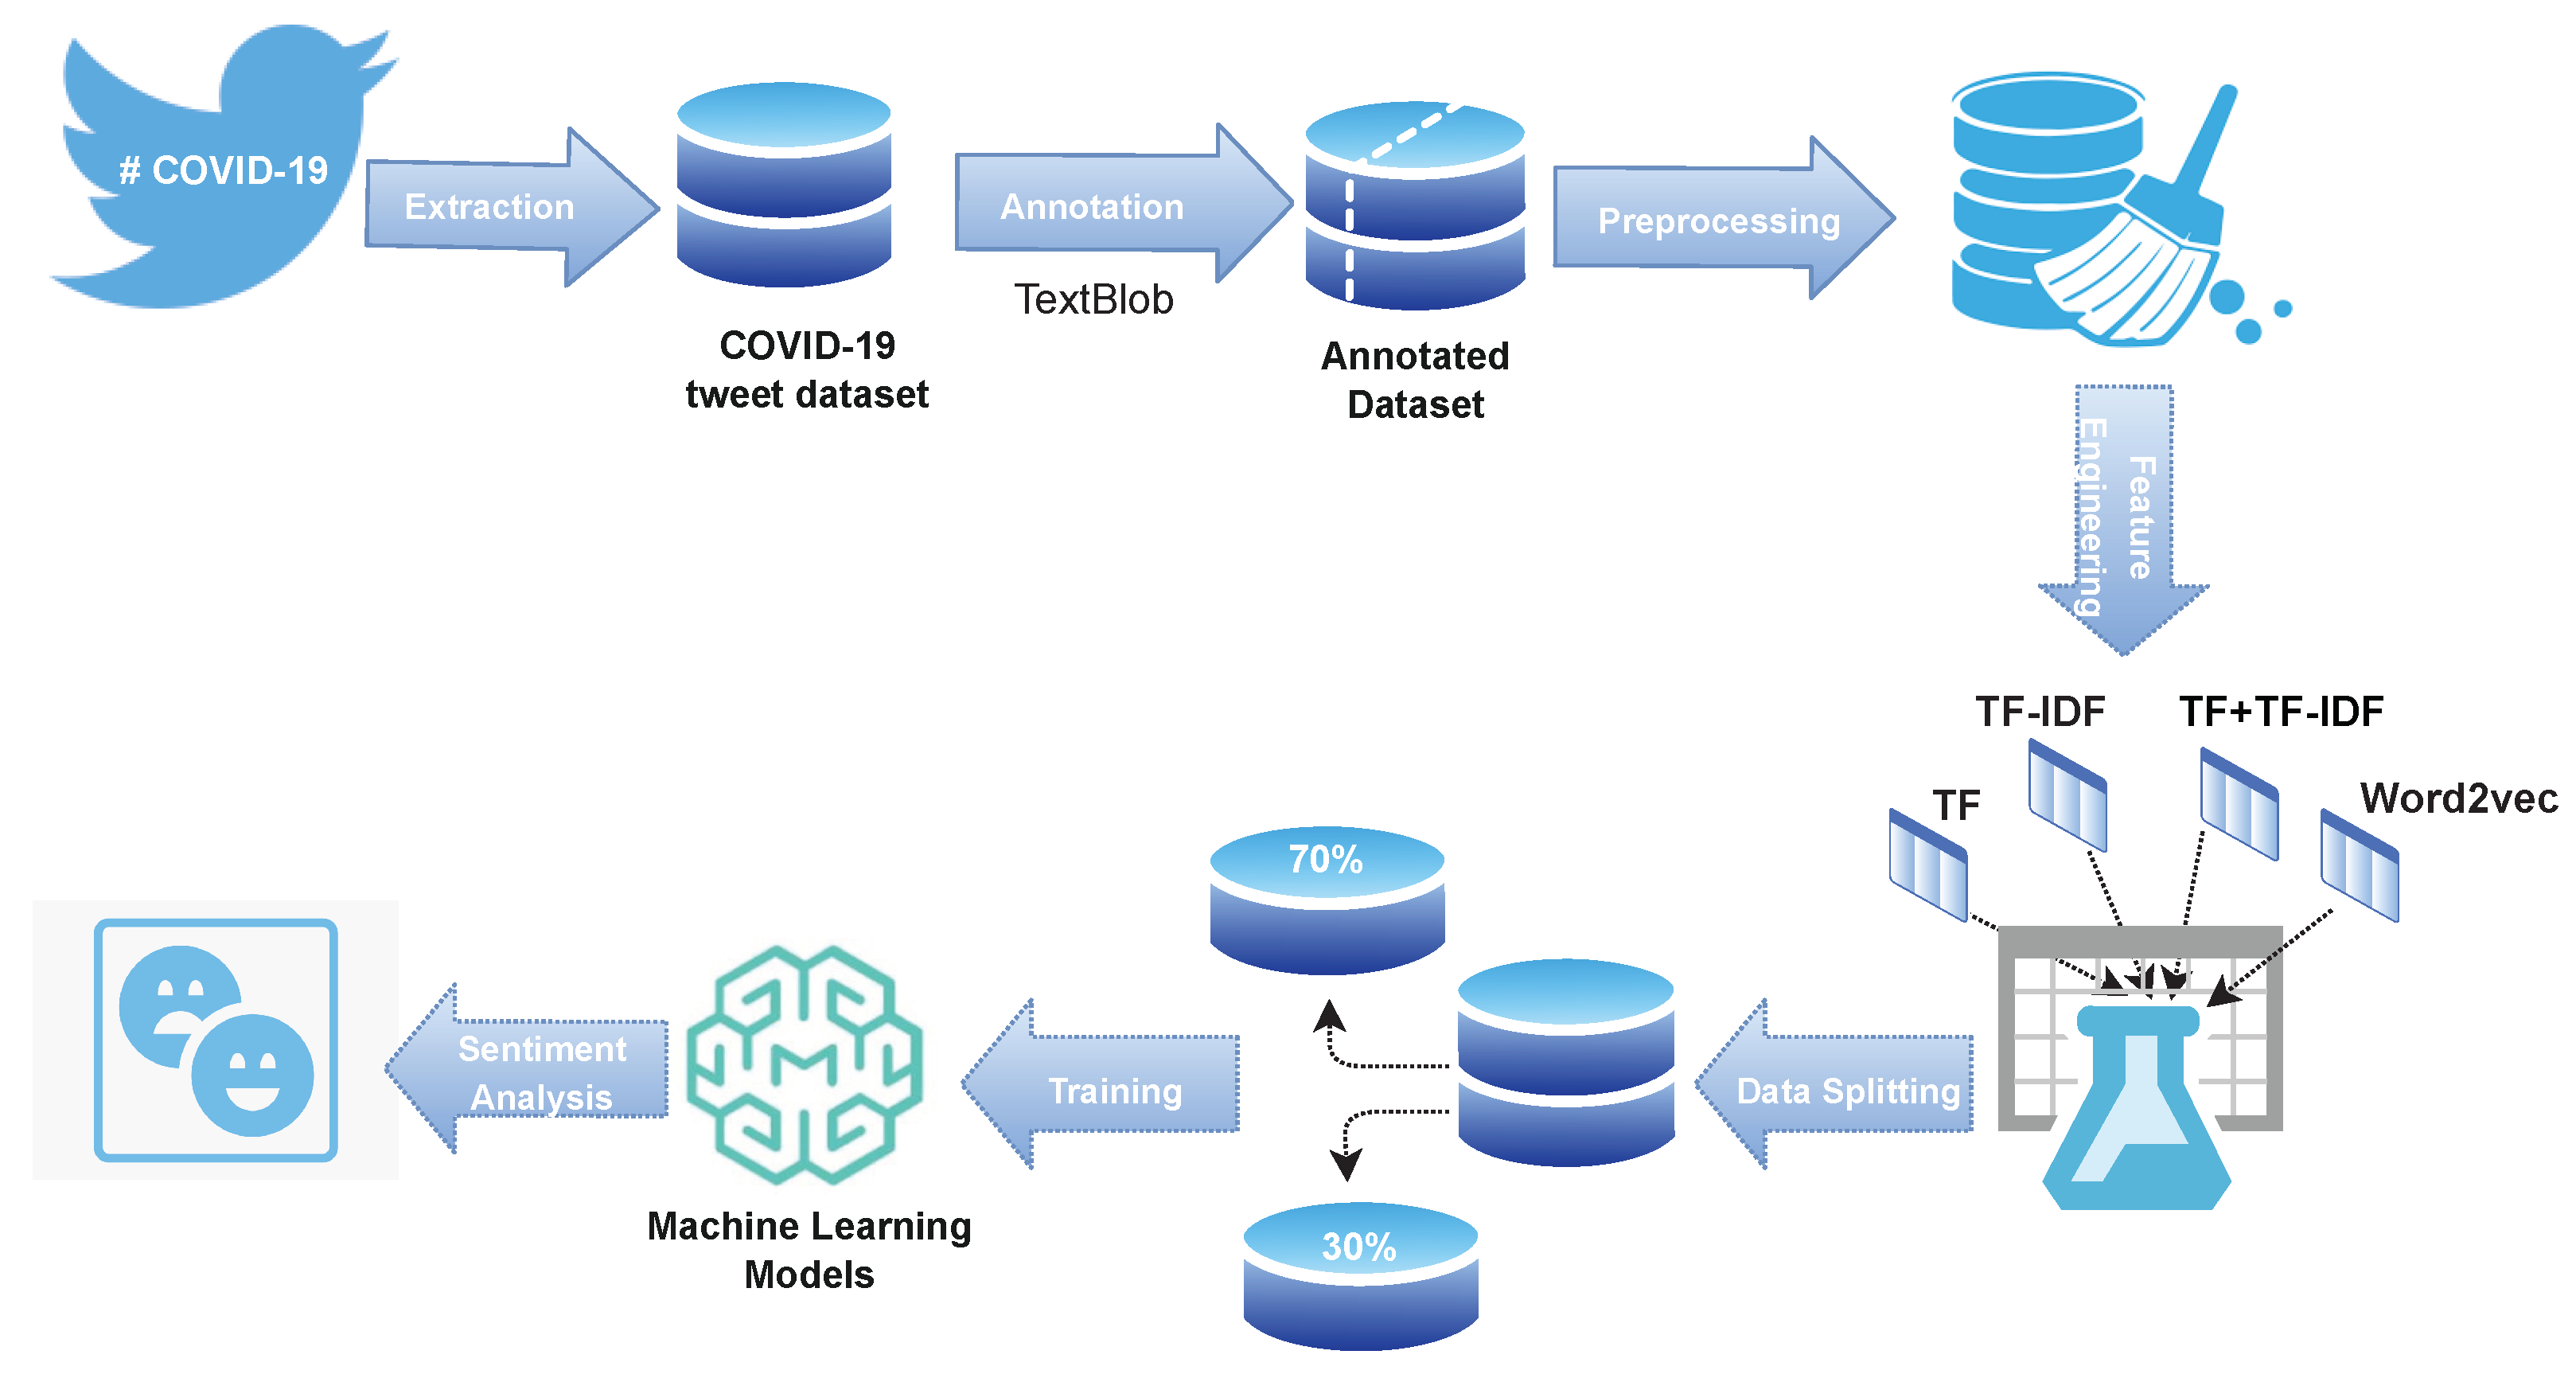
3.1. Overview of the Proposed Methodology
This study aims to provide an answer to the subject of how the COVID-19 epidemic has affected people’s feelings and attitudes. A dataset including opinions about COVID-19 from the general public is needed to respond to this topic. As a result, the machine learning models used in this study’s sentiment analysis of tweets connected to COVID-19. The COVID-19 tweets dataset from the IEEE data repository was used in the current study to carry out the sentiment analysis job. Then, to reduce the dataset’s sparsity and identify important characteristics, several methods based on thorough preparation are applied. This research project will examine the impact of several feature engineering strategies (TF, TF-IDF, TF + TF-IDF, and Word2vec) both separately and in feature fusion during the training phase of learning algorithms. Using supervised machine learning models, the outcomes of each feature creation strategy are produced. In this work, classifiers such as RF, GBM, ETC, NB, LR, SGD, MLP, RNN, LSTM, CNN, VC(LR+SGD), and VC(ETC+CNN) were utilized. The dataset’s training-to-testing ratio is 70% training to 30% testing. Accuracy, precision, recall, and F1-score are the experiment assessment criteria that will provide you with all the information you need about the experiment.
Figure 2 displays the proposed model’s whole design.
3.2. Dataset Description
The COVID-19-related Twitter dataset [
42] was downloaded from the IEEE DataPort website. Tweet id and sentiment score of tweets make up this information. To ensure that the content in a tweet is discussing a COVID-19-related scenario, a variety of hashtags and keywords are employed in the tweet derivation process. To access complete tweet-related data, the IEEE platform’s Tweet ID is hydrated. The collection has 11,858 records in total. Keywords that are used to acquire data are
,
COVID-19,
,
,
, and
, etc. The dataset description is shown in
Table 2.
3.3. Annotating Tweets
TextBlob [
43] is used to identify each instance of a tweet in terms of whether it is favorable or bad. Calculating scores between −1 and 1 may determine phrase polarity. When the score is less than 0, sentiment is classified as negative. Positive emotion is indicated if the sentiment score is greater than 0:
where
is the
ith tweet and
is the polarity score of
.
TextBlob is a Python library and is used in text processing. To perform natural language processing tasks such as sentiment analysis, noun-phrase extraction, translation, and classification, it provides an API.
3.4. Data Preprocessing
Data items such as individuals, samples, observations, events, instances, vectors, points, patterns, or records are all gathered together in a dataset. These data objects are the number of features or attributes that match the fundamental properties of the data items. These traits or properties are sometimes referred to as data dimensions or dataset characteristics [
44]. The majority of datasets come from numerous sources with data in various forms, as well as some raw information that is useless for machine learning models. For the machine learning models to extract usable information from the data, the quality of the raw data must be improved through data preparation. Data preprocessing in machine learning is the structuring and purging of the dataset from the stuff that is unimportant to the study. To make the raw data acceptable for the training of machine learning models, it must be transformed into something intelligible and useful. The dataset used in the current study was taken from the IEEE data port and is semi-structured/unstructured and contains a lot of extraneous data. The prediction technique does not significantly rely on unnecessary data.
Text preparation is needed to get over this restriction since big datasets increase training time and “stop words” decrease prediction accuracy. Stemming, changing all capital letters to lowercase, adding punctuation, and removing words that do not add more significance to the text are just a few of the pre-processing duties.
3.5. Graphical Representation of Data
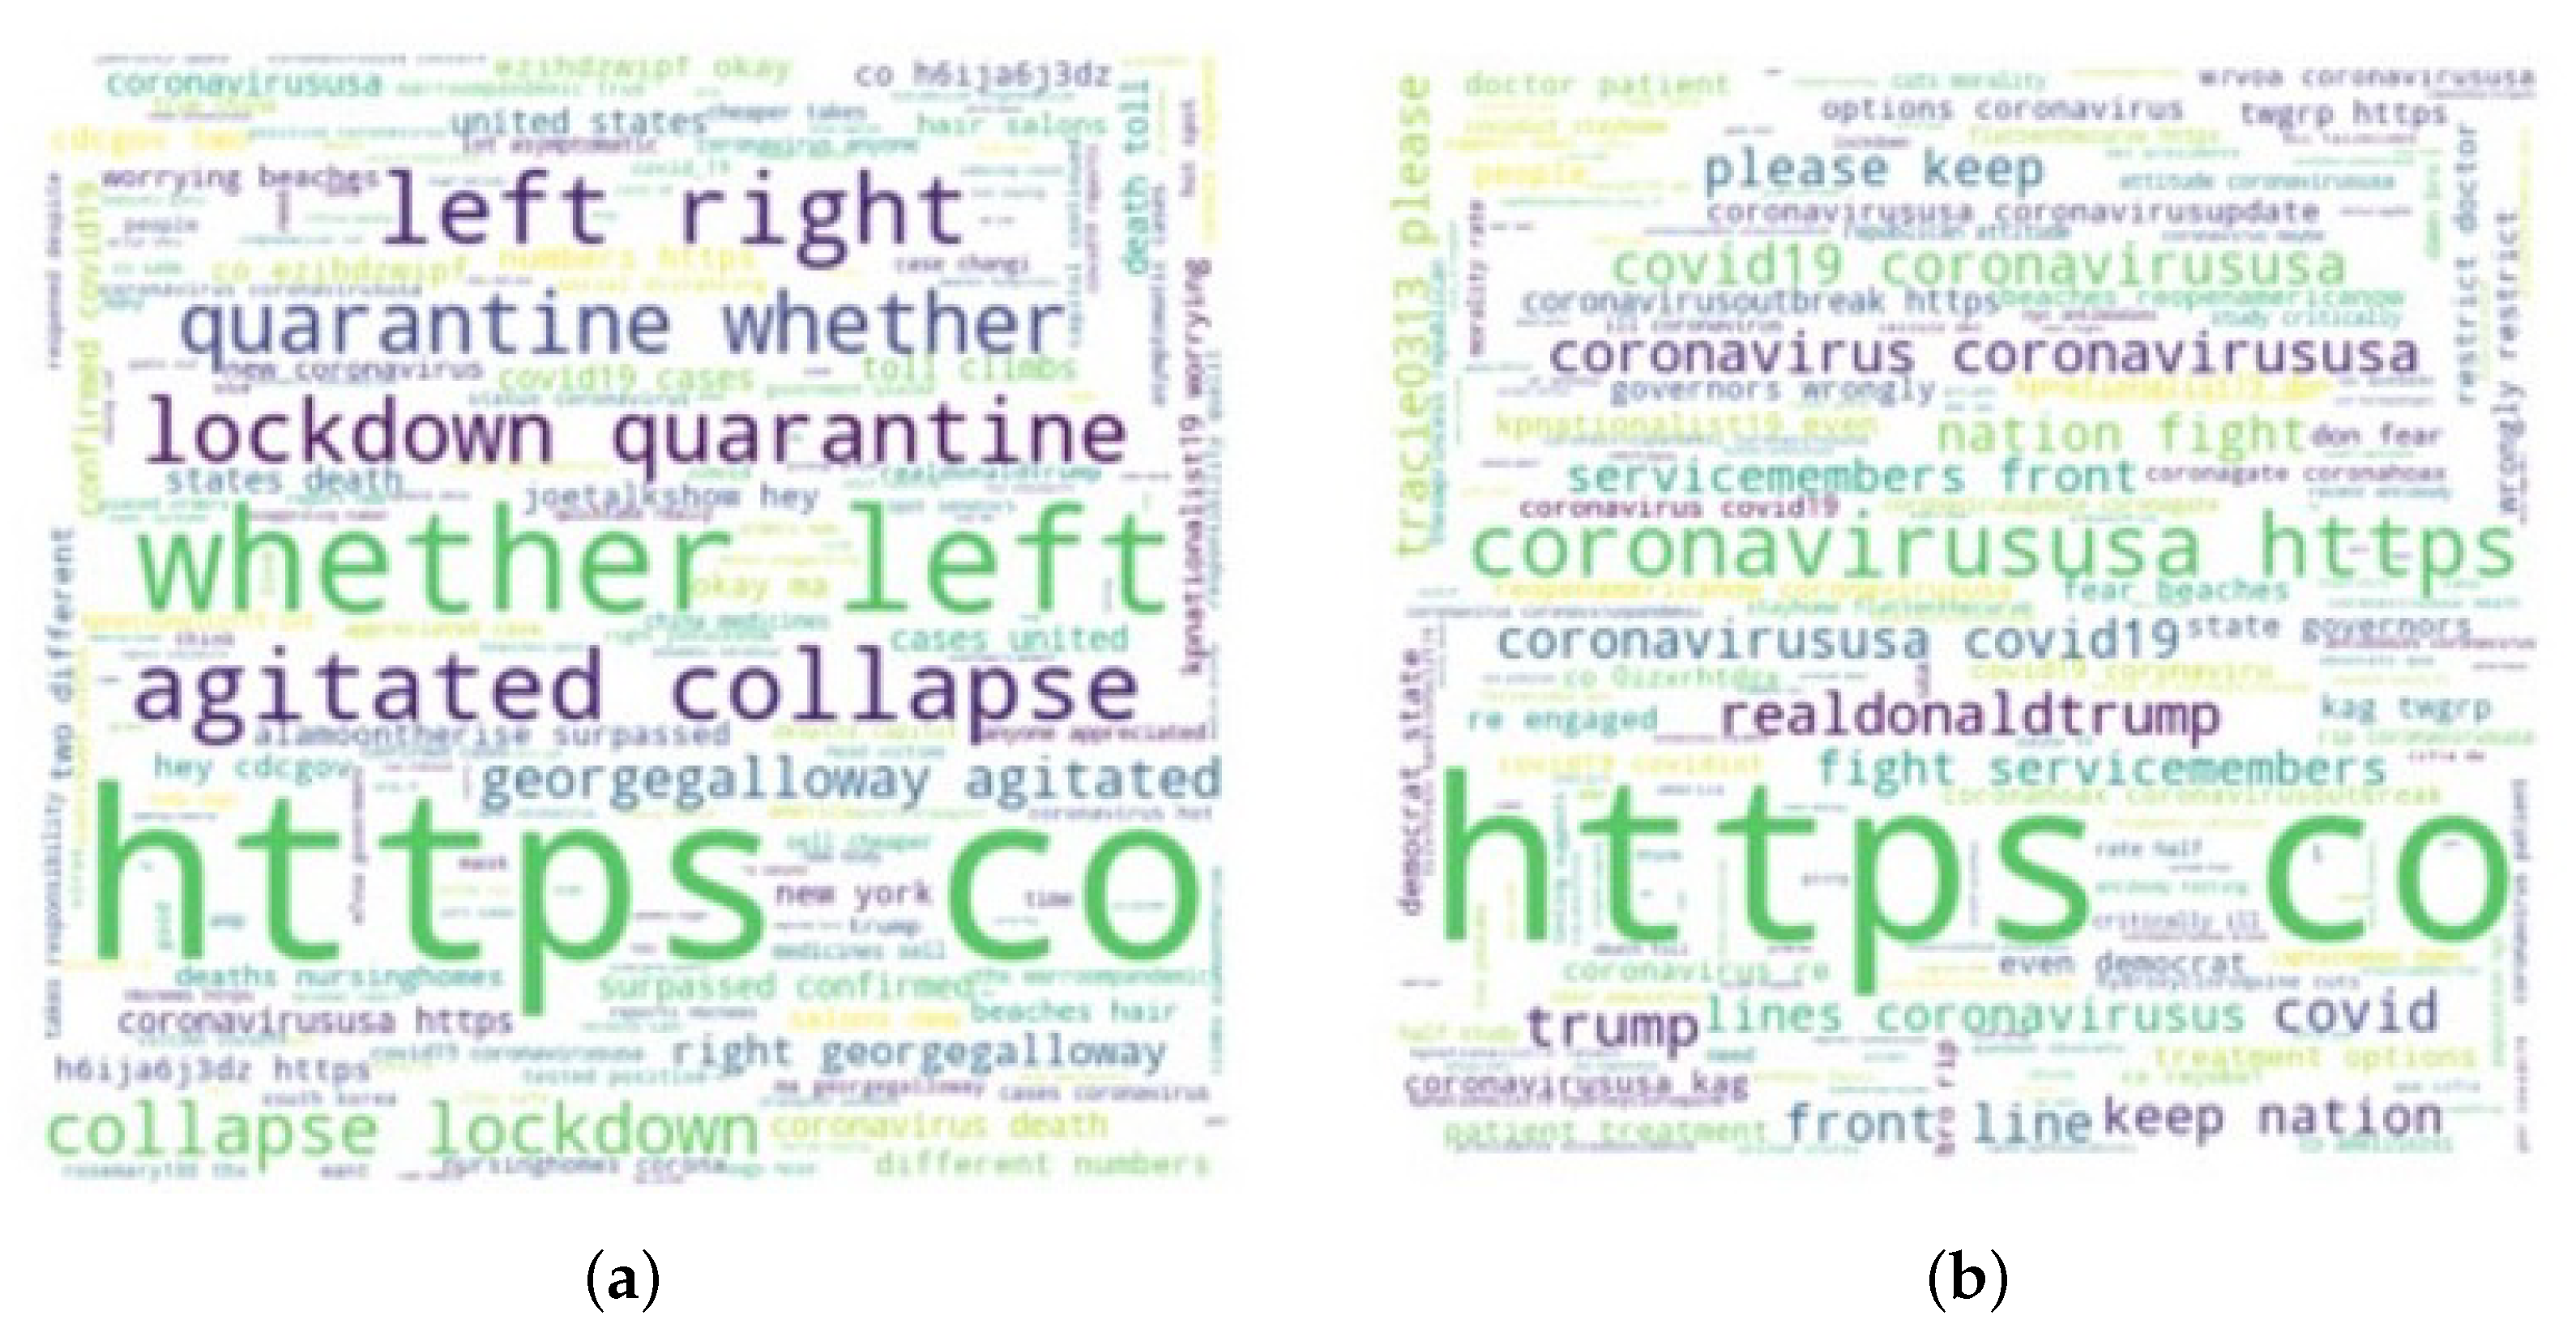
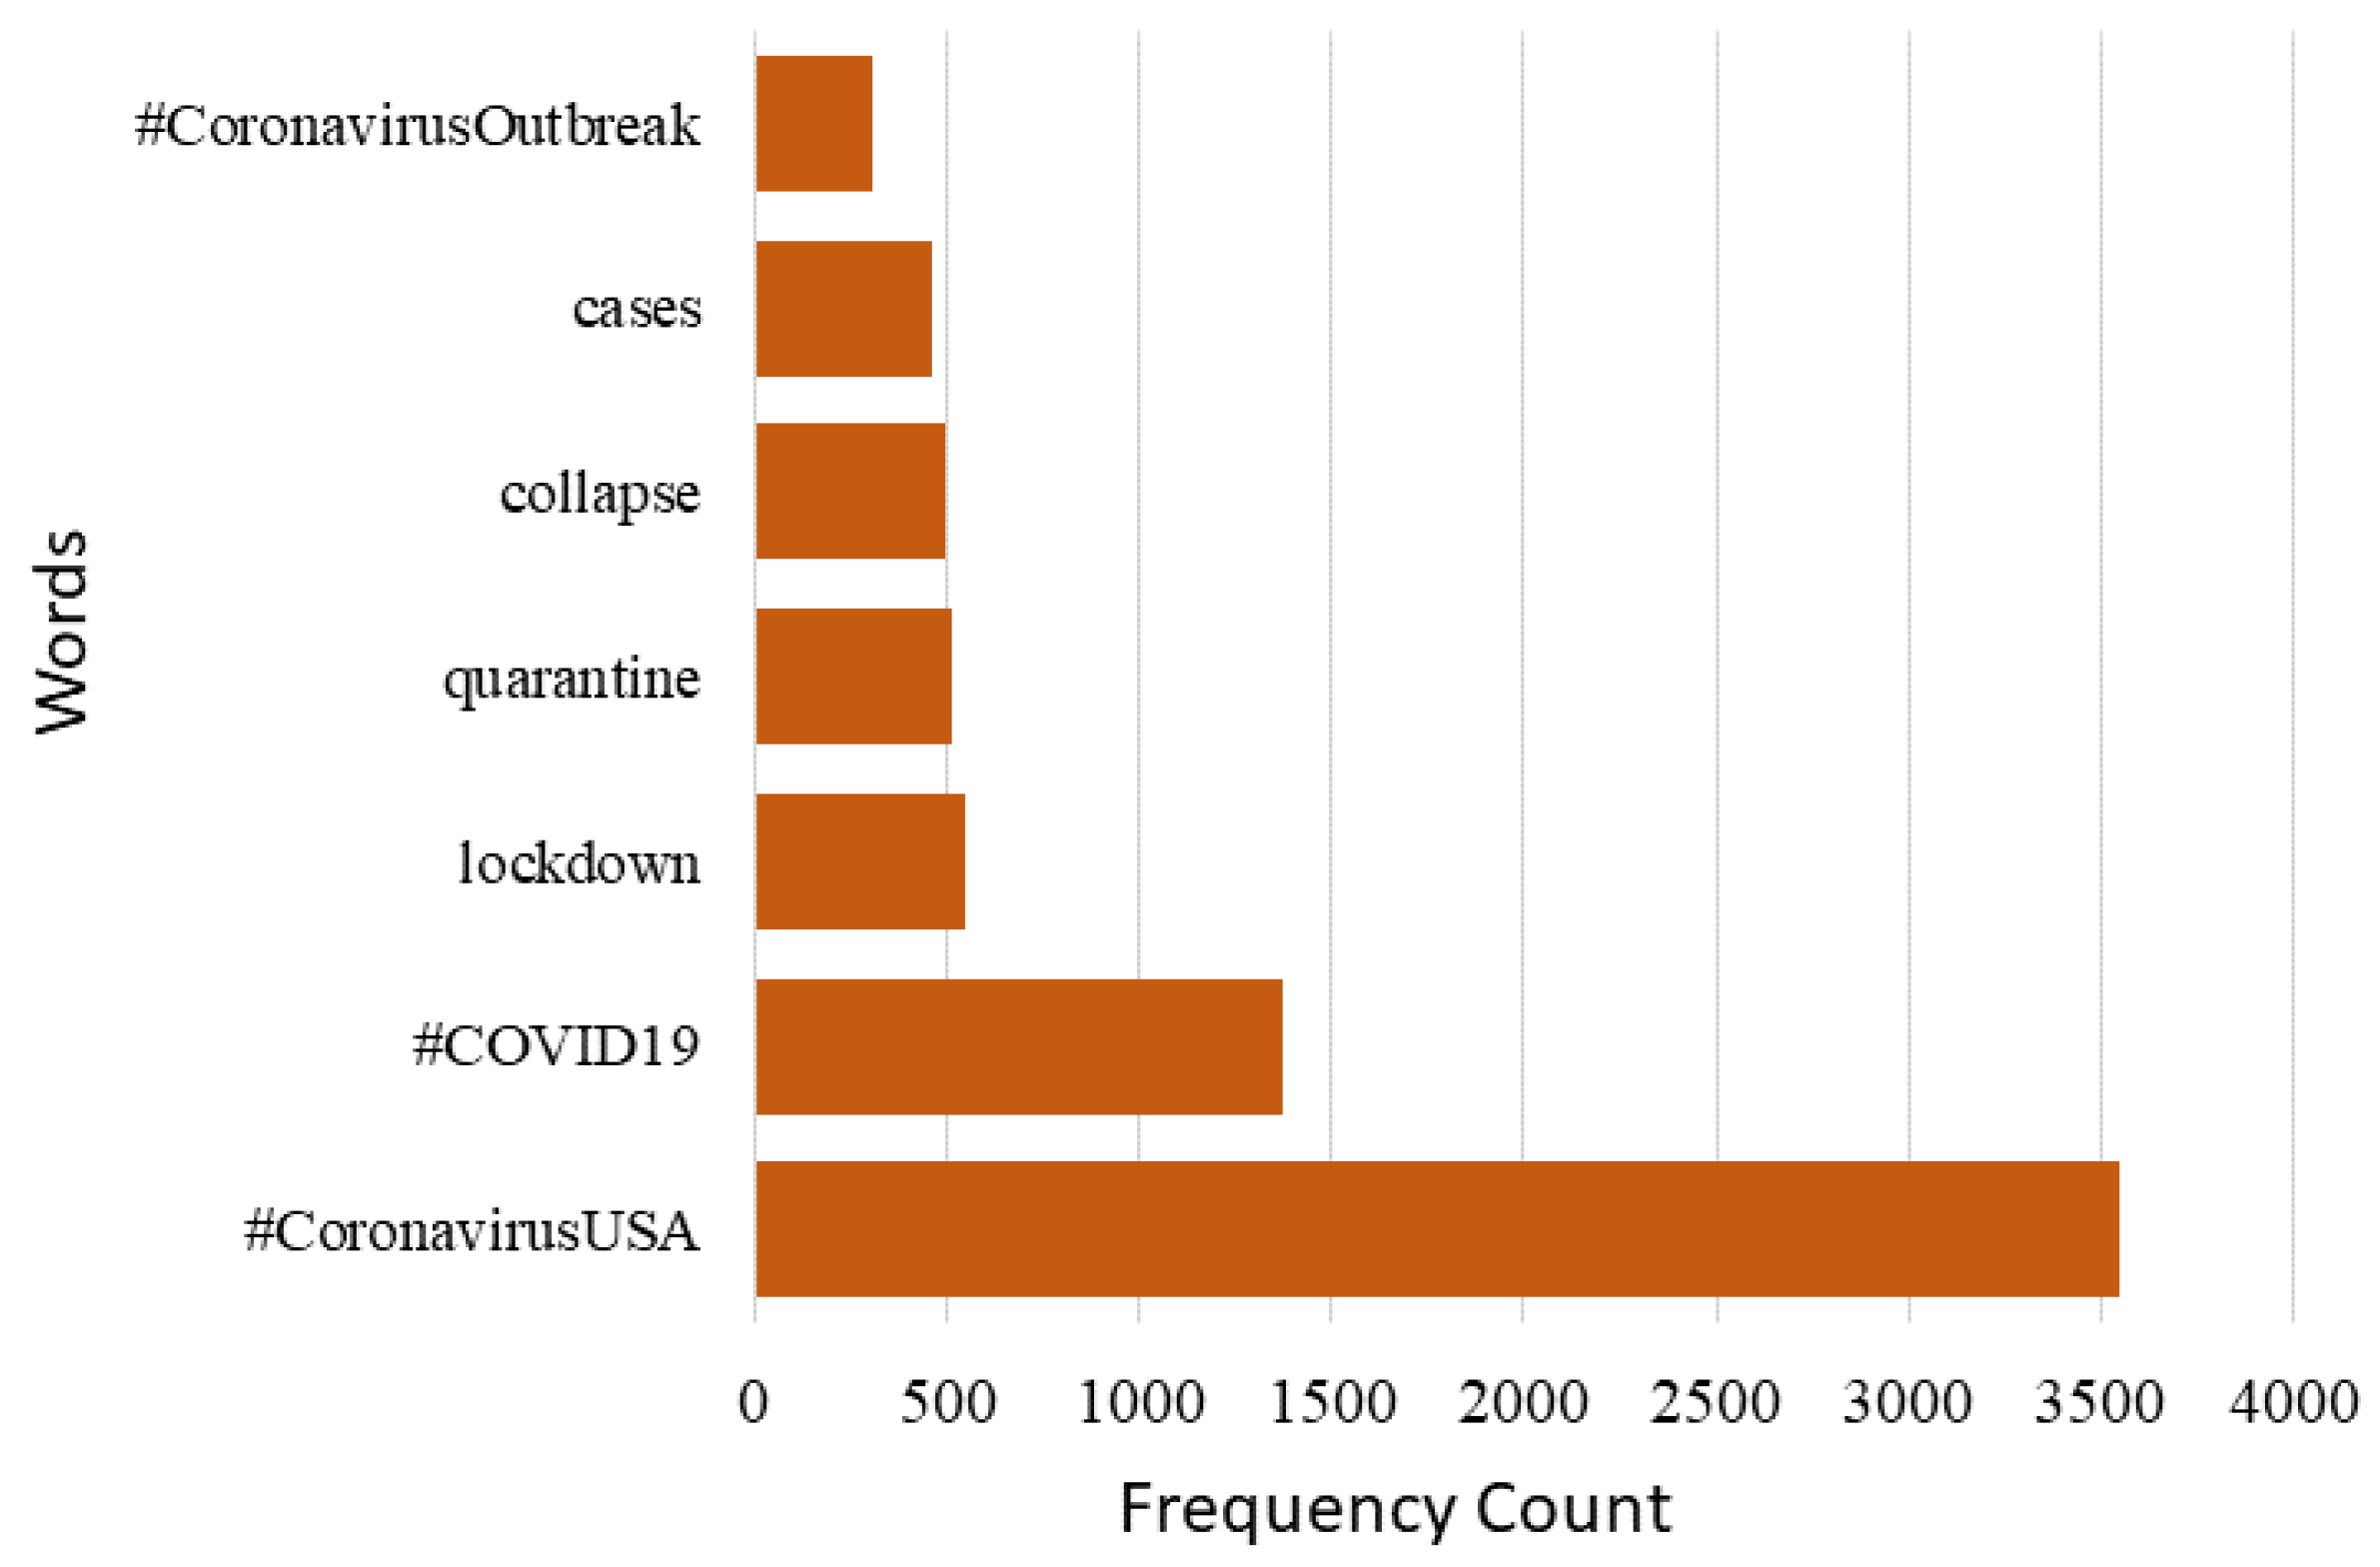
We exhibit it visually so that you may see tweets about the COVID-19 dataset in greater depth. We begin by listing the most frequently used phrases from the tweet sentiment collection. The most often used phrases in the conversation are “coronavirus” and “COVID-19”. These words provide information on the keywords and subjects that were discussed the most on internet forums during the COVID-19 epidemic period. The paragraph that received the greatest attention in tweets about COVID-19 is seen in
Figure 3. The word clouds of the most common positive and negative phrases in each tweet are shown in
Figure 4.
3.6. Feature Extraction Techniques
For training, supervised machine learning techniques require vector representations of the textual input. The textual information must be converted into numbers for this purpose without losing any of the original information. Several methods, such as Bag-Of-Words (BOW), which assigns a vector value to each word, can be used to convert the data. The BOW approach does, however, have certain limits because tweets may only contain a few characters, which decreases their effectiveness. The accuracy of the BOW-based technique is limited by the lack of adequate word occurrences in textual comments or tweets [
45]. Therefore, we utilize TF to handle the transition [
46]. It turns a group of text documents into a matrix of integers, where each number represents the sum of all occurrences of each word in the document, and so counts the frequency of words in the document. In our suggested strategy, we also employed TF, TF/IDF, and their fusion for the feature representation [
47]. TF-IDF reduces the weight of words that are often used in almost all texts and increases the weight of terms that are used in a smaller sample of documents. It penalizes some frequent terms by giving them lower weights while elevating some uncommon words in a given manuscript.
3.7. Data Splitting
Data splitting is the process of dividing the input dataset into two portions, mostly for the proposed models’ assessment needs. The training and test sets are these two components. A predictive machine learning model is trained and developed using the training set, whilst the model is evaluated using the test set. The test set’s size is kept small, while the training set’s size is kept huge. We divided the dataset for the current investigation 70:30 into training and testing, accordingly.
3.8. Classifiers
To categorize tweets addressing COVID-19, this study makes use of a variety of machine learning models, including ensemble learning classifiers, regression-based models, and probability-based models. We assess the effectiveness of several deep learning and machine learning classifiers, which we briefly describe. These models are implemented in Python using
Scikit learn [
48,
49]. Several machine learning approaches are combined into one predictive model using ensemble learning methods, which reduce variance (bagging), and bias (boosting), and enhance predictions (stacking) [
50]. In this work, the usage of ensemble learning-based models for tweet sentiment analysis about COVID-19 is taken into consideration. The following machine-learning models were used in this study:
3.8.1. Random Forest
RF [
51] is one of the meta estimators that combines the data from many decision trees to increase framework effectiveness and over-fitting. It operates by fitting decision tree classifiers on a variety of input data samples. It then takes the average of each decision tree classifier’s output, acting as an ensemble learner. It works by creating a huge number of decision trees, each of which provides the output class for classification or predicts the mean for regression at its nodes. RF is a classification technique that works with data by building several decision trees. Because of its simplicity and variety, RF is one of the most popular machine learning algorithms; it delivers suitable results even without modifying hyperparameters.
3.8.2. Gradient Boosting Machine
GBM [
52] is an ensemble model that integrates a loss function to optimally create an additive model. It operates iteratively, employing the loss function to optimize the error rate at each iteration. To reduce the prediction error, the gradient boosting algorithm’s goal is to describe the results of the target variable for the following model. In that situation, the result of the target variable is dependent on a significant change in prediction, which also affects the total error. It provides a high score when the error rate for the following target prediction decreases significantly. Consequently, when the predictions of the following prediction model are more closely related to the target variable, the prediction error is reduced.
3.8.3. Extra Tree Classifier
In terms of working and tree, ETC [
53] is comparable to the random forest model and a tree-based model. In contrast to the random forest, it constructs trees from the actual data sample without utilizing bootstrap data, earning the additional name of a very randomized tree. From randomly chosen data, the root node of the trees is chosen using the Gini index. It was suggested to create trees while taking into account the fact that numerical input was used and choosing the best cut-point to prevent variation at each node and lessen the computational load. In issues with many dimensions and complexity, this model has produced reliable solutions. It generates multi-linear piecewise approximations as opposed to random forest’s constant ones.
3.8.4. Logistic Regression
LR [
54] is used for classification problems and operates on a probability-based model. The logistic function is utilized to represent binary data. The link between dependent and independent variables is shown using a sigmoid function. The correlation coefficient, which measures the link between the target variable and the independent variable, is used in LR. The correlation coefficient, which ranges from −1 to 1, calculates the link between two variables and shows how well the expected and actual values match up. It is a linear model, where
Y is the target variable and
X is the independent variable, and it may be written as
.
3.8.5. Naive Bayes
Based on the “Bayes” theorem, NB [
55] is a potent algorithm. It functions by determining the conditional probability and likelihood that a data object belongs to a specific class. The highest probability class is regarded as the ultimate. This particular feature is assumed to be unrelated to any other character in the data. If the data support the assumption, the model performs well even on a short training dataset.
3.8.6. Stochastic Gradient Descent
SGD classifier [
56] is a machine learning technique that identifies the ideal parameter for tying the predicted and actual outputs together. It possesses smoothness qualities and optimizes the objective function. When learning from huge datasets, it does so more quickly than gradient descent. Additionally, it converges more quickly and creates a batch from the dataset required to determine the gradient at each iteration level.
3.8.7. Multilayer Percetron
The neural network called MLP uses basic models to examine and resolve challenging problems, including prediction, classification, etc. It is a fully connected feed-forward network that can learn nonlinear relationships. MLP can be used for binary as well as challenging multi-class tasks [
57].
3.8.8. Recurrent Neural Network
An RNN is a neural network that has been designed to be run repeatedly, with elements from each run feeding into the following one. In particular, a portion of the input to the same hidden layer in the subsequent run comes from hidden layers from the prior run. RNNs are especially helpful for assessing sequences because the hidden layers may learn from the neural network’s past iterations on earlier portions of the sequence [
58].
3.8.9. Long Short Term Memory
Three gate control mechanisms are added to long short-term memory (LSTM): the forget gate, input gate, and output gate. It also presents the choice of dependent information on cell state control, which successfully solves the issue of gradient explosion and gradient disappearance [
59].
3.8.10. Convolutional Neural Network
CNN comprises convolutional layers, pooling layers, activation layers, dropout layers, and flattened layers. The primary layer, known as convolution, is used to extract features, while the pooling layer shrinks the size of those features, the dropout layer lessens overfitting, and the flattened layer turns data into an array. ReLU is employed as an activation function and a 0.2 dropout rate is used for the dropout layer in this study.
3.8.11. Voting Classifiers
A voting classifier is a group of different models that are put together to provide aggregate predictions [
60]. It operates by averaging the results from each classifier in the ensemble and then forecasts the result based on the results of the majority of votes. The advantages of LR and SGD are combined in the voting classifier VC(LR+SGD) used in this work. Another voting classifier VC(ETC+CNN) makes use of ETC and CNN for final prediction. It operates by averaging the two models’ outcomes. The model output is chosen to be the goal value with the highest probability. It combines the advantages of the integrated models and yields effective outcomes.
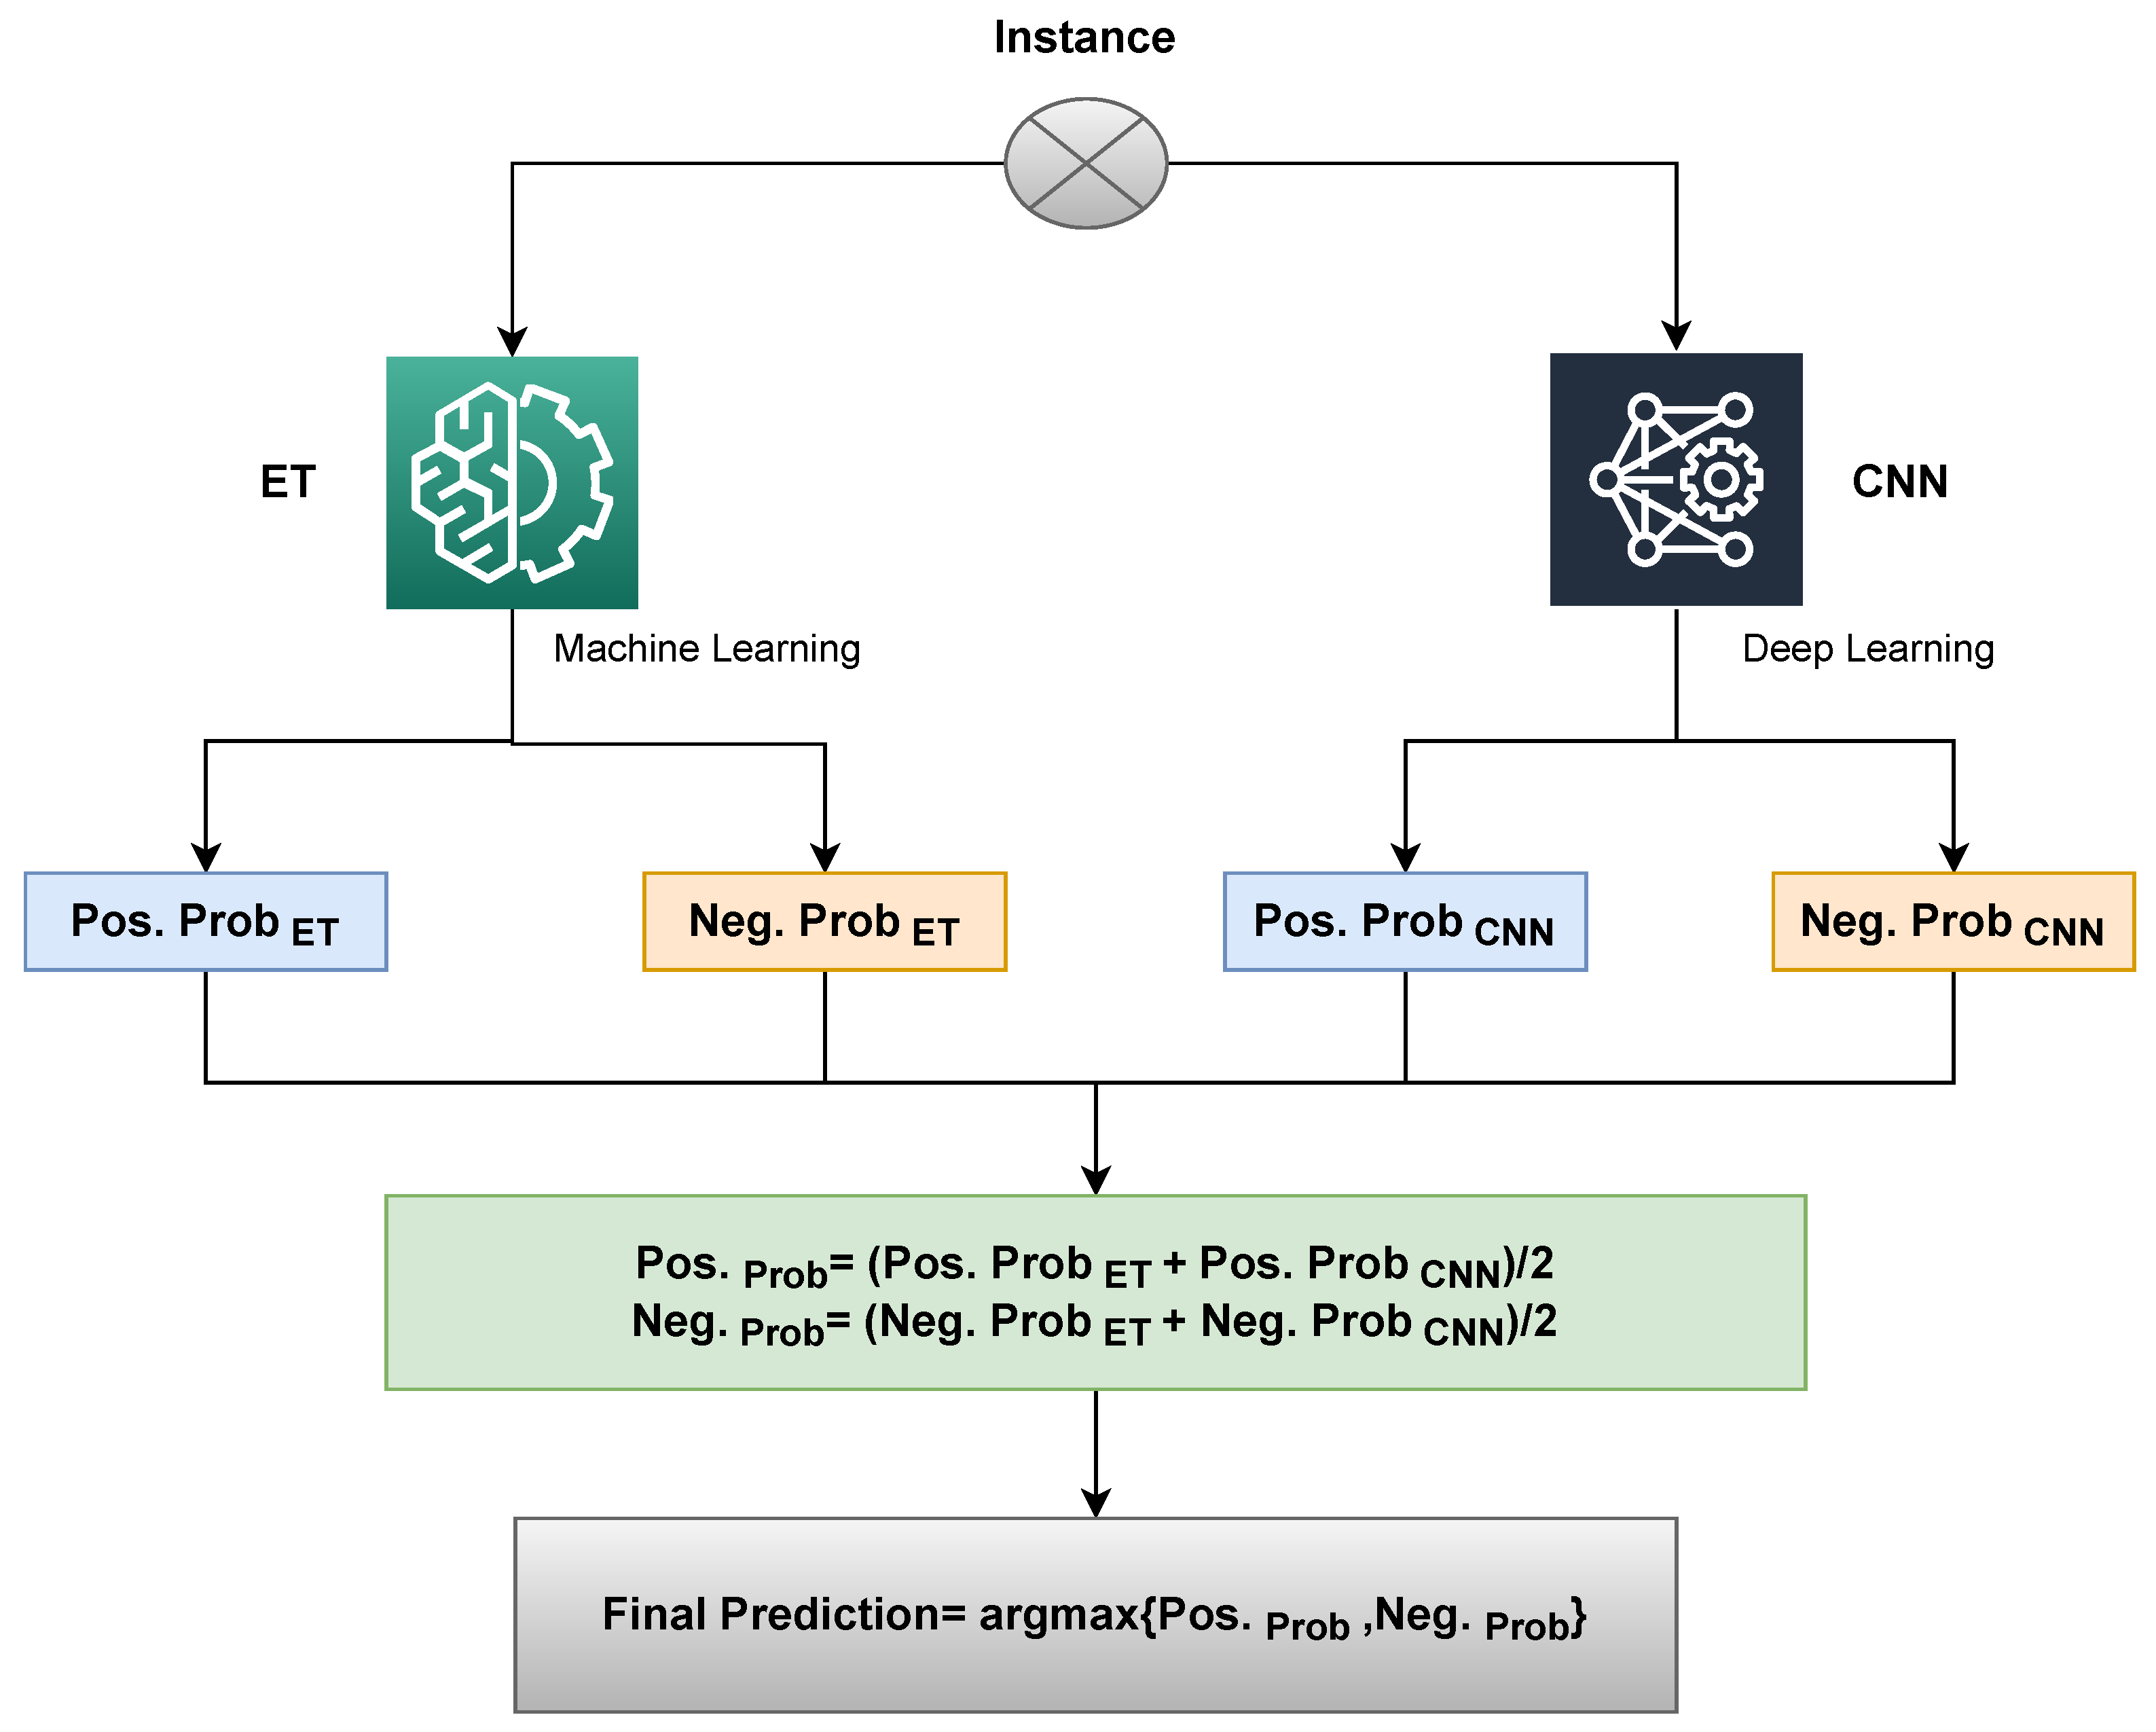
3.9. Proposed Framework
The proposed method uses a voting classifier termed VC(ETC+CNN) that combines the ET and CNN models while utilizing soft voting, as seen in
Figure 5. The end result will be the class with the highest likelihood. The working of the suggested VC(ETC+CNN) is explained by Algorithm 1, which is represented as
where
and
both give prediction probabilities against each test sample. After that, the probabilities for each test example by both ETC and CNN pass through the soft voting criteria.
| Algorithm 1 Ensembling of ETC and CNN as VC(ETC+CNN). |
Input: input data
= Trained_ ETC
= Trained_ CNN
fordo
if then
end if
Return final label
end for |
The functionality of the VC(ETC+CNN) can be discussed with an example. When a given sample passes through the ETC and CNN, a probability score is assigned to each class (that can be positive or negative). Let ETC’s probability score be 0.6, 0.4 for
and
classes and CNN’s probability score be 0.5 and 0.5 for
, and
, respectively. Then, the average probability for the two classes can be calculated as
The final prediction will be positive class as shown below:
The proposed VC(ETC+CNN) makes the final decision by combining the predicted probabilities of both classifiers and decides the final class based on the maximum average probability for a class.
4. Results and Discussion
The main objective of this study is to use machine learning models to do sentiment analysis on tweets linked to COVID-19. The COVID-19 tweets dataset from the IEEE data repository was used in the current study to carry out the sentiment analysis job. Tweets are first preprocessed through a lengthy process. After that, Textblob is used to tag tweets. In this work, classifiers such as RF, GBM, ETC, NB, LR, SGD, MLP, RNN, LSTM, CNN, VC(LR+SGD), and VC(ETC+CNN) were utilized. Each model receives individual and features fusion training on a variety of feature engineering strategies (TF, TFIDF, TF + TF-IDF, and Word2vec). Accuracy, precision, recall, and F1-score are used to evaluate the supervised machine learning and deep learning models. To analyze the sentiment of COVID-19 tweets, experimental findings utilizing several feature engineering strategies that include TF, TF-IDF, and TF +TF-IDF are examined.
4.1. Performance Evaluation Matrices
This research used accuracy, precision, recall, and F1 score as the performance evaluation matrices. Four terms are the basis for these matrices such as True Positive (TP), True Negativity (TN), False Positive (FP), and False Negative (FN).
True Positive (TP): it refers to correctly classified positive instances;
True Negativity (TN): it refers to correctly classified negative instances;
False Positive (FP): it refers to misclassified positive instances;
False Negative (FN): it refers to misclassified negative instances.
Based on these terms, we can evaluate the Accuracy, Precision, Recall, and F-score.
Accuracy is a widely used parameter that is used to evaluate classifier performance. It is calculated by:
Precision and recall are extensively used parameters for the classifier performance evaluation. Precision calculates the predicted positive case. Precision calculated as:
Out of all the above-mentioned matrices, the F1-score is calculated as well. It is a statistical measure used in the classification. It takes precision and recall of the model in its calculation and calculates the value between 0 and 1. It is calculated as:
4.2. Comparison of Classifiers Using TF
Table 3 compares machine learning models that use TF in terms of Accuracy, Precision, Recall, and F1-score. The results of the experiments show that the ETC model performed better than other models that used TF with a 94.06% Accuracy. However, SGD also achieved the second-highest results using TF, with a classification accuracy of 93.79% for tweets about COVID-19. SGD and ETC have Precision, Recall, and F1-score values of 94%. However, when it came to the sentiment analysis of the COVID-19 tweets, NB and GBM performed poorly. GBM has an 85% F1-score, 86.03% Accuracy, 88% Precision, and 86% Recall. 87.88% Accuracy, 88% Precision, 0.88% Recall, and 0.89% F1-score were displayed by NB.
4.3. Comparison of Classifiers Using TF-IDF
Results are shown in
Table 4 for the classification of COVID-19-related tweets by supervised machine learning models employing TF-IDF characteristics. After analyzing the outcomes, it can be concluded that TFIDF enhanced SGD and ETC model outcomes. SGD ranked second in tweet classification accuracy with a TF-IDF score of 94.01%. While NB and GBM did not outperform other machine learning models utilizing TF-IDF, they did perform better than the outcomes achieved with TF. ETC has the best precision (95% of value), followed by SGD (94%), and RF (92%). GBM achieves the lowest level of accuracy (88%). The ETC model achieves the greatest value of recall, 95%, followed by SGD (94%), which came in second, and RF (92%), which came in third. The ETC model likewise attains the greatest F1-score, which is 95%.
4.4. Comparison of Classifiers Using Word2vec
Word2vec is also used to assess the effectiveness of supervised machine-learning models for sentiment analysis of COVID-19 tweets. Word2vec has established itself as a successful text classification method [
61].
Table 5 experimental findings reveal that the supervised machine-learning models did not produce reliable results. The accuracy of the ETC model using word2vec, which was 88.64%, was lower than the accuracy of the ETC models using TF and TFIDF, which were 94.06% and 94.74%, respectively. The experimental findings make it abundantly evident that using the Word2vec feature representation approach does not increase the efficiency of any classifier. The ETC classifier still achieves the greatest F1-Score with word2vec (88%), which is 7% lower than the F1-score obtained using TF-IDF.
4.5. Performance Comparison of Classifiers Using Feature Fusion
We also conducted experiments employing feature fusion (TF + TF-IDF) to compare classifiers to demonstrate the usefulness, efficiency, and robustness of machine learning models. It is evident that LR, SGD, and VC(LR+SGD) beat other models with a 92% value in terms of Accuracy, Precision, Recall, and F1-score utilizing feature fusion (TF + TF-IDF) while assessing sentiments from tweets connected to COVID-19. As demonstrated in
Table 6, ETC beat other models in terms of Precision, Recall, and F1-score, with a 92% value. With feature fusion, NB and GBM did not perform well, and their outcomes are consistent with those of TFIDF. Using feature fusion, NB outperformed Word2vec with a performance of 88.39% accuracy compared to 68.94% accuracy. For the sentiment analysis of COVID-19 tweets, GBM has also demonstrated marginally superior performance utilizing feature fusion as compared to Word2vec.
4.6. Performance Comparison
A performance comparison is also carried out for the proposed approach. Existing studies utilize a large range of machine learning models for sentiment analysis. For example, Ref. [
62] utilizes RF, XGboost, support vector classifier (SVC), ETC, and decision tree (DT). The study reports the best results using ETC with a 93% accuracy score. Similarly, Ref. [
16] made use of a support vector machine (SVM) for sentiment analysis and obtained 79% accuracy. Comparison results given in
Table 7 indicate that the proposed voting classifier in this study shows better results than existing studies and archives the highest accuracy of 99%.
4.7. Results of Cross-Validation
A 10-fold cross-validation is carried out to validate the performance of the proposed approach, and results are presented in
Table 8. It can be observed that the proposed model provides an average accuracy of 99.5% while the average values for precision, recall, and F score are 99.5%, 99.2%, and 99.5%, respectively.
4.8. Discussion
It is evident from the findings presented above that machine learning models were successful in extracting public sentiment from a tweet-based dataset. A wide range of feature engineering approaches, including TF, TF-IDF, TF + TF-IDF, and Word2vec, have been used in several trials. Using TF, ETC, RF, LR, SGD, and VC (LR+ SGD) were able to obtain accuracy, precision, recall, and F1-score values greater than 92%. Except for GBM, all other supervised learning models employed in the experiment performed better when using TF-IDF than TF. However, employing Word2vec for sentiment analysis of tweets has not shown satisfactory results for supervised machine learning models. Results indicate that Word2vec is not enhancing classifier effectiveness when categorizing tweet-based data. We also assessed models employing feature fusion of TF and TF-IDF to demonstrate the efficacy of supervised machine learning models. The feature fusion improved the performance of LR, SGD, and VC(LR+SGD).
Table 6 demonstrates that LR and SGD have obtained strong results, with 92% values for Accuracy, Recall, Precision, and F1-score. However, the values of their results are comparable to those of their voting ensemble, VC(LR+SGD). The ETC classifier outperforms all other models using TF, TFIDF, TF + TF-IDF, and Word2vec, according to experimental data. Using TF-IDF, it can be seen that ETC outperformed all other models and can analyze tweet sentiment with 94.74% accuracy, 95% precision, recall, and F1-score.


 ,
, 


