Article

From Bioimpedance to Volume Estimation: A Model for Edema Calculus in Human Legs

1
Instituto de Microelectrónica de Sevilla (IMSE-CSIC), Universidad de Sevilla, 41092 Sevilla, Spain
2
Departamento de Tecnología Electrónica, Universidad de Sevilla, 41092 Sevilla, Spain
3
Instituto de Biomedicina de Sevilla (IBiS), Hospital Universitario Virgen del Rocio, Universidad de Sevilla, 41092 Sevilla, Spain
4
Departamento de Biología Celular, Universidad de Sevilla, 41092 Sevilla, Spain
5
Departamento de Electrónica y Electromagnetismo, Universidad de Sevilla, 41092 Sevilla, Spain
*
Author to whom correspondence should be addressed.
Electronics 2023, 12(6), 1383; https://doi.org/10.3390/electronics12061383
Submission received: 2 February 2023 / Revised: 8 March 2023 / Accepted: 11 March 2023 / Published: 14 March 2023
(This article belongs to the Special Issue Wearable and Implantable Sensors in Healthcare)

Abstract

:
Heart failure (HF) is a severe disease and one of the most important causes of death in our society nowadays. A significant percentage of patients hospitalized for decompensation of heart failure are readmitted after some weeks or months due to an expected bad and uncontrolled HF evolution due to the lack of the patient supervision in real time. Herein is presented a straightforward electric model useful for volume leg section calculus based on the bioimpedance test as a way to assist with the acute HF patient’s supervision. The method has been developed for time-evolution edema evaluation in patients’ corresponding legs. The data are picked up with a wearable device specifically developed for acute heart failure patients. As an initial step, a calibration method is proposed to extract the extracellular volume component from bioimpedance measurements done in healthy subjects, and then applied to unhealthy ones. The intra- and extracellular resistance components are calculated from fitted Cole–Cole model parameters derived from BI spectroscopy measurements. Results obtained in a pilot assay, with healthy subjects and heart failure subjects, show sensitivities in leg volume [mL/Ω], with much lower values for healthy than in unhealthy people, being an excellent biomarker to discriminate between both. Finally, circadian cycle evolution for leg volume has been measured from the bioimpedance test as an extension of the work, enabling an alternative parameter for the characterization of one day of human activity for any person.

1. Introduction

Heart failure (HF) is defined as the inability of the heart to supply the peripheral tissues with the required amount of blood and oxygen to meet their metabolic demands or doing it by increasing the filling pressures [1]. This is a very frequent and complex clinical syndrome that results from the malfunction of the heart [2]. The most frequently presented symptoms (dyspnea, edema, and asthenia) are generally a result of the main feature in HF: volume overload. The range of etiologies is wide as it is the common clinical presentation of diseases that causes either structural or functional impairment of the cardiac pump. Consequently, heart failure constitutes a major health problem and is even considered an epidemic [3] as it affects over 64 million people worldwide with higher prevalence (above 10%) in the elderly [4,5,6]. Its incidence is heterogeneous but may change between 200 and 400 per 100.000 habitants [7]. In many developed countries, acute HF is the main cause of hospital admission in patients over 65 years [8]. Its global prognosis is worse than that presented by patients with breast, prostate, or bowel cancer [9], and it worsens with each hospitalization [10].
The natural history of this syndrome is progressive with a yearly observed decline in quality of life by the presence of symptoms. Appropriate treatment and lifestyle allow the patients to delay its progression and improve their functional status. Nevertheless, patients frequently alternate periods of stability and instability. Acute HF episodes or decompensation are defined as sudden worsening of symptoms. These can be driven by many causes but they mainly imply volume overload [11]. Usually, the physiological (neurohormonal and hemodynamic) changes that lead to decompensation start far before the symptom onset and could potentially be recognizable to enhance an early management as it is described in [12], starting from filling pressure increase, autonomic adaptation, intrathoracic impedance changes, and weight changes, until hospitalization. In the absence of a clear objective test to identify HF, its diagnosis and follow-up relies on the constellation of probability, symptoms, signs, biomarkers, and image studies [13]. Many of the variables that are being used (such as weight, the biomarker NT-proBNP, or echocardiographic findings) are direct or indirectly related to volume overload, which strengthens the importance of biomarkers to be able to screen changes in fluid balance to be useful in HF.
The early recognition of these acute HF episodes is crucial to prevent admissions, whereas for their screening, in the usual clinical practice, clinicians do not yet count on any objective measure other than weight and must rely solely on subjective clinical examination (which has changed very little from the 18th century). In this regard, clinicians and patients have been focusing on both monitoring programs and new technologies to help manage this complex syndrome, leading to these issues becoming the trending topics in this field of research within the last twenty years. Therefore, more than 4000 studies have been conducted evaluating the effectiveness of very diverse telemonitoring programs. Despite the heterogeneity in these programs and initial disagreement in the results, the most recent studies and reviews suggest that telemonitoring is beneficial. The most relevant meta-analyses (including randomized control trials and cohort studies), systematic reviews, and overviews of systematic reviews have reported a 13–20% decrease in all-cause mortality, a 15–29% decrease in readmission for acute HF and a significant—yet very heterogeneous—increase in quality of life scores. The literature is also pointing out that regardless of the nature of the monitoring program (telephone-based, videoconference or device-mediated), the benefits are greater in those programs with closer monitoring (on towards 24 h, 7 days per week) [14,15,16,17,18]. In conclusion, the need for monitoring in HF is clear. Merging the evidence observed in the literature and the up-to-date insight of HF pathophysiology makes the idea of real-time monitoring become the next aim for improving the prognosis of patients suffering from HF. However, in order to implement these programs in daily clinical practice, we must first overcome technical, clinical, and economic limitations.
As a chronic condition with impaired cardiovascular function and abnormal hemodynamics, in HF there usually exists an unstable equilibrium of the fluid management. Many events (infections, toxics, arrhythmias, drugs, excessive salt or water intake …) can be responsible for an acute HF decompensation [19,20,21,22,23]. These triggers affect the fluid balance regulatory mechanisms, leading to hydric overload. This a progressive process that can take days to weeks for the patient to present symptoms or for the clinician to be able to recognize the signs of congestion. Therefore, in the search for parameters that could assess the fluid overload in this window period, BI has emerged as a powerful tool.
Although some validation is still required, the evidence on the application of BI in HF suggests that it is useful both in diagnosis and follow-up. Unfortunately, BI is not yet considered a tool in our daily clinical practice. The devices that have been used to monitor BI in the diagnosis and evolution of HF in research were mainly either implantable (associated with pacemakers or resynchronization devices in selected patients suffering from advanced HF) or too large to be used for continuous remote long-term monitoring.
Bio-Impedance (BI) [24] can be employed for the study and characterization of the status of cells [25], tissues, and organs [26] due to their electrical properties (conductivity and permittivity), being suitable indicators of biological matter physics when they are defined as bio-markers in medical diagnosis [27,28,29]. Frequency spectroscopy techniques can be widely applied to test BI (e.g., Electrical Impedance Spectroscopy, EIS). Electrical impedance tomography approaches can be also practical for monitoring the physiological status [30] of patients using wearable devices, where low-power, size, and weight are mandatory [31,32]. In addition, BI tests are non-invasive, cheap, and easy to build. In this way, a simple, non-invasive, and very sensitive volume measurement that could help identify high-risk HF patients is bioelectrical BI analysis. This measurement includes bioelectrical BI vector analysis performed with a single-frequency [33] device and/or multi-segment and multi-frequency [34] measurement equipment, which can be used to accurately measure intracellular and extracellular water components [35].
A comprehensive recent study showed that point measurement of BI in the leg is inversely associated with the incidence of HF in the general population [36]. Human body studies on acute HF diagnosis evaluated the BI of the whole body [27,35] or some parts, conducting the test called the segmented BI test: arms, legs, and intrathoracic [37,38,39] parts. These studies are based on the inverse relationship between body impedance and volume [27,40] which allows BI systems to estimate volumes or edemas by placing electrodes on the adequate [39] body part. Most of the equipment employed by doctors at hospitals for BI tests includes complex electronic systems based on commercial components resulting in non-portable and heavy devices: Medtronics (Optivol), RJL Systems (Quantum/S Analyzer), or SFB7 (Impedimed). Some approaches aimed to evolve toward portable devices [27] are not comfortable enough for continuous BI monitoring because they employ wet electrodes placed over the chest during a one-hour test. In addition, a partially portable BI system for knee edema test was reported in [41]. Others perform an impedance cardiography [42]. BI analysis was employed to calculate the edema index as the relationship between extracellular body water and total body water [30], with a commercial multi-frequency analyzer. In [36], the leg impedance was identified as a relevant parameter for acute HF prediction in patients. A wearable device for short-time hydration assessment was developed in [43]. It is based on a four-wire BI test that can measure eight frequencies with a sensitivity of 700-mL TBW volume increments. The main question is to evaluate how much the body volume (in our cases, the leg volume) changes with the body resistance, knowing that both volume and bioimpedance are inversely proportional. Some calibration methods have been proposed. In [27], the Total Body Water (TBW) was evaluated during a period of time and represented versus the impedance measured, obtaining a sensitivity of 700-mL TBW volume increments, but there was not an analytical approach. A method for system calibration based on the hypothesis that the extracellular liquid in the leg is the main cause for impedance changes is observed in subjects and is presented herein.
This work is organized as follows: Section 2, Material and Methods, describes first the system approach and wearable device to measure the bioimpedance in the leg for edema evaluation [44,45,46,47], including some key points such as electrode selection and wireless communication. Then, the proposed electrical model describing the bioimpedance for a leg section is presented and the dependence between its parameters and the bioimpedance measurement is evaluated. A proposal for edema supervision in the leg derived from the calculated bioimpedance parameters is introduced for medical diagnosis, together with the design of a pilot assay. Experimental results are presented in Section 3, describing mainly the leg volume evolution for several persons, both healthy and patients, during a week of observation. The model’s parameters extracted from the bioimpedance test are presented and employed for edema calculus. The results obtained for healthy and acute HF subjects are described, validating the volume changes in body due to extracellular liquid increments. An extension of ten days’ real-time test was applied to a healthy subject to evaluate the one-day volume evolution, or circadian rhythm, as a potential biomarker useful for the characterization of healthy and unhealthy status of a person under clinical evaluation.

2. Material and Methods

This section describes the structural components employed for the sensor, its most relevant specifications, and the proposed electric model used for bioimpedance description of the leg tissue that will lead us to ankle volume characterization. The procedure for volume calculus will be described starting from the BI data test on the leg and considering the procedure defined below.

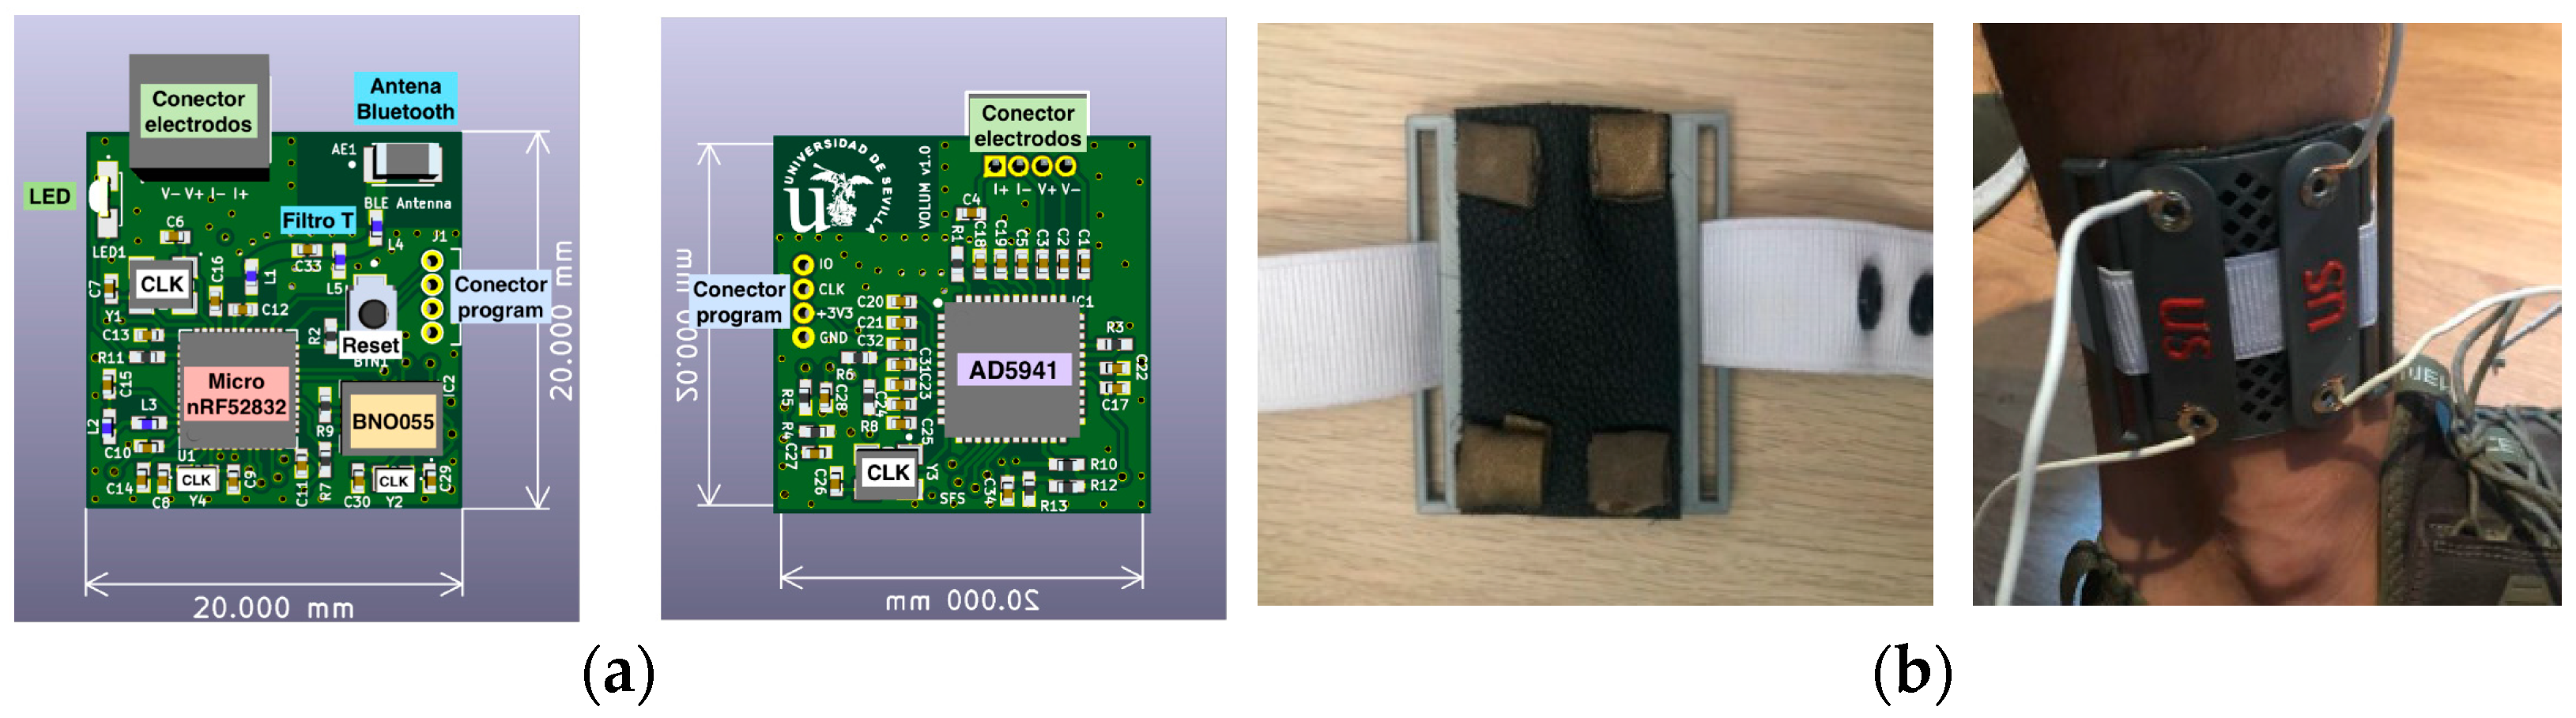
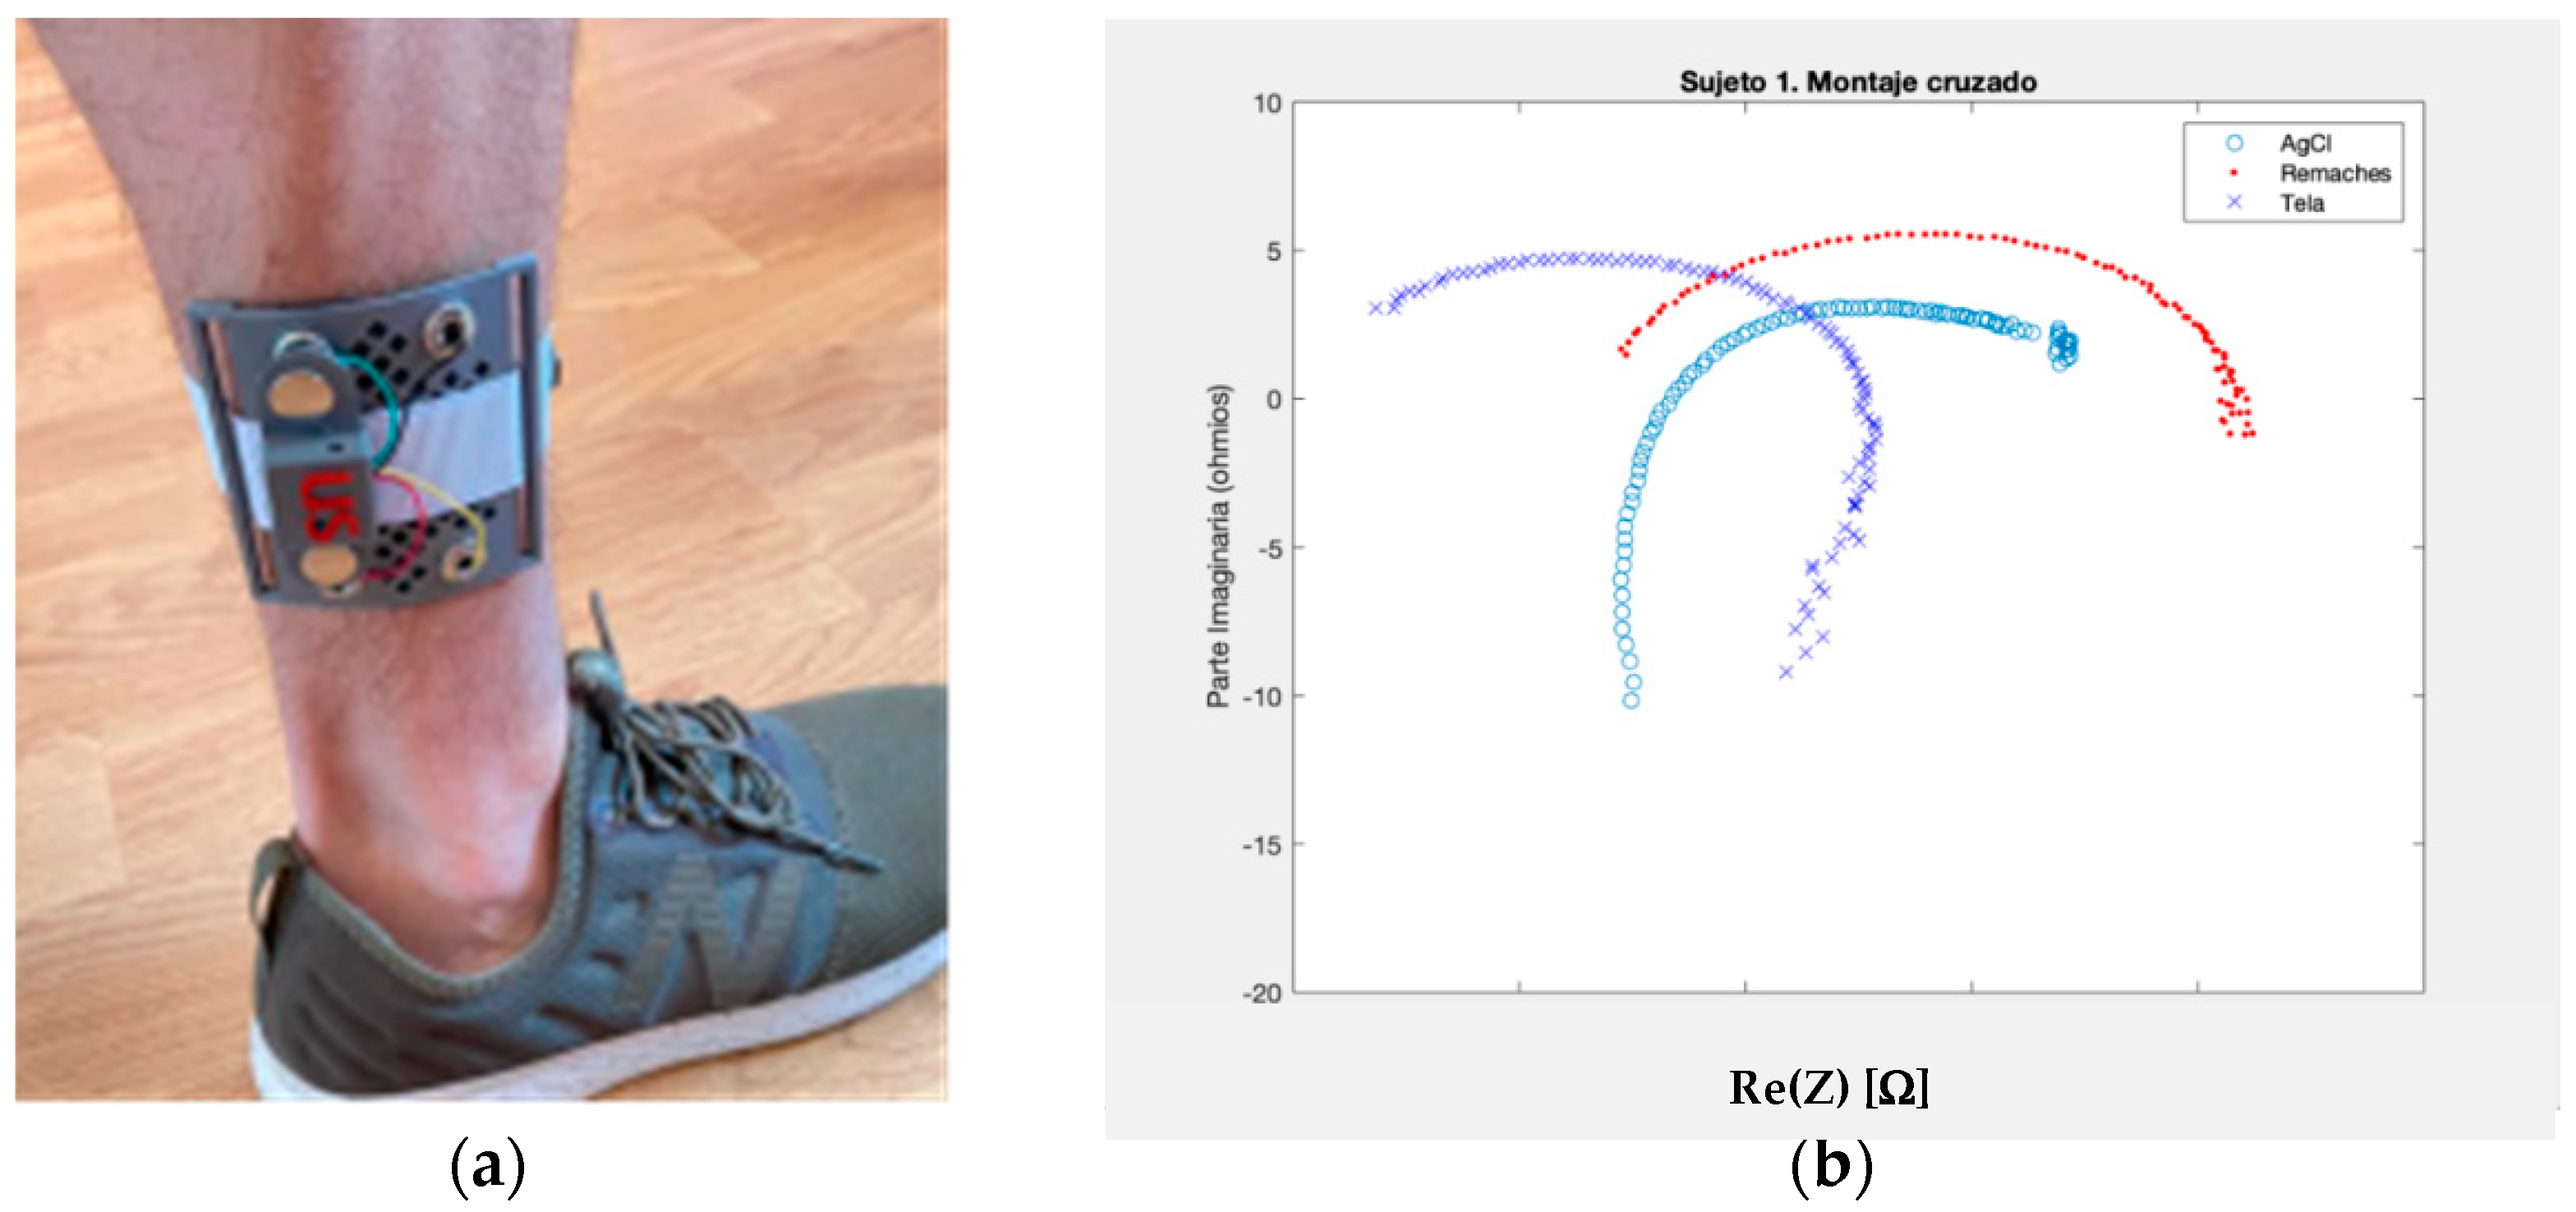
2.1. Wearable Bioimpedance System

Wearable Devices (WD) for humans in a biomedical engineering environment are designed to test some kind of vital signals (blood pressure, heart rate, heart electrical activity, weight, etc.) or biomarkers (blood glucose, electrolytes in sweat, etc.) directly on the human body, and essentially in real time. It is for this objective that WD must be comfortable and autonomous for patients. A comfortable WD means that the device must be easy to carry on the body, and the patient will not damage it when it is used during several hours and days. Wearable devices can be considered, in some aspects, as biocompatible in a broad sense. Small size and low weight [27] should be mandatory to avoid discomfort to patients, but for a long-time WD test, electrodes must be adequately selected to minimize any skin damage [48] and to reduce motion artifacts [28]. The manner utilized to place the WD in contact with the body can be an important issue. Directly integrating the textile electrodes in some clothing for babies [49] and a sport T-shirt [50] is an excellent example of how electrodes can be perfectly integrated into the WD system in a beneficial manner. However, for long-term applications, textile electrodes can incorporate dust and impurities; therefore, metallic electrodes are better [51]. Alternative setups for WD can be found such as specific gloves, wristband [52], anklet [41], or any other kind of clothing specifically designed for such an application, such as that reported in [53] for bladder control, or a belt placed on the chest [51] for EIT, or placed on the leg [41].
The proposed system herein for the test is based on the circuits developed in the VOLUM project [44]. This project works towards the development of a wearable device for real-time monitoring of acute heart failure patients. The system in Figure 1a shows the electronic circuits, and ankle support with electrodes is shown in Figure 1b. The target of the system is to be wirelessly connected to the patient’s smartphone, to be continuously supervised by the medical team. The main component for the bioimpedance test circuit is the AD5941 from the Analog Devices chip. This component is employed in the four-wires electrode setup proposed with reduced circuitry and allows frequency spectrometry until 200 kHz. Circuits for control position (BNO055) and task control to be done (nRF52832) are also included. The last one is responsible for firmware and to implement the Bluetooth communication. Details for the full device will be found in future technical reports and references. A four-wires setup is employed for BI test along the leg, the distance between electrodes being constant: 3.5 cm width (w) and 6 cm height (h), as it is illustrated in Figure 2. The AD5941 injects current between electrodes 1 and 4, being the voltage response due to the leg impedance measured on electrodes 2 and 3, thanks to the high-input impedance differential voltage amplifier. Spectrometry measurements are done in the range from 1 kHz to 200 kHz.

2.2. The Electrode Selection

For electronic engineering, electric current consists commonly of a flow of free electrons in a conductive metal under the influence of an applied electric field. In contrast, in the human body, current is sustained by the transport of ions (mainly Na+, Cl, and K+) along the intracellular and/or extracellular medium that occurs due to changes in their concentration. Electrodes are the interfaces responsible for converting electric current from a conductive metal (electron flow) to the interior of the human body (ion transport) by means of redox chemical reactions. The Ag/AgCl electrode is commonly used in medical devices, especially for external ECG, because it is stable and non-polarizable (current passes freely through the electrode–electrolyte interface). This type of electrode is adhesive and also has a gel that improves the conductivity on contact with the skin, being the most popular electrode in local time clinical applications. However, after a few hours of continuous use, Ag/AgCl electrodes deteriorate, generating errors artifacts leading to measurement errors, also causing skin irritation. Therefore, for a wearable device intended to monitor the patient’s condition over time, it is advisable to use a long-lasting dry electrode. In this context, electrodes made of stainless steel have been reported to work well for bioimpedance spectroscopy [54].
Despite the large number of publications that report the use of electrodes for bioimpedance measurements, there is still a gap in the standardization of the electrodes required to measure bioelectrical parameters in vivo [55,56]. Guidelines from the NIH Technology Assessment Conference on Bioelectrical Impedance Analysis [57], among others, only address the size of the electrodes and separation between them, but other characteristics of the contact electrodes, such as fabrication materials, are not fully addressed [56]. A number of physical properties are important in the election of the type of electrode. Among them, we can mention: biocompatibility, which requires the use of specific materials, and the avoidance of allergic reactions is a basic requirement in the selection of electrodes. Mainly used materials are gold, silver, stainless steel, or carbon rubber (for flexible electrodes); stability, because the measurement made with the selected electrode needs to be stable in time, and repeatable with similar electrodes. Different variability problems can be found in [55]; and accuracy, low electrode-skin impedance can be necessary in order to improve signal-to-noise ratios picked up by instrumentation amplifiers used for voltage signal captured on differential electrodes setups.
The avoidance of these systemic errors is especially important when these measurements are used for clinical interpretations [56]. This can be one of the main reasons why the different studies and prototypes are not being commercially used in clinical practice. Also, wet electrodes cannot be used in many different practical applications when a truly 24 h wearable device is necessary, so dry electrodes are also being researched for this purpose.
Dry electrodes are gel-free and, technically, are the best candidates for commercial wearable devices. However, the signal-to-noise ratio is worse due to their high impedance, in relation with the capacitive impedance produced by the electrode and the dermis interface. Generally, these electrodes must be used together with a very high-input impedance amplifier with the function of minimizing the influence of electrode-high impedance. Another disadvantage of dry electrodes is the difficulty of keeping a good contact with the dermis in the absence of gel [58]. Despite textile electrodes being currently researched for their use in wearable medical devices, their integration and performance for the electrical bioimpedance test have not been thoroughly investigated. In [59], the influence of the textile electrodes on the measurements and on the estimation of the Cole–Cole model and body composition parameters was addressed. Good results were obtained with the use of textile electrodes in complex spectral measurements and in the calculation of body composition parameters. However, other works [60] suggest that this type of textile electrodes is not suitable for the long-term monitoring of electrical bioimpedance in wearable devices, due to its deterioration with prolonged use. Finally, the use of flexible electronics is recently attracting more attention, with the appearance of different technologies being used in wearable devices in healthcare. Different patents [61,62] propose the use of strain sensors (based on the piezoelectric effect) for the estimation of the volume in chronic patients.
An example of using different electrodes for the BI test can be seen in Figure 3b, where Ag/AgCl, stainless, and textile electrodes were employed for measuring the impedance in the leg with an ankle in Figure 3a. The setup and circuits employed are the same, but the Wessel diagram obtained in the 1 to 100 kHz frequency range is different because of the electrical response of each electrode. Stainless electrodes were selected in this work for a long-time test (from hours until several weeks and months).

2.3. The Wireless Communication

Remote sensing for medical devices requires a reliable communication link to allow information gathering and system control regardless of the sensor position and patient’s location. Continuous medical monitoring of patients complies with a specific application within the Internet of Things (IoT) paradigm [63]. IoT Architecture would present one or several sensing devices, a gateway, and a set of services provided. There are two potential scenarios arising from the medical domain; either the patient is located within the hospital facilities, or the patient is to be monitored at home during his/her usual day. In the first scenario and recalling the IoT paradigm, a gateway device could be placed in the patient’s hospitalization room. Assuming the second scenario, a similar device shall be placed in the patient’s home, but of course it will not allow for communication if the patient leaves the house for prolonged periods of time. Furthermore, assuming the patient owns a smartphone device, it can serve as a gateway in many situations if the sensing device wireless communication follows a standard technology such as Bluetooth [64,65].
Biological Impedance spectroscopy measurements are formed by a set of impedance values (real and imaginary part) mapped to many different frequency values. A single measure of impedance every few minutes would produce a packet of binary data representing those impedance values, assuming each impedance (real and imaginary) is stored in floating point format (FP32); a single measurement could be stored in 8 bytes. Hence, 10 frequency points would require 80 bytes. Even increasing the data amount by one order of magnitude would keep total data per complete acquisition below 1 kB information. Data generation rate of the sensor also depends on the acquisition period. The body fluids modification in the body requires some inertia to change, especially the accumulation produced by heart failure conditions. This body fluids evolution behavior would allow us to assume that a reasonable rate of acquisition could be in the range of hours rather than in the range of minutes or seconds.
Major design constraints and parameters to be analyzed regarding wireless communication capacity are the power consumption of the wireless transmission and the rate at which information must flow out of the sensor towards the gateway device. Both can be improved in terms of energy efficiency. An option to improve this magnitude would be application of adequate measurement protocols, such as fine-tuning or even adapting the acquisition period for the patients’ needs either derived from specific clinical information or from the measurement analysis itself. A second consideration is the transmission windows; a set of measurements stored in a temporary location in the sensor device can greatly diminish the electrical power consumption of the wireless transmission block, since it is used less often. Finally, data information acquired (particularly if it consists of several measures) can benefit from applying data compression techniques before sending the information through the wireless link. There are a variety of options available for wearable devices to connect to the gateway device ranging from custom ASIC design [66] with ultra-low power consumption specifications to a fully conformed IP stack employing a WiFi-compatible chip which would provide the TCP/IP protocol, thus enabling the device to directly contact the higher-level communication services (DDBB, API Rest Endpoints). This huge range of options has a trade-off which mostly involves electrical power consumption and circuit design as well as development time and difficulty. Several studies compare power efficiency and performance of many different wireless communication technologies [27,67] by analyzing commercially available devices. From those studies, Bluetooth Low Energy and its successor Bluetooth 5 stand out due to their results. Furthermore, for sleep-cycled IoT wearable devices, which acquire and measure medical parameters continuously, the period and the sleep/acquisition protocol is of the greatest importance to fine-tune the medical sensor battery autonomy regarding the power consumption spent on transmitting information. The IoT paradigm defines three major actors: a sensing device, a gateway which would be the smartphone through text messaging, and a service layer which includes all the information storage, processing, and visualization tools, typically provided by a computer server system. T-proposed architecture is presented in the following Figure 4. A medical device is connected through Bluetooth technology to the smartphone and the smartphone can reach the server by establishing a TCP/IP connection, accessing all services (data analysis and the database). Additionally, server, smartphone, or both can provide the User Interface (UI) application for both the patient and the clinical personnel which is responsible for the data acquisition (if any).
The implementation of such a system is not exempt from a certain amount of complexity. There are many technologies involved, as well as the physical device, electronics, computer programming, smartphone application development, database definition, and data analysis. The contribution of each of the parts to the global performance is quite relevant. Most of the wireless communication logic for the device is embedded in the physical electronic system which is sensing, or in the firmware of the microcontroller which manages the sensor; this represents half the communication link. On the other hand, a commercial device which may (or may not be) prepared to act as an IoT gateway is present. This design has some risks, and in particular the inclusion of the smartphone should consider potential dangers that may arise because of a smartphone not being a device specifically designed for acting as a continuous monitoring gateway. The most important risks identified are: (1) the smartphone devices may have different priorities for their functionalities, such as battery optimization procedures which may interact with a custom application designed to continuously gather data (whenever available). (2) Even though all are based on similar technologies, the Bluetooth antenna may differ in performance and effective data throughput achieved. This is critical if the amount of information to be transferred is high.
Mitigation of these risks can be a crucial step involving extensive testing of devices to check for design compliance with the medical device measurement protocol. Reliability and performance should be assessed in a wide range of different devices if the device is to be released to the general public (due to the vast amount of different commercially available smartphones).

2.4. Bioimpedance Model

A cylinder is proposed as the geometrical model for the leg to analyze its impedance. This is a very simplified model but allows a first-order approach for volume evaluation. The expected response impedance is due to the structural components of tissue in the legs: skin, fiber, muscle, fat, bone, etc. The most accepted electric model for impedance of the tissue is the designated Cole–Cole model [45,46], represented by the following equation:
Z ω = R _ inf + R _ 0 R _ i n f 1 + ( j ω τ ) a
where Z(Ω) is the measure impedance in a tissue at the frequency Ω = 2πf. Four parameters are involved in the model: R_inf: the resistance at infinity or very high frequency, R_0: the resistance at zero frequency or DC, τ: is the time constant that includes the capacitive effects due to cellular membranes, and α: the phase constant parameters that inform about the fractional performance for tissue capacitance observed. The Cole–Cole model has a frequency performance that allows a parametric and an easy graphical view thanks to Wessel diagram: −Im(Z) versus Re(Z) parts, as shown in Figure 5.
The particular shape and impedance values associated with every Wessel diagram for bioimpedance will depend on the selected tissue, the section geometry of the tissue under test, and the electrode placement r region to be measured by the electrode setup selected. Alternatively, the tissue impedance can also be considered as contributing the extracellular and intracellular structural components. This reflects that every body segment volume is the sum of both, being the extracellular contribution due to extracellular fluids, mainly water. It is accepted that the contribution of extracellular fluids to Total Body Volume (TBV) is around 37.5%. This value has anthropomorphic details or specifications with the age and sex but can be considered as a realistic value. Figure 6 represents a valid electric model for a tissue, considering the extra- and intracellular components: Rex is the extracellular resistance, Rin is the intracellular resistance, and Rm and Cm are the membrane resistance and capacitance, respectively, that represent the interface between inside-outside the cells. The resistance along the DC current path (or at low frequency conditions) is due to the extracellular medium, Rex, while, at very high frequency, the cell “opens” its membrane, Rin being the main contribution to intracellular resistance. In this case, the resistance seen for the tissue is the parallel of Rex and Rin.

2.5. Pilot Test Design

A preliminary pilot test was performed to validate the VOLUM device in several persons. There were selected four healthy people (S1, S2, S3, S4) and two more unhealthy people (S5, S6). Measurement tests were done in a week, from Monday to Friday, twice in a day: morning (8:00 h) and evening (20:00 h). In total, there were ten test points for each subject. The legend in this work for test points is: MM: Monday Morning; ME: Monday Evening; TM: Thursday Morning; TE: Thursday Evening; WM: Wednesday Morning; WE: Wednesday Evening; TuM: Tuesday Morning; TuE: Tuesday Evening; FM: Friday Morning; FE: Friday Evening. Test results presented in the following were taken with standing subjects. Measurements with subjects lying down and seated were also tested.

2.6. Leg Volume Calculus Procedure

The proposed volume calculus procedure is based on the relationship between the Cole–Cole model and the intra- and extracellular resistive components represented in Equation (1) and Figure 7, and is the principle of the proposed calibration approach. For system calibration, we employ an initial test point (MM) for a healthy subject (S3), considering the following conditions:
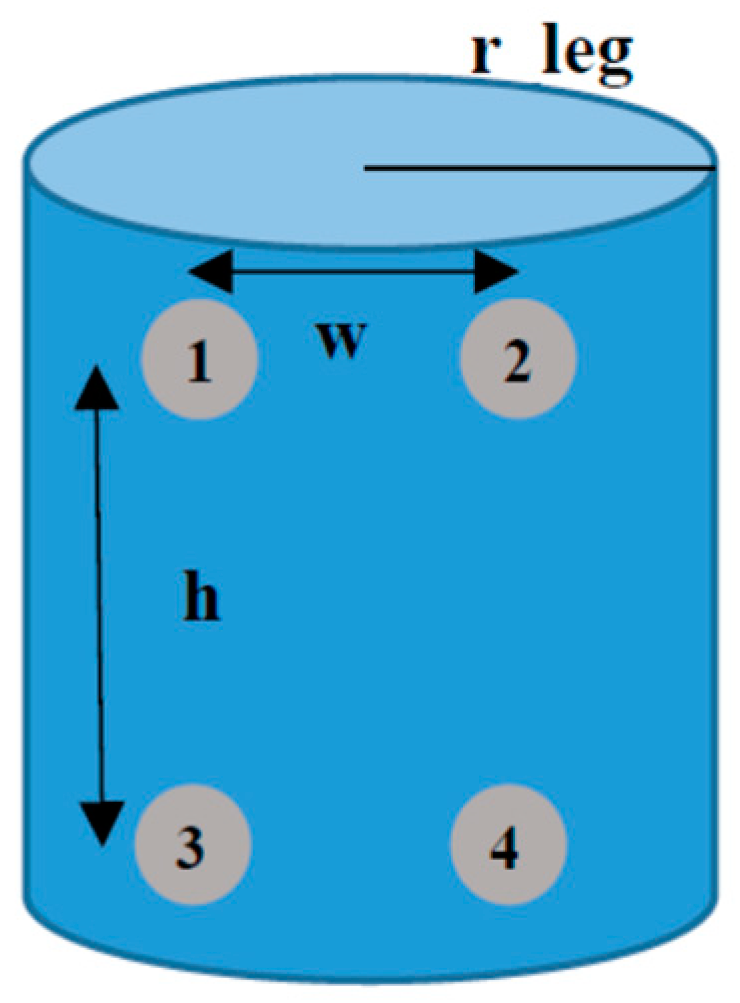
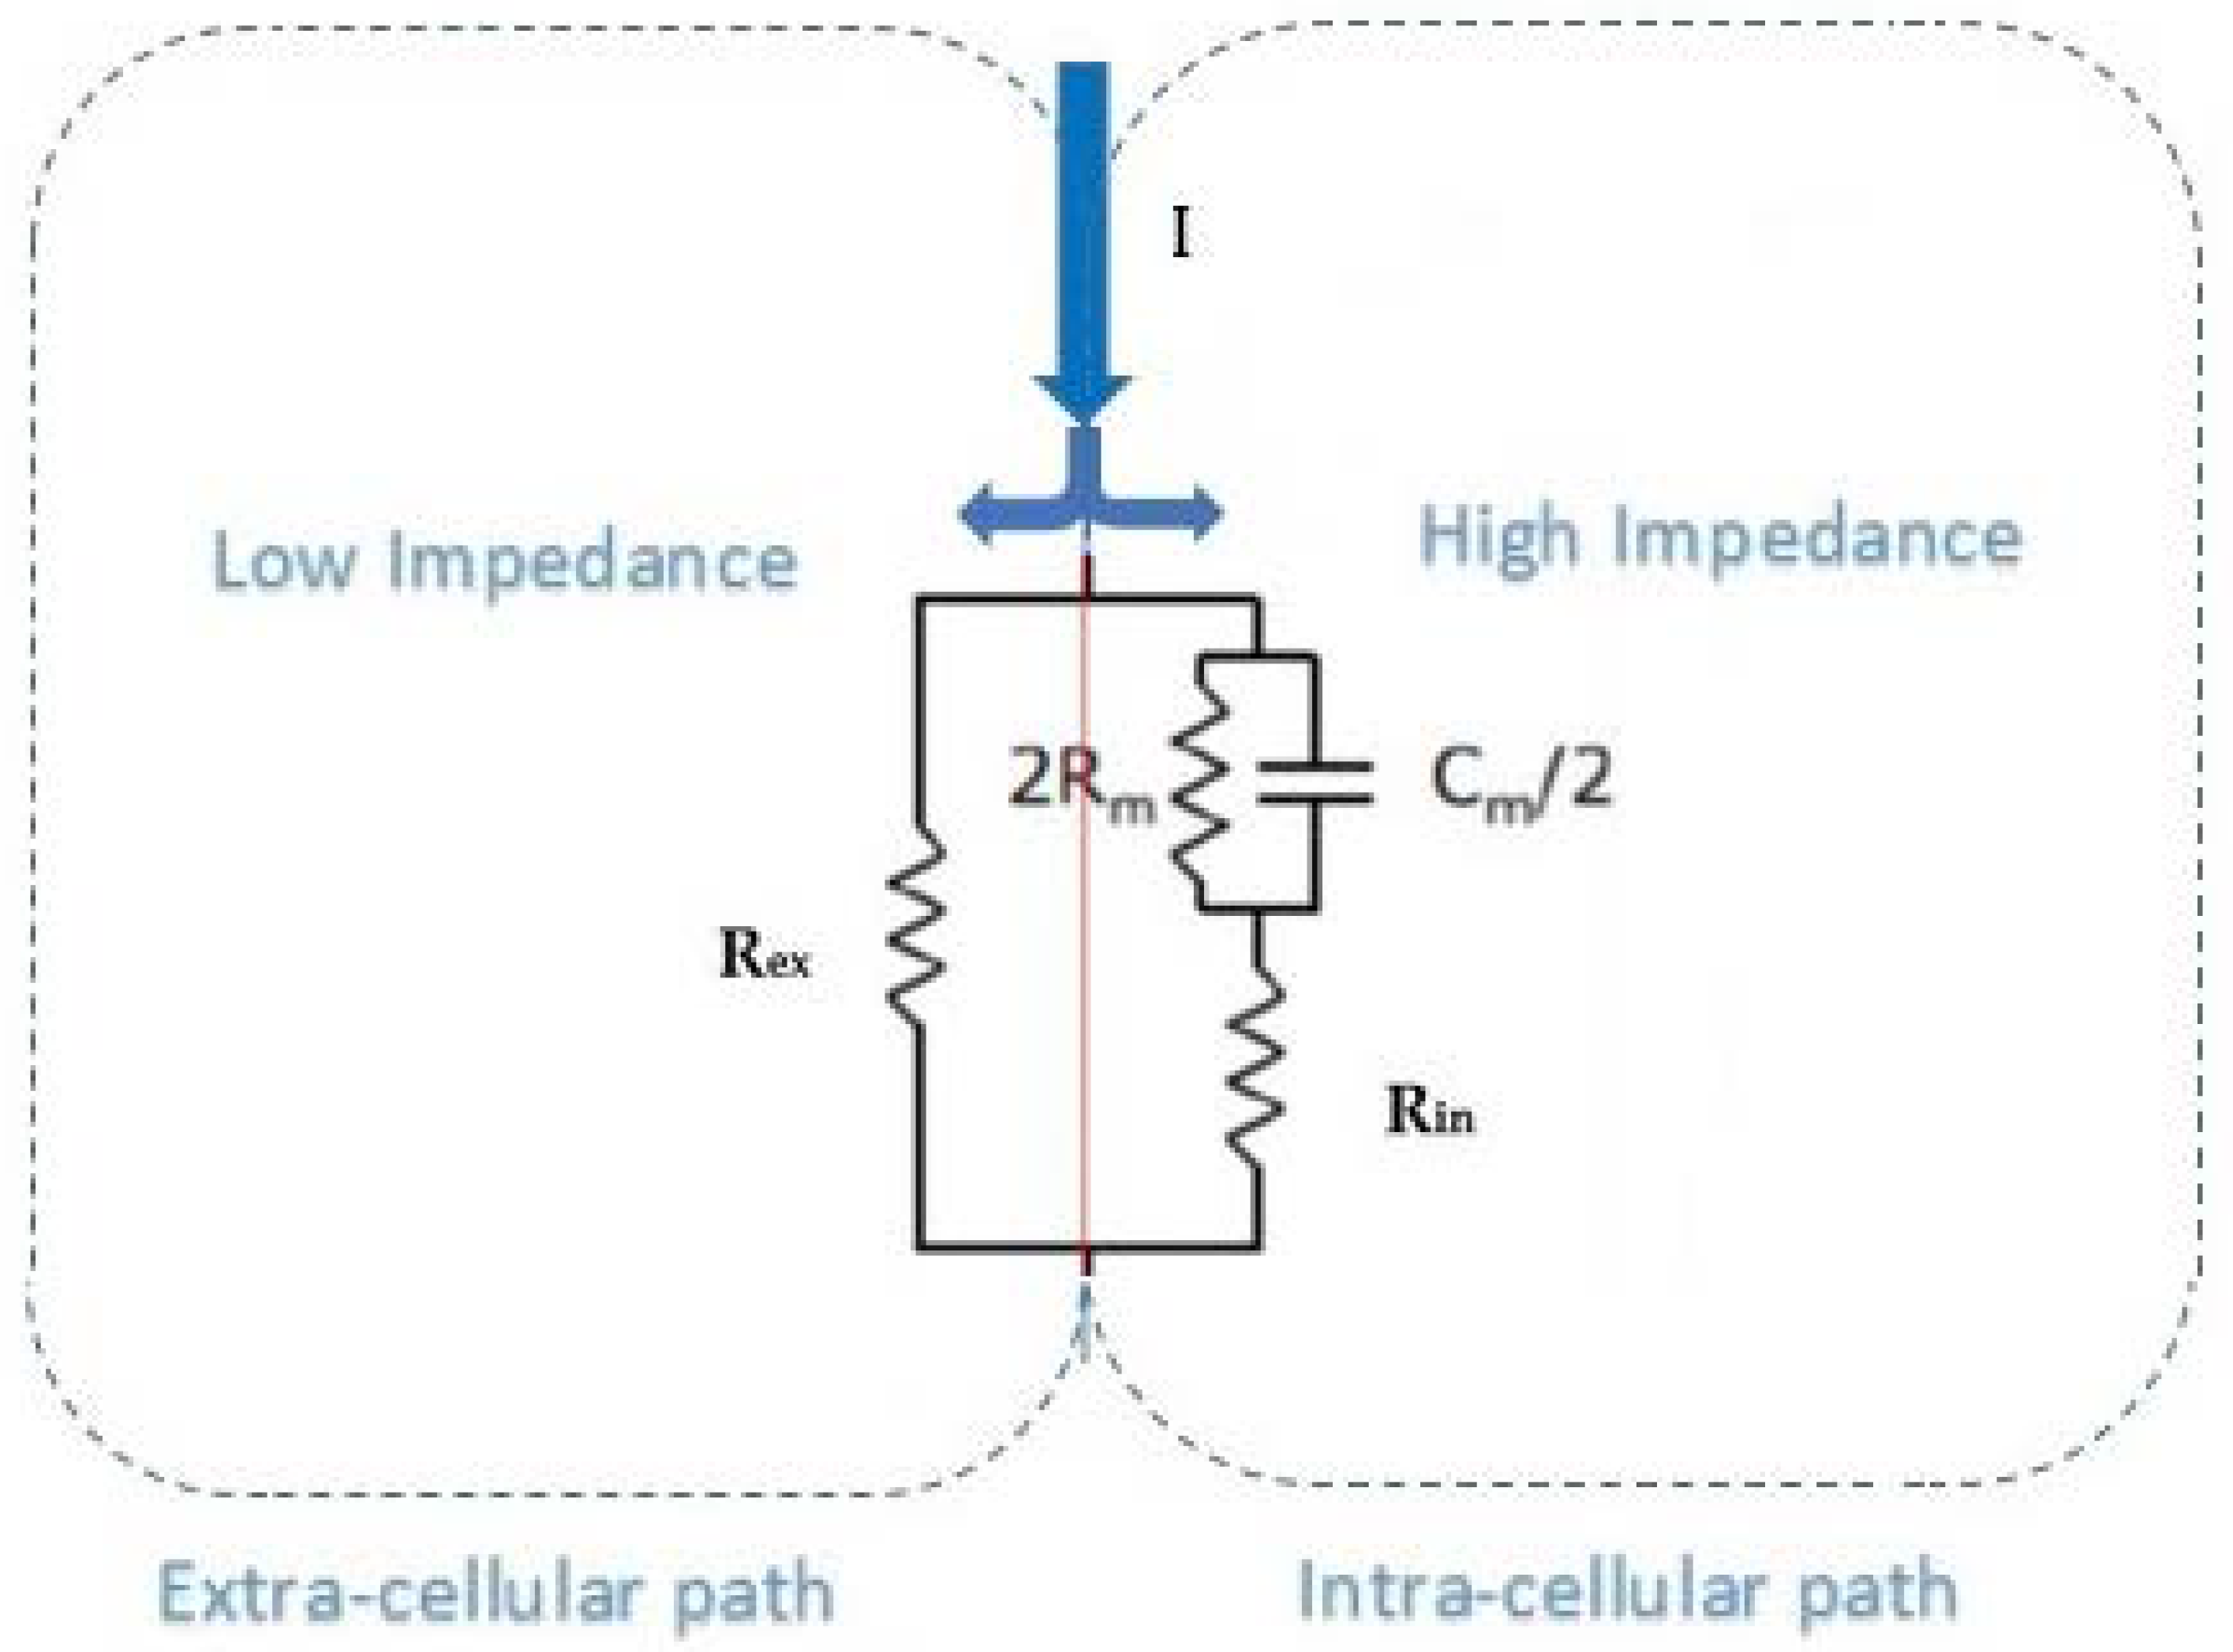
  • The total volume contained inside the leg ankle considered is VT. From geometrical view in Figure 2, a standard r_leg value can be considered for VT calculation. It was chosen to be 4 cm for the first evaluation. A height value of 6 cm is set. This volume is the contribution of the extracellular (Vex) and intracellular (Vin) contributions,
    VT = Vex + Vin
  • When low frequencies (frequency approach to zero) are considered, the equivalent resistance of the volume under test in the leg is given by Rex. This is because all current lines of electric field travel through the extracellular liquid between electrodes 2 and 3, and none through intracellular paths due to the high impedance of cell membrane resistances and capacitances (Rm, Cm).
  • Extracellular fluid is considered to be 1/3 of total body fluid in the human body. It can be considered a good approach that 37.5% of the volume in the human body is due to extracellular fluids.
  • The calibration system is based on a basic cylinder of r_leg = 4 cm, and h = 6 cm. This volume contains an extracellular volume, Vex, due to extracellular liquids, mainly composed by water, and an intracellular volume, Vin, due to tissues and intracellular liquids. Our approach considers that increments in VT are due to increments in Vex, as a consequence of liquid accumulation, maintaining constant the Vin contribution. For this case: VT = 301.10 mL, and Vin = 188.44 mL for the calibration.
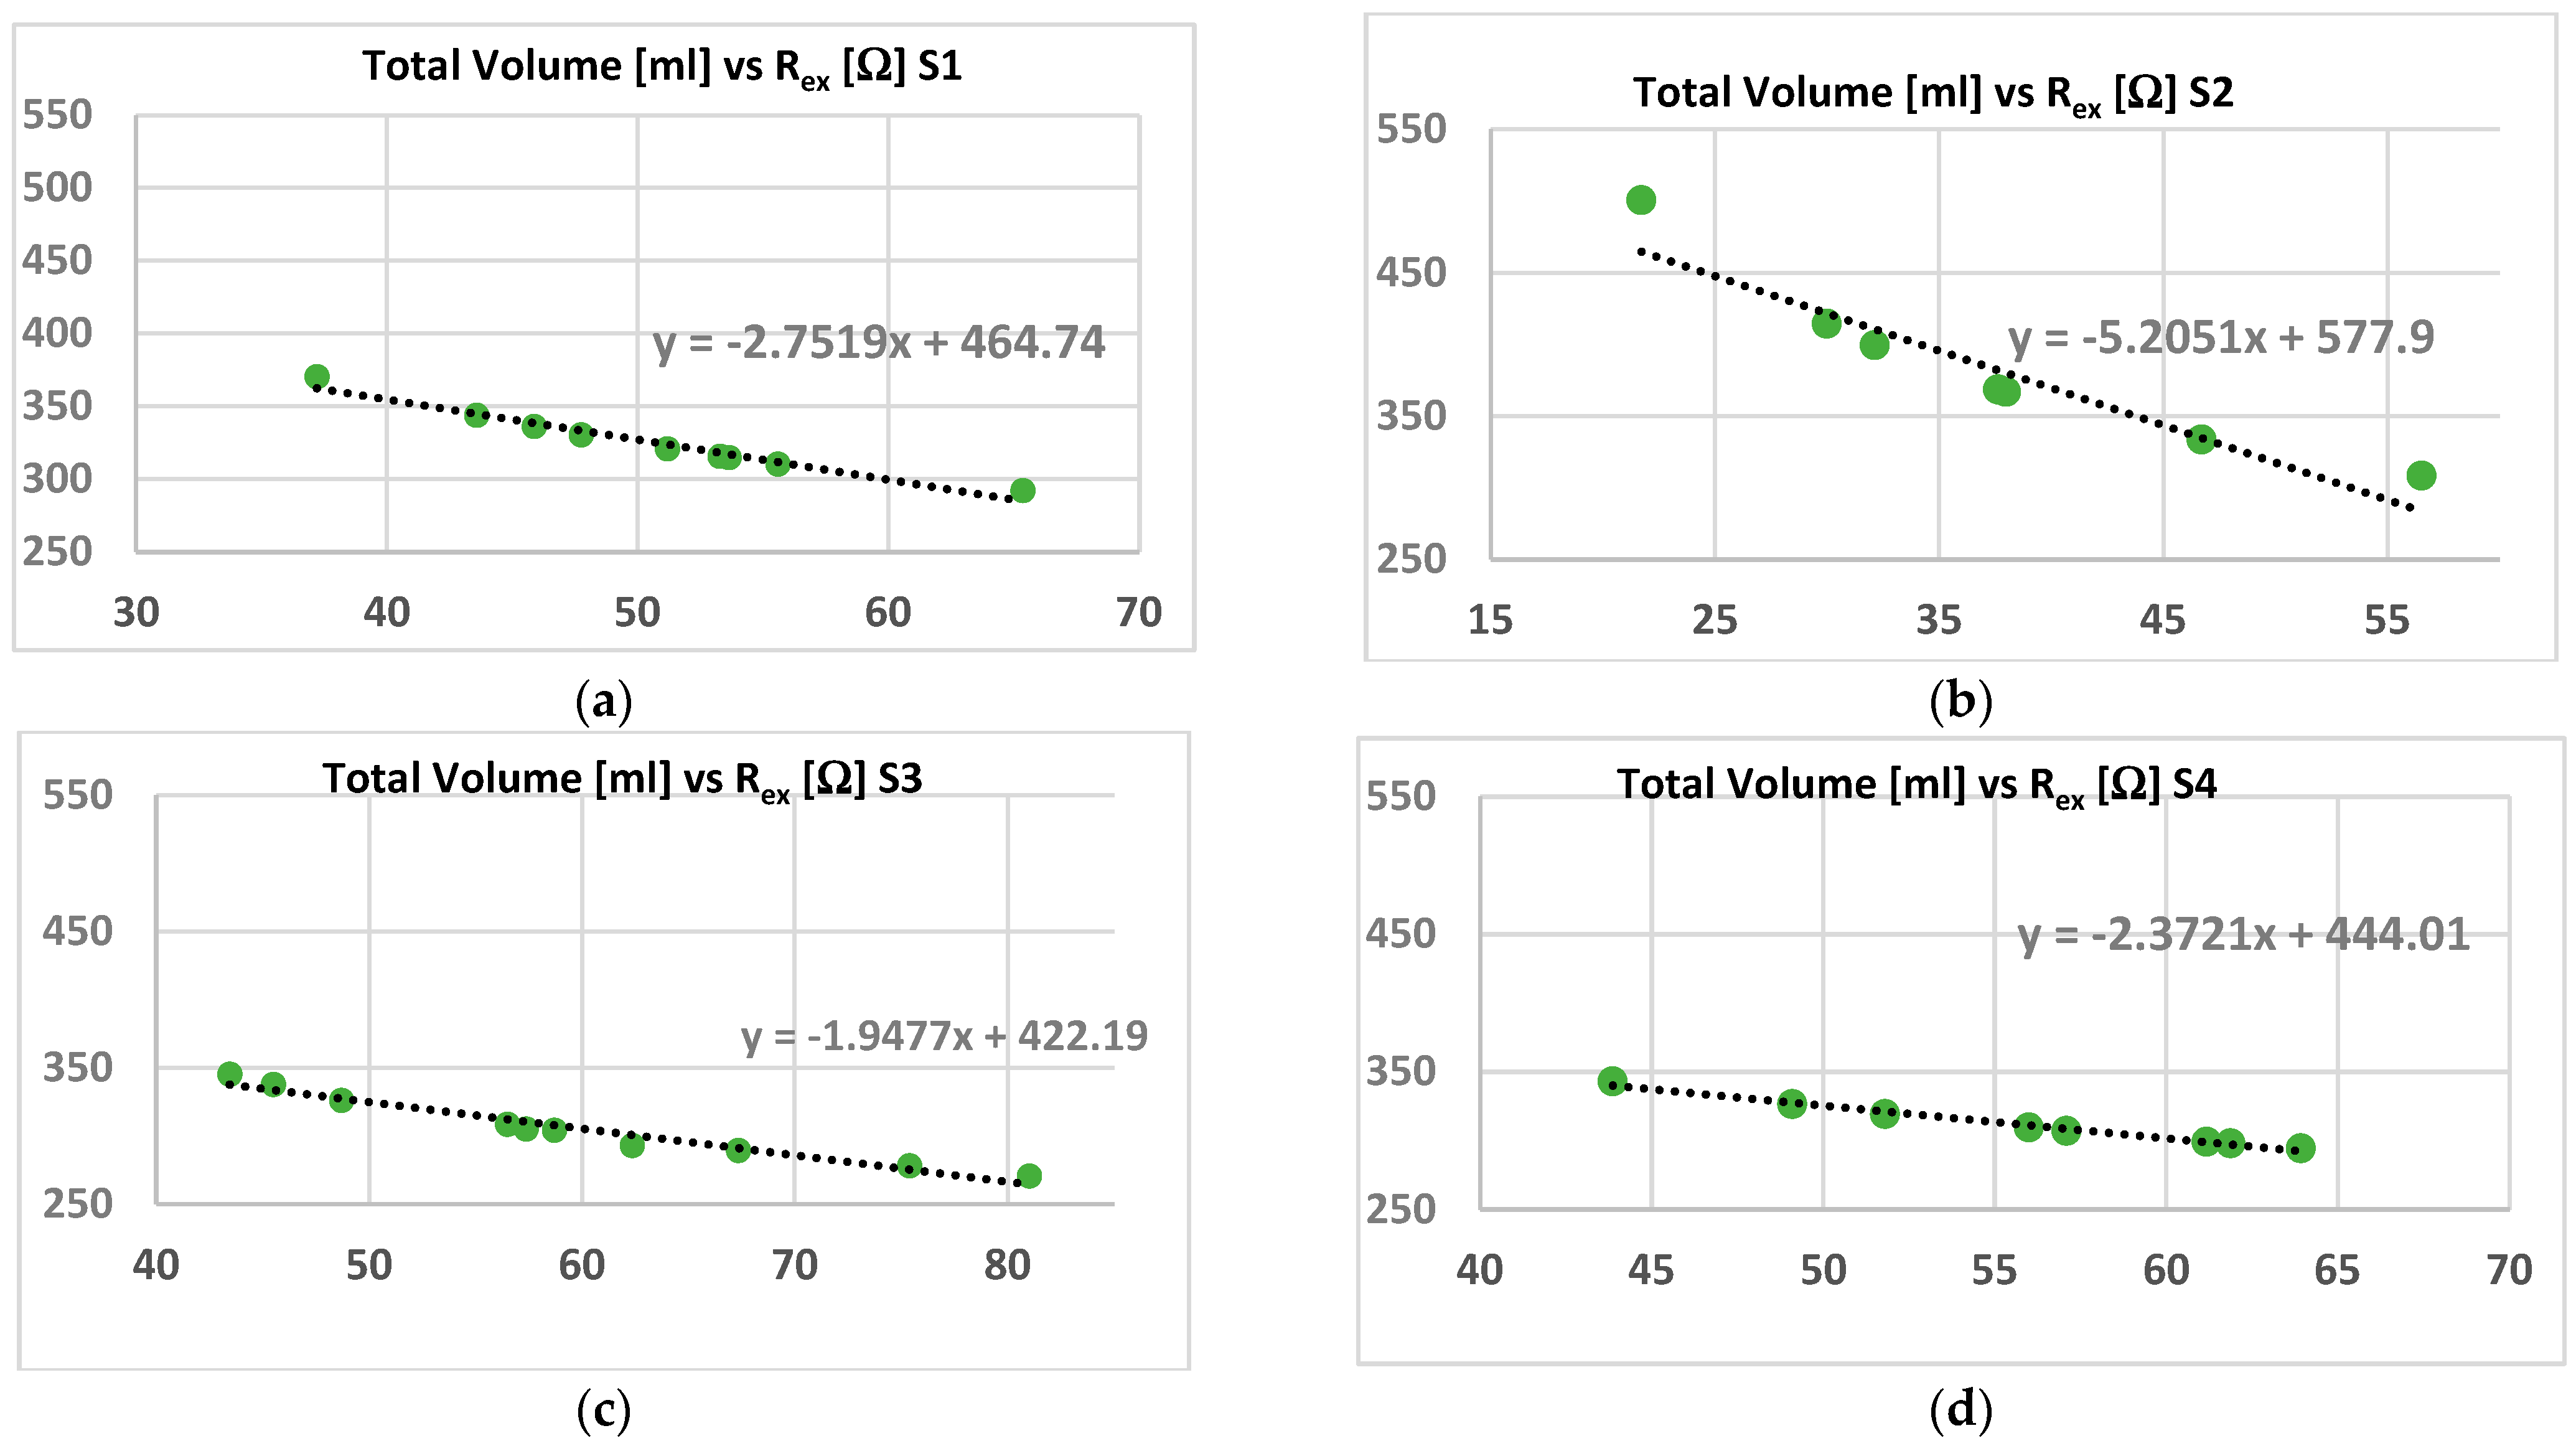
  • It is considered the dependence between resistance and volume given by:
    Rex = k/Vex
    where k is a constant that includes the conductivity parameter (σ) and the geometry factors [40]. The values of the extracellular volume due to fluids’ (water) variations can be estimated by knowing the extracellular resistance. This can be considered a relationship between Rex and Vex for low frequency conditions, being Vin constant in these cases.
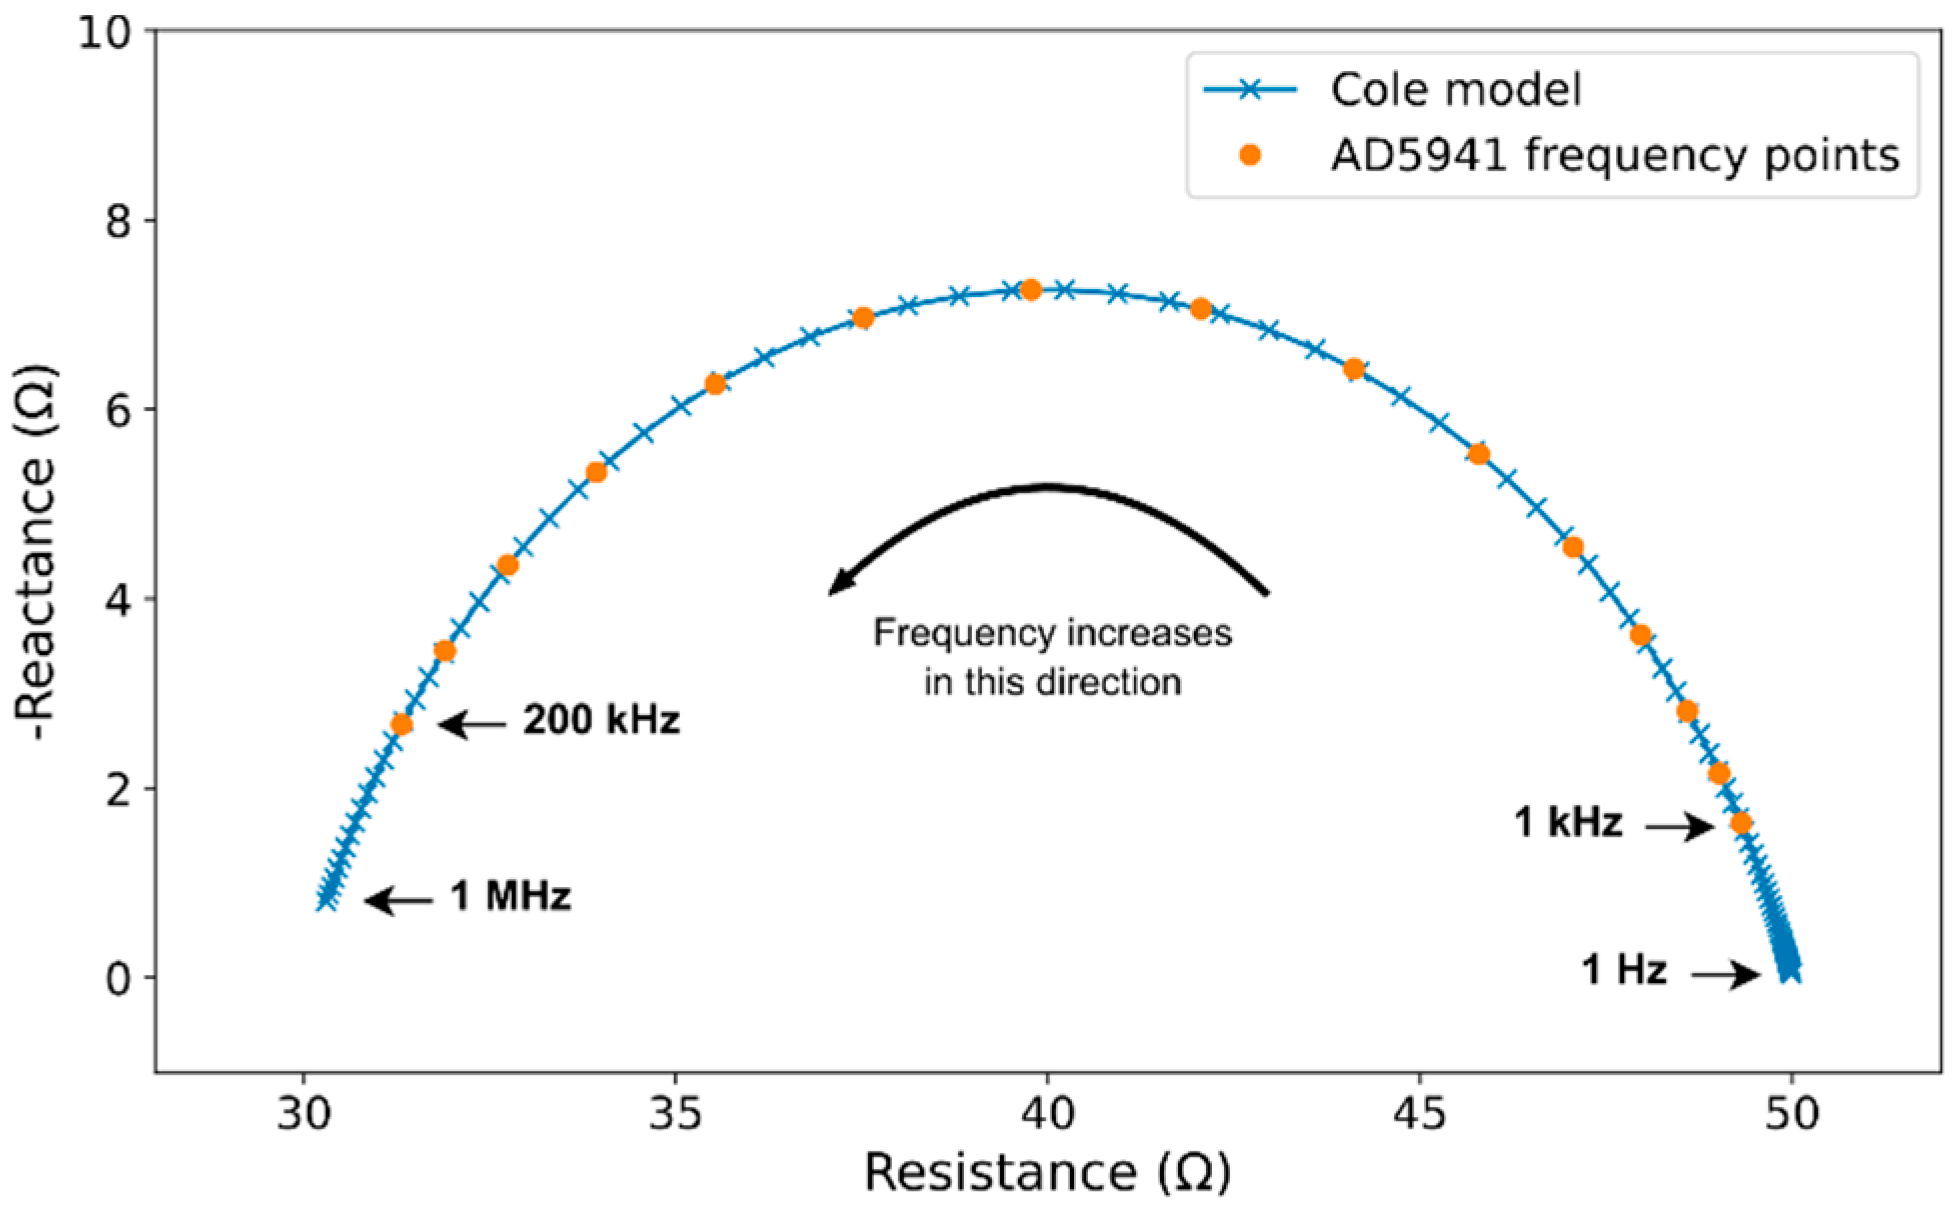
  • The Rex and Rin resistances can be calculated from the Cole–Cole parameters as:
    Rex = R_0
    Rin || Rex = R_inf
These considerations allow us to know an approximated value of the leg volume under test and its corresponding part due to extracellular fluids. In this way, calibration using a test point can be done to further evaluate extracellular volume and leg radius changes. This initial test point for calibration will be considered for a healthy person, with the calibration data guided by the approach related before. Other values for r_leg and test points and subjects can be considered from the beginning, but the final objective is to have a constant reference: the calibration volume related with a test point of a healthy subject for calibration constant calculation (k).

3. Results

To test the proposed method in Section 2.6, measurements of bioimpedance were done in two groups of study: healthy subjects (controls) and patients with acute decompensation of preserved ejection fraction heart failure (hereinafter referred to as HF patients). Four controls and two HF patients were tested during a week. Baseline characteristics of each group are depicted in Table 1. Measurements were obtained twice a day (morning and evening). The bioimpedance was tested in leg patients with the VOLUM prototype, obtaining magnitude and phase (real and imaginary) components in the 1 kHz to 200 kHz frequency range. The data were processed to obtain first the Cole–Cole parameters associated with each measurement: R_0, R_inf, τ, and α. Figure 8a represents the Wessell diagram corresponding to measurements of the S3-MM. Similar evolution was found in the others’ time tests for healthy people. When testing HF patients, the Wessel diagram changes its shape as a consequence of water increments in the leg being quite abrupt, confirming the high dependence with water composition in the leg for S5-LM in Figure 8b. It can be observed that arc shape is maintained for healthy persons, while in HF patients, a large slope is caused by the liquids’ excess, which is mainly water.
The results in Figure 7 are processed to obtain the Cole–Cole model parameters. This was done using matlab and the fitting function: fitnlm(Tbl, modelfunZ, beta0). These parameters can change from day to day, depending on the BI answer obtained from the legs. The calibration procedure was applied first to healthy subjects, and then HF patients were evaluated.

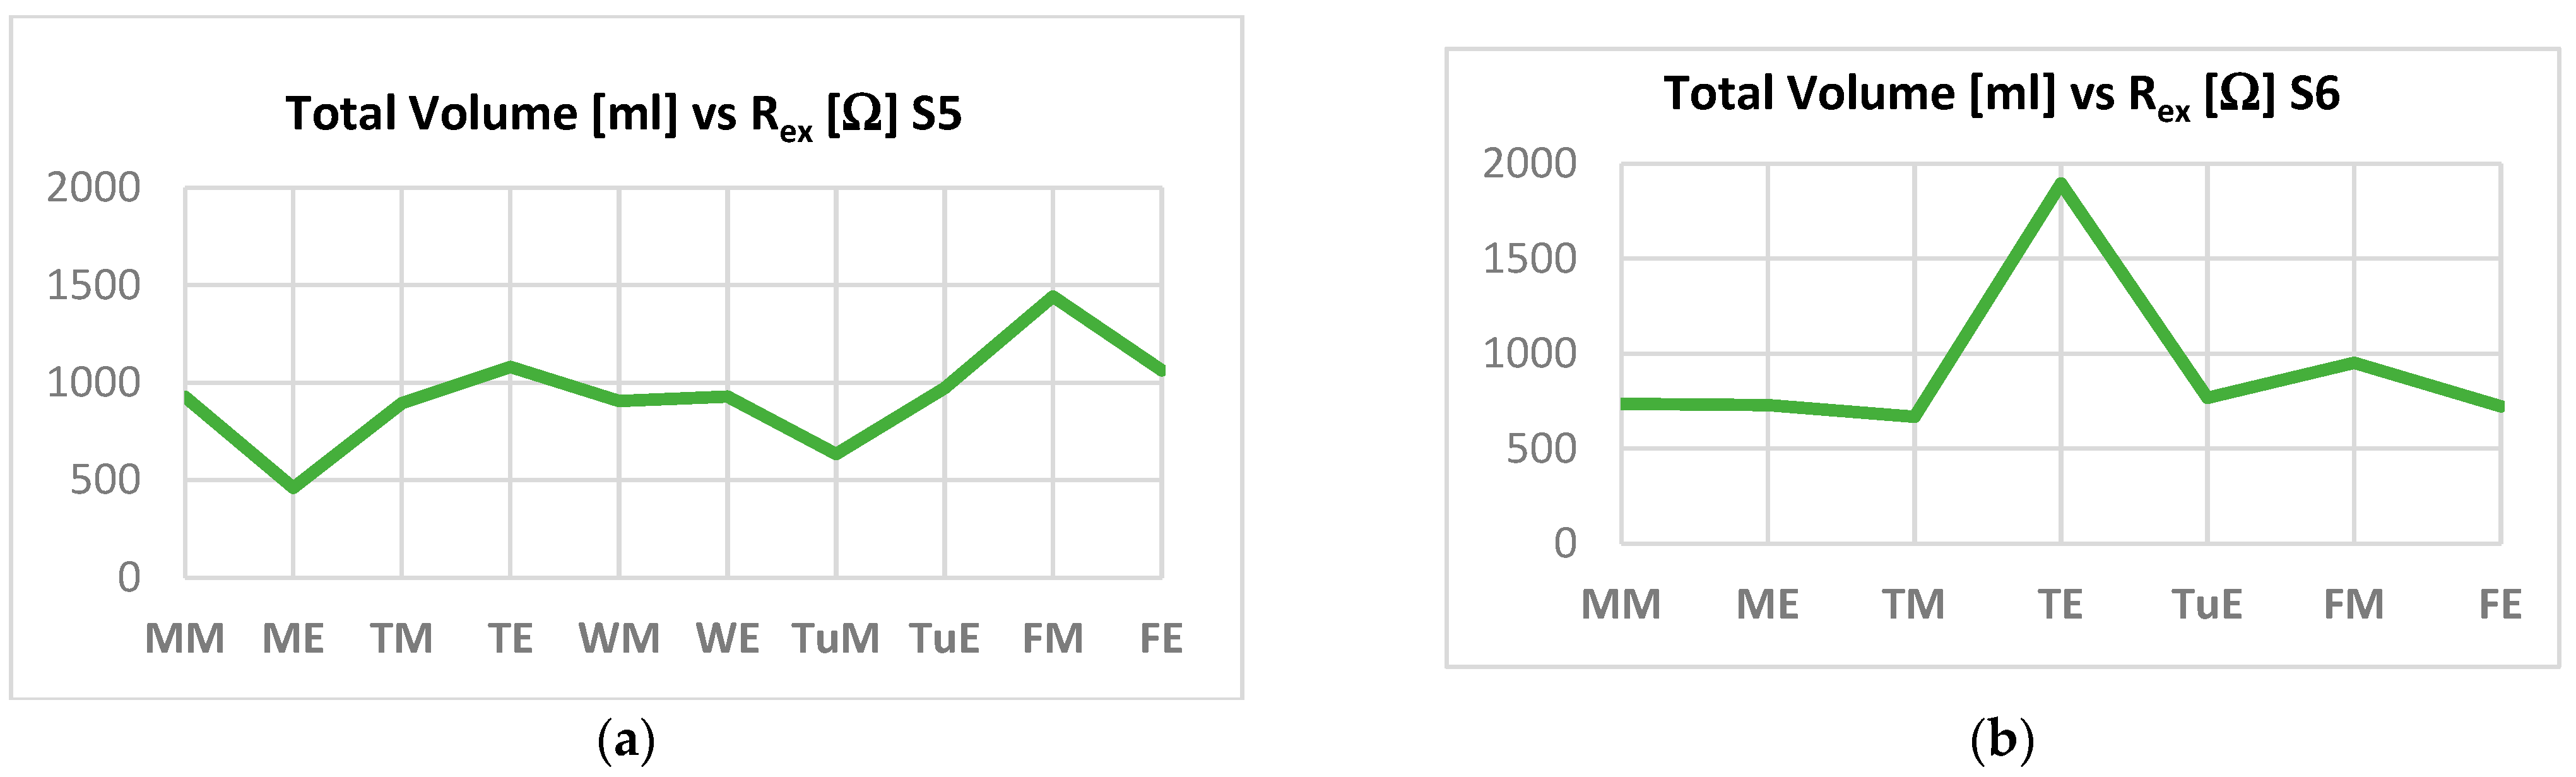
3.1. Healthy Patients

Table 2 represents the Cole–Cole parameters R_0 and R_inf obtained for S1 to S4 along the week. It can be seen how changes are observed from day to day, and from morning to evening, as a consequence of the circadian rhythm resulting from the metabolism activity. In some cases (na), the calculus was not possible for the corresponding parameter. From Table 2, the Rex and Rin values are calculated using Equations (4) and (5) in Table 3. Our approach associated the Rex value with the extracellular liquids. In particular, we suppose that extracellular liquids (Vex) in the leg are inversely proportional to Rex, as shown in Equation (3). Considering the S3 MM test point, the value of the calibration constant is k = 6776.87 mL·Ω. This will always be employed in Vex calculus, with the Vin value calculated before. The not available (na) data in tables come from artifacts in the test, and also from the impossibility of fitting the Cole–Cole model in Equation (1) to raw data.
Figure 8a–d shows the volume evolution along the week for healthy subjects. Also, total volume, VT, versus Rex (R_0) is shown in Figure 9, giving sensitivity values that express how many milliliters change the leg volume for every ohm of change in Rex resistance measure. For each subject, the volume to the extracellular resistance ratio can be calculated for the corresponding curves. The slopes obtained are in the range of [−1.94, −5.20] mL/Ω. These values are representative for each person, but are quoted for all of them. Also, an estimation of the leg radius evolution in time can be easily derived from volume values, if required.

3.2. Heart Failure Patients

The same calibration process has been done for two HF patients. In this case, the Wessel diagram shows a more shaped dependence, sometimes being complex in its mathematical fit. The volume estimation obtained is displayed in Figure 10. The increment from healthy persons can be appreciated in Figure 8. Also, the sensitivities obtained in Figure 11 are larger at −41.47 mL/Ω and −122.44 mL/Ω, respectively, than that calculated for healthy persons.

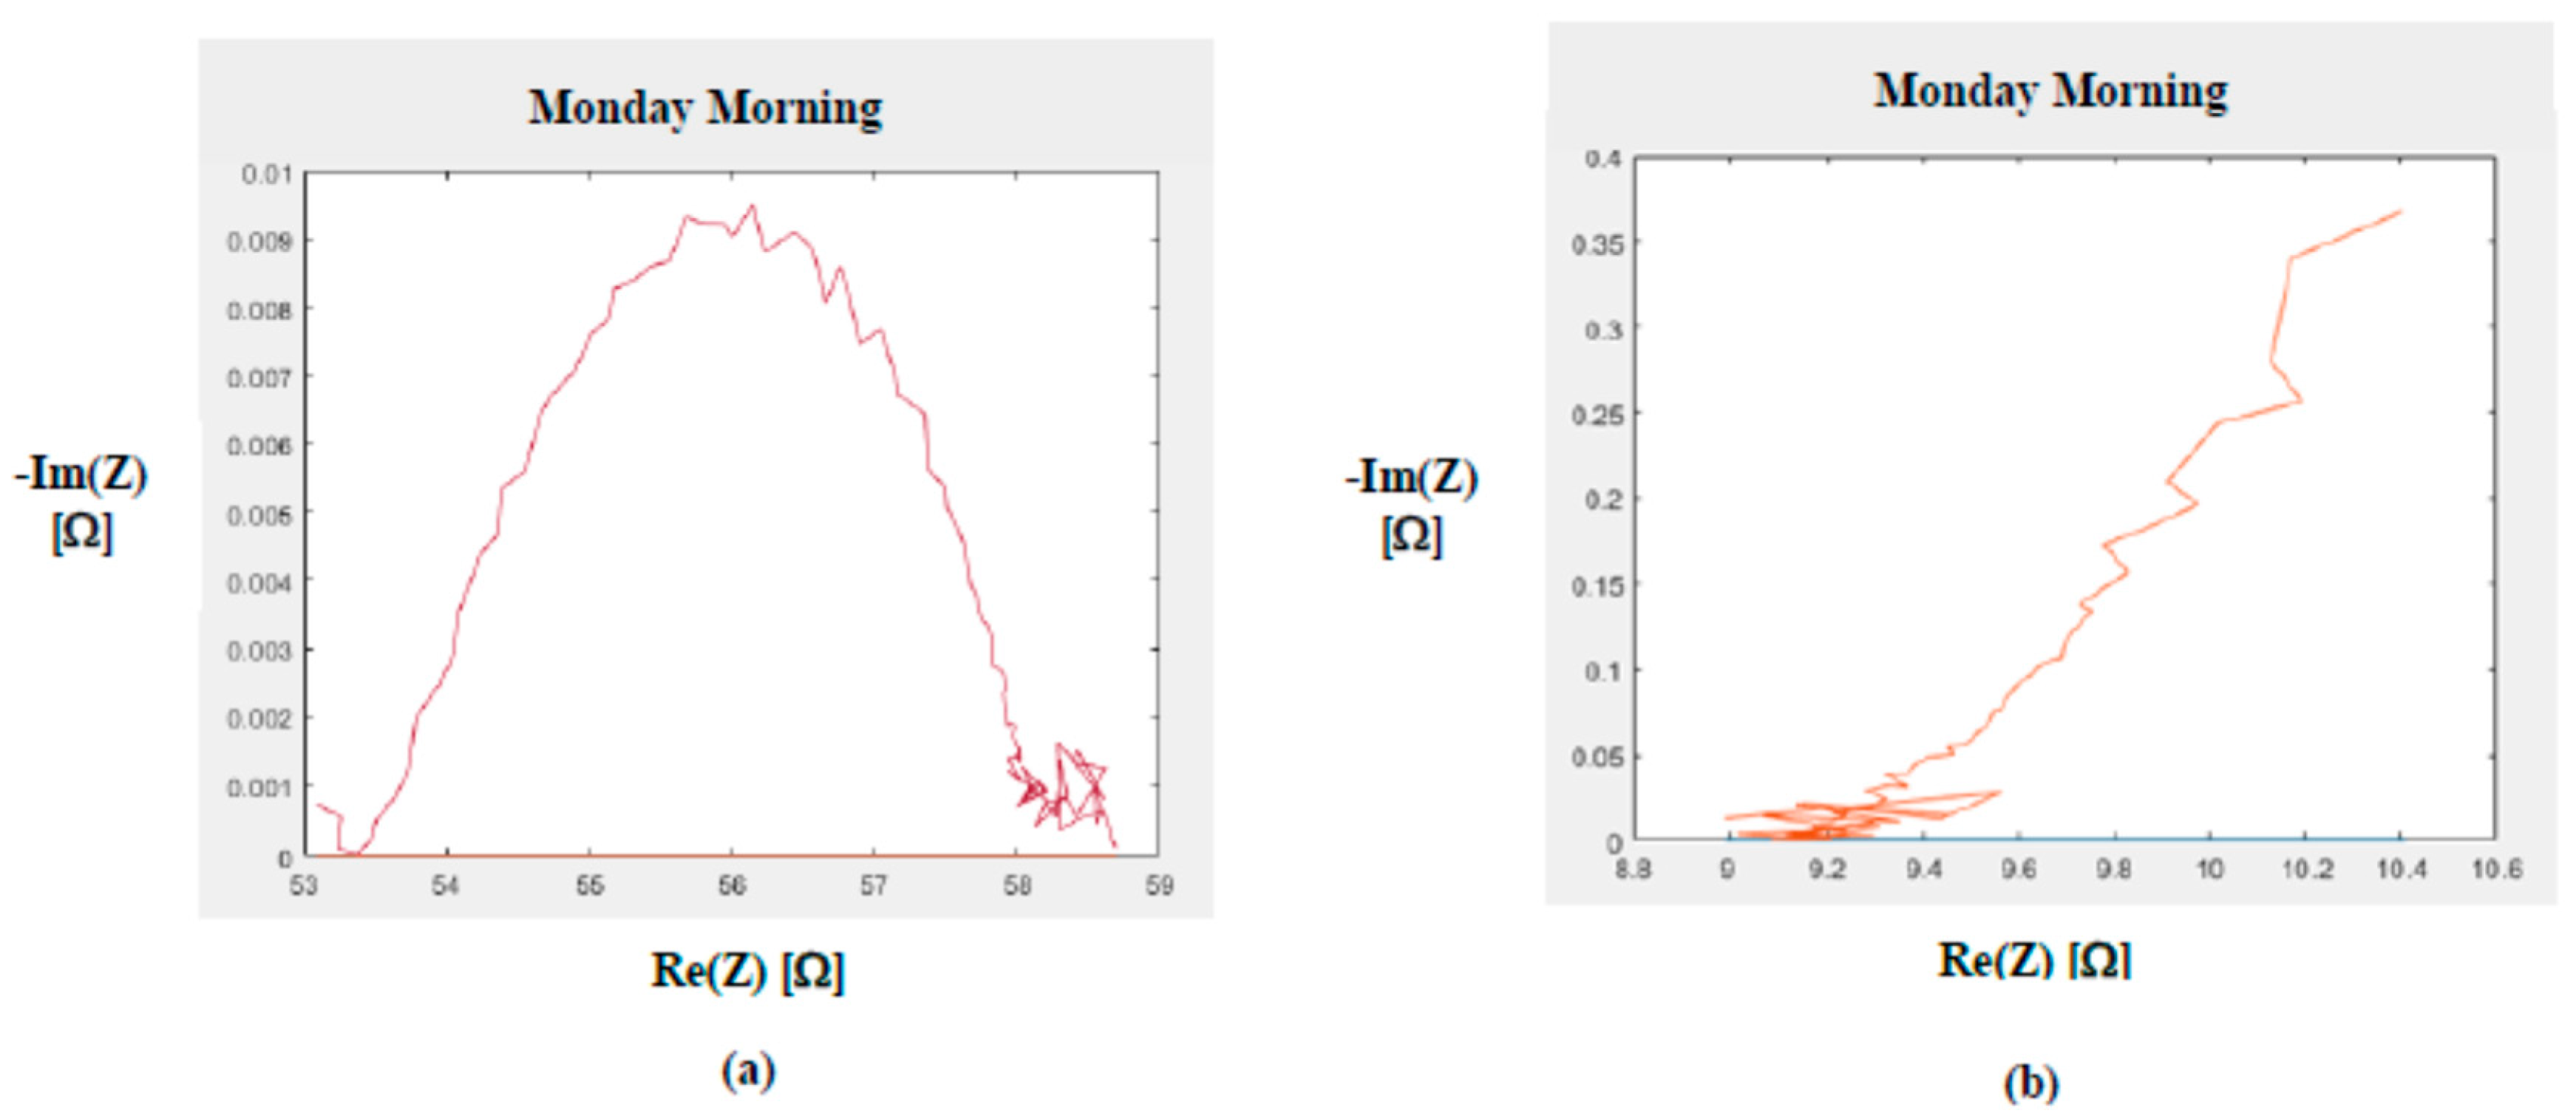
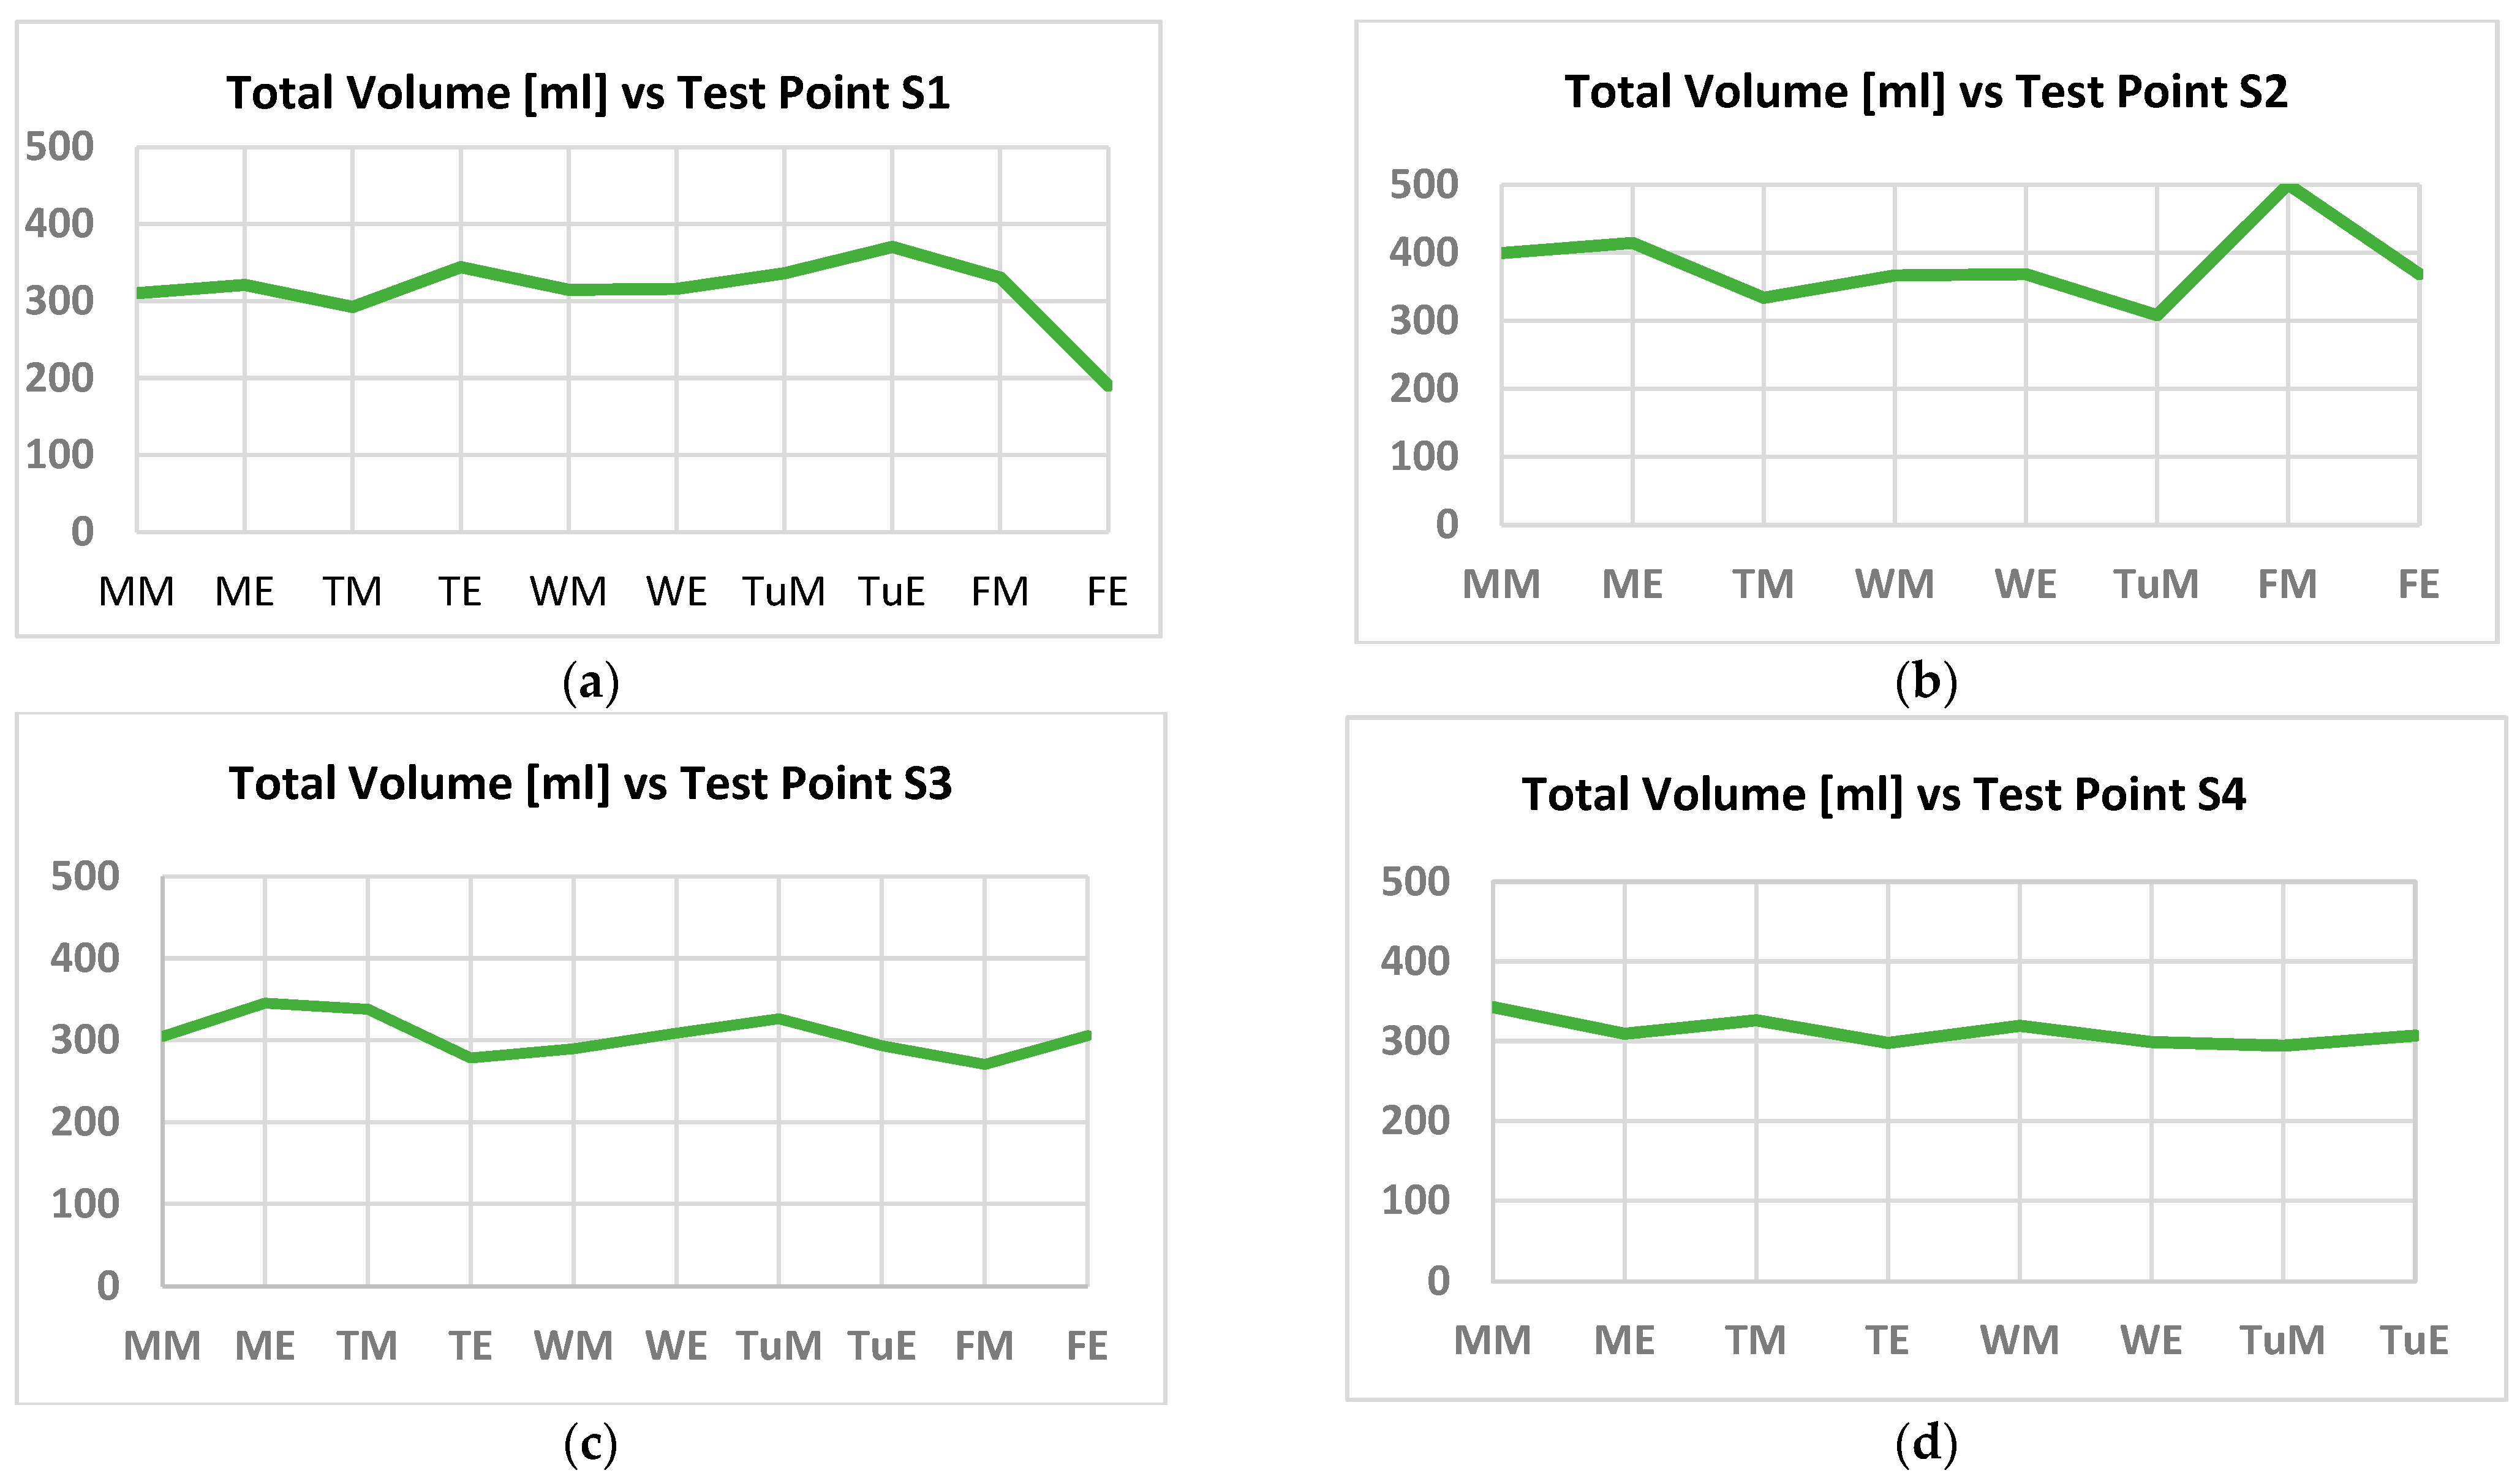
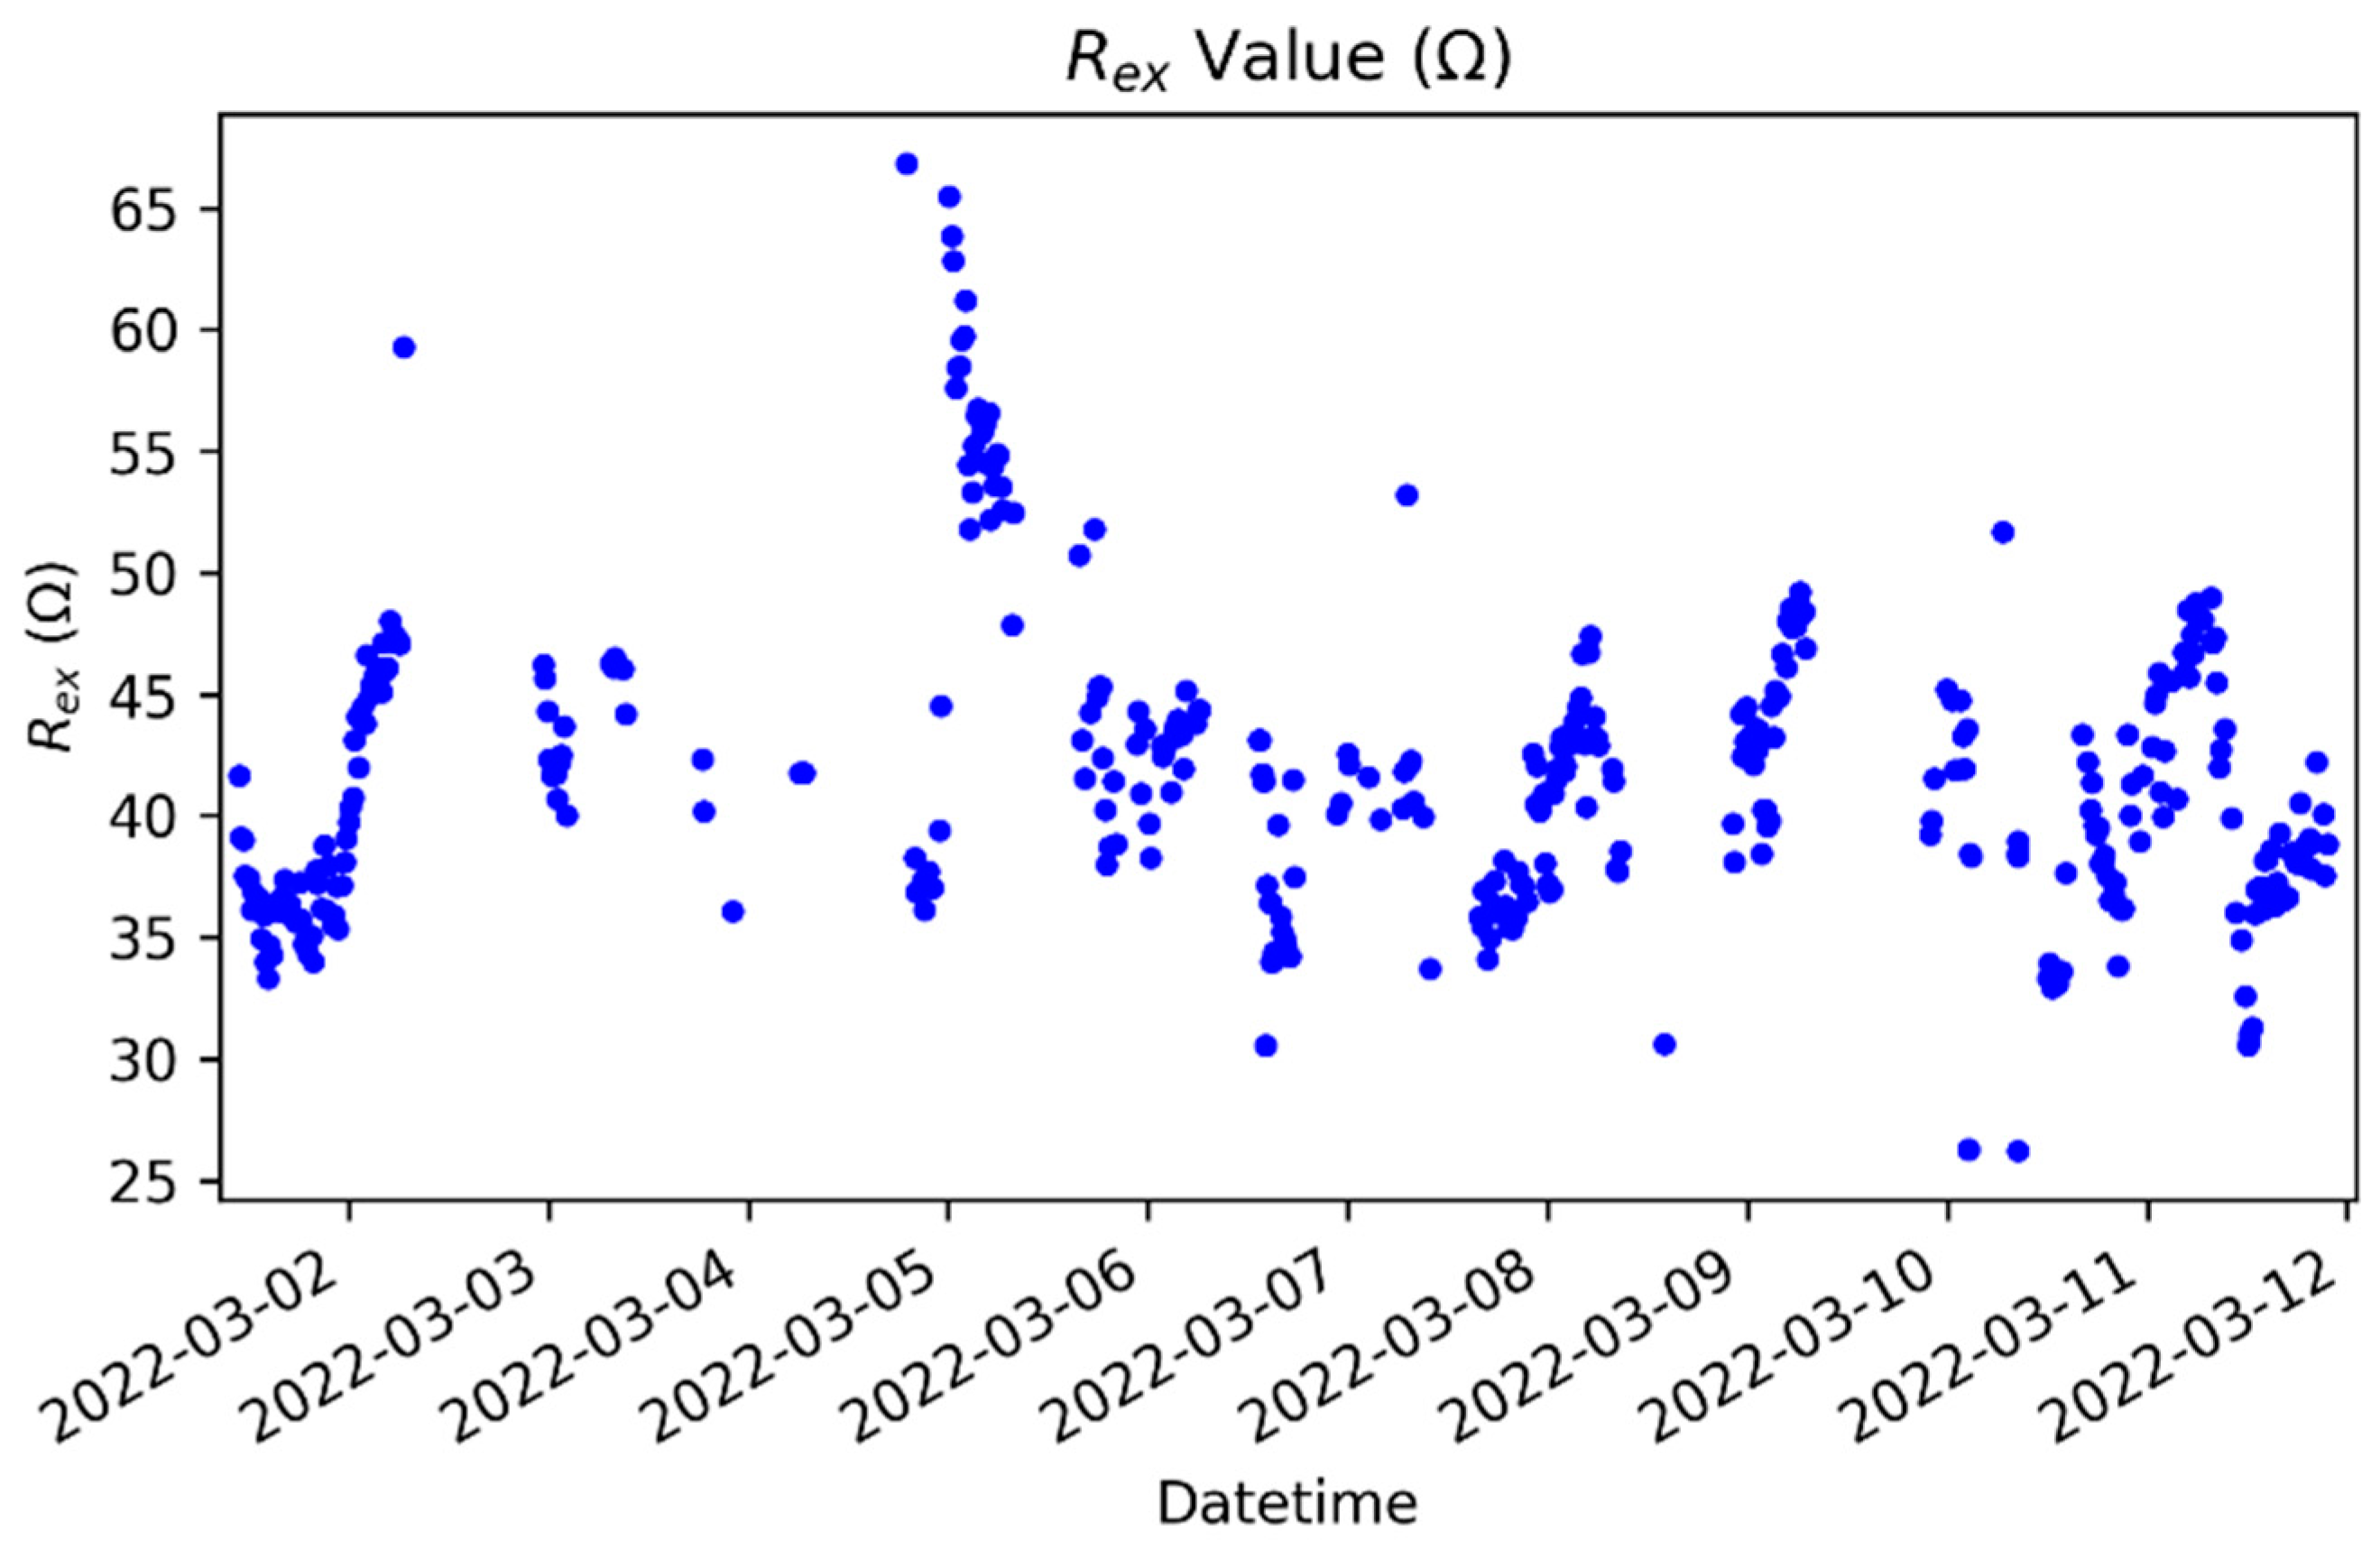
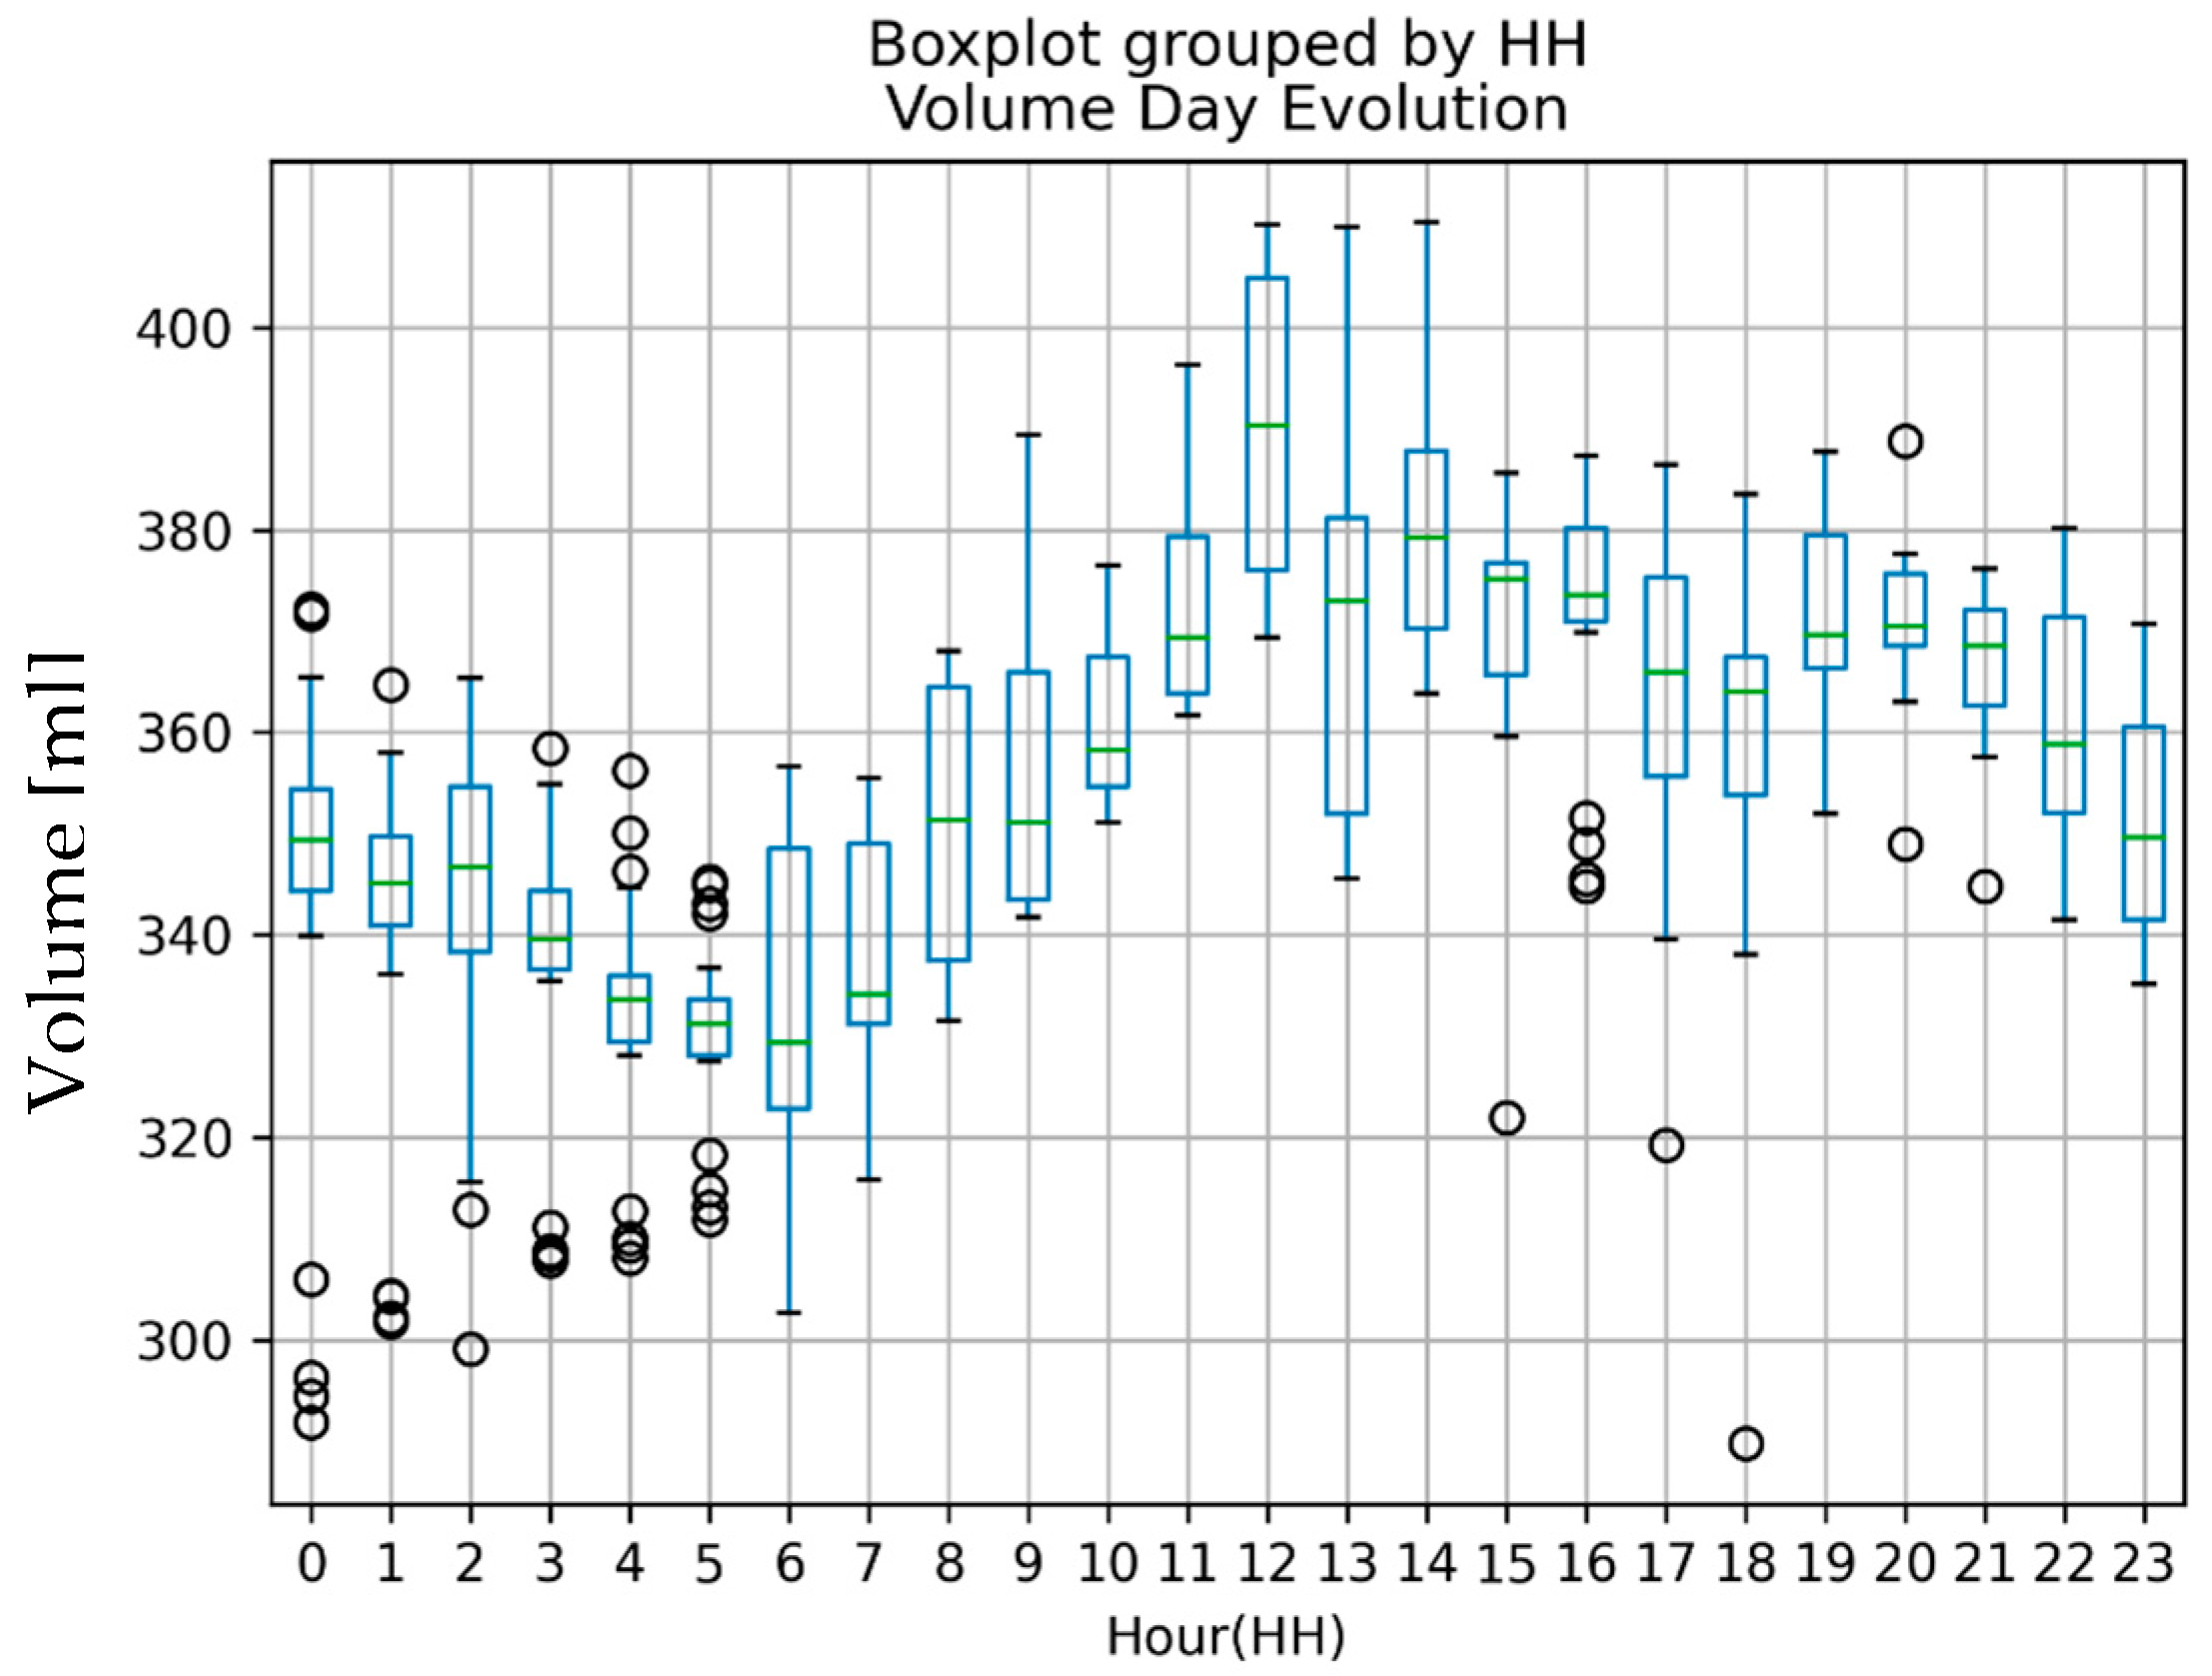
3.3. Continuous Time Test

The first prototype is being improved in a second version to be fully wireless and wearable. With this prototype, parallel bioimpedance measurements were done and prolonged for a continuous time along ten days. Measurements were done every 15 min for the subject being tested and picked up to a web database for processing and monitoring. The first test that was done in a healthy patient provides his/her Rex time evolution, and the total volume associated with the procedure is explained before for the volume calculus. Figure 12 shows the extracellular resistance obtained during the experiment. It must be considered that sometimes, the measurements cannot be correctly done due to the normal activity of the subject, or due to some kind of artifact (position, movement, knock, etc.). The volume information is summarized in Figure 13, where the circadian rhythm of the total volume (VT) is represented, considering the instantaneous, mean, and standard deviation values of volume for the same instant in a day. It can be appreciated how there are two significant regions: a charging region, from 6 to 14 h approximately, and a discharging region, which starts at 14 h and is prolonged until 6 h on the next day.

4. Discussion and Conclusions

The main goal in this paper is to collaborate towards the real-time monitoring and supervision that technicians want to perform on acute HF patients, once they leave the hospital after a stroke episode. Indeed, there is no way to implement this task, as it is only possible to make periodic medical revisions and tests at hospitals. The wearable device described in this paper allows this objective by introducing the Bio-Impedance test as a biomarker that enables the measurement of the water accumulated on the chest and legs as an excellent test for HF patients with healthy or unhealthy status. The main contribution of this paper is the proposal of a new procedure for system calibration that allows us to convert the impedance values measured to volume estimation for patients, which answers the main question proposed by technicians: is the leg volume of the patient constant, decreasing, or increasing?
Up until today, most of the works presented for volume estimation in acute HF patients are focused on measuring the liquids variation at the lungs’ zone, but very few references for leg volume estimation have been proposed. Perhaps, the total water excess is big in the case of the chest, but its measurement using a wearable device is more difficult and uncomfortable. In 27, the accumulated water in the chest was characterized versus the impedance using a four-wires system, including an ASIC (Application Specific Integrated Circuit). Sensitivity curves were obtained (volume versus impedance in the chest) using 50, 100, and 150 kHz frequencies, with few patients, along with trying to evaluate the Total Water (TW: intra- and extracellular water). In this case, high frequency was used for testing, under the hypothesis that in this test, all the water can be measured (intra- and extra vascular components) in the body. In our approach, we consider that water excess is accumulated outside the cells and tissues, so a low frequency test seems to be the most relevant approach. From the calibration process, in 27 were obtained sensitivities from 250 mL/Ω to 2000 mL/Ω in the chest, using the volume measured externally by other medical procedure. These values are larger than obtained by us (41 to 122 mL/Ω) at the legs, done for a lower frequency (DC), by proposing a procedure for the calculus of the extracellular volume in an ankle that does not need an alternative volume or medical test. These values are not fully comparable because of the different setups and the body zone involved. The medical team points out that water accumulation is produced mainly at the extracellular region, outside the cells and tissues, with low frequencies being better for detection changes in acute HF patients. A portable device for ankle edema detection is described in 39 which looks for extracellular and intracellular water change characterizations by defining the ratio between 100 and 5 kHz impedances, as a way to obtain a figure of merit to describe the full frequency response. Results are promising, detecting edema changes, and needing more experimental tests and validation, mainly real-time observations of unhealthy patients and a quantitative estimation for the sensitivity changes. In [43] a wearable device is proposed for human body hydration assessment based on BI which proposes the measure of TBW placing electrodes between both forearms. The results delivered show measurements done for all frequency ranges (8 to 160 kHz) in discrete test points, with a sensitivity of 700 mL/Ω when calibrated with hydration values from the medical test. The authors suggest an improvement of the device’s ambulatory reliability and the performance of a daily test. Other works look for TBW estimation, employing large and hard equipment, which is not valid for the continuous monitoring of patients using a wearable approach proposed in this work, such as the original references from Hoffer in [40].
In conclusion, this work presents an alternative method for calibration BioImpedance Spectroscopy (BIS) measurements obtained in the legs that allows the volume estimation. The convenience and feasibility of the bioimpedance test has been justified based on wearable devices for real-time supervision of acute heart failure patients as a useful method to control their evolution when there is not any practical alternative option for physicians. The procedure is based on the hypothesis that extracellular fluid is mainly responsible for volume increments in HF persons, which agrees with most of the authors in the field. It was experimentally demonstrated that the bioimpedance is directly related with the volume in the leg for both healthy and heart failure subjects. It was verified that our calibration method allows the identification of volume changes with impedance measurements thanks to the extracellular resistance derived from the Cole–Cole model, enabling a way for future real-time monitoring with wearable devices for HF patients. Sensitivities obtained for healthy patients are lower than the corresponding sensitivities of unhealthy ones, in a factor of 20–30 times, being a useful marker to identify poor evolution from a healthy starting point. The calibration method based on low frequency impedance values extracted from the Cole–Cole model should be confirmed, because it is based on the hypothesis that intracellular volume in legs is nearly constant. A more exhaustive clinical evaluation must be done for full validation in HF patients, in particular, those who make a daily life after an acute HF episode. This will allow us to prevent a possible infarct by monitoring its volume evolution over time. Circadian volume at the ankle tested has also been reported for healthy people, showing the one-day time evolution derived from natural body activity. This last point represents the target for the present work as a method for real-time supervision of patients by the medical team, in which the low-power consumption, continuous control position, and reliable wireless connectivity will be the main technological challenges.

Author Contributions

S.F.S., L.G., P.P. and F.J.M.: data acquisition on patients; S.F.S., A.O., G.H., D.M. and A.Y.: hardware development and test; S.F.S., A.Y., G.H. and P.P.: paper writing and editing; L.G. and F.J.M.: medical supervision and advising. S.F.S. and P.P.: software and data processing. All authors have read and agreed to the published version of the manuscript.

Funding

This work was supported in part by the Spanish Government’s Ministerio de Ciencia, Innovación y Universidades, Aegencia Estatal en Salud (AES): Real-time monitoring prognostic value of volume with BI test in patients with acute HF. (HEART-FAIL VOLUM). 2019: Instituto Carlos III. DTS19/00134 and DTS19/00137. Also, by the Project: Prototipado y Ensayo Clínico del nuevo dispositivo portátil HF-volum para la monitorización en tiempo real de volúmenes en pacientes con insuficiencia cardiaca (PRECLI-HF). Plan Andaluz de Investigación, Desarrollo e Innovación (PAIDI 2021), Ref: PAIDI AT21-00010-USE.

Data Availability Statement

All the experimental data are measured from people supporting the project. Due to the nature of this research, participants of this study did not agree for their data to be shared publicly, so supporting data are not available.

Conflicts of Interest

The authors declare no conflict of interest.

References

  1. Tanai, E.; Frantz, S. Pathophysiology of Heart Failure. Compr. Physiol. 2015, 6, 187–214. [Google Scholar] [CrossRef]
  2. McMurray, J.J.; Pfeffer, M.A. Heart failure. Lancet 2005, 365, 1877–1889. [Google Scholar] [CrossRef] [PubMed]
  3. Braunwald, E. Cardiovascular Medicine at the Turn of the Millennium: Triumphs, Concerns, and Opportunities. N. Engl. J. Med. 1997, 337, 1360–1369. [Google Scholar] [CrossRef]
  4. Dharmarajan, K.; Rich, M.W. Epidemiology, Pathophysiology, and Prognosis of Heart Failure in Older Adults. Heart Fail. Clin. 2017, 13, 417–426. [Google Scholar] [CrossRef] [PubMed] [Green Version]
  5. Vos, T.; Allen, C.; Arora, M.; Barber, R.M.; Bhutta, Z.A.; Brown, A.; Carter, A.; Casey, D.C.; Charlson, F.J.; Chen, A.Z.; et al. Global, regional, and national incidence, prevalence, and years lived with disability for 310 diseases and injuries, 1990–2015: A systematic analysis for the Global Burden of Disease Study 2015. Lancet 2016, 388, 1545–1602. [Google Scholar] [CrossRef] [Green Version]
  6. Groenewegen, A.; Rutten, F.H.; Mosterd, A.; Hoes, A.W. Epidemiology of heart failure. Eur. J. Heart Fail. 2020, 22, 1342–1356. [Google Scholar] [CrossRef] [PubMed]
  7. Gerber, Y.; Weston, S.A.; Redfield, M.M.; Chamberlain, A.M.; Manemann, S.M.; Jiang, R.; Killian, J.M.; Roger, V.L. A Contemporary Appraisal of the Heart Failure Epidemic in Olmsted County, Minnesota, 2000 to 2010. JAMA Intern. Med. 2015, 175, 996–1004. [Google Scholar] [CrossRef] [Green Version]
  8. Braunschweig, F.; Cowie, M.; Auricchio, A. What are the costs of heart failure? Europace 2011, 13 (Suppl. 1), ii13–ii17. [Google Scholar] [CrossRef]
  9. Stewart, S.; Macintyre, K.; Holec, D.J.; Capewellb, S.; McMurray, J.J.V. More ‘malignant’ than cancer? Five-year survival following a first admission for heart failure. Eur. J. Heart Fail. 2001, 3, 315–322. [Google Scholar] [CrossRef]
  10. Kurmani, S.; Squire, I. Acute Heart Failure: Definition, Classification and Epidemiology. Curr. Heart Fail. Rep. 2017, 14, 385–392. [Google Scholar] [CrossRef] [Green Version]
  11. Marti, C.N.; Georgiopoulou, V.V.; Kalogeropoulos, A.P. Acute heart failure: Patient characteristics and pathophysiology. Curr. Heart Fail. Rep. 2013, 10, 427–433. [Google Scholar] [CrossRef] [Green Version]
  12. Adamson, P.B. Pathophysiology of the transition from chronic compensated and acute decompensated heart failure: New insights from continuous monitoring devices. Curr. Heart Fail. Rep. 2009, 6, 287–292. [Google Scholar] [CrossRef]
  13. Ponikowski, P.; Voors, A.A.; Anker, S.D.; Bueno, H.; Cleland, J.G.F.; Coats, A.J.S.; Falk, V.; González-Juanatey, J.R.; Harjola, V.-P.; Jankowska, E.A.; et al. 2016 ESC Guidelines for the diagnosis and treatment of acute and chronic heart failure. Eur. Heart J. 2016, 37, 2129–2200. [Google Scholar] [CrossRef] [Green Version]
  14. Klersy, C.; De Silvestri, A.; Gabutti, G.; Regoli, F.; Auricchio, A. A Meta-Analysis of Remote Monitoring of Heart Failure Patients. J. Am. Coll. Cardiol. 2009, 54, 1683–1694. [Google Scholar] [CrossRef] [PubMed] [Green Version]
  15. Kitsiou, S.; Paré, G.; Jaana, M. Effects of Home Telemonitoring Interventions on Patients With Chronic Heart Failure: An Overview of Systematic Reviews. J. Med. Internet Res. 2015, 17, e63. [Google Scholar] [CrossRef] [PubMed] [Green Version]
  16. Inglis, S.C.; Clark, R.A.; Dierckx, R.; Prieto-Merino, D.; Cleland, J.G. Structured telephone support or non-invasive telemonitoring for patients with heart failure. In Cochrane Database of Systematic Reviews 2015; John Wiley and Sons Ltd.: Hoboken, NJ, USA, 2015. [Google Scholar] [CrossRef] [Green Version]
  17. Bashi, N.; Karunanithi, M.; Fatehi, F.; Ding, H.; Walters, D. Remote Monitoring of Patients With Heart Failure: An Overview of Systematic Reviews. J. Med. Internet Res. 2017, 19, e18. [Google Scholar] [CrossRef] [PubMed]
  18. Ali, O.; Hajduczok, A.G.; Boehmer, J.P. Remote Physiologic Monitoring for Heart Failure. Curr. Cardiol. Rep. 2020, 22, 68. [Google Scholar] [CrossRef] [PubMed]
  19. Santaguida, P.L.; Don-Wauchope, A.; Oremus, M.; McKelvie, R.; Ali, U.; Hill, S.A.; Balion, C.; Booth, R.A.; Brown, J.A.; Bustamam, A.; et al. BNP and NT-proBNP as prognostic markers in persons with acute decompensated heart failure: A systematic review. Heart Fail. Rev. 2014, 19, 453–470. [Google Scholar] [CrossRef]
  20. Rodríguez-Moyano, M.; Díaz, I.; Dionisio, N.; Xuexin, Z.; Avila-Medina, J.; Calderón-Sánchez, E.M.; Trebak, M.; Rosado, J.A.; Ordoñez, A.; Smani, T. Urotensin-II promotes vascular smooth muscle cell proliferation through store-operated calcium entry and EGFR transactivation. Cardiovasc. Res. 2013, 100, 297–306. [Google Scholar] [CrossRef]
  21. Grieco, P.; Gomez-Monterrey, I. Natural and synthetic peptides in the cardiovascular diseases: An update on diagnostic and therapeutic potentials. Arch. Biochem. Biophys. 2018, 662, 15–32. [Google Scholar] [CrossRef]
  22. Ouwerkerk, W.; Voors, A.A.; Zwinderman, A.H. Factors Influencing the Predictive Power of Models for Predicting Mortality and/or Heart Failure Hospitalization in Patients With Heart Failure. JACC Heart Fail. 2014, 2, 429–436. [Google Scholar] [CrossRef]
  23. De la Cámara, A.G.; GuerraVales, J.M.; Tapia, P.M.; Esteban, E.A.; del Pozo, S.V.F.; Sandubete, E.C.; Ortega, F.J.M.; Puerto, A.N.; Marín-León, I.; PR Group. Role of biological and non biological factors in congestive heart failure mortality: PREDICE-SCORE: A clinical prediction rule. Cardiol. J. 2012, 19, 578–585. [Google Scholar] [CrossRef] [Green Version]
  24. Showkat, I.; Khanday, F.A.; Beigh, M.R. A review of bio-impedance devices. Med. Biol. Eng. Comput. 2023, 1–24. [Google Scholar] [CrossRef] [PubMed]
  25. Pérez, P.; Huertas, G.; Maldonado-Jacobi, A.; Martín, M.; Serrano, J.A.; Olmo, A.; Daza, P.; Yúfera, A. Sensing Cell-Culture Assays with Low-Cost Circuitry. Sci. Rep. 2018, 8, 8841. [Google Scholar] [CrossRef] [Green Version]
  26. Yufera, A.; Rueda, A.; Munoz, J.; Doldan, R.; Leger, G.; Rodriguez-Villegas, E. A tissue impedance measurement chip for myocardial ischemia detection. IEEE Trans. Circuits Syst. I Regul. Pap. 2005, 52, 2620–2628. [Google Scholar] [CrossRef] [Green Version]
  27. Lee, S.; Squillace, G.; Smeets, C.; Vandecasteele, M.; Grieten, L.; de Francisco, R.; Van Hoof, C. Congestive heart failure patient monitoring using wearable Bio-impedance sensor technology. In Proceedings of the Annual International Conference of the IEEE Engineering in Medicine and Biology Society, EMBS, Milan, Italy, 25–29 August 2015; pp. 438–441. [Google Scholar] [CrossRef]
  28. Grimnes, S.; Martinsen, Ø. Bioimpedance and Bioelectricity Basics 2014, 3rd ed.; Academic Press: Cambridge, MA, USA, 2014; ISBN 9780124114708. [Google Scholar]
  29. Hankinson, S.J.; Williams, C.H.; Ton, V.-K.; Gottlieb, S.S.; Hong, C.C. Should we overcome the resistance to bioelectrical impedance in heart failure? Expert Rev. Med. Devices 2020, 17, 785–794. [Google Scholar] [CrossRef] [PubMed]
  30. Wu, Y.; Hanzaee, F.F.; Jiang, D.; Bayford, R.H.; Demosthenous, A. Electrical Impedance Tomography for Biomedical Applications: Circuits and Systems Review. IEEE Open J. Circuits Syst. 2021, 2, 380–397. [Google Scholar] [CrossRef]
  31. Xu, J.; Hong, Z. Low Power Bio-Impedance Sensor Interfaces: Review and Electronics Design Methodology. IEEE Rev. Biomed. Eng. 2020, 15, 23–35. [Google Scholar] [CrossRef]
  32. Lin, Q.; Song, S.; Castro, I.D.; Jiang, H.; Konijnenburg, M.; van Wegberg, R.; Biswas, D.; Stanzione, S.; Sijbers, W.; Van Hoof, C.; et al. Wearable Multiple Modality Bio-Signal Recording and Processing on Chip: A Review. IEEE Sen. J. 2020, 21, 1108–1123. [Google Scholar] [CrossRef]
  33. Sakaguchi, T.; Yasumura, K.; Nishida, H.; Inoue, H.; Furukawa, T.; Shinouchi, K.; Miura, H.; Miyazaki, K.; Hamano, G.; Koide, M.; et al. Quantitative Assessment of Fluid Accumulation Using Bioelectrical Impedance Analysis in Patients With Acute Decompensated Heart Failure. Circ. J. 2015, 79, 2616–2622. [Google Scholar] [CrossRef] [Green Version]
  34. Lyons, K.J.; Bischoff, M.K.; Fonarow, G.; Horwich, T.B. Noninvasive Bioelectrical Impedance for Predicting Clinical Outcomes in Outpatients With Heart Failure. Crit. Pathways Cardiol. A J. Evid. -Based Med. 2017, 16, 32–36. [Google Scholar] [CrossRef]
  35. Pittella, E.; Piuzzi, E.; Rizzuto, E.; Pisa, S.; Del Prete, Z. Metrological characterization of a combined bio-impedance plethysmograph and spectrometer. Measurement 2018, 120, 221–229. [Google Scholar] [CrossRef]
  36. Lindholm, D.; Fukaya, E.; Leeper, N.J.; Ingelsson, E. Bioimpedance and New-Onset Heart Failure: A Longitudinal Study of >500 000 Individuals From the General Population. J. Am. Heart Assoc. 2018, 7, e008970. [Google Scholar] [CrossRef] [Green Version]
  37. Zink, M.D.; König, F.; Weyer, S.; Willmes, K.; Leonhardt, S.; Marx, N.; Napp, A. Segmental Bioelectrical Impedance Spectroscopy to Monitor Fluid Status in Heart Failure. Sci. Rep. 2020, 10, 3577. [Google Scholar] [CrossRef] [PubMed] [Green Version]
  38. Cannon, T.; Choi, J. Development of a Segmental Bioelectrical Impedance Spectroscopy Device for Body Composition Measurement. Sensors 2019, 19, 4825. [Google Scholar] [CrossRef] [PubMed] [Green Version]
  39. Mabrouk, S.; Hersek, S.; Jeong, H.K.; Whittingslow, D.; Ganti, V.G.; Wolkoff, P.; Inan, O.T. Robust Longitudinal Ankle Edema Assessment Using Wearable Bioimpedance Spectroscopy. IEEE Trans. Biomed. Eng. 2019, 67, 1019–1029. [Google Scholar] [CrossRef]
  40. Hoffer, E.C.; Meador, C.K.; Simpson, D.C. Correlation of whole-body impedance with total body water volume. J. Appl. Physiol. 1969, 27, 531–534. [Google Scholar] [CrossRef] [PubMed]
  41. Hersek, S.; Toreyin, H.; Teague, C.N.; Millard-Stafford, M.L.; Jeong, H.-K.; Bavare, M.M.; Wolkoff, P.; Sawka, M.N.; Inan, O.T. Wearable Vector Electrical Bioimpedance System to Assess Knee Joint Health. IEEE Trans. Biomed. Eng. 2016, 64, 2353–2360. [Google Scholar] [CrossRef]
  42. Hafid, A.; Benouar, S.; Kedir-Talha, M.; Abtahi, F.; Attari, M.; Seoane, F. Full Impedance Cardiography Measurement Device Using Raspberry PI3 and System-on-Chip Biomedical Instrumentation Solutions. IEEE J. Biomed. Health Inform. 2017, 22, 1883–1894. [Google Scholar] [CrossRef]
  43. Leonov, V.; Lee, S.; Londergan, A.; Martin, R.A.; De Raedt, W.; Van Hoof, C. Bioimpedance Method for Human Body Hydration Assessment. In Proceedings of the 2019 41st Annual International Conference of the IEEE Engineering in Medicine and Biology Society (EMBC), Berlin, Germany, 23–27 July 2019; pp. 6036–6039. [Google Scholar] [CrossRef]
  44. Medrano, J.; Yúfera, A. Real-Time Monitoring Prognostic Value of Volume with BI Test in Patients with Acute HF. (HEART-FAIL VOLUM); DTS19/00134 and DTS19/00137; Instituto Carlos III: Madrid, Spain, 2019. [Google Scholar]
  45. Said, T.; Varadan, V.V. Variation of Cole-Cole model parameters with the complex permittivity of biological tissues. In Proceedings of the IEEE MTT-S International Microwave Symposium Digest, Boston, MA, USA, 7–12 June 2009; pp. 1445–1448. [Google Scholar] [CrossRef]
  46. Ayllon, D.; Seoane, F.; Gil-Pita, R. Cole equation and parameter estimation from electrical bioimpedance spectroscopy measurements—A comparative study. In Proceedings of the Annual International Conference of the IEEE Engineering in Medicine and Biology Society, Minneapolis, MN, USA, 3–6 September 2009; pp. 3779–3782. [Google Scholar] [CrossRef]
  47. Puertas, M.; Gimenez, L.; Perez, A.; Scagliusi, S.F.; Perez, P.; Olmo, A.; Huertas, G.; Medrano, J.; Yufera, A. Modeling Edema Evolution With Electrical Bioimpedance: Application to Heart Failure Patients. In Proceedings of the 2021 XXXVI Conference on Design of Circuits and Integrated Systems (DCIS), Vila do Conde, Portugal, 24–26 November 2021; pp. 1–6. [Google Scholar] [CrossRef]
  48. Blanco-Almazan, D.; Groenendaal, W.; Catthoor, F.; Jane, R. Wearable Bioimpedance Measurement for Respiratory Monitoring During Inspiratory Loading. IEEE Access 2019, 7, 89487–89496. [Google Scholar] [CrossRef]
  49. Ferreira, A.G.; Fernandes, D.; Branco, S.; Monteiro, J.L.; Cabral, J.; Catarino, A.P.; Rocha, A.M. A smart wearable system for sudden infant death syndrome monitoring. In Proceedings of the 2016 IEEE International Conference on Industrial Technology (ICIT), Taipei, Taiwan, 14–17 March 2016; pp. 1920–1925. [Google Scholar]
  50. Corchia, L.; Monti, G.; Raheli, F.; Candelieri, G.; Tarricone, L. Dry Textile Electrodes for Wearable Bio-Impedance Analyzers. IEEE Sen. J. 2020, 20, 6139–6147. [Google Scholar] [CrossRef]
  51. Hong, S.; Lee, J.; Yoo, H.-J. Wearable lung-health monitoring system with electrical impedance tomography. In Proceedings of the 37th Annual International Conference of the IEEE Engineering in Medicine and Biology Society (EMBC 2015), Milan, Italy, 25–29 August 2015; pp. 1707–1710. [Google Scholar] [CrossRef]
  52. Ferreira, J.; Pau, I.; Lindecrantz, K.; Seoane, F. A Handheld and Textile-Enabled Bioimpedance System for Ubiquitous Body Composition Analysis. An Initial Functional Validation. IEEE J. Biomed. Health Inform. 2016, 21, 1224–1232. [Google Scholar] [CrossRef] [PubMed]
  53. Reichmuth, M.; Schurle, S.; Magno, M. A Non-invasive Wearable Bioimpedance System to Wirelessly Monitor Bladder Filling. In Proceedings of the Design, Automation & Test in Europe Conference & Exhibition, Grenoble, France, 9–13 March 2020; pp. 338–341. [Google Scholar] [CrossRef]
  54. Joutsen, A.S.; Kaappa, E.S.; Karinsalo, T.J.; Vanhala, J. Dry electrode sizes in recording ECG and heart rate in wearable applications. IFMBE Proc. 2017, 65, 735–738. [Google Scholar] [CrossRef]
  55. Gong, W.Y.; Lv, J.H.; Wang, Y.; Sha, H.; Zhao, S.; Ren, C.S. The Impedance Property of Electrode Used in Electrical Bio-Impedance Measurement. In Proceedings of the 3rd International Conference on Bioinformatics and Biomedical Engineering, Beijing, China, 11–13 June 2009; pp. 1–3. [Google Scholar] [CrossRef]
  56. Nescolarde, L.; Lukaski, H.; De Lorenzo, A.; De-Mateo-Silleras, B.; Redondo-Del-Río, M.P.; Camina-Martín, M.A. Different displacement of bioimpedance vector due to Ag/AgCl electrode effect. Eur. J. Clin. Nutr. 2016, 70, 1401–1407. [Google Scholar] [CrossRef] [Green Version]
  57. National Institutes of Health. Bioelectrical impedance analysis in body composition measurement. NIH Technical Assessment Statement 1994. Am. J. Clin. Nutr. 1996, 64, 524S–532S. [Google Scholar]
  58. Kusche, R.; Kaufmann, S.; Ryschka, M. Dry electrodes for bioimpedance measurements—Design, characterization and comparison. arXiv 2019, arXiv:1910.05033. [Google Scholar] [CrossRef] [Green Version]
  59. Marquez, J.C.; Seoane, F.; Valimaki, E.; Lindecrantz, K. Textile electrodes in electrical bioimpedance measurements—A comparison with conventional Ag/AgCl electrodes. Annu. Int. Conf. IEEE Eng. Med. Biol. Soc. 2009, 2009, 4816–4819. [Google Scholar] [CrossRef]
  60. Fernández-Scagliusi, S. Sistema para Medida de Volumen Basado en Espectroscopia de Bioimpedancia. Master’s Thesis, Departamento de Tecnología Electrónica, Universidad de Sevilla, Sevilla, Spain, 2020. [Google Scholar]
  61. Albaugh, M.; Argote, P.; Patel, N.; Patel, R.; Boppana, S.; Ocken, A.; Masquelin, A.; Hoilett, O.; Miller, D.; Drakopoulos, M. Predictive Wear Matter of Manufacture of Compression Legging System and Associated Uses Cross-Reference to Related Applications 2020. Patent WO2020180919A1, 10 September 2020. DW2020077. [Google Scholar]
  62. Chahine, T.; Aitken, S.; Straka, A.; Alizadeh-Meghrazi, M.; Myant Inc. Multi-Functional Tubular Worn Garment 2029. Patent WO2019134033A2, 11 July 2019. DW201955. [Google Scholar]
  63. Buyya, R.; Dastjerdi, A.V. Internet of Things: Principles and Paradigms; Elsevier: Amsterdam, The Netherlands, 2016; pp. 1–354. [Google Scholar] [CrossRef]
  64. Rodriguez-Villegas, E.; Iranmanesh, S.; Imtiaz, S.A. Wearable Medical Devices: High-Level System Design Considerations and Tradeoffs. IEEE Solid-State Circuits Mag. 2018, 10, 43–52. [Google Scholar] [CrossRef] [Green Version]
  65. Bluetooth® Technology Website. Available online: https://www.bluetooth.com/ (accessed on 1 February 2023).
  66. Lin, Z.; Ye, F.; Qin, W.; Cao, X.; Wang, Y.; Hu, R.; Yan, R.; Qin, Y.; Yi, T.; Hong, Z. A low-power, wireless, real-time, wearable healthcare system. In Proceedings of the 2016 IEEE MTT-S International Wireless Symposium, IWS 2016, Shanghai, China, 14–16 March 2016. [Google Scholar] [CrossRef]
  67. Dementyev, A.; Hodges, S.; Taylor, S.; Smith, J. Power consumption analysis of Bluetooth Low Energy, ZigBee and ANT sensor nodes in a cyclic sleep scenario. In Proceedings of the 2013 IEEE International Wireless Symposium, IWS 2013, Beijing, China, 14–18 April 2013. [Google Scholar] [CrossRef]
Figure 1. General overview VOLUM system: (a) Proposed circuits. (b) Ankle support with electrodes.
Electronics 12 01383 g001
Figure 2. Leg geometry: A cylinder with r_leg radius and h height. r_leg = 4 cm. The h = 6 cm and w = 3.5 cm dimensions are the values between electrodes considered in the system, and for calibration.
Electronics 12 01383 g002
Figure 3. Setup and circuits used for ankle leg test (a). Wessel diagram for a BI spectroscopy in leg using Ag/AgCl electrodes, stainless electrodes, and textile electrodes (b).
Electronics 12 01383 g003
Figure 4. Block diagram for the Wireless Communication via Bluetooth (Device/Smartphone) and TCP/IP (Smartphone/Server).
Electronics 12 01383 g004
Figure 5. Wessel diagram of calf BI and the frequency points used by the BI sensor (AD5941). The Cole–Cole model values used are Rex = 50 Ω, Rin = 75 Ω, and Cm = 100 nF.
Electronics 12 01383 g005
Figure 6. Tissue model based on intra- and extracellular parts as structural components. Performance when frequency approach to DC conditions.
Electronics 12 01383 g006
Figure 7. (a) Cole–Cole diagram for S3, at MM test point. (b) Cole–Cole diagram for S5, at MM test point.
Electronics 12 01383 g007
Figure 8. Volume estimated for healthy subjects versus test point.
Electronics 12 01383 g008
Figure 9. Volume estimation versus extracellular resistance Rex (R_0) for healthy persons.
Electronics 12 01383 g009
Figure 10. Volume estimated for all subjects versus test point (unhealthy).
Electronics 12 01383 g010
Figure 11. Total volume estimation versus extracellular resistance, Rex (R_0) for unhealthy persons.
Electronics 12 01383 g011
Figure 12. Extracellular resistance (Rex) values obtained along ten days, for a healthy subject.
Electronics 12 01383 g012
Figure 13. Medium and deviation of volume estimated, versus time along the 24 h in a day: circadian rhythm.
Electronics 12 01383 g013
Table 1. Baseline characteristics of groups in the study.
VariableControlsHF Patients
Subjects42
Mean age (years)6079.50
Male22
Mean weight (kg)73.589.90
Mean height (m)1.681.73
Mean heart rate (bpm)70.9570.60
Mean systolic blood pressure (mmHg)118.98135.40
Mean diastolic blood pressure (mmHg)65.9366.45
Mean diuresis (mL)1572.751627.80
Mean temperature (°C)36.2736.23
Mean oxygen saturation (%)97.3093.00
Mean hemoglobin (g/dL)14.0510.15
Mean creatinine (mg/dL)0.921.36
Mean urea (mg/dL)31.554.00
Mean sodium (mEq/L)142.5134.00
Mean NT-proBNP (pg/mL)131.12143.00
Comorbid pathologies (ICD-10)N/AB18.2; E11.8; E66; E78.5; I08.3; I10; I11.0; I25.9; I48.2; I50.3; J44.9; K74.6; N18.3
NT-proBNP: N-terminal prohormone of brain natriuretic peptide; ICD-10: 10th revision of the International Statistical Classification of Diseases and Related Health Problems.
Table 2. Cole–Cole parameter R_0 and R_inf for S1 to S4.
Test PointR_0 [Ω]R_inf [Ω]
S1S2S3S4S1S2S3S4
MM55.632.158.443.941.224.452.130.8
ME51.130.043.156.024.524.737.839.3
TM65.346.745.344.147.734.138.832.8
TE43.6na75.3351.425.5na59.949.1
WM53.638.066.961.941.428.555.341.4
WE53.337.756.351.84.127.749.236.6
TuM45.956.549.161.233.039.241.240.1
TuE37.2na64.763.932.4na44.242.1
FM47.721.782.357.134.734.062.839.0
FE4260.537.657.9802.545.027.749.356.4
Table 3. Cole–Cole Rex and Rin for S1 to S4.
Test PointRex [Ω]Rin [Ω]
S1S2S3S4S1S2S3S4
MM55.632.158.443.8159.9102.3477.7−122.8
ME51.230,043.155.747.2139.5305.2159.9
TM65.446.745.348.8176.3126.1270.2128.7
TE43.6na75.3254.261.8na293.445.2
WM53.638.066.961.4180.6113.7319.9161.4
WE53.337.756.351.74.4104.5392.2149.3
TuM45.956.549.161.9117.6127.9256.1144.5
TuE37.2na64.763.3249.6na140.2154.9
FM47.721.782.356.6127.0−60.0265.4166.3
FE4260.537.657.9320.845.5104.8331.044.6
Disclaimer/Publisher’s Note: The statements, opinions and data contained in all publications are solely those of the individual author(s) and contributor(s) and not of MDPI and/or the editor(s). MDPI and/or the editor(s) disclaim responsibility for any injury to people or property resulting from any ideas, methods, instructions or products referred to in the content.

