Article

Active Disturbance Rejection-Based Performance Optimization and Control Strategy for Proton-Exchange Membrane Fuel Cell System

1
Hubei Key Laboratory of Advanced Technology for Automotive Components, Wuhan University of Technology, Wuhan 430070, China
2
Hubei Research Center for New Energy & Intelligent Connected Vehicle, Wuhan University of Technology, Wuhan 430070, China
3
Foshan Xianhu Laboratory of the Advanced Energy Science and Technology Guangdong Laboratory, Foshan 528200, China
*
Author to whom correspondence should be addressed.
Electronics 2023, 12(6), 1393; https://doi.org/10.3390/electronics12061393
Submission received: 16 February 2023 / Revised: 11 March 2023 / Accepted: 14 March 2023 / Published: 15 March 2023
(This article belongs to the Section Systems & Control Engineering)

Abstract

:
In this paper, to maximize the net output power and realize better performance optimization and control of the oxygen excess ratio, a complete dynamic model of the proton-exchange membrane fuel cell system is developed and an active disturbance rejection control strategy is proposed. The active disturbance rejection control drives the uncertainties and perturbations of the system to an extended state, which is predicted and eliminated by real-time input–output data. The simulation results indicate that, compared with the proportion–integral–differential and fuzzy proportion–integral–differential control, the active disturbance rejection control strategy can effectively improve the control performance with a lower control cost and less wear on the compressor, and the integral absolute error of the oxygen excess ratio control is reduced by up to 50%. In addition, the output voltage is improved and the power generation efficiency of the proton-exchange membrane fuel cell under the active disturbance rejection-based oxygen excess ratio control is 1.84% and 0.95% higher than that of the proportion–integral–differential and fuzzy proportion–integral–differential control, respectively. Moreover, the proposed optimal-reference control strategy increases the net power by up to 1.85% compared with the fixed-reference control strategy.

1. Introduction

In order to cope with the increasingly rigorous environmental problems and practice the concept of low-carbon and energy-saving life, reducing GHG emissions has become a worldwide consensus [1]. China has announced the national strategic development goal of achieving “carbon peak” by 2030, striving to achieve “carbon neutrality” before 2060 and to build an environment-friendly society [2]. As the transportation sector is one of the main sources of GHG emissions, traditional ICEVs are facing major technical innovation challenges to reduce emissions of exhaust pollutants, and even have the trend of being replaced by new energy vehicles that can achieve zero carbon emissions [3].
In recent years, PEMFC has made vigorous commercial progress in automotive applications due to its outstanding advantages such as green cleaning, high-efficient energy conversion, low noise, and convenient refueling [4]. Therefore, vehicular PEMFC is regarded as one of the powerful competitors in the alternative of traditional ICEVs.
A serious issue in the operation of PEMFC is the oxygen starvation during sudden current changes in load-pulling conditions. The OER is a common measure of the air supply quality in the cathode and defined as the ratio of the actual O2 mass flow entering the stack to the O2 mass flow consumed in electrochemical reactions [5]. The oxygen starvation with OER < 1 may occur when the load current suddenly changes under the condition of increasing power demand, which can lead to the instantaneous depletion of oxygen in the cathode and cause a sudden drop in stack voltage, severely degrading system performance [6]. Although oxygen starvation can be avoided by increasing OER, higher OER means more power to drive the air compressor, which will increase the parasitic power and cause a decrease in the net output power [7]. Generally, the power used to operate the compressor accounts for the largest proportion of parasitic power, about 15–20% of the total PEMFC system power [8]. Therefore, an effective OER control method is critical for the energy efficiency and operating safety of the PEMFC system.
Recently, various control strategies for air supply systems have been extensively investigated, including the sole control of PID, FLC, SMC, MRAC, MPC, neural network algorithms, and a combination structure of these control methods such as series or parallel coupling, etc. [9]. Classical feedback and feedforward control with PID controllers are not outdated even today and used frequently to achieve better fuel cell performance [3]. The initial work can be traced to the efforts in [10,11], which adopted the open-loop feedforward, state feedback, and PI control technology based on the linearized model. Although the traditional feedforward and feedback with classical PID control is highly applicable, simple, and cost effective, the nonlinear, complex, and dynamic PEMFC system needs control strategies that can respond faster and more accurately [12]. FLC can use simple rules or heuristics from human experts to control the complex nonlinear processes in the fuel cell without the need to fully understand the process; in [13], it was designed for cathode flow control. Zhang et al. [14] proposed an adaptive robust controller based on a type-2 fuzzy logic systems to control the OER of the PEMFC air supply system. On the other hand, FLC has also been coupled with PID controllers [15]. Baroud et al. [16] proposed a control algorithm combining PID and FLC to adjust OER, which demonstrates a better effect than the sole control of these two methods. SMC has been extensively developed to improve the dynamic response of the air-feed system, which can provide a good transient performance under parametric uncertainties in load changes [17]. In [18], a cascaded second-order SMC (SOSMC) structure with a sub-optimal algorithm was used to adjust the oxygen stoichiometry. Moreover, an MRAC was introduced in [19] to adjust the air flow rate and avoid compressor surge. Han et al. [20] presented an MRAC strategy based on nominal feedback control, which uses an adaptive law to optimize the control input to adjust the OER. In addition, the MPC algorithm has also been investigated [21] to achieve a rolling optimization to eliminate the parameter uncertainty, nonlinearity, and disturbance. Wang et al. [22] simplified the PEMFC model to a linear time-invariant system and combined the respective advantages of MPC and PID control, proposing two coupled control algorithms for MPC and PID to prevent oxygen starvation. More recently, with the rise of artificial intelligence, various intelligent controllers have also been used to control the OER [23]. Li et al. [24] used input–output data from the nonlinear PEMFC system to train a neural network employing a DDRL algorithm, and established an intelligent controller for its application to the air supply system.
All of these studies mentioned above have made important efforts to the field of OER control. According to the literature review, there are also some examples of applying ADRC to the PEMFC system, such as Heidary et al., who presented an ADRC-based control method in a hybrid AC–DC inverter for PEMFC application [25]. Li et al. [26] proposed an ADRC with a switching law for the precise temperature adjustment of PEMFC. In order to maintain a reasonable membrane humidity, Chen et al. [27] applied ADRC to the cathode humidity balance and achieved a good control effect. Furthermore, Sun et al. [28] applied ADRC to the temperature control of an open-cathode PEMFC and verified the superiority of this method. However, to the authors’ knowledge, research applying ADRC to OER control is still scarce. Inspired by previous successful applications of ADRC to other aspects of PEMFC (the voltage, temperature, and humidity control), in this paper, to improve the oxygen starvation in PEMFC operation, the ADRC algorithm is applied to PEMFC OER control. The main contributions of this paper are as follows:
(1)
The mathematical model of the PEMFC air supply system is developed, and an ADRC method is employed for OER control.
(2)
The result of ADRC OER control is compared with that of other methods, which shows that the ADRC can better reduce overshoot, shorten the stabilization time, and improve the dynamic response.
(3)
An ORCS based on maximal net power output is proposed, which can achieve better system output performance than FRCS.
The remainder of this paper is organized as follows: Section 2 introduces the control-oriented system mathematical model of PEMFC. Section 3 elaborates on the ADRC control method applied to OER control. Section 4 presents the simulation results and performance analysis. Finally, the conclusions and direction for future research are shown in Section 5. Moreover, the definitions of the abbreviations, symbols, and subscripts which appeared in the article are listed in Nomenclature, firstly.

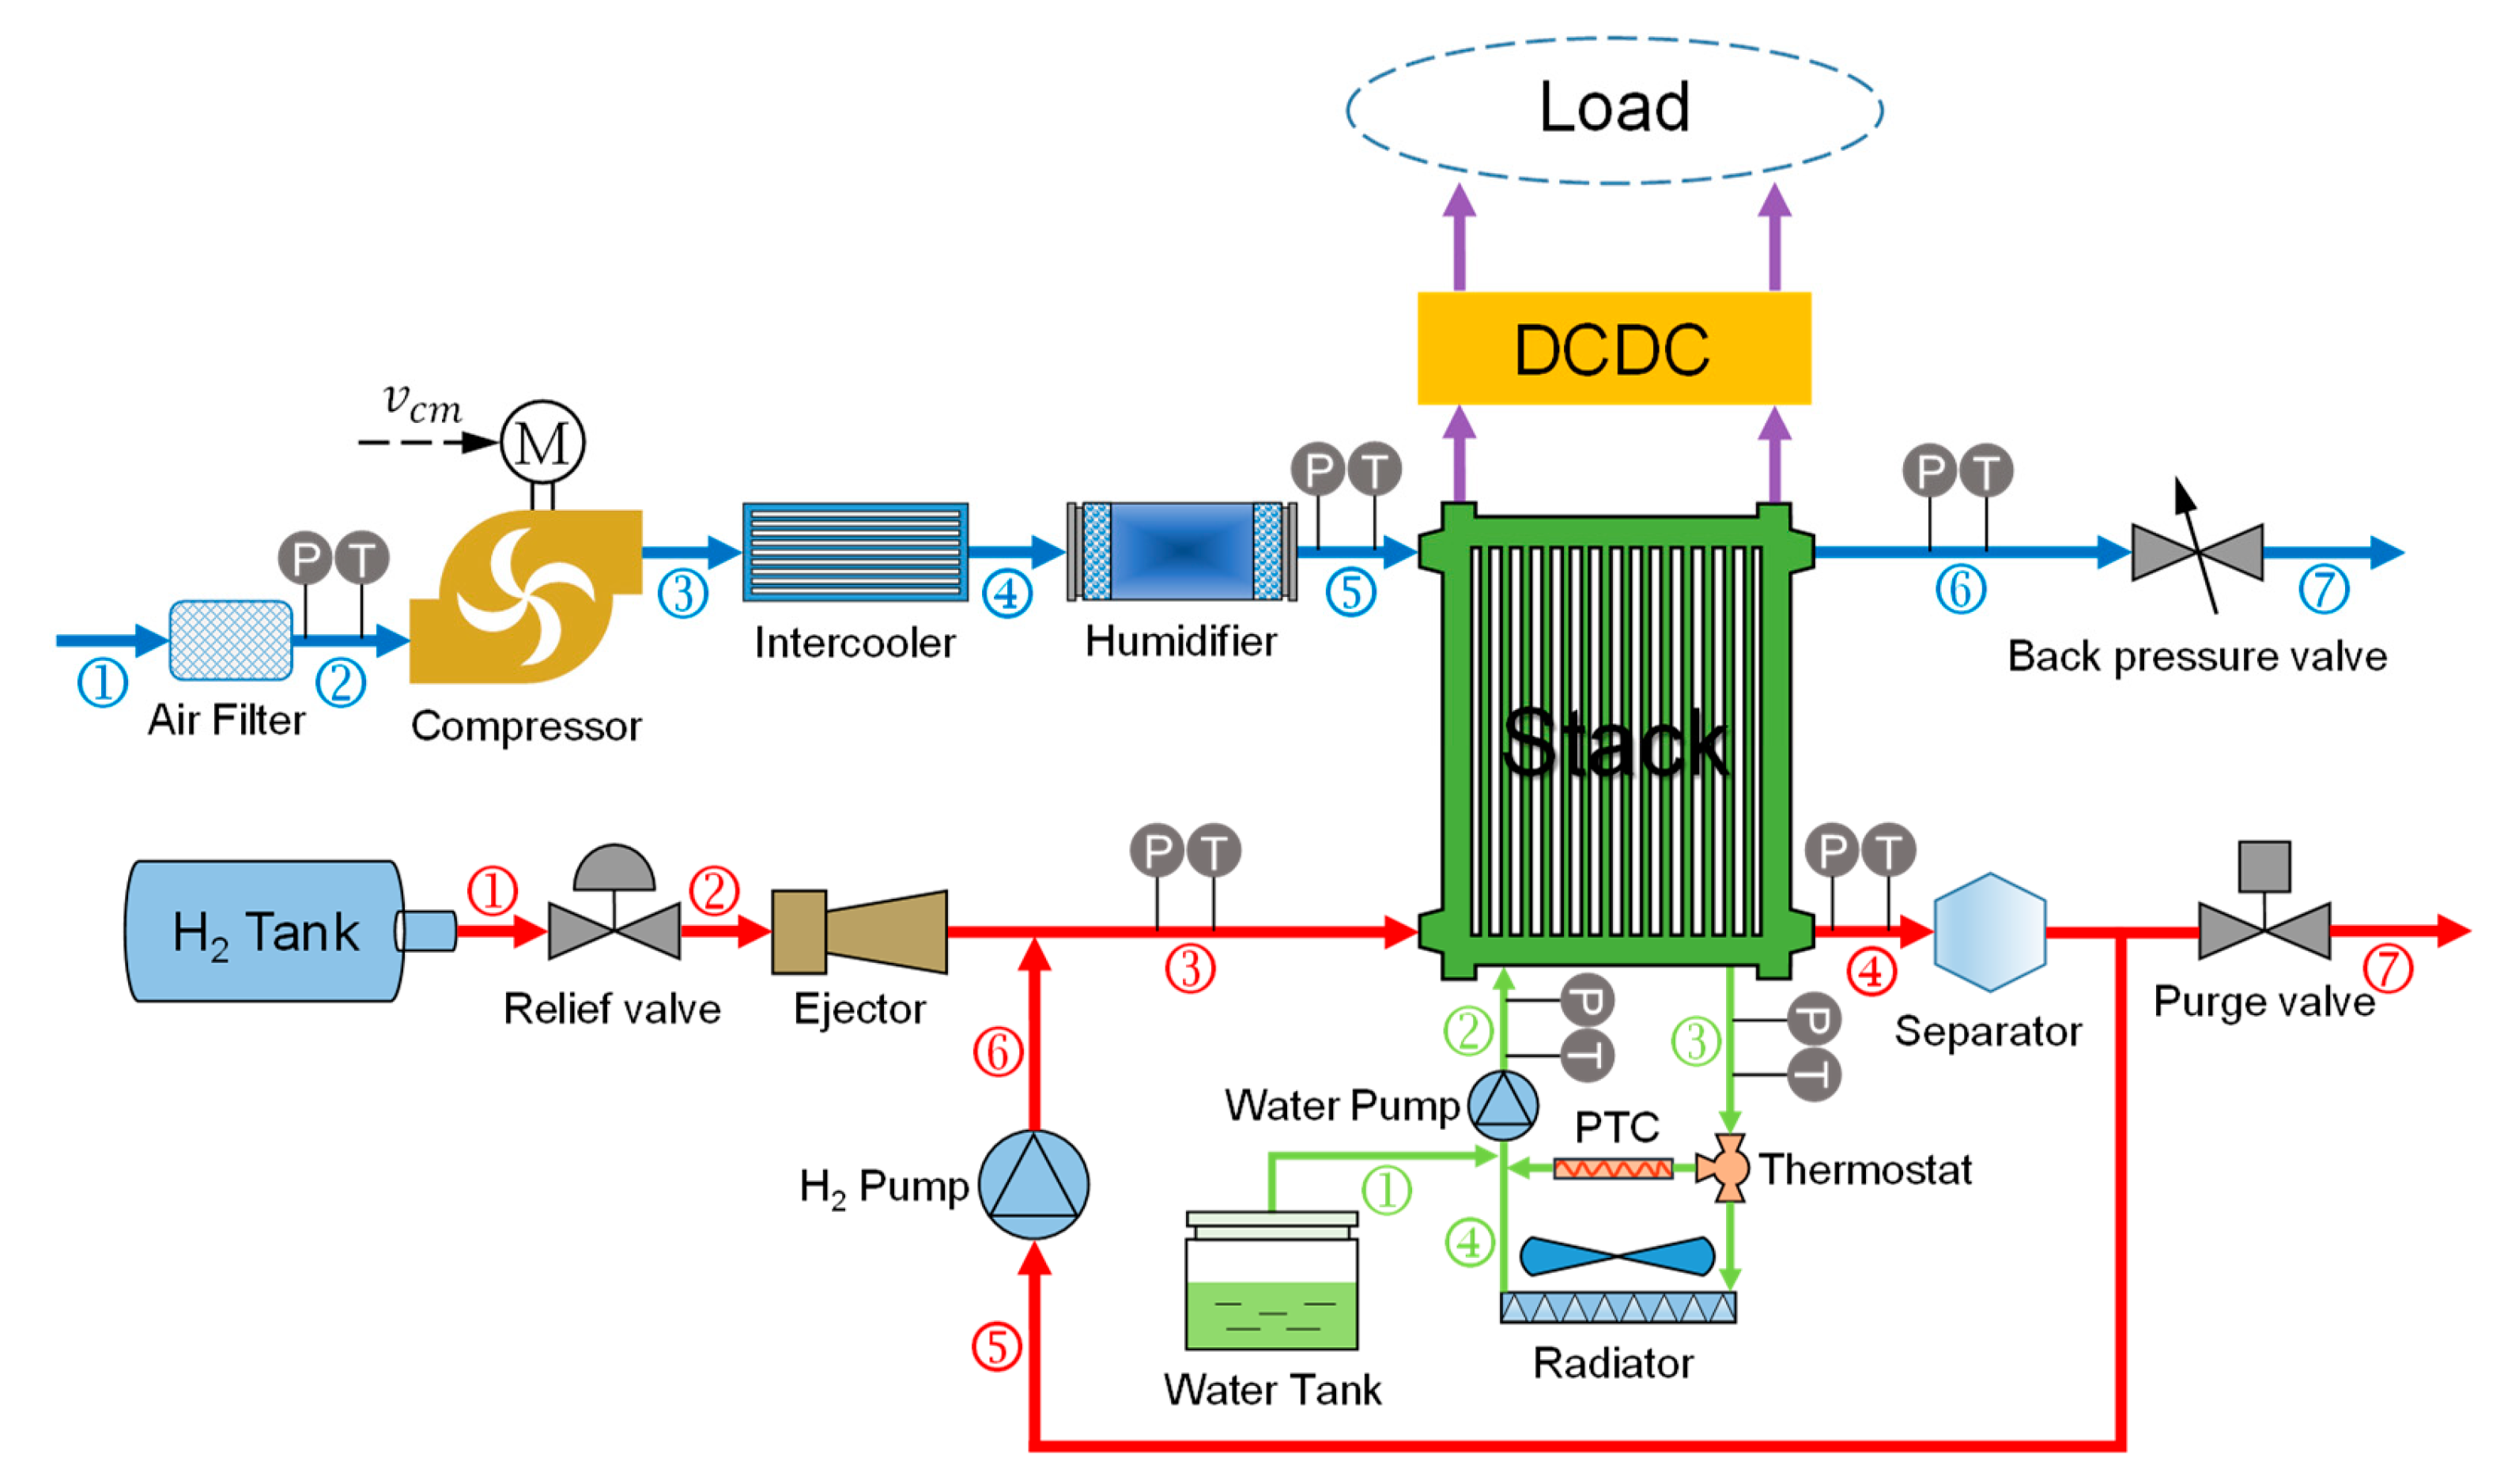
2. System Mathematical Modelling

As illustrated in Figure 1, the PEMFC system consists of the stack and some auxiliary BOP components, such as the air compressor, H2 circulating pump, cooling, and humidifying module [29]. The stack is made up by stacking a certain number of individual cells. The auxiliary system consists of the gas (hydrogen and air) supply subsystem, water and thermal management subsystem, and electrical subsystem [30]. Air path (blue line): The air is sucked into the compressor after passing through the filter, its temperature and pressure will rise greatly, and then it is sent into the stack after passing through the intercooler and humidifier. The back pressure valve at the exhaust end can regulate the air flow and pressure. H2 path (red line): The H2 is released from the high-pressure H2 tank, and then sprayed into the stack by the injector (or proportional valve) after passing through the relief valve. The H2 reacts with the O2 in the air under the action of the catalyst, producing electrons and water. Load path (purple line): The current generated by the stack supplies power to the external load via a DC/DC converter. To improve energy efficiency, the unreacted H2 is pumped back into the stack again by the circulating pump after passing through the separator. The purge valve is opened periodically to remove excess water and exhaust gas in the stack to facilitate the electrochemical reactions. The thermal management path (green line): The cooling water (deionized water or a mixture of water and glycol) in the water tank is pumped into the stack and then flows out through the radiator or PTC heating elements, so as to conduct heat exchange in a circular flow to ensure that the stack always operates within the optimum temperature range.
In this study, the mathematical model of the PEMFC system is developed by the mechanism modelling approach. To simplify the analysis, the control-oriented system model has four assumptions as follows:
(1)
All gases are ideal gases and obey the ideal gas law;
(2)
The ratio of N2 to O2 in the air is 79:21;
(3)
The hydrogen excess ratio ( λ H 2 ) is 1;
(4)
The PEMFC is capable of maintaining a constant stack temperature of 353.15 K.

2.1. Electrochemical Model

The Nernst voltage ( E n e r n s t ) is related to the stack temperature ( T s t ) and partial pressure of hydrogen and oxygen ( p H 2 , p O 2 ) [22,31]:
E n e r n s t = G 2 F S 2 F T s t 298.15 + R T s t 2 F l n p H 2 + 1 2 l n p O 2
However, the voltage loss consisting of the activation loss ( v a c t ), ohmic loss ( v o h m ), and concentration loss ( v c o n c ) will result in the actual voltage of a single cell ( v f c ) lower than E n e r n s t . The v a c t can be described as [22,31]:
v a c t = V 0 + V a 1 e c 1 i
i = I s t A e f c
where V 0 is related to the T s t , cathode pressure ( p c a ), and saturation pressure ( p s a t ); V a is related to the T s t and p O 2 in the stack; i is the current density (A/cm2); I s t is the stack current; and the equations used to calculate V 0 and V a are presented in Equations (4) and (5) [22,31]:
V 0 = 0.279 8.5 × 10 4 T s t 298.15 + 4.308 × 10 5 T s t l n p c a p s a t 1.01325 + 1 2 l n 0.1173 p c a p s a t 1.01325
V a = 1.618 × 10 5 T s t + 1.618 × 10 2 p O 2 0.1173 + p s a t 2 + 1.8 × 10 4 T s t 0.166 p O 2 0.1173 + p s a t + 5.8 × 10 4 T s t + 0.5736
The v o h m can be described as [22,31],
v o h m = i × R o h m = i × t m σ m
where σ m denotes membrane conductivity, and its expression is as follows:
σ m = b 1 e x p b 2 1 303 1 T f c
b 1 = b 11 λ m b 12
where b 1 is a function related to the λ m , which varies between 0 and 14.
The v c o n c is highly dependent on the reactants’ concentration. As i increases, this voltage loss will become more severe, which can be illustrated as [22,31]:
v c o n c = i c 2 i i m a x c 3
c 2 = 7.16 × 10 4 T s t 0.622 p O 2 0.1173 + p s a t + 1.45 × 10 3 T s t + 1.68 f o r p O 2 0.1173 + p s a t < 2 a t m 8.66 × 10 5 T s t 0.068 p O 2 0.1173 + p s a t + 1.6 × 10 4 T s t + 0.54 f o r p O 2 0.1173 + p s a t 2 a t m
The v f c can therefore be computed by [11]:
v f c = E n e r n s t v a c t v o h m v c o n c
Thus, the stack voltage ( V s t ) can be calculated by:
V s t = n c e l l × v f c

2.2. Air Compressor

The angular speed dynamic is determined by the following mechanical equation [11,18]:
d ω c p d t = 1 J c p τ c m τ c p
where ω c p is the compressor angular speed; and τ c m and τ c p , respectively, denote the compressor motor torque and compressor load torque, which can be calculated by [11,18]:
τ c m = k t η c m R c m v c m k v ω c p
τ c p = C p T a t m ω c p η c p p s m p a t m γ 1 γ 1 W c p
where v c m is voltage command to the compressor motor; η c p represents the compressor efficiency; p s m is the pressure of the supply manifold; and W c p is the compressor mass flow rate.
The p s m can be expressed as a function of the temperature of the air leaving the compressor ( T c p ), the W c p , and the cathode inlet mass flow rate ( W c a , i n ) [11,18]:
d p s m d t = R T c p M a V s m W c p W c a , i n
with
T c p = T a t m + T a t m η c p p s m p a t m γ 1 γ 1

2.3. Cathode Model

The O2 and N2 partial pressure can be deduced based on the ideal gas law and law of conservation of mass, as follows [11,18],
d p O 2 , c a d t = R T s t V c a M O 2 W O 2 , c a , i n W O 2 , c a , o u t W O 2 , r e a c t e d
d p N 2 , c a d t = R T s t V c a M N 2 W N 2 , c a , i n W N 2 , c a , o u t
where the O2 and N2 mass flow rate entering the cathode is denoted by W O 2 , c a , i n and W N 2 , c a , i n , respectively; W O 2 , c a , o u t and W N 2 , c a , o u t are the O2 and N2 mass flow rate leaving the cathode; and W O 2 , r e a c t e d is the mass flow rate of the reacted O2. W O 2 , c a , i n and W N 2 , c a , i n are expressed as follows [11,18]:
W O 2 , c a , i n = x O 2 1 + ω a t m W c a , i n
W N 2 , c a , i n = 1 x O 2 1 + ω a t m W c a , i n
W c a , i n = k c a , i n p s m p c a
with
x O 2 = y O 2 , a t m M O 2 M a
ω a t m = M v M a · ϕ a t m p s a t , c a p a t m ϕ a t m p s a t , c a
M a = y O 2 , a t m M O 2 + 1 y O 2 , a t m M N 2
where x O 2 is the O2 mass fraction for the inlet air; y O 2 , a t m is the O2 molar ratio which is 0.21 according to the assumption; p s a t , c a = p s a t , c a T s t denotes the vapor saturation pressure; and p c a can be calculated by the sum of p O 2 , c a , p N 2 , c a , and p s a t , c a [11,18]:
p c a = p O 2 , c a + p N 2 , c a + p s a t , c a
W O 2 , c a , o u t and W N 2 , c a , o u t are expressed as follows:
W O 2 , c a , o u t = M O 2 p O 2 , c a M O 2 p O 2 , c a + M N 2 p N 2 , c a + M v p s a t , c a W c a , o u t
W N 2 , c a , o u t = M N 2 p N 2 , c a M O 2 p O 2 , c a + M N 2 p N 2 , c a + M v p s a t , c a W c a , o u t
W c a , o u t = k c a , o u t p c a p r m
where W c a , o u t is the cathode outlet mass flow rate, and p r m is the pressure of the return manifold.
The W O 2 , r e a c t e d is dependent on I s t and can be calculated by the basic electrochemical principles, as follows [11,18]:
W O 2 , r e a c t e d = M O 2 × n c e l l I s t 4 F
The research object of this paper, namely, OER ( λ O 2 ), is defined as Equation (31):
λ O 2 = W O 2 , c a , i n W O 2 , r e a c t e d

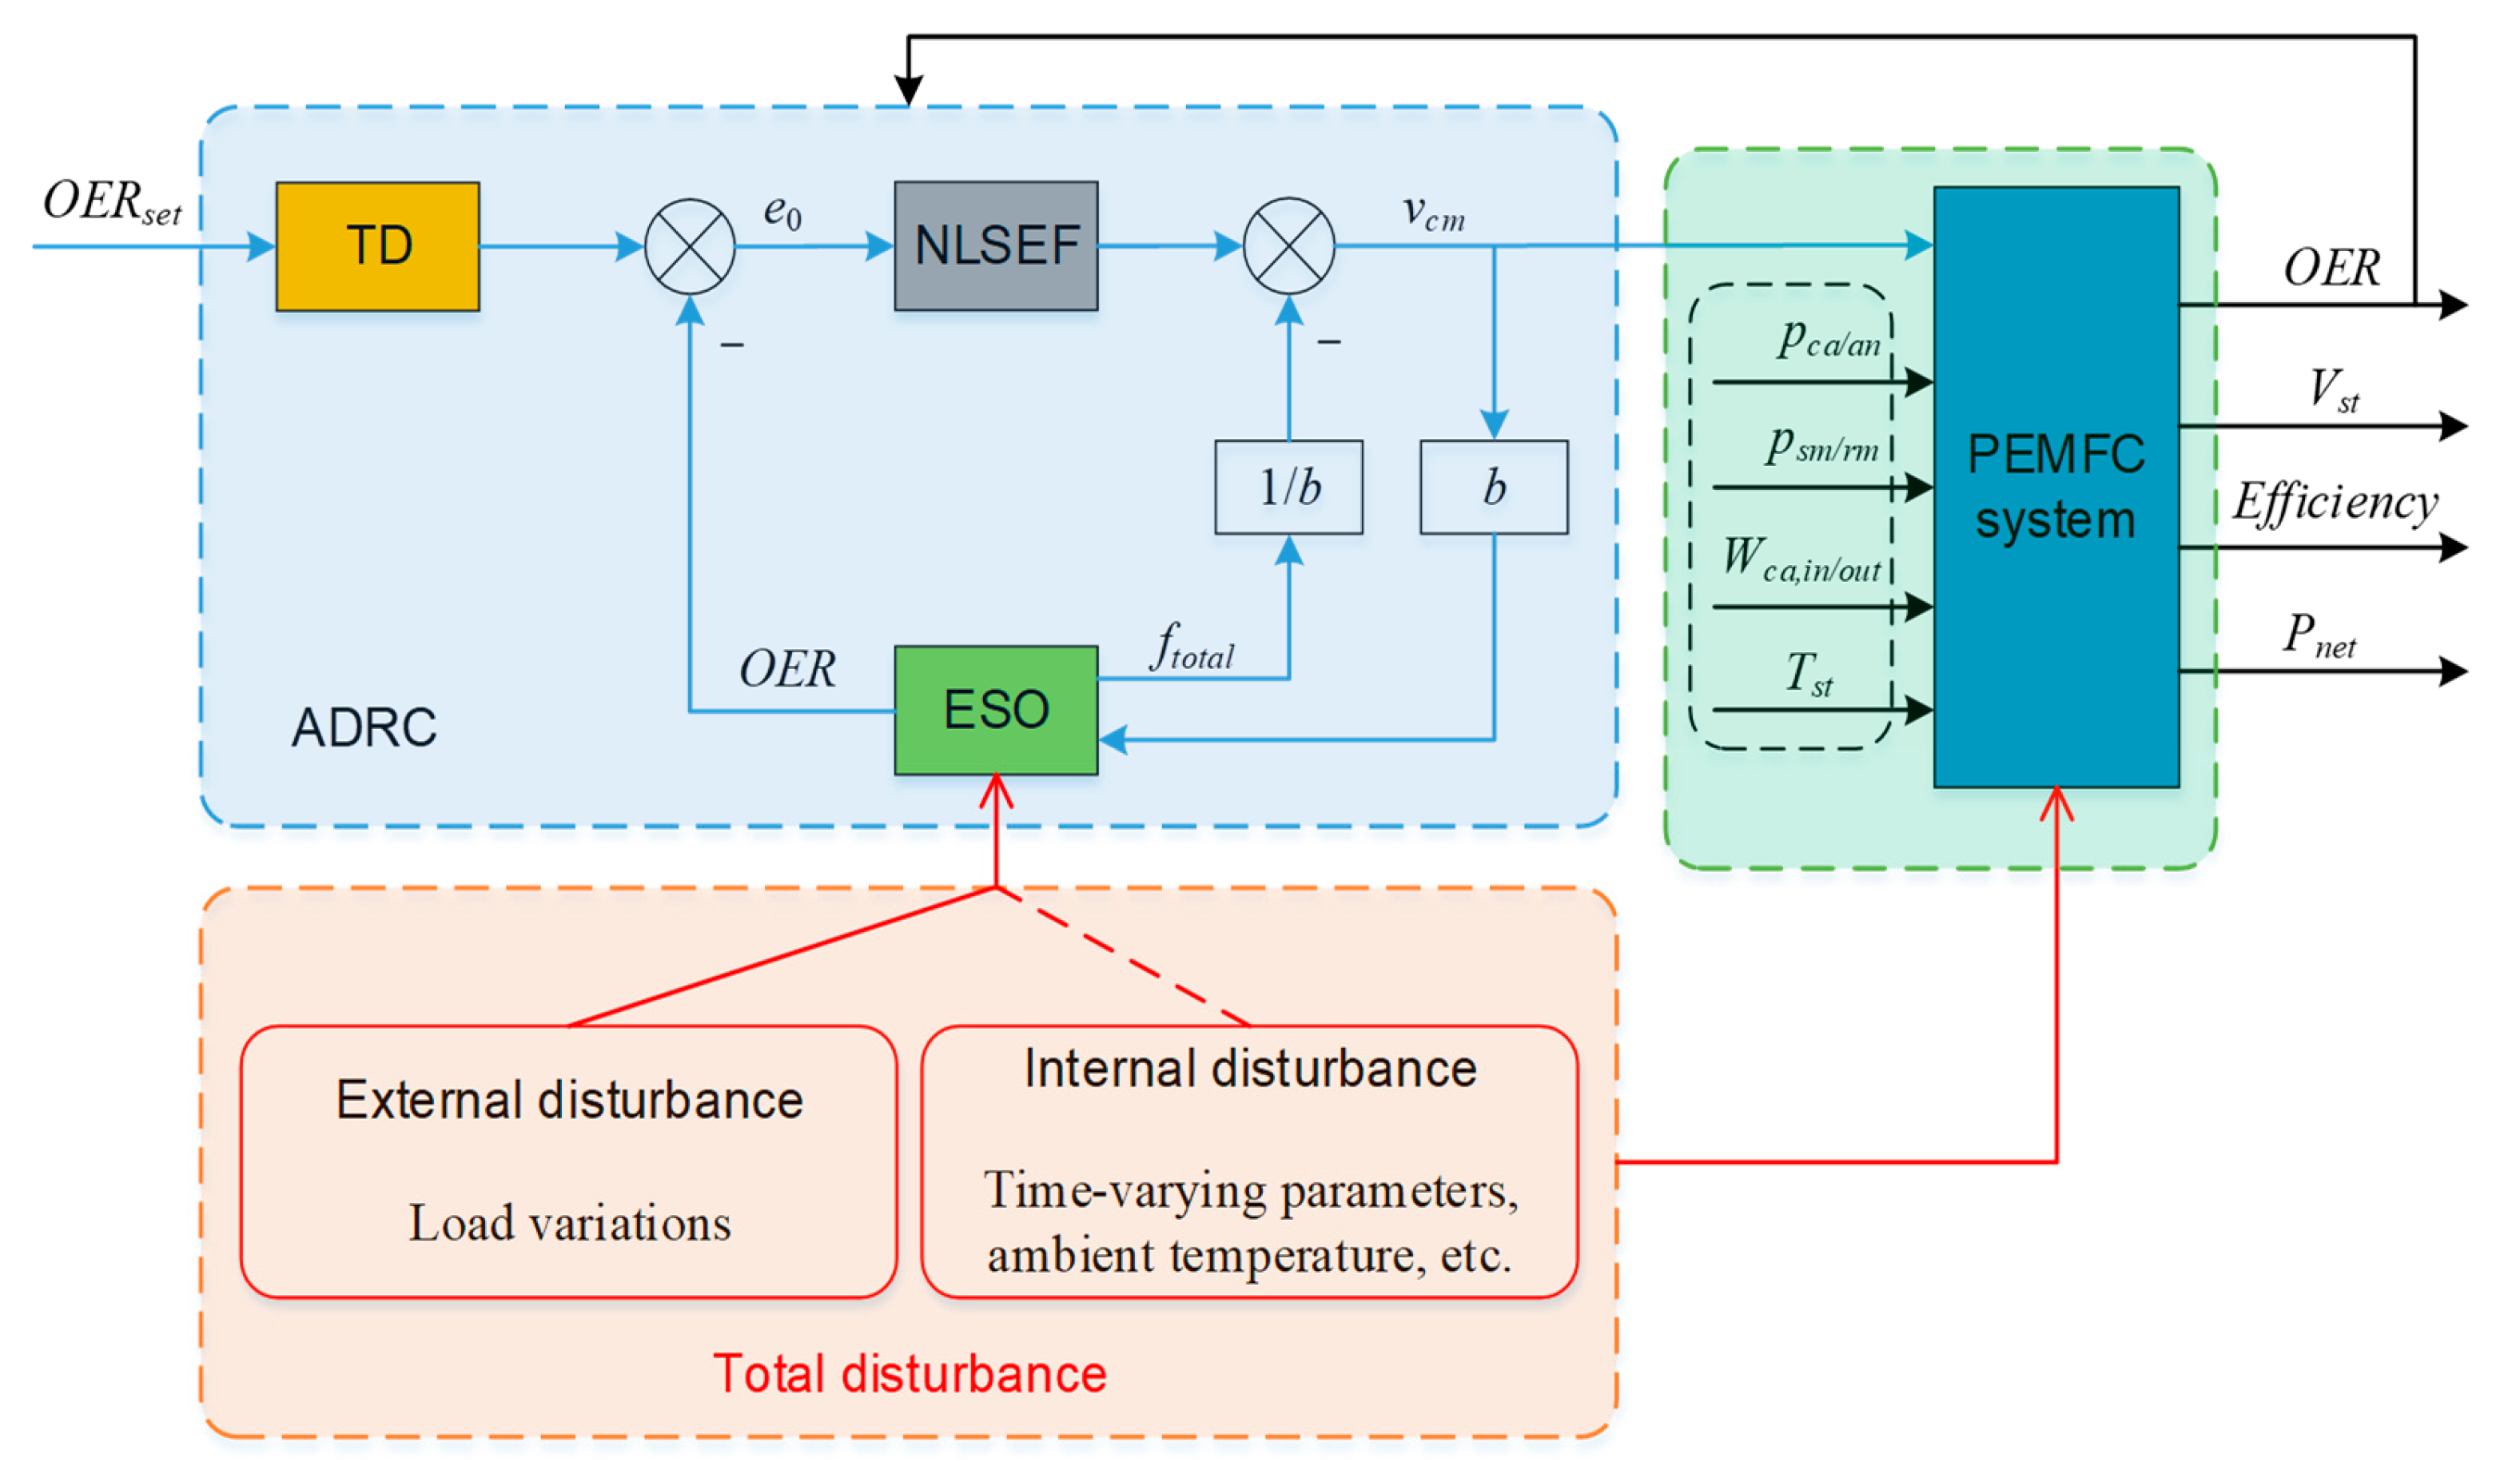
3. Control Strategy for Air-Feed System

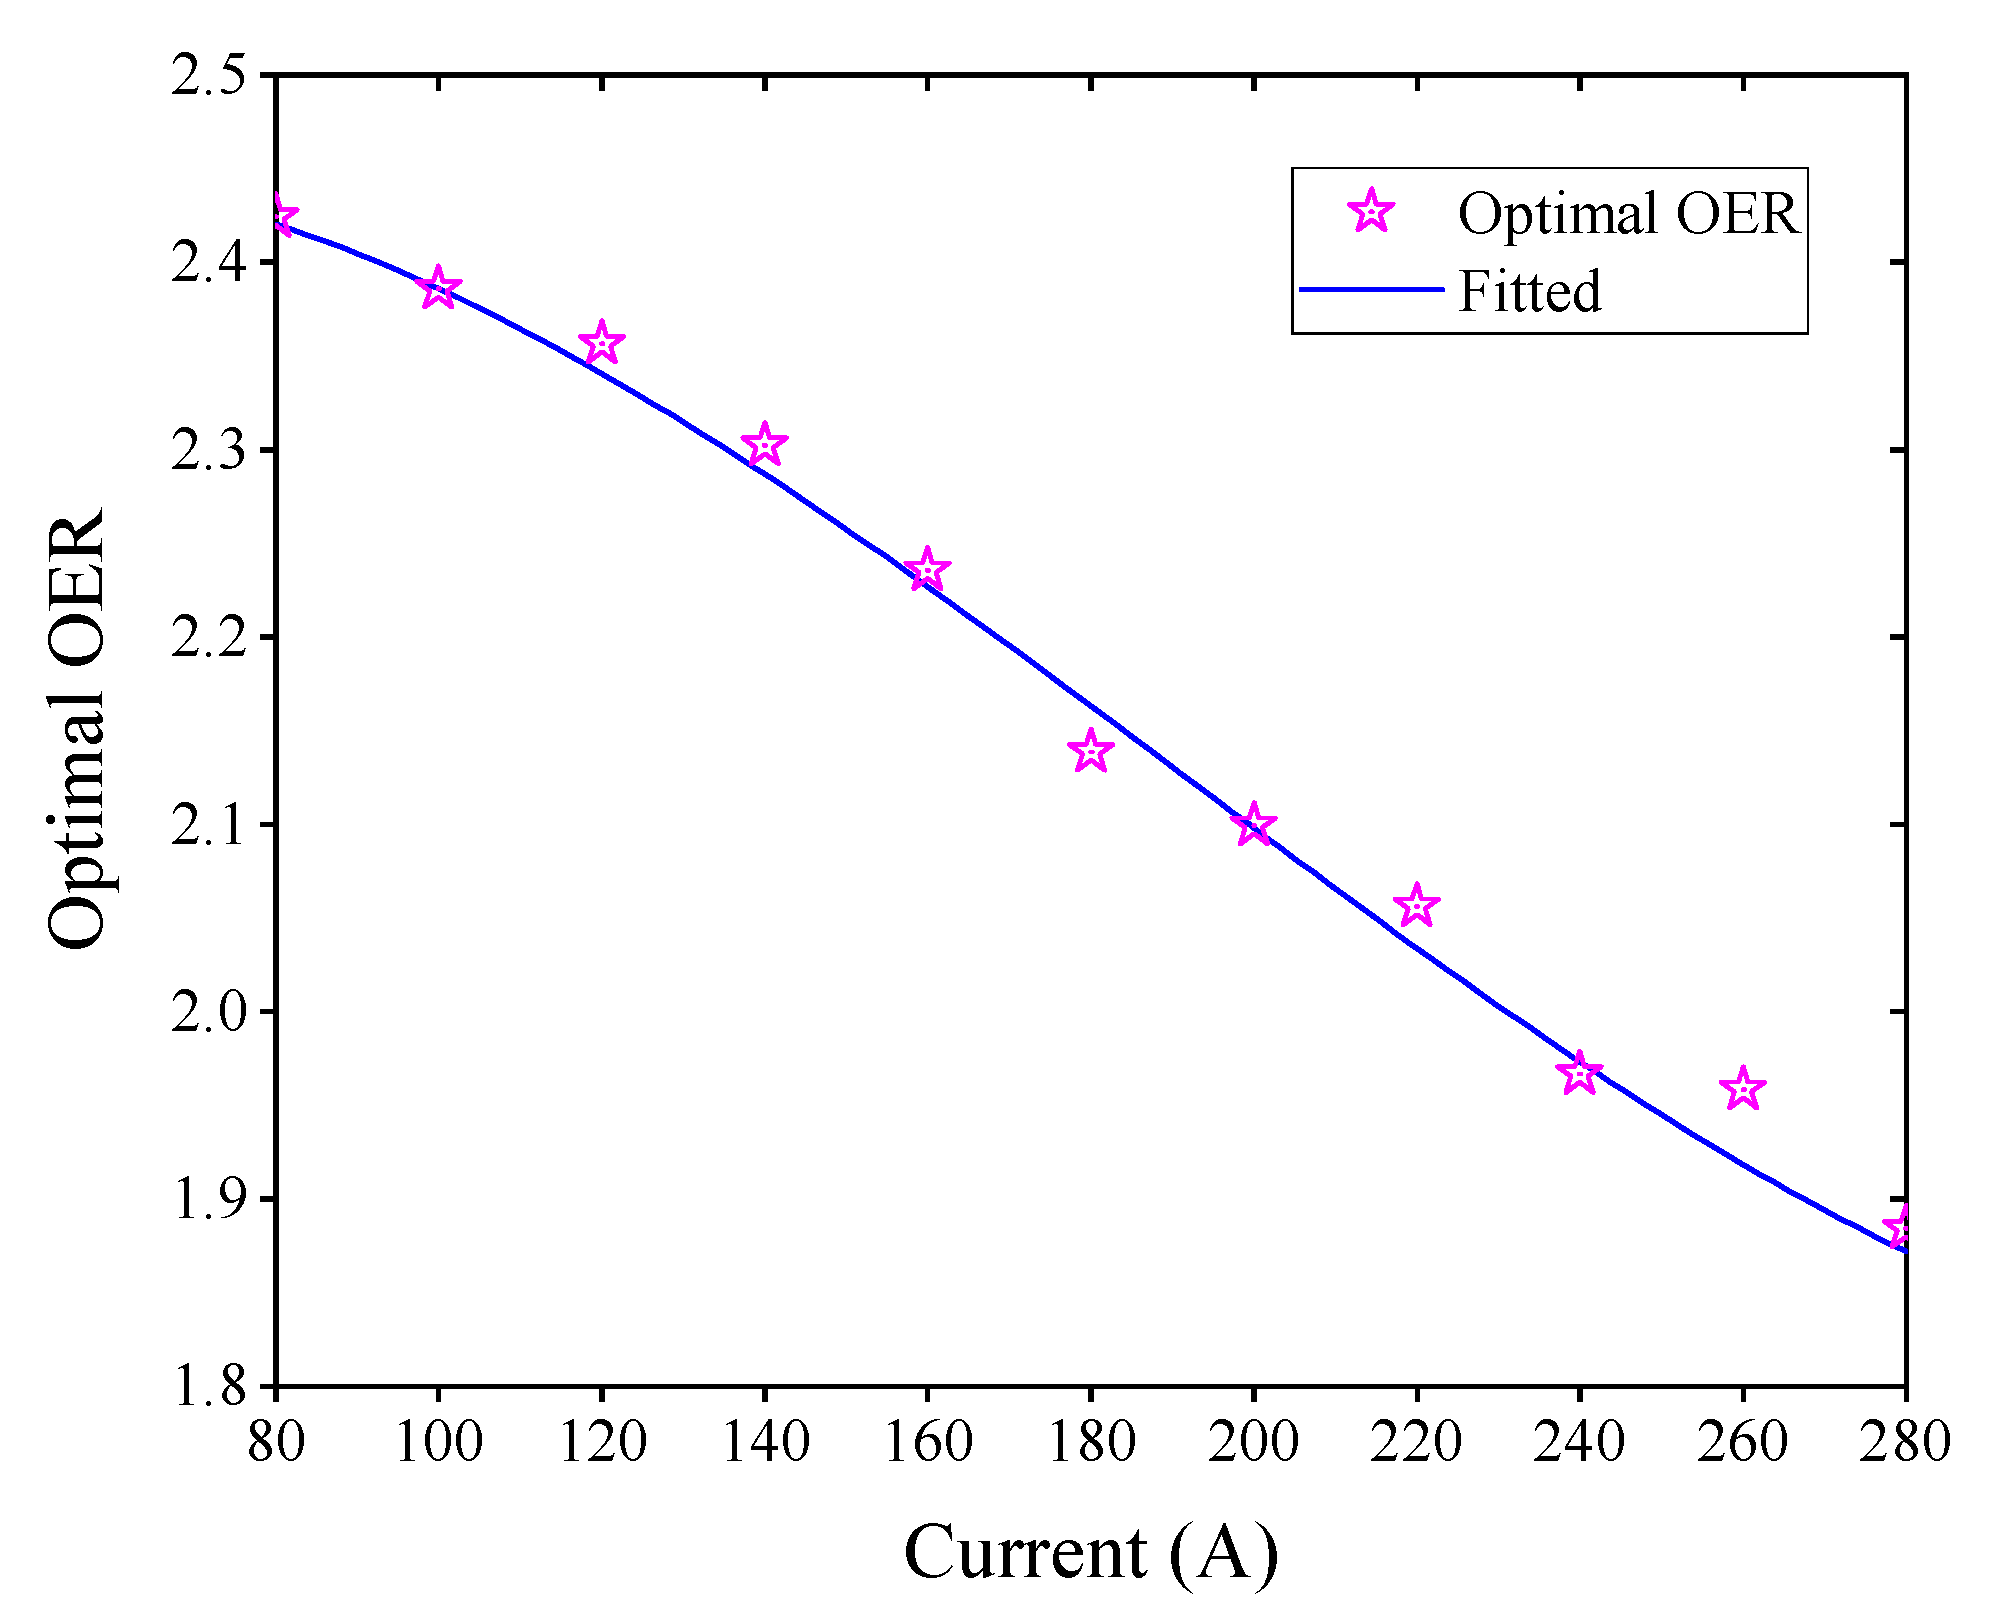
3.1. Fitting of the Optimal OER
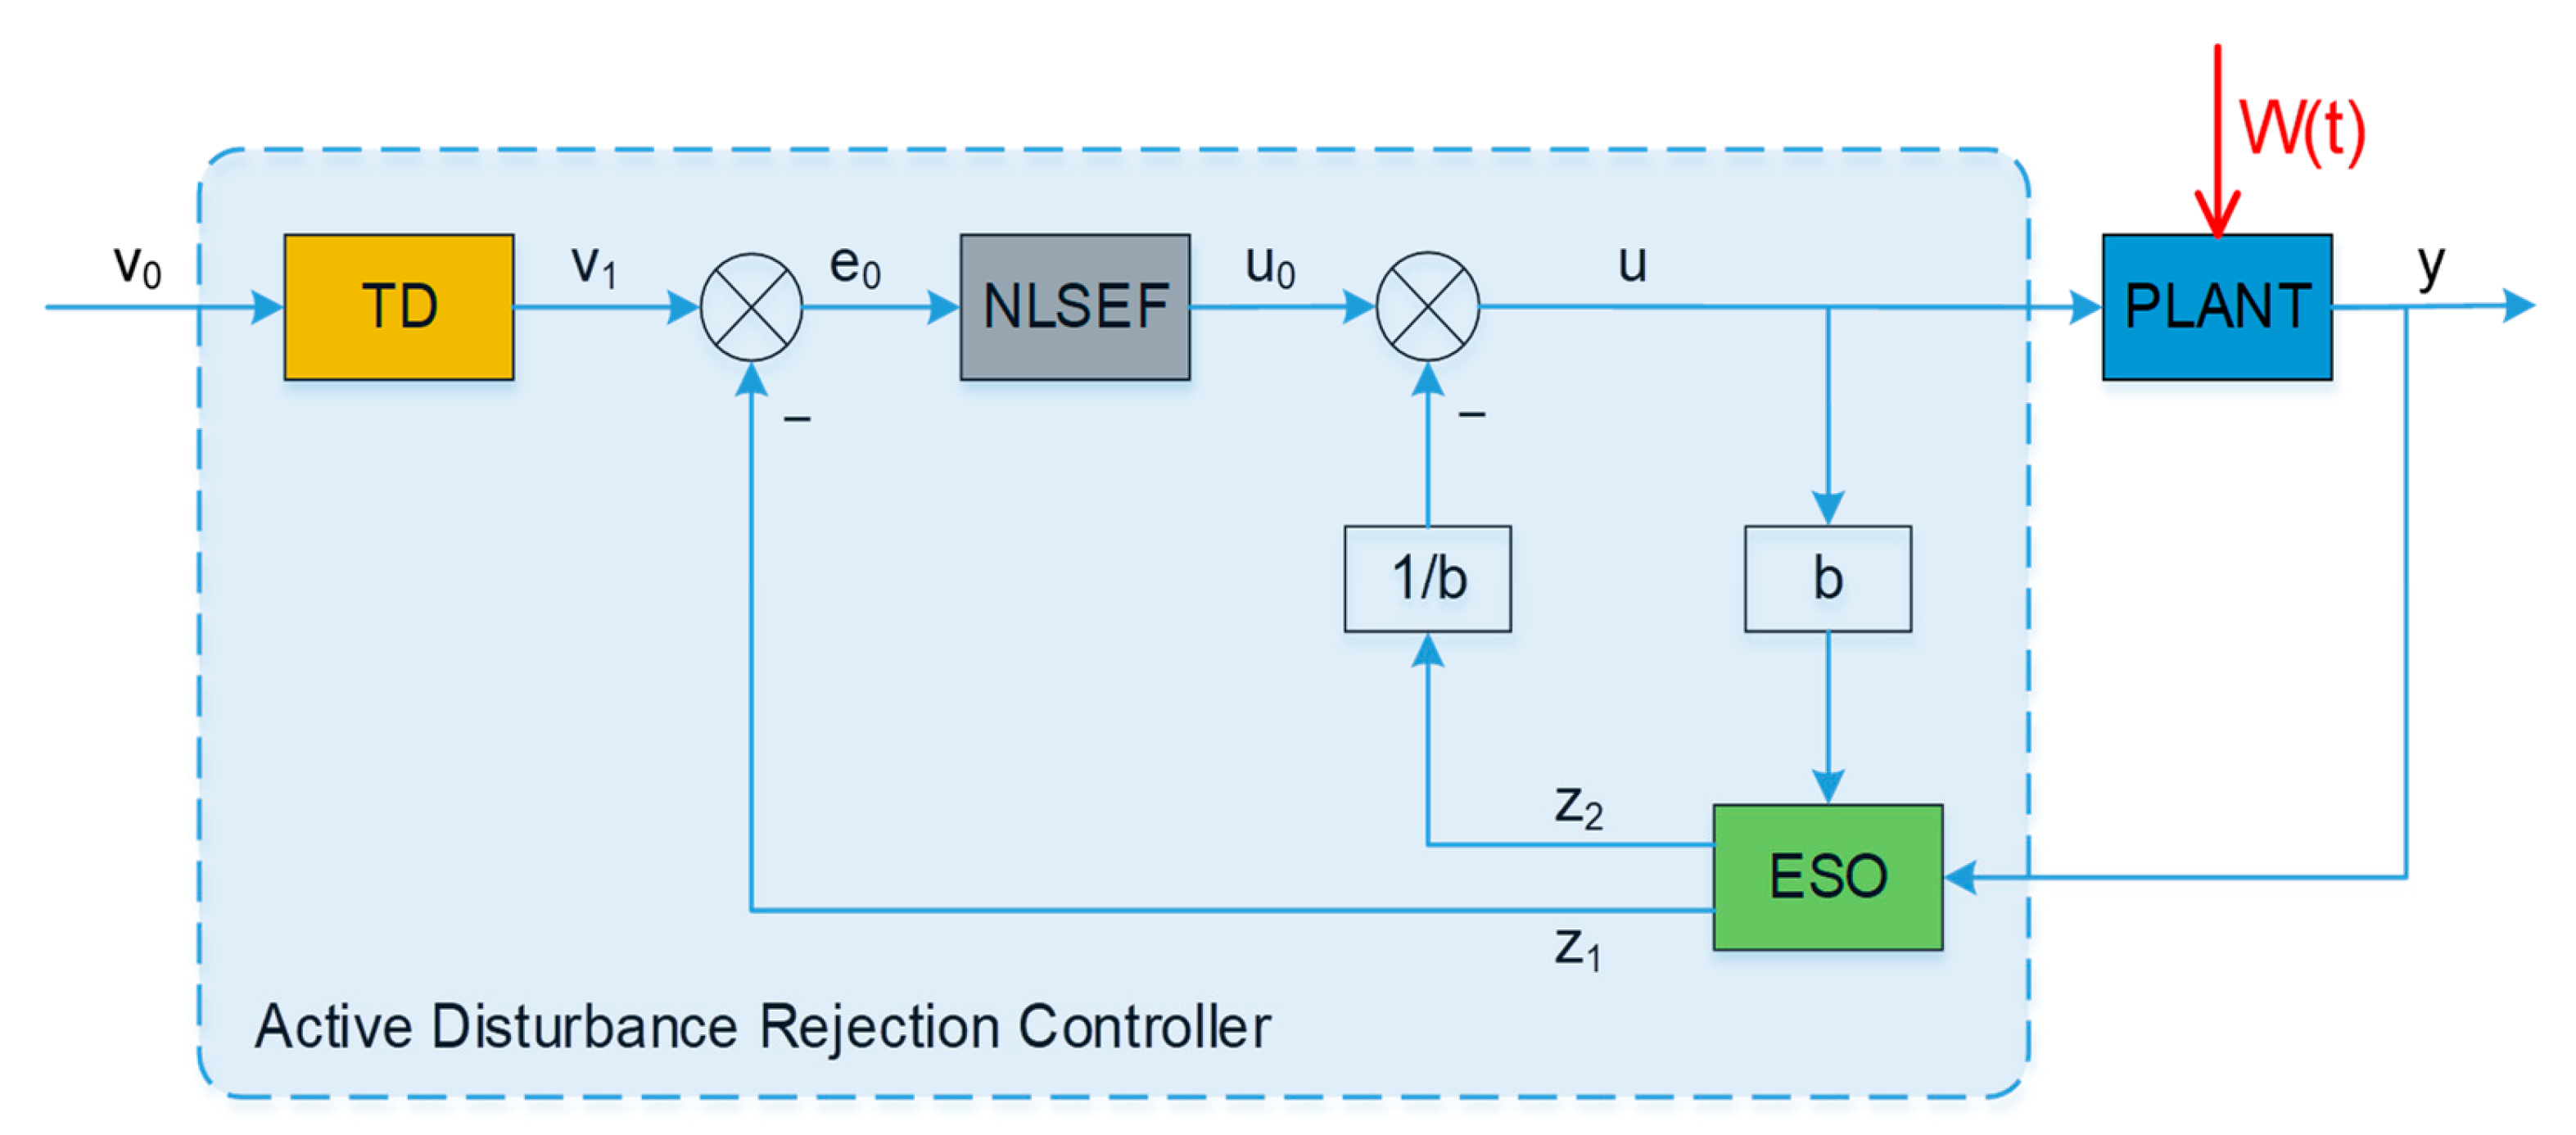
A proper value of λ O 2 is critical for the PEMFC system in the view of improving energy efficiency and system performance. In this study, we are not just concerned with adjusting the λ O 2 , but also with maintaining it at its best value to achieve the maximal net power output. As mentioned earlier, the air compressor has the largest share of all parasitic power in PEMFC; if the other parasitic powers are ignored, the total power of PEMFC ( P s t ) minus the power consumed by the compressor ( P c m ) is the net output power ( P n e t ), as expressed in Equation (32) [21]:
P n e t = P s t P c m
with
P s t = V s t × I s t
P c m = τ c m · ω c p = v c m R c m v c m k v ω c p
The control objective of λ O 2 is set to a constant, usually 2, to simplify the problem in some studies [31,32]. However, a fixed λ O 2 does not guarantee the maximal system P n e t under different load conditions. Thus, in this study, an optimal λ O 2 curve is fitted based on realizing the maximal P n e t . Figure 2 illustrates the relationship between the λ O 2 and P n e t at different currents in the range of 80–280 A. In a certain current, the P n e t of the system has a tendency to increase first and then decreases with the increase of λ O 2 . The optimal λ O 2 reference ( λ O 2 , r e f ) can be obtained via linking the optimal points with the highest P n e t at various load currents, as shown by the grey dashed line in Figure 2. These points are further extracted to visualize the relationship between the λ O 2 , r e f and I s t . Moreover, the λ O 2 , r e f is fitted as the nonlinear function of I s t , as shown in Figure 3, with the mathematical expression in Equation (35).
λ O 2 , r e f = 5 × 10 8 I s t 3 2.87 × 10 5 I s t 2 + 2.23 × 10 3 I s t + 2.4

3.2. ADRC Algorithm

ADRC is composed of three major components: the TD, ESO, and NLSEF. It is unique in that it considers total uncertainties affecting the controlled plant as an “unknown disturbance” and then is predicted and eliminated by using the input–output data of the plant.
Figure 4 illustrates the ADRC’s basic control structure. v 0 denotes the desired value, u is the control variable, y is the control objective, W t represents the external disturbance, z 1 is the observed value of the system state variable, z 2 is the observed value of the system total disturbance state variable.
An uncertain, time-varying, and nonlinear plant can be abstractly expressed as
y ˙ = f t , y , , W t + b u
where y is the system output, u is the input, f ( ) represents the ‘total disturbance’ ( f t o t a l ) integrating the system internal and unknown external disturbances, and b refers to the gain of the control variable. Express the normal state as x 1 = y and the extended state as x 2 = f t o t a l , then Equation (36) can be written in a state-space form:
x ˙ 1 x ˙ 2 = 0 1 0 0 x 1 x 2 + b 0 u + 0 1 f ˙ t o t a l y = 1 0 x 1 x 2
The TD regards the desired value of OER v 0 as the input and obtains v 1 [27]:
v ˙ 1 = v 1 h f a l v 1 v 0 , α 0 , δ 0
where h indicates the sampling period, α 0 denotes the speed factor, and f a l · refers to the maximal speed control synthesis function, and its expression is as follows [27]:
f a l x , α , δ = x α s i g n x , x > δ x δ 1 α , x δ
The ESO is able to observe the system state variable ( λ O 2 , f t o t a l ), and the observations are z 1 and z 2 , respectively [27].
ε 1 = z 1 y z ˙ 1 = z 2 + β 01 f a l ε 1 , α 1 , δ + b u z ˙ 2 = β 02 f a l ε 1 , α 2 , δ
where z 1 and z 2 are the estimates of x 1 and x 2 , respectively. β 01 and β 02 are adjustable parameters and the value can be merged as one observer bandwidth ω 0 [33], with β 01 = 10 ω 0 and β 02 = 2 ω 0 2 .
The NSEFL processes the error noise of TD and ESO nonlinearly to obtain the input of the controlled plant u [27].
ε 2 = v 1 z 1 u 0 = β f a l ε 2 , α , δ u = u 0 z 2 b
where β is the scaling factor for the feedback control law.
Therefore, the application of the ADRC algorithm to the PEMFC λ O 2 control can be further expressed as:
d λ O 2 d t = f t o t a l + b × v c m
x 1 = λ O 2 x 2 = f t o t a l y = x 1 u = v c m
The diagrammatic sketch of the ADRC OER control structure is shown in Figure 5.

4. Results and Discussion

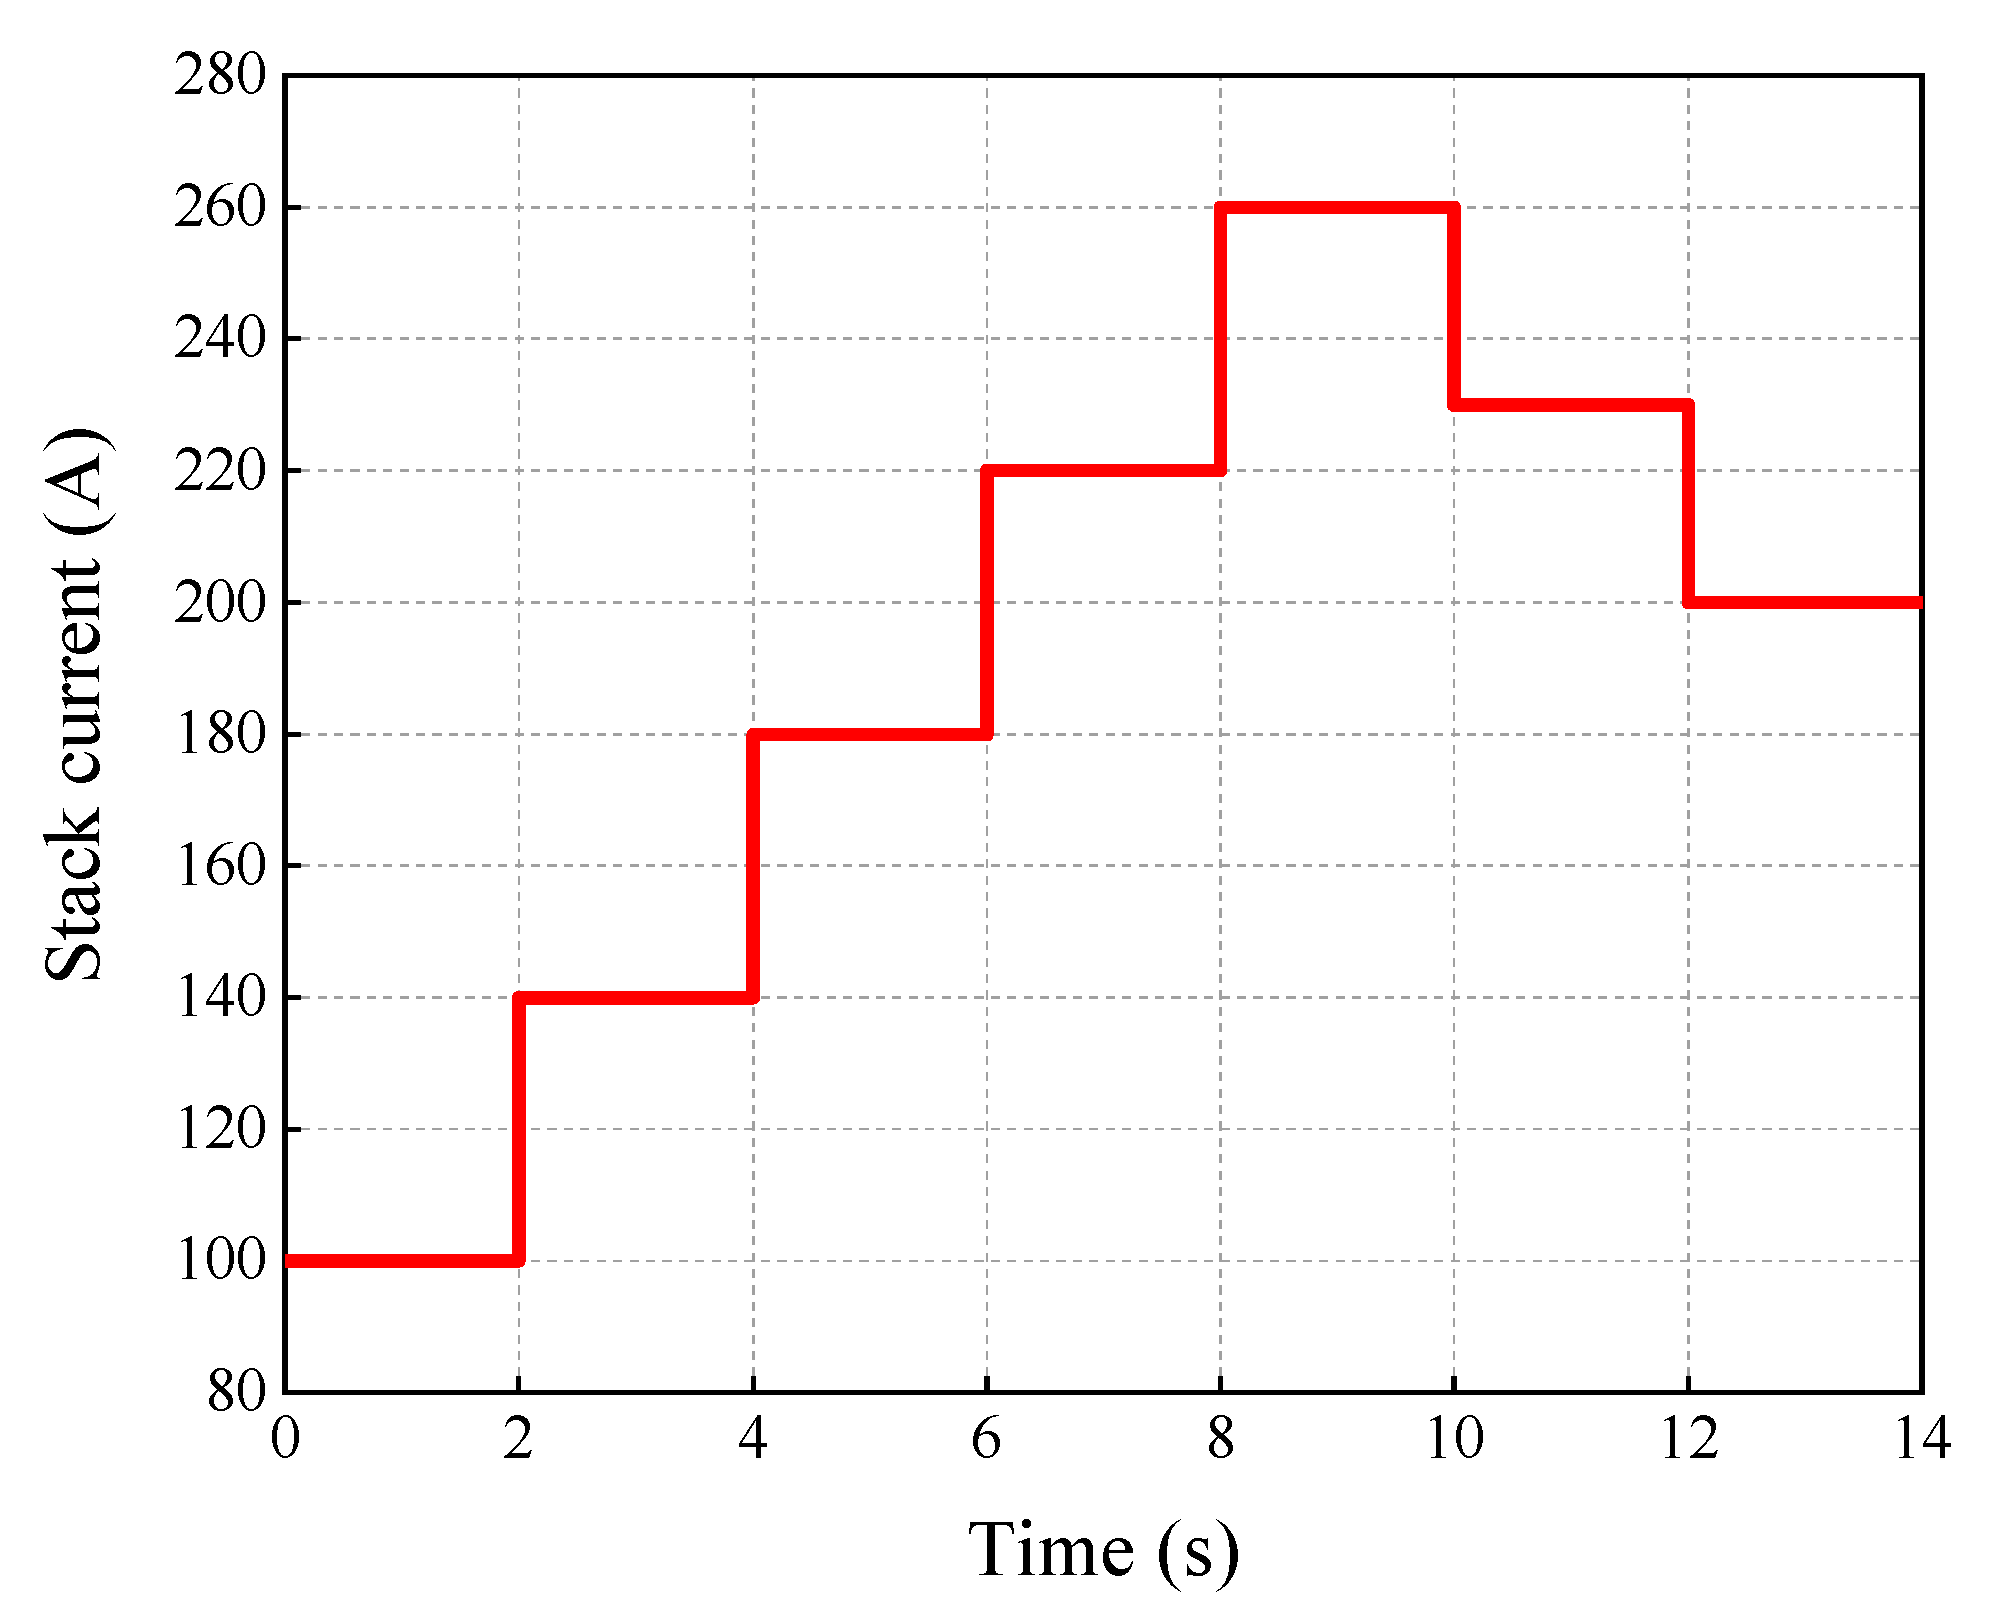
4.1. Simulation Scenario

A simulation scenario is designed in this section to verify the effectiveness of the proposed approach. Figure 6 shows a step-load current profile over time. The load current varies six times under the stable state of 100A, 140A, 180A, 220A, 260A, 230A, and 200A. The nonlinear PEMFC model consisting of a series of equations and look-up tables and the ADRC control strategy have been developed using a desktop computer with a powerful Intel core i7-9700K CPU (3.6 GHz, 8 cores, and 16 GB RAM). Furthermore, the simulation is carried out in the MATLAB/Simulink version 9.11.0 (R2021b) environment. The emulation duration and maximum step size are, respectively, set to 14 and 0.05 s. In addition, the PEMFC parameters employed for the simulation are listed in Table 1 and Table 2. The fuel cell model parameters used in this study are based on the 75 kW stack of the Ford P2000 fuel cell vehicle and the membrane parameters are from the Nafion 117 membrane [31].

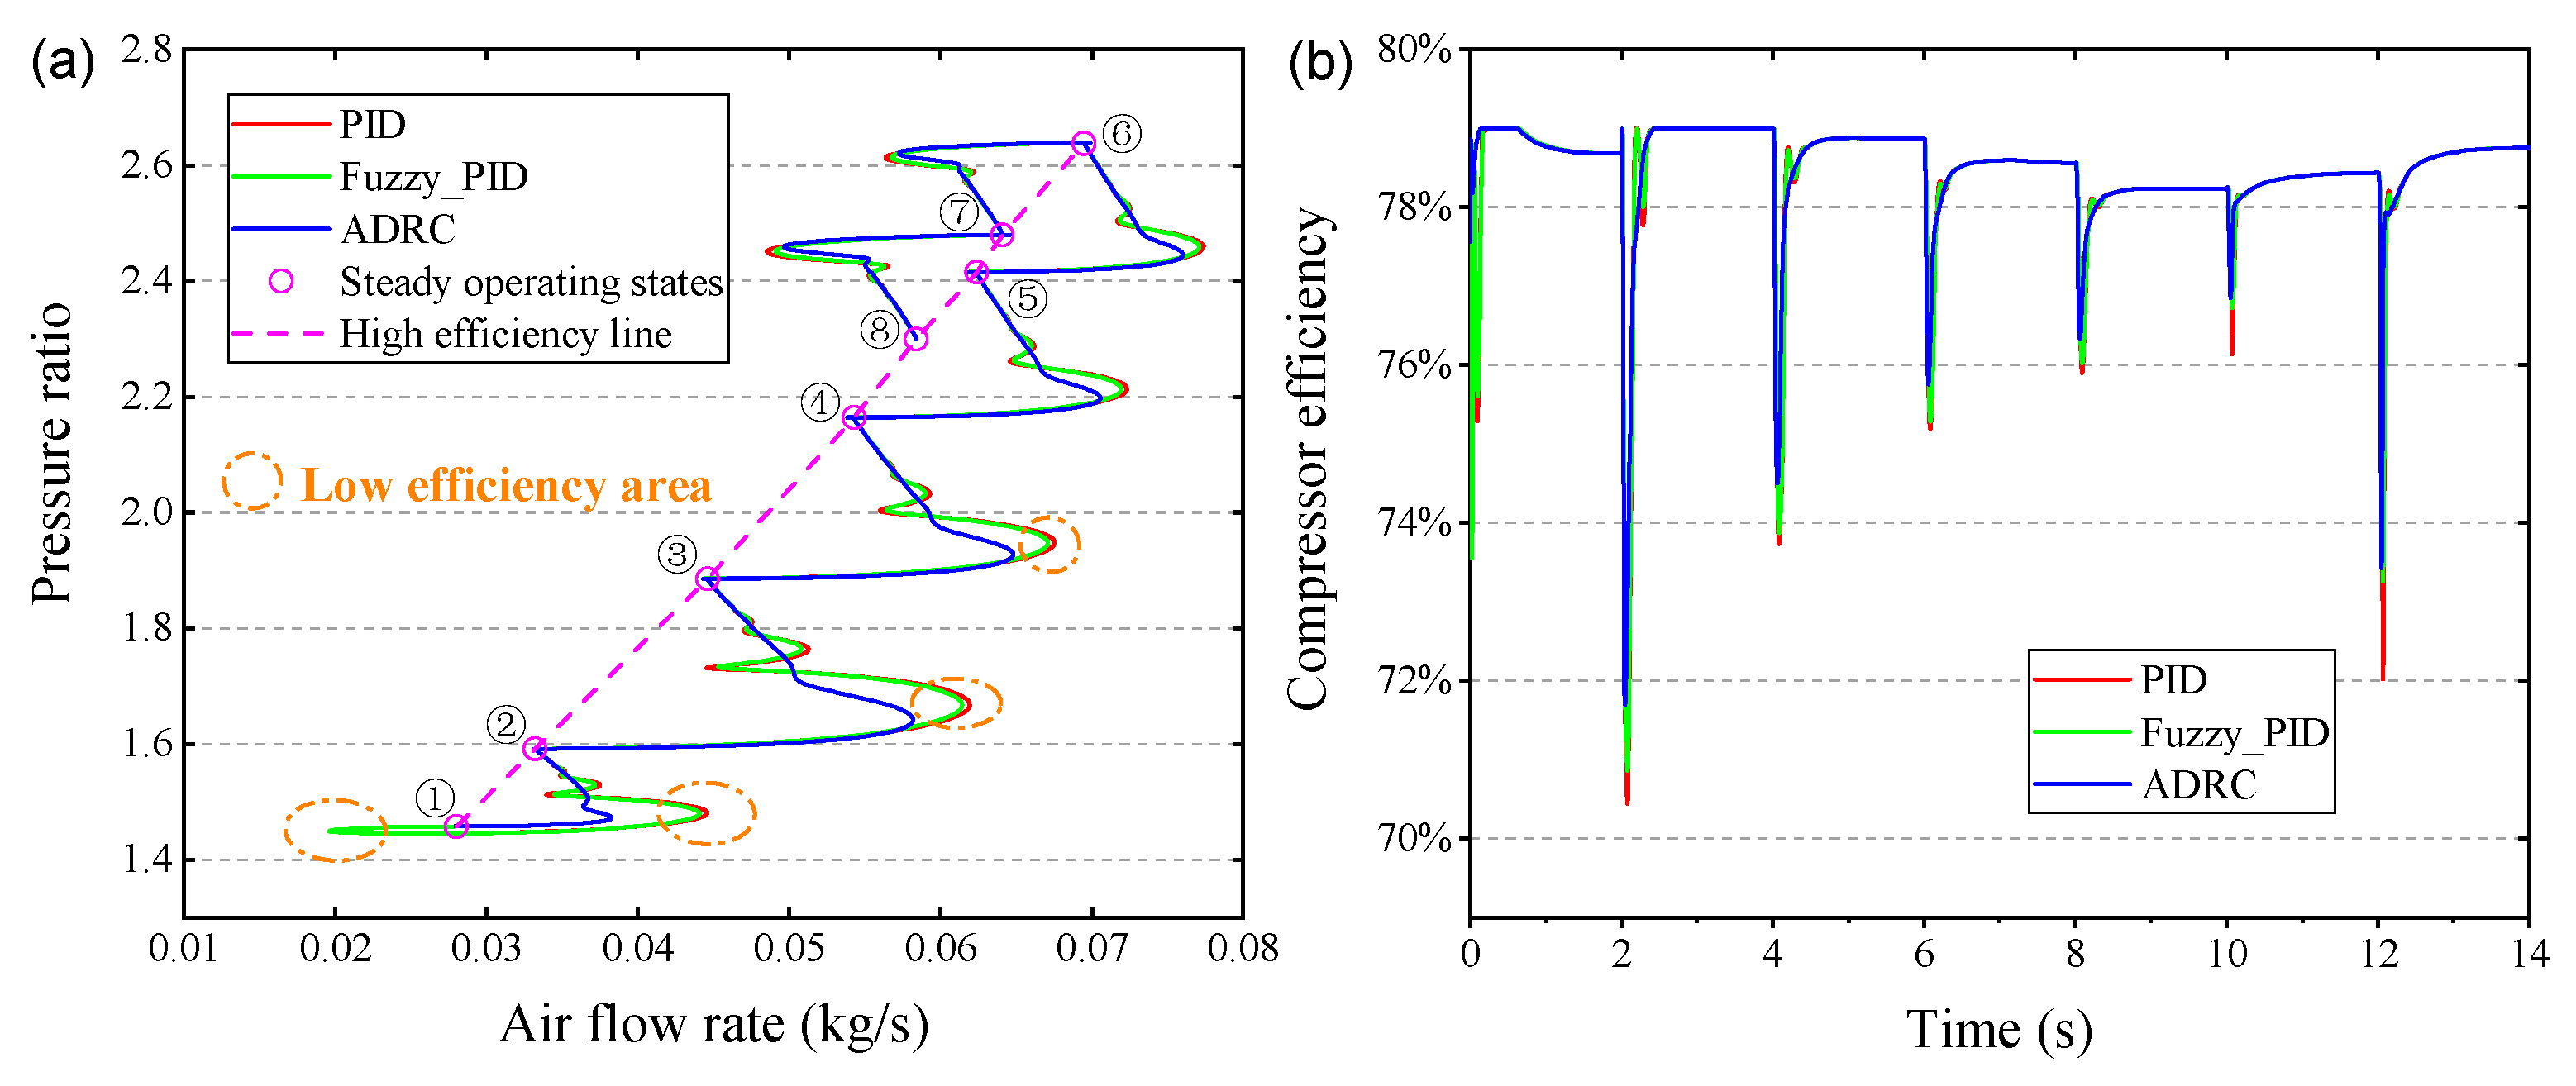
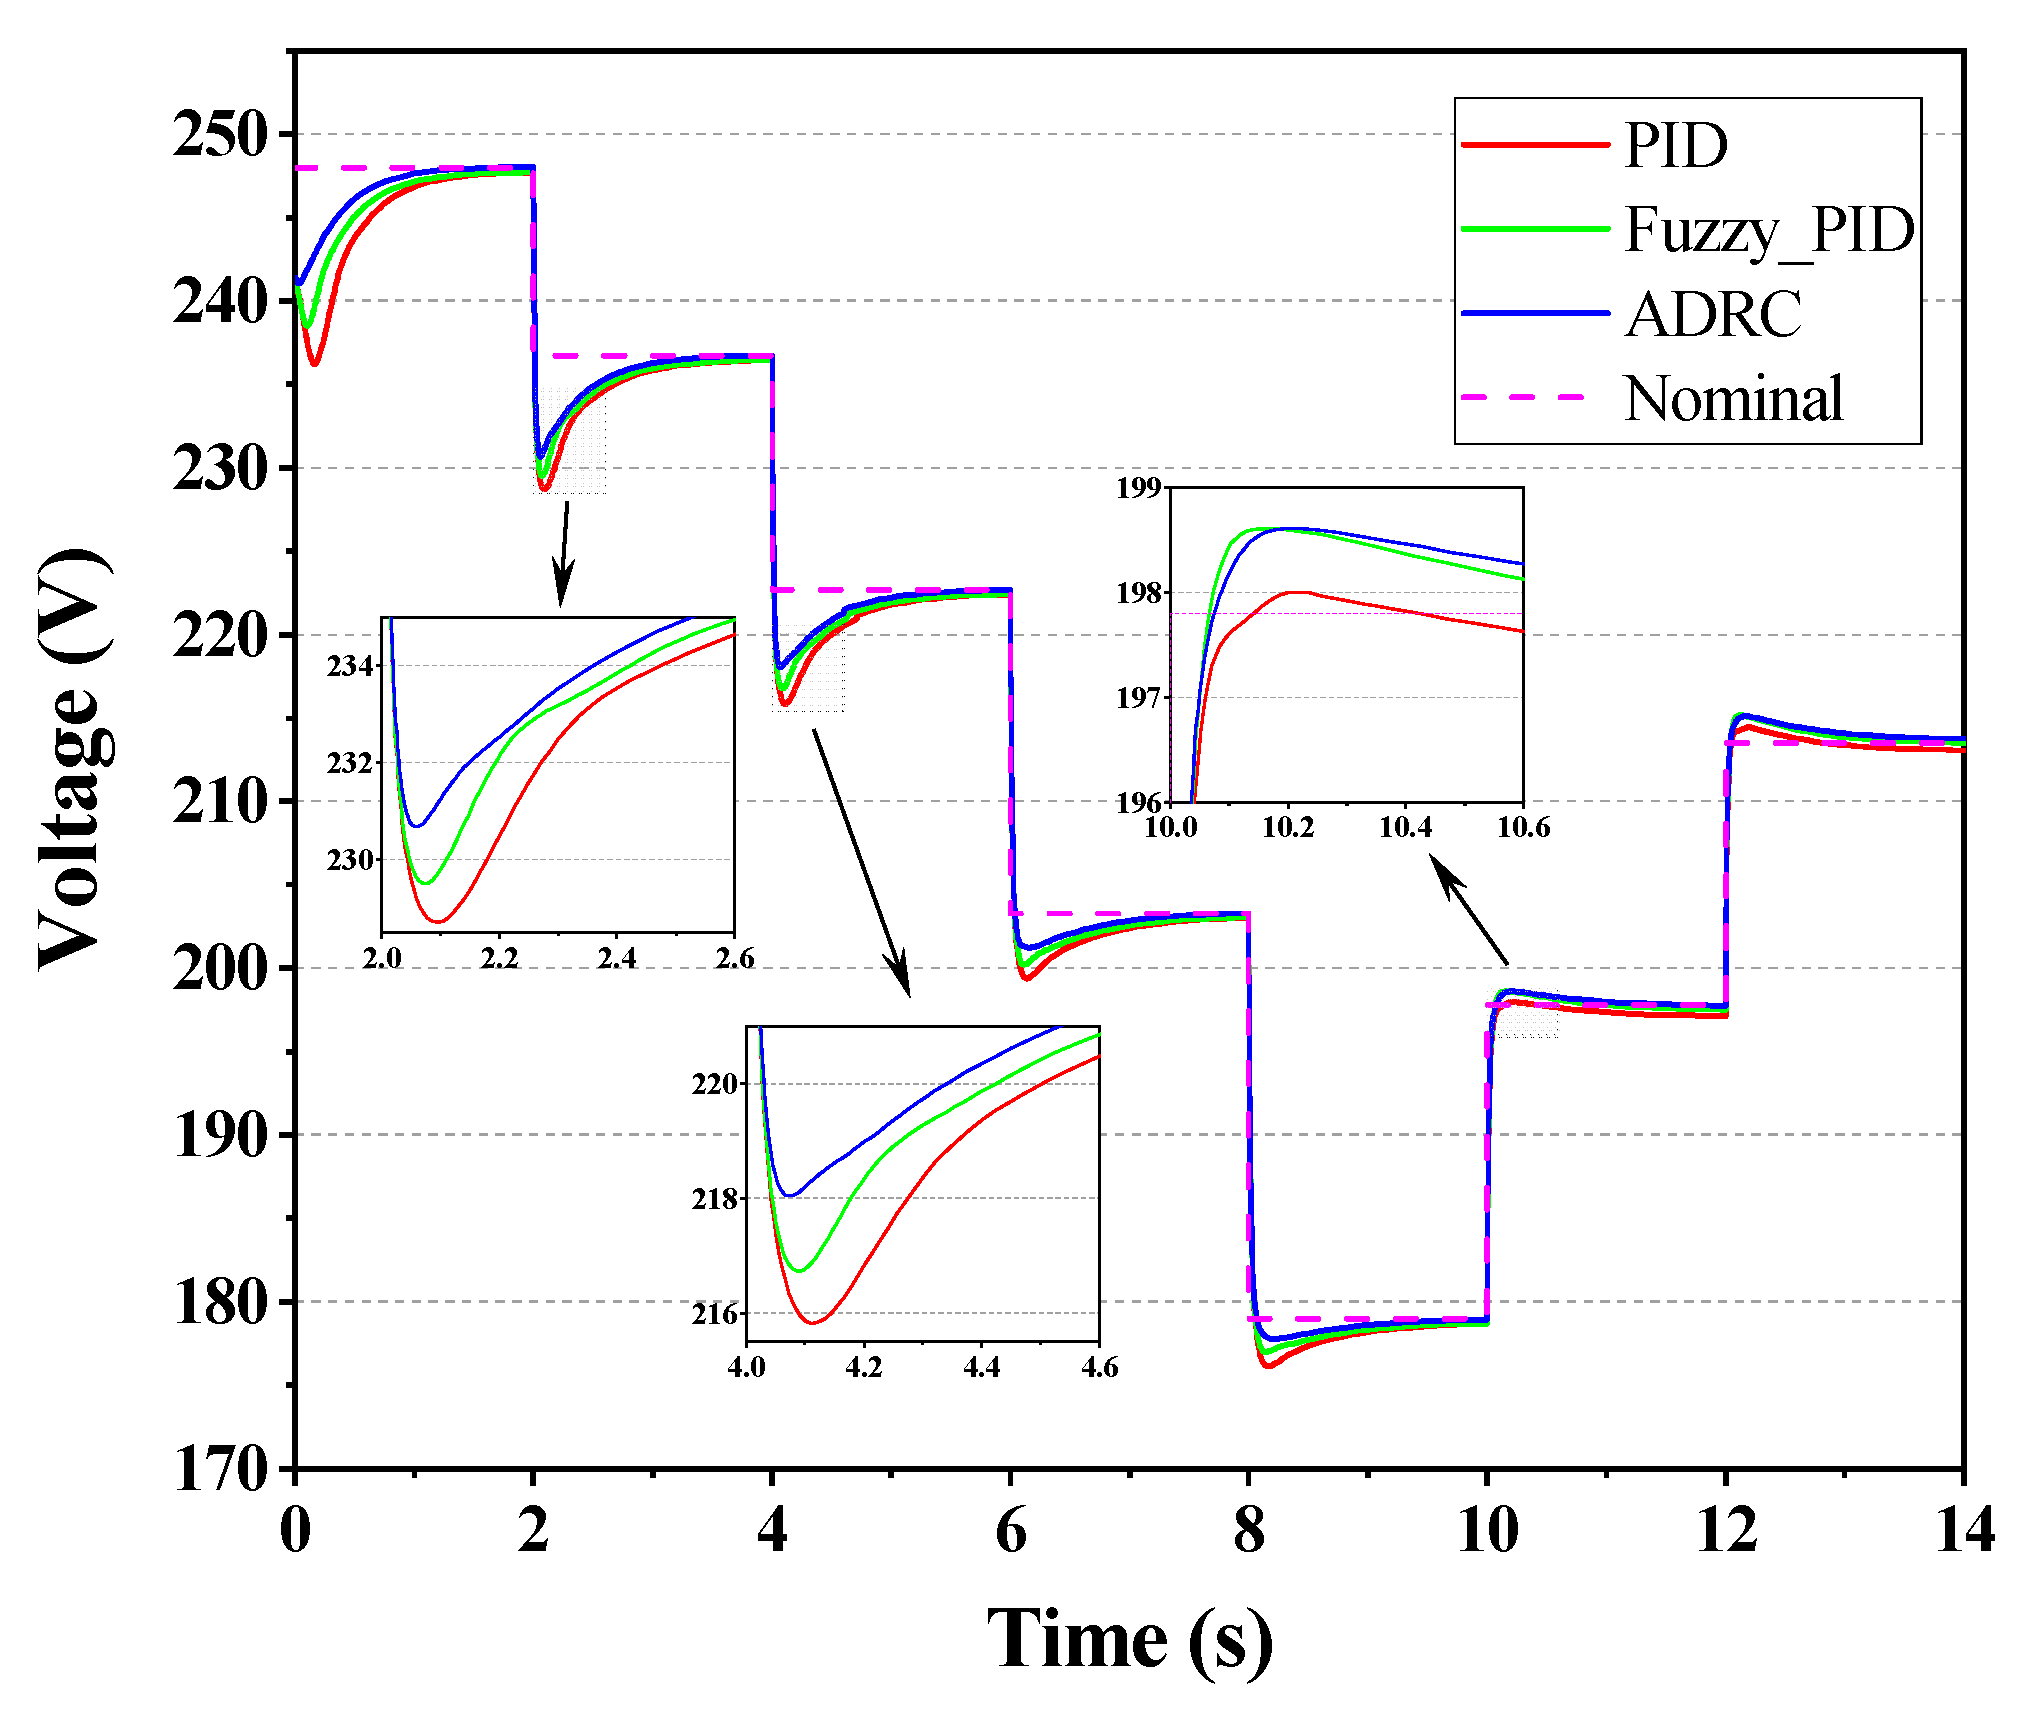
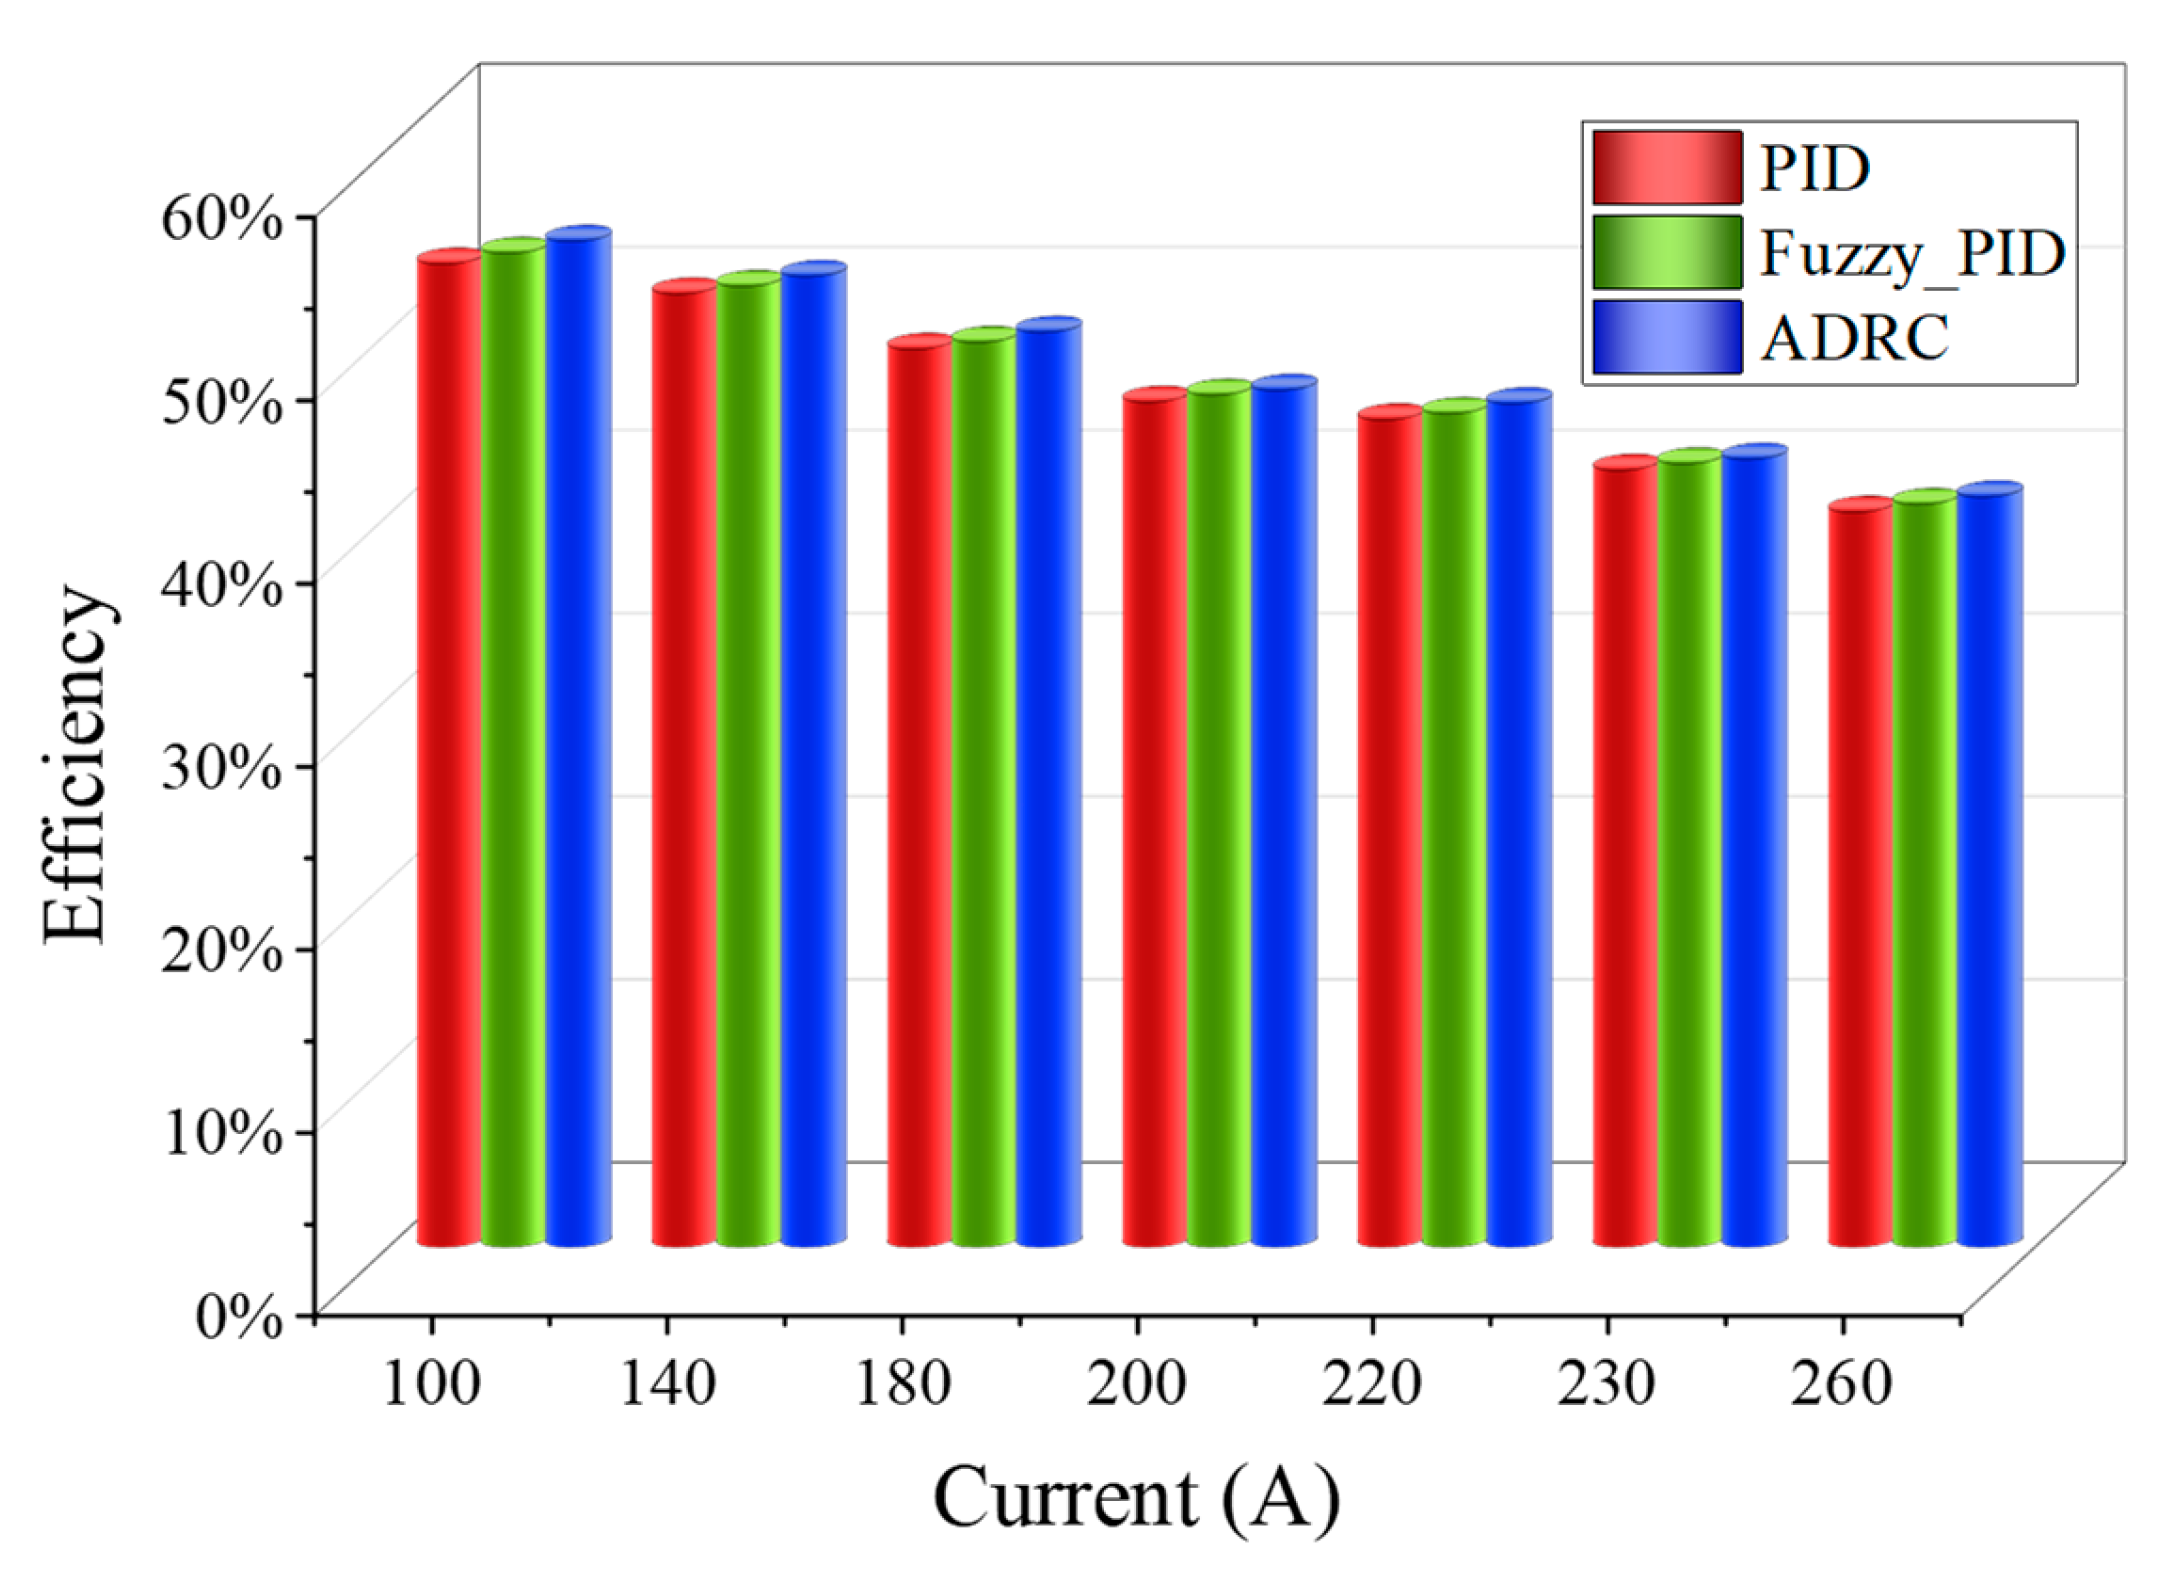
4.2. The Performance Comparison of Different Control Methods in PEMFC OER Control

To demonstrate the superiority of the ADRC algorithm, we added PID and fuzzy-PID control for comparison; the simulation results are expressed in Figure 7. Obviously, all three control strategies have oscillating behavior when the load current is varied in steps, then converge to λ O 2 , r e f with various stabilization times. However, both PID and fuzzy-PID control have a larger oscillation and longer stabilization time in terms of dynamic response. Considering overshoot, oscillation, and robustness, the ADRC OER control produces a much more satisfactory performance than PID and fuzzy-PID control in the case of dynamic load currents.
Figure 8 shows the absolute error of λ O 2 tracking under different control methods. Moreover, the quantitative analysis is discussed. In this paper, the RMSE, MAE, and IAE are used to evaluate the control performance. These three types of errors are calculated by Equations (44)–(46), respectively [1,22]:
R M S E = 1 n i = 1 n λ ^ O 2 _ i λ O 2 _ i 2
M A E = 1 n i = 1 n λ ^ O 2 _ i λ O 2 _ i
I A E = 0 λ ^ O 2 _ i λ O 2 _ i d t
where n is the number of samples for the entire process; λ ^ O 2 _ i is the simulated λ O 2 at the i -th sampling time; and λ O 2 _ i represents the desired value at the i -th sampling time. In addition to ensuring control accuracy, the control cost should also be taken into account. TV is often used by other researchers and its definition is as follows [20,34]:
T V = i = 1 u i + 1 u i
where u i + 1 u i denotes the voltage shift in one control step. Furthermore, a new indicator is adopted to measure the control work, namely, the curve length of the trajectory in Figure 9a, using L t means. It refers to the total number of strokes experenced by the compressor when the air-feed system is in operation. The statistical results are summarized in Table 3. It is worth mentioning that, compared with PID and fuzzy-PID control, the IAE of ADRC is reduced by 50% and 41.7% respectively, and the other evaluation indicators are also the lowest. It can be claimed that the proposed ADRC algorithm can greatly improve the control performance with a lower control cost, and outperforms the other two methods in PEMFC OER control.
The optimum energy criterion for the instantaneous compressor motion is without doubt along the magenta dashed line in Figure 9a, near which is the high efficiency region. Compared with PID and fuzzy-PID control, the ADRC trajectory deviates less from the high efficiency line. Figure 9b also verifies that the instantaneous η c p of ADRC has less overshoot than that of PID and fuzzy-PID control. As a result, the ADRC shows less reduction in η c p maintained during OER regulation. This means that the ADRC can make the air compressor save more energy and reduce the wear of the compressor device, thus prolonging the service life and durability of the compressor.
Figure 10 illustrates the output voltage curves of PEMFC under different OER control strategies. The nominal voltage is the maximum voltage that can be achieved under the optimal OER reference of the simulated current (as shown in Figure 6) when the operation temperature is 353.15 K and λ H 2 = 1. It is obvious that the output voltage of ADRC can quickly converge to the nominal voltage with a smaller overshoot and fluctuation, while the output voltage of PID and fuzzy-PID control has a longer stabilization time and a larger overshoot, and even cannot converge to the nominal voltage. The output voltage of ADRC is basically the highest during the whole simulation process.
Figure 11 shows the variation in PEMFC efficiency ( η s t ) with different load currents, and it depicts that the η s t decreases with the increase of I s t . Equation (48) provides the calculation method for η s t . On average, the η s t with ADRC OER control is approximately 1.84% and 0.95% higher than that of PID and fuzzy-PID control, respectively, for a given external load condition. Due to the ADRC estimates which eliminate the disturbances generated in load changes, the response time and overshoot can be effectively reduced; thus, the dynamic response of PEMFC is improved. As a result, based on the ADRC λ O 2 control, the thermodynamic performance and η s t of PEMFC has been significantly enhanced.
η s t = v f c E n e r n s t × 100 %

4.3. Performance Verification of ORCS

In this part, two fixed-reference values are chosen as OER control objectives and compared with the optimal-reference control objective to further prove the advantages of ORCS.
Figure 12a shows that the OER control results of ORCS and the contrastive FRCS with λ O 2 equal 2.3 and 2, respectively. The corresponding errors are shown in Figure 12b. It is indicated that ADRC can achieve a satisfactory control effect under ORCS and FRCS with λ O 2 = 2, but the error is larger under FRCS with λ O 2 = 2.3. At the 12th second, there is a large fluctuation in the red dashed line and a longer convergence time, which may be caused by the untimely air supply due to the compressor surge. This conjecture is confirmed by Figure 12c, where the η c p under FRCS with λ O 2 = 2.3 drops sharply to 10% at the 12th second, indicating that the compressor has experienced a surge. Furthermore, as shown in Figure 12c, the ORCS can always keep the compressor working at high efficiency, which is of great significance for reducing compressor wear and improving the durability and service life of the equipment.
Figure 12d illustrates the net power output results under different control objectives. The nominal value is the maximum net power that can be reached under the given simulation currents (as shown in Figure 6) when the operating temperature is 353.15 K and λ H 2 is 1. As can be seen from Figure 12d, when the current changes under the condition of load pulling, the “spike” of the net power output curve of FRCS is very large, and even cannot converge to the nominal value. This is caused by the shortage of oxygen in the stack due to the untimely air supply, resulting in the instantaneous drop in voltage and the excessive overshoot of net power reduction. In particular, the net power overshoot of FRCS with λ O 2 = 2.3 is the most serious, and the net output power drops sharply at the 12th second, which is caused by compressor surge. In contrast, the “spike” of the net output power curve of ORCS is smoother and can quickly converge to the nominal value. In addition, the net output power of ORCS is optimal throughout the operation process. Compared to the FRCS with λ O 2 = 2.3, the ORCS results in an average increase in the system net power of approximately 1.85%. This shows that the proposed ORCS can effectively improve the dynamic response of air under the load-pulling condition and avoid oxygen starvation.

5. Conclusions

In this study, a PEMFC system model is established with the goal of addressing oxygen starvation, and the ADRC is proposed for PEMFC OER regulation. Moreover, an ORCS based on maximizing net power is proposed. The conclusions of the article are as follows:
(1)
Compared with PID and fuzzy-PID control, the ADRC can significantly improve the control performance with a lower control cost and less wear on the compressor; the IAE of OER control is reduced by up to 50%.
(2)
Since the air can be fed to the fuel cell more promptly to cope with the sudden current changes in load-pulling conditions, the output voltage is improved and the PEMFC efficiency is increased by up to 1.84% under the ADRC OER control.
(3)
The system performance of the ADRC OER control under ORCS and FRCS is also discussed. The results indicate that the ORCS increases the system net output power by up to 1.85% compared with FRCS.
In future work, other study cases based on physical verification or semi-physical simulation verification, such as HiL experiments, will be carried out. More importantly, the ADRC will be compiled into an actual controller hardware for the experimental verification of a real vehicular PEMFC system.

Author Contributions

H.W.: conceptualization, methodology, software, validation, and writing—original draft. C.D.: writing—review & editing, investigation, and supervision. All authors have read and agreed to the published version of the manuscript.

Funding

This research was funded by the Key R&D project of Hubei Province, China (2021AAA006), and Foshan Xianhu Laboratory of the Advanced Energy Science and Technology Guangdong Laboratory (XHD2020-003).

Data Availability Statement

The data are available from the corresponding author upon request.

Conflicts of Interest

The authors declare no conflict of interest.

Nomenclature

PEMFCProton-Exchange Membrane Fuel CellVVoltage (V) or volume (m3)
OEROxygen Excess RatioICurrent (A)
ADRCActive Disturbance Rejection ControlGreek symbols
GHGGreenhouse Gases γ Ratio of the specific heats of air
ICEVInternal Combustion Engine Vehicle ρ Density (kg/m3)
PIDProportion–Integral–Differential η Efficiency (%)
FLCFuzzy Logic Control λ m Membrane water content
SMCSliding Mode Control ϕ Relative humidity (%)
MRACModel-Referenced Adaptive Control λ Excess ratio
MPCModel Predictive Control ω Angular speed (rad/s)
DDRLDistributed Deep Reinforcement Learning τ Torque (N⋅m)
ACAlternating Current δ Filter factor
DCDirect Current ε Error
ORCSOptimal-Reference Control StrategySubscripts
FRCSFixed-Reference Control StrategyatmAtmospheric
BOPBalance of PlantcaCathode
PTCPositive Temperature CoefficientcmCompressor motor
TDTracking DifferentiatorcpCompressor
ESOExtended State ObserverfcFuel cell
NLSEFNonlinear State Error FeedbackstStack
CPUCentral Processing UnitmMembrane
RAMRandom Access MemoryH2Hydrogen
RMSERoot Mean Square ErrorO2Oxygen
MAEMean Absolute ErrorN2Nitrogen
IAEIntegral Absolute ErrorsatSaturation
TVTotal VariationsmSupply manifold
HiLHardware-in-the-LooprmReturn manifold
p Pressure (Pa)inInlet
TTemperature (K)outOutlet
WMass flow rate (kg/s)refReference
PPower (kW)tTrajectory

References

  1. Wei, H.; He, C.; Li, J.; Zhao, L. Online estimation of driving range for battery electric vehicles based on SOC-segmented actual driving cycle. J. Energy Storage 2022, 49, 104091. [Google Scholar] [CrossRef]
  2. Chen, X.; Shuai, C.; Wu, Y.; Zhang, Y. Analysis on the carbon emission peaks of China’s industrial, building, transport, and agricultural sectors. Sci. Total. Environ. 2019, 709, 135768. [Google Scholar] [CrossRef] [PubMed]
  3. Liu, Z.; Zhang, B.; Xu, S. Research on air mass flow-pressure combined control and dynamic performance of fuel cell system for vehicles application. Appl. Energy 2022, 309, 118446. [Google Scholar] [CrossRef]
  4. Shen, J.; Du, C.; Yan, F.; Chen, B.; Tu, Z. Experimental study on the dynamic performance of a power system with dual air-cooled PEMFC stacks. Appl. Energy 2022, 326, 120025. [Google Scholar] [CrossRef]
  5. Chen, J.; Liu, Z.; Wang, F.; Ouyang, Q.; Su, H. Optimal Oxygen Excess Ratio Control for PEM Fuel Cells. IEEE Trans. Control. Syst. Technol. 2017, 26, 1711–1721. [Google Scholar] [CrossRef]
  6. Yousfi-Steiner, N.; Moçotéguy, P.; Candusso, D.; Hissel, D. A review on polymer electrolyte membrane fuel cell catalyst degradation and starvation issues: Causes, consequences and diagnostic for mitigation. J. Power Sources 2009, 194, 130–145. [Google Scholar] [CrossRef]
  7. Chen, H.; Zhao, X.; Zhang, T.; Pei, P. The reactant starvation of the proton exchange membrane fuel cells for vehicular applications: A review. Energy Convers. Manag. 2019, 182, 282–298. [Google Scholar] [CrossRef]
  8. Chen, H.; Liu, Z.; Ye, X.; Yi, L.; Xu, S.; Zhang, T. Air flow and pressure optimization for air supply in proton exchange membrane fuel cell system. Energy 2021, 238, 121949. [Google Scholar] [CrossRef]
  9. Hou, J.; Yang, M.; Ke, C.; Zhang, J. Control logics and strategies for air supply in PEM fuel cell engines. Appl. Energy 2020, 269, 115059. [Google Scholar] [CrossRef]
  10. Pukrushpan, J.; Stefanopoulou, A.; Peng, H. Control of Fuel Cell Power Systems: Principles, Modeling, Analysis and Feedback Design; Springer Science & Business Media: New York, NY, USA, 2004. [Google Scholar]
  11. Suh, K. Modeling, Analysis and Control of Fuel Cell Hybrid Power Systems. Department of Mechanical Engineering; The University of Michigan: Ann Arbor, MI, USA, 2006. [Google Scholar]
  12. Daud, W.; Rosli, R.; Majlan, E.; Hamid, S.; Mohamed, R.; Husaini, T. PEM fuel cell system control: A review. Renew. Energy 2017, 113, 620–638. [Google Scholar] [CrossRef]
  13. Williams, J.G.; Liu, G.; Chai, S.; Rees, D. Intelligent control for improvements in PEM fuel cell flow performance. Int. J. Autom. Comput. 2008, 5, 145–151. [Google Scholar] [CrossRef]
  14. Zhang, H.; Wang, Y.; Wang, D. Adaptive robust control of oxygen excess ratio for PEMFC system based on type-2 fuzzy logic system. Inf. Sci. 2019, 511, 1–17. [Google Scholar] [CrossRef]
  15. Liu, Z.; Chen, H.; Peng, L.; Ye, X.; Xu, S.; Zhang, T. Feedforward-decoupled closed-loop fuzzy proportion-integral-derivative control of air supply system of proton exchange membrane fuel cell. Energy 2021, 240, 122490. [Google Scholar] [CrossRef]
  16. Baroud, Z.; Benmiloud, M.; Benalia, A.; Ocampo-Martinez, C. Novel hybrid fuzzy-PID control scheme for air supply in PEM fuel-cell-based systems. Int. J. Hydrogen Energy 2017, 42, 10435–10447. [Google Scholar] [CrossRef] [Green Version]
  17. Pilloni, A.; Pisano, A.; Usai, E. Observer-Based Air Excess Ratio Control of a PEM Fuel Cell System via High-Order Sliding Mode. IEEE Trans. Ind. Electron. 2015, 62, 5236–5246. [Google Scholar] [CrossRef] [Green Version]
  18. Matraji, I.; Laghrouche, S.; Jemei, S.; Wack, M. Robust control of the PEM fuel cell air-feed system via sub-optimal second order sliding mode. Appl. Energy 2013, 104, 945–957. [Google Scholar] [CrossRef]
  19. Han, J.; Yu, S.; Yi, S. Adaptive control for robust air flow management in an automotive fuel cell system. Appl. Energy 2017, 190, 73–83. [Google Scholar] [CrossRef]
  20. Han, J.; Yu, S.; Yi, S. Oxygen excess ratio control for proton exchange membrane fuel cell using model reference adaptive control. Int. J. Hydrogen Energy 2019, 44, 18425–18437. [Google Scholar] [CrossRef]
  21. Yang, D.; Pan, R.; Wang, Y.; Chen, Z. Modeling and control of PEMFC air supply system based on T-S fuzzy theory and predictive control. Energy 2019, 188, 116078. [Google Scholar] [CrossRef]
  22. Wang, Y.; Li, H.; Feng, H.; Han, K.; He, S.; Gao, M. Simulation study on the PEMFC oxygen starvation based on the coupling algorithm of model predictive control and PID. Energy Convers. Manag. 2021, 249, 114851. [Google Scholar] [CrossRef]
  23. Li, J.; Yang, B.; Yu, T. Distributed deep reinforcement learning-based coordination performance optimization method for proton exchange membrane fuel cell system. Sustain. Energy Technol. Assessments 2021, 50, 101814. [Google Scholar] [CrossRef]
  24. Li, J.; Yu, T. Intelligent Controller Based on Distributed Deep Reinforcement Learning for PEMFC Air Supply System. IEEE Access 2021, 9, 7496–7507. [Google Scholar] [CrossRef]
  25. Heidary, J.; Gheisarnejad, M.; Khooban, M.H. Stability Enhancement and Energy Management of AC-DC Microgrid based on Active Disturbance Rejection Control. Electr. Power Syst. Res. 2023, 217, 109105. [Google Scholar] [CrossRef]
  26. Li, D.; Li, C.; Gao, Z.; Jin, Q. On active disturbance rejection in temperature regulation of the proton exchange membrane fuel cells. J. Power Sources 2015, 283, 452–463. [Google Scholar] [CrossRef]
  27. Chen, X.; Xu, J.; Liu, Q.; Chen, Y.; Wang, X.; Li, W.; Ding, Y.; Wan, Z. Active disturbance rejection control strategy applied to cathode humidity control in PEMFC system. Energy Convers. Manag. 2020, 224, 113389. [Google Scholar] [CrossRef]
  28. Sun, L.; Jin, Y.; You, F. Active disturbance rejection temperature control of open-cathode proton exchange membrane fuel cell. Appl. Energy 2019, 261, 114381. [Google Scholar] [CrossRef]
  29. Wu, D.; Peng, C.; Yin, C.; Tang, H. Review of System Integration and Control of Proton Exchange Membrane Fuel Cells. Electrochem. Energy Rev. 2020, 3, 466–505. [Google Scholar] [CrossRef]
  30. Gong, Z.; Wang, B.; Xu, Y.; Ni, M.; Gao, Q.; Hou, Z.; Cai, J.; Gu, X.; Yuan, X.; Jiao, K. Adaptive optimization strategy of air supply for automotive polymer electrolyte membrane fuel cell in life cycle. Appl. Energy 2022, 325, 119839. [Google Scholar] [CrossRef]
  31. Pukrushpan, J. Modeling and Control of Fuel Cell Systems and Fuel Processors. Ph.D. Thesis, University of Michigan, Ann Arbor, MI, USA, 2003. [Google Scholar]
  32. Sanchez, V.M.; Barbosa, R.; Arriaga, L.; Ramirez, J.M. Real time control of air feed system in a PEM fuel cell by means of an adaptive neural-network. Int. J. Hydrogen Energy 2014, 39, 16750–16762. [Google Scholar] [CrossRef]
  33. Gao, Z. Scaling and bandwidth-parameterization based controller tuning. In Proceedings of the 2003 American Control Conference, Denver, CO, USA, 4–6 June 2003; pp. 4989–4996. [Google Scholar] [CrossRef]
  34. Skogestad, S. Simple analytic rules for model reduction and PID controller tuning. J. Process Control 2003, 13, 291–309. [Google Scholar] [CrossRef] [Green Version]
Figure 1. Schematic diagram of PEMFC system (different colors of numbers and lines represent different subsystems, blue: air; red: hydrogen; purple: load; green: thermal management).
Electronics 12 01393 g001
Figure 2. Optimal reference for OER at different load currents.
Electronics 12 01393 g002
Figure 3. Fitted curves of the optimal OER.
Electronics 12 01393 g003
Figure 4. The basic control structure of ADRC.
Electronics 12 01393 g004
Figure 5. ADRC OER control structure of PEMFC.
Electronics 12 01393 g005
Figure 6. The step-load current profile.
Electronics 12 01393 g006
Figure 7. OER tracking curves under different control methods ((af) is the enlarged view of the 2nd, 4th, 6th, 8th, 10th and 12th seconds respectively).
Electronics 12 01393 g007
Figure 8. OER tracking errors under different control methods ((af) is the enlarged view of the 2nd, 4th, 6th, 8th, 10th and 12th seconds respectively).
Electronics 12 01393 g008
Figure 9. Compressor trajectory performance under different control methods: (a) the instantaneous tracks of compressor motion; (b) the instantaneous η c p .
Electronics 12 01393 g009
Figure 10. PEMFC voltage curves under different control methods (Operating temperature = 353.15 K; λ H 2 = 1; λ O 2 = λ O 2 , r e f ( I s t ) ).
Electronics 12 01393 g010
Figure 11. Efficiency of PEMFC under different control methods (Operating temperature = 353.15 K; λ H 2 = 1; λ O 2 = λ O 2 , r e f ( I s t ) ).
Electronics 12 01393 g011
Figure 12. System performance under different control objectives: (a) the λ O 2 control results; (b) the errors of λ O 2 control; (c) the η c p comparison; (d) the output P n e t comparison (Operating temperature = 353.15 K; λ H 2 = 1; λ O 2 = 2, 2.3, and λ O 2 , r e f ( I s t ) ).
Electronics 12 01393 g012
Table 1. Normal parameters of the emulated PEMFC system [22].
ParameterSymbolValue
Universal gas constant, J/(mol⋅K) R 8.314
Air gas constant, J/(kg⋅K) R a 286.9
Oxygen gas constant, J/(kg⋅K) R O 2 259.8
Nitrogen gas constant, J/(kg⋅K) R N 2 296.8
Vapor gas constant, J/(kg⋅K) R v 461.5
Air molar mass, kg/mol M a 29 × 10−3
Oxygen molar mass, kg/mol M O 2 32 × 10−3
Nitrogen molar mass, kg/mol M N 2 28 × 10−3
Vapor molar mass, kg/mol M v 18.02 × 10⁻³
Atmospheric pressure, Pa p a t m 1.01325 × 10⁵
Atmospheric temperature, K T a t m 298.15
Air specific heat ratio γ 1.4
Air specific heat capacity C p 1004
Air density, kg/m3 ρ a 1.23
Gibbs free energy change, J/mol G 237.2 × 10³
Reaction entropy, J/(mol⋅K) S 163.3 × 10³
Faraday constant, C/mol F 96,485
Table 2. PEMFC parameters used in simulation [31].
ParameterSymbolValue
Stack temperature, K T s t 353.15
Fuel cell active area, cm2 A e f c 280
Membrane thickness, cm t m 1.275 × 10⁻²
Maximum current density, A/cm2 i m a x 2.2
Number of fuel cells n c e l l 381
Activation voltage loss constant c 1 10
Ohmic voltage loss constant b 2 350
Ohmic voltage loss constant b 11 0.005139
Ohmic voltage loss constant b 12 0.00326
Concentration voltage loss constant c 3 2
Motor constant, N⋅m/A k t 0.0225
Motor constant, V/(rad⋅s) k v 0.0153
Motor constant, Ω R c m 1.2
Compressor motor inertia, kg⋅m2 J c p 5 × 10⁻⁵
Compressor motor mechanical efficiency, % η c m 98
Cathode volume, m3 V c a 0.01
Supply manifold volume, m3 V s m 0.02
Return manifold volume, m3 V r m 0.005
Cathode inlet orifice constant, kg/(s⋅Pa) k c a , i n 0.3629 × 10⁻⁵
Cathode outlet orifice constant, kg/(s⋅Pa) k c a , o u t 0.2177 × 10⁻⁵
Table 3. Control performance evaluation for different methods.
MethodControl PrecisionControl Cost
RMSEMAEIAETV L t
PID0.13440.06970.1636799.441.6218
Fuzzy-PID0.16610.09160.1403721.631.6181
ADRC0.10840.05790.0818629.631.5790
Disclaimer/Publisher’s Note: The statements, opinions and data contained in all publications are solely those of the individual author(s) and contributor(s) and not of MDPI and/or the editor(s). MDPI and/or the editor(s) disclaim responsibility for any injury to people or property resulting from any ideas, methods, instructions or products referred to in the content.

