Abstract
The high penetration of inverter-fed renewable energy sources (RESs) in modern energy systems has led to a reduction in the system’s inertial response. This reduction in the rotational inertial response is associated with synchronous generation and might result in a deteriorated frequency response following a power disturbance. This paper investigates the frequency stability of the Kingdom of Saudi Arabia’s (KSA) grid. It includes a description of the changing energy landscape of the KSA’s electricity grid and an investigation of the impact of high penetration levels of inverter-fed RESs on the dynamic behavior of the KSA grid. The impact of RESs has been studied through a simulation of case studies of the future KSA power system using the MATLAB/Simulink simulation software. The frequency stability of the KSA’s power system has been evaluated with various RES levels under peak and base load conditions. The simulation results show that the high penetration levels of RESs dramatically affect the system’s frequency response, especially under off-peak conditions. In addition, the significance of battery energy storage systems (BESSs) for compensating the reduction in the system inertial response has been addressed. The results show the effectiveness of aggregated BESSs for enhancing the system frequency control of the KSA grid.
1. Introduction
1.1. Background
Load frequency is an important variable that indicates the stability of a power system. To monitor the balance between demand and supply in the power system, the grid frequency is measured instantaneously. The nominal values of the grid frequency are 50 Hz or 60 Hz, based on the operating policy of each country, while the upper and lower operating limit is set to ±1% Hz of the nominal value [1,2,3,4].
The grid frequency is directly proportional to the real power in the electrical system. Hence, frequency excursion is a direct result of an imbalance between the generation and load in the power system. The system’s frequency rises when there is more generated power than demand. Similarly, it falls when the supply is less than demand, due to generation loss or an increase in the electrical load [1,2,3].
Load frequency should be maintained at the nominal value to ensure the secure and reliable operation of the power system. The control of the grid’s frequency (depending on the frequency deviation range) is achieved through the following control loops: primary frequency control (PFC), secondary frequency control (SFC), and tertiary frequency control (TFC), as shown in Figure 1 [1,2,3,5,6].
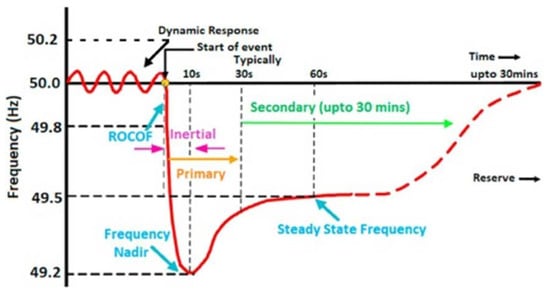
Figure 1.
Frequency control following a power disturbance [5].
The PFC is a fast control response control loop that operates in the first few seconds (5~30 s) after a disturbance in the system frequency to maintain the grid frequency within acceptable limits [2,3,5,6]. The PFC is automatically provided by the inherent inertia in the synchronous generators and motors that are directly connected to the grid to resist unexpected changes in the system frequency. It is also provided automatically by speed governor systems [3,6]. The SFC control loop, which is also known as automatic generation control (AGC), operates after the primary response to a large frequency deviation in a time scale from 30 s up to 10 min [3,6]. It is provided by a combination of AGC and manual actions. The TFC, or emergency control plan, is required if the frequency after a severe frequency incident keeps dropping to critical values. It incorporates automatic or manual changes in the working conditions, such as altering the participating power plants, connecting or disconnecting energy storage systems, changing the power interchange program, and using load control to restore the grid’s frequency to within acceptable limits [3,6].
Synchronous inertia provides the electrical network with robustness against frequency disturbances by maintaining the rate of change of frequency (RoCoF) at a low level [3,5,6,7,8,9]. This leaves sufficient time following a frequency incident for a fast frequency response (FFR) and primary frequency response (PFR). Hence, the replacement of conventional power generation with RESs that are not directly coupled with the network would result in a reduction of the system’s inertia [6,7,8,9]. Consequently, following a frequency incident, the RoCoF will be more rapid, and the system’s frequency will easily deviate beyond the permissible limits under severe frequency incidents. This would result in significant problems for the power system, such as cascading loss of generation, undesirable under-frequency load shedding (UFLS), or even partial or total system blackout [3,5,6,7,8,9].
1.2. Literature Survey
The share of RESs has increased significantly worldwide during the last decade, especially power-electronics-interfaced generation technologies such as wind and solar PV. At the end of 2021, RESs accounted for a third of the global installed generation capacity of 3064 GW, half of which comes from solar and wind generation technologies with overall capacities of 849 GW and 845 GW, respectively [10]. Additionally, many countries around the world are intending to increase their investment in RESs because of their economic and environmental benefits. More than half of the world’s countries have adopted renewable energy policy targets for the next two decades, which indicates an ongoing shift toward RESs as the driver of global energy transformation [11,12].
Power system operators worldwide have expressed serious concerns about the impact of high-penetration non-synchronous RES generation on the stability of the power system. The high penetration of inverter-based RESs (such as solar PV) and wind generation in modern power systems may cause a reduction in the system’s inertia and PFR because they are indirectly coupled with the power network [5,6,7,8,9]. This reduction in the rotational inertia associated with synchronous generation may increase the RoCoF, which may deteriorate the frequency regulation performance [5,6,7,8,9].
Several studies have shed light on the impact of the high-penetration RESs’ integration on the power system’s stability in different countries [13,14,15,16,17,18,19,20]. In [13], the frequency stability of the US Western Interconnection was evaluated under various extra-high PV penetration levels. The simulation results show that up to 45% of PV power plants can be accommodated without stability concerns. However, the Western Interconnection system will no longer be dynamically stable with extra-high PV penetration at 80% and additional ancillary services would be required to improve the system’s stability. Another comprehensive study of the US interconnected power system under extra-high PV penetration scenarios was performed in [14]. The results of this simulation demonstrate that fast-frequency ancillary services are necessary for maintaining the dynamic stability of the US interconnected power system with the extra-high integration of PV generation into the grid.
The influence of high-penetration RESs on the interconnected European transmission network has been discussed in [15]. The results show the necessity for a more flexible interconnected pan-European transmission network to ensure a more reliable and stable European electricity system. In [16], the frequency stability of Great Britain’s (GB) national grid was evaluated under extra-high RESs penetration. The authors evaluate the performance of new ancillary services to support the future of the frequency response in the GB’s national grid under the high penetration of RESs. The results of their simulation show the effectiveness of the new FFR services in avoiding massive frequency excursions of the system frequency following a significant power disturbance. In [17], the impact of large-scale offshore wind power plant (OWPP) integration on the voltage and frequency stability of the Turkish national grid was investigated. The results of this simulation show that the stability of the Turkish power system could be maintained after the integration of an 1800 MW OWPP.
The effect of the high penetration of utility-scale PV power plants on the Egyptian national grid was evaluated in [18]. The frequency response simulation results show that the Egyptian grid remains stable under high penetration levels of RESs of up to 3000 MW. Static and dynamic analyses of the Moroccan southern power network with a large-scale integration of RESs were performed in [19]. The results of this simulation reveal that the stability of the Moroccan southern transmission network will not be affected by the integration of RESs. Meanwhile, the frequency stability of Jordan’s power system under high non-synchronous RES penetrations has been investigated in [20]. The results of this simulation reveal that Jordan’s national grid can accommodate extra-high RESs penetrations of up to 40% in terms of frequency response.
1.3. Aim and Contributions
The KSA is located in a distinctive location and climate, which makes an investment in renewable and sustainable energy resources suitable [21,22]. In particular, the KSA has one of the highest average annual solar insolation rates in the world at approximately 2400 kWh/m2, as shown in Figure 2, which makes it an ideal location for installing solar energy systems [21,22,23]. Wind energy is another promising renewable energy technology. Although the KSA has a poor average wind speed, there are a few sites where wind technology could be effective [21,22]. The projected locations are in the west coast and the northwest parts of the Kingdom, due to their relatively high wind speed [21,22].
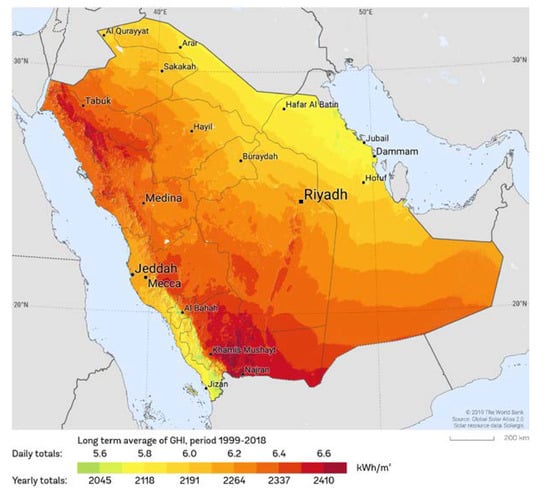
Figure 2.
Global horizontal irradiation over Saudi Arabia’s landscape [23].
The KSA government has laid out an ambitious plan to invest in RESs to develop a secure, sustainable, and renewable energy system. The government of Saudi Arabia has a target of achieving 40% of the energy mix from RESs by 2030 [21]. However, this change in the energy landscape will impact the operability of the KSA’s electricity network. Hence, studying future operability challenges such as inertial response, frequency stability, and voltage stability has become an important step to mitigate the risks of this technology.
This paper focuses on the impact of the reduction in the overall system inertia on the frequency stability of the KSA’s power system under different energy scenarios from 2018 to 2030. The frequency stability of the KSA’s power system will be evaluated with various penetration levels of RESs under peak and base load conditions. This research studies three plausible future energy scenarios (FESs) for the next decade based on the KSA government’s 2030 renewables target, which is considered to be a high progression scenario [21]. Another two scenarios are proposed considering a medium and low progression in the alternative energy projects. An estimation of the electricity generation trend is considered based on the available energy sources, renewables potential, and network capabilities. The KSA FESs will also consider the future growth of the demand for electricity. The growth of the electricity load is estimated by considering load forecasting, population growth, and energy-saving programs.
Given the lack of future dynamic stability studies of the KSA power system, this work can be considered as a basis for future research related to the extensive integration of RESs into the KSA’s power grid. It is hoped that this work will help system planners and operators to develop and implement planning and operation policies regarding the high penetration of non-synchronous RESs.
The rest of this paper is organized as follows. Section 2 presents an overview of the KSA’s power system. The methodology of this paper is described in Section 3. Section 4 discusses the dynamic stability of the future KSA power system under various penetration RESs. Section 5 discusses some practical mitigation measures to compensate for the reduction in the system’s overall inertia. Finally, Section 6 draws a conclusion and makes several recommendations for future work.
2. Overview of the KSA’s Power System
2.1. Description of the KSA’s Power System
The KSA has a considerable power system, with 78,733 km-circular of transmission lines and 615,307 km-circular of distribution networks that extend to cities, towns, and villages across five operation areas supplying electricity to more than 99% of the Kingdom’s population [24]. The electricity demand in the KSA has grown significantly in the past two decades to reach 64 GW in 2018, due to the rapid growth of population and industrial cities [24]. The Saudi Electricity Company (SEC), which is the main operator of the KSA grid, has developed a considerable generation capacity to meet the rapidly growing demand for electricity and is ranked the world’s eleventh largest consumer of generated electricity [25]. Today, the KSA is ranked the world’s sixteenth largest producer of electrical energy, which is primarily derived from liquid petroleum and natural gas sources [25,26]. The distribution of the total installed generation capacity based on the generation technology in 2018 is presented in Figure 3, where 37% of the generation capacity is derived from open-cycle gas turbine (OCGT) power plants, 15% from closed-cycle gas turbine (CCGT) power plants, and 48% from steam plants [24,26].
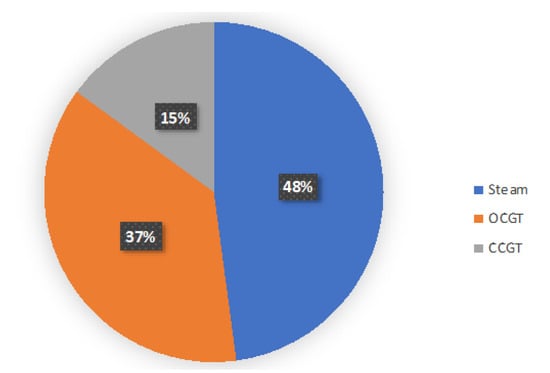
Figure 3.
Distribution of the KSA’s generation capacity by technology type.
The KSA’s power system is interconnected with the Gulf Cooperation Council (GCC) countries through 400 kV high-voltage direct-current (HVDC) double circuit lines, which operate at different frequency levels [2,27,28]. As shown in Figure 4, the GCC interconnection includes 900 km of overhead lines and a 37 km submarine cable to Bahrain, which allow for the interchange of electricity between all GCC grid emergency situations to reduce the spinning reserves of all of the GCC’s grids and improve their reliability. The GCC allows the KSA’s power system to interchange a maximum of 1200 MW during emergency situations [2,27,28]. However, this back-to-back HVSC interconnection to the GCC comes in the third stage of the frequency control loops following a power disturbance and does not contribute to the fast ancillary services in the KSA’s grid because they are not synchronously connected [2,28].
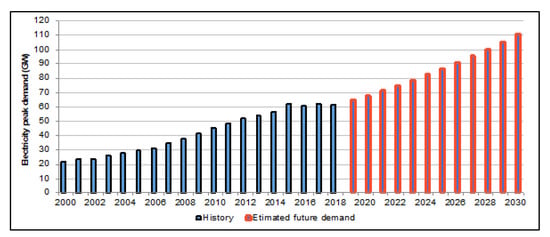
Figure 4.
Historical and estimated future demand in the KSA [24,29].
2.2. Frequency Control in the KSA’s Grid
The nominal value of the grid frequency is 60 Hz in the KSA interconnected power system. During the normal operation, the transmission service provider (TSP) should maintain the system frequency within normal steady-state operational limits of between 59.9 Hz and 60.1 Hz [2,28].
According to the Saudi Arabian Grid Code, the system frequency is controlled by the TSP through primary frequency control (PFC) and secondary frequency control (SFC). The PFC takes place immediately following the frequency event and lasts up to 30 s, which is achieved by automatic corrective measures to frequency deviations. Automatic PFC actions aim to attenuate small frequency fluctuations (59.9~60.1 Hz) [2,28]. Frequency deviations outside the normal fluctuations are corrected using the SFC and operating reserve. The SFC, which is provided by a combination of automatic and manual actions, takes place on a time scale from 30 s up to 10 min following the frequency event [28].
Under system stress, the steady-state emergency limits of the frequency are 59.80 Hz and 60.50 Hz. According to the Saudi Arabian Grid Code for frequency variations of 57.5 to 61.5 Hz for 30 min and 57.0 to 62.5 Hz for 30 s, relays will begin to operate at 59.6 Hz under-frequency load shedding (UFLS). Therefore, emergency limits of 59.80 to 60.5 Hz will always be maintained [29]. Following a UFLS event, the dispatchers take more actions to return the system frequency to its nominal value as soon as possible. This includes the call for spinning reserve requirements and standby generation, and additional load shedding if generation is unavailable.
3. Methodology
3.1. Estimation of Future Demand in the KSA
Estimating the growth in future power consumption and electricity demand is a vital step in developing comprehensive FESs. The future load demand is estimated by considering load forecasting, population growth, and energy-saving programs. Historically, electricity demand in KSA grew from 22 GW in 2000 to 62 GW in 2015, with a growth rate of approximately 7%, as shown in Figure 4 [24,29]. The load demand then remained flat in the next four years (2016–2018) because of fuel subsidy reduction, which led to a fall in consumption.
Even with the implementation of energy-efficiency measures and projections of slower growth for electricity demand in the future, the peak demand is predicted to be just below 120 GW in 2030, as shown in Figure 4. As a result, the government has laid out a plan to increase electricity generation capacity to 120 GW by 2030, which will cost the Kingdom an additional 3 million barrels of oil per day to supply this demand [29]. Therefore, the country has laid out an ambitious plan to diversify its generation sources and provide more than 58.7 GW of local generation from RESs by 2030 [21,29].
3.2. Future Energy Scenarios (FESs)
For a comprehensive analysis of the KSA’s future power system, three plausible FESs are developed based on the government’s renewables targets in the coming decade. In 2018, the KSA government issued a target to achieve 27.3 GW of local generation from RES by 2023 and 58.7 GW by 2030 [21].
The 2030 target is considered to be the high progression scenario (HP). Another two FESs of the KSA’s power system with various penetrations of RESs have been developed considering the medium progression (MP) and low progression (LP) of the 2030 renewables target. These scenarios aim to detect when the overall system inertia will drop to critical levels that could endanger the grid’s stability. An estimation of the electricity generation mix was considered based on the available energy sources, renewables potential, and network capabilities. The energy mixes, and more importantly the synchronous and asynchronous generation capacity resulting from these FESs, are summarized in Table 1 and Table 2 for 2023 and 2030, respectively [21,24,26].

Table 1.
Summary of the KSA’s energy mix for 2023.
Table 2.
Summary of the KSA’s energy mix for 2030.
The HP scenario represents the KSA government’s vision of achieving almost 25% of the generation mix from RESs by 2023 and 41% by 2030, as shown in Table 1 and Table 2, respectively. It is assumed the KSA government will make outstanding progress in achieving the projected target on time.
In the MP scenario, a medium progression in the projects of the 2030 renewables target is assumed. The MP scenario anticipates that 50% of the planned RES projects will be achieved by 2023 and 2030, respectively, due to financial and technical obstacles. It is assumed that non-synchronous generation will contribute to the generation mix by 13 GW and 28 GW in 2023 and 2030, respectively, as shown in Table 1 and Table 2.
The LP scenario assumes slow progression in the achievement of the 2030 renewables plan, due to some financial and technical obstacles to developing and integrating such large renewable energy projects into the existing power system. This scenario assumes that just 30% of the planned target will be achieved by 2023 and 2030, respectively. The RESs are expected to contribute to the energy mix with only 9.3 GW and 14 GW in 2023 and 2030, respectively, as shown in Table 1 and Table 2.
3.3. Simplified KSA Power System Model
The electrical frequency of a power system is the mean frequency of all of the synchronous generators that are directly coupled to the grid, which is directly proportional to their rotor speeds. Hence, the control of power system frequency can be expressed as the frequency control of one synchronous generator. The control of the system frequency is achieved by a turbine governor (speed governor) control. The speed governor adjusts the position of the main steam valve to maintain the speed of the rotor at the synchronous speed and ensure a balance between the mechanical and electrical torques [30,31].
For instance, a change in electrical load is reflected instantaneously as a change in the electrical torque output () of the generator. This change causes an imbalance between the turbine mechanical torque () and generator electrical torque (). The imbalance between and results in an imbalance in the net torque () and a change in the rotor speed (), according to the equation of motion. When is less than , decreases and the governor extends the valve inlet to increase . Similarly, when is greater than , increases and the governor shrinks the valve inlet to decrease .
The relationship between the net torque and the variation in the mechanical speed of the generator rotor can be described using the swing equation of the synchronous generator, as shown in Equation (1):
where in [kg.m2] is the combined moment of inertia of the generator and turbine.
The swing equation can be expressed in terms of inertia constant (H), which is defined as the ratio of the stored kinetic energy on the machine rotor (K.E) to the rating power of the generator (Sbase) in [MVA], as follows:
Substituting for J in Equation (1) gives:
For a thorough study of the system frequency, it is more desirable to express this relationship in terms of mechanical and electrical power instead of torque. The relationship between in [W] and torque in [N.m] is shown in Equation (4), where in [rad/sec] is the speed of the machine rotor [30,31]:
Considering a small deviation from the normal values, the above quantities can be rewritten as follows:
and equation can be rewritten considering their steady state and derivative terms, as shown in Equation (8).
The relationship between the derivative terms only can be written as follows:
Therefore,
In steady state, and the synchronous speed () = 1 p.u.; hence, Equation (10) can be written as follows:
Equations (3) and (11) can now be expressed in terms of inertia constant as shown in Equation (12).
Loads in the power system are classified based on their sensitivity to the frequency deviation into two categories: frequency-independent loads, such as resistive loads (i.e., lighting and heating loads); and frequency-dependent loads, such as inductive loads (i.e., motor loads). Hence, the overall characteristics of the change in electrical power due to deviation in the system frequency can be written as follows:
where is non-frequency-sensitive load change, is a frequency-sensitive load change, and is the load damping coefficient.
The load damping constant is defined as the percent of change in load for a 1% change in the system’s frequency. The value of D is typically between 1% and 2%. To illustrate, a value of D = 2 means that the load will change by 2% for a 1% change in the system frequency. Considering the effect of the load damping constant and taking Laplace transform to Equation (12), the transfer function of the relationship between power and variation in speed can be expressed as in Equation (14) and represented in a block diagram as shown in Figure 5 [30,31]:
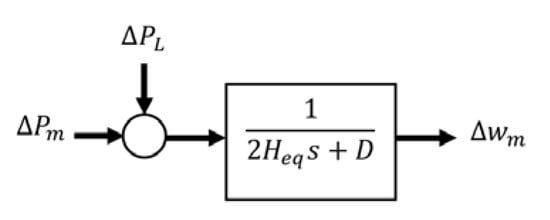
Figure 5.
Block diagram of the generator–load dynamic relationship, adapted from [31].
Analysis of frequency deviation required the use of complex numerical methods because of the nonlinear and time-varying nature of the power system. However, simple first-order transfer functions are used to analyze the power system frequency and control design. The load frequency control (LFC) model, which is widely used in academic power network dynamic studies, was modified to resemble the KSA’s power system [30,31]. Figure 6 gives a schematic diagram of the LFC model.
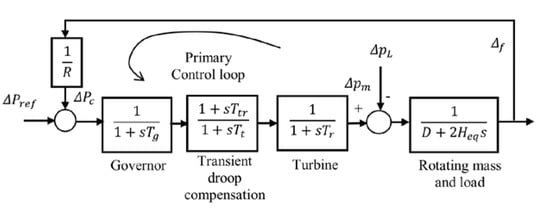
Figure 6.
Simplified load frequency control model, adapted from [31].
The adopted model is simulated using real data that were collected from various KSA electricity domains, including the SEC and Electricity & Cogeneration Regulatory Authority (ECRA) [24,26,32]. Personal interviews with experts in the SEC have been conducted to ensure the ability of the adopted model to resemble the KSA’s power system. This research analyzes the initial period following power disturbance to evaluate the impact of a reduction in the system’s inertia on the frequency stability. Thus, this model does not include a representation of the secondary frequency control loop (AGC) or other control loops.
Given that all of the generating units in the KSA’s power system are thermal units, all of the generators are substituted with a single generation unit considering their total aggregated installed capacity. The KSA’s synchronous generation is represented by governing turbine transfer functions. The model includes a representation of a speed governor, turbine, rotating mass, and load for the provision of system frequency analysis.
Table 3 shows the values of the parameters used in the simplified LFC model of the KSA’s grid. Generator–turbine time constants (Tg, Ttr, Tt, and Tr) are set according to their typical values. According to the KSA grid code, all generation units must have a governor droop setting of 4% [2]. Therefore, the droop setting is represented in the test model by the block gain 1/R and is set to 20 p.u. The value of the load damping coefficient (D) is set to 1, which means that a 1% change in system frequency would cause a 1% change in load.
Table 3.
Parameter values for the simplified KSA model.
The inertia constant of each generation unit is set according to the generator type to determine the rotational inertia contribution of each generation technology. Table 4 gives the typical values of the inertia constant for different generation technologies at 3600 rpm [33,34]. As can be seen, OCGT and CCGT power plants would deliver most of the inertial response, while non-synchronous generators such as wind and solar PV would not offer any rotational inertial response because they are indirectly connected to the grid using power converters. The overall system inertia (Heq) is estimated to be 4.15 s through aggregating the inertia constants of all generating units connected directly to the grid.
Table 4.
Typical values of H for different generation technologies at 3600 rpm [33,34].
The accuracy of the adopted model was verified against the KSA’s power system through various real power disturbances. The parameters of the model have been adjusted to ensure that it resembles the dynamic behavior of the real KSA power system. Figure 7 shows an example of the dynamic behavior of the adopted model when compared to the real KSA system.
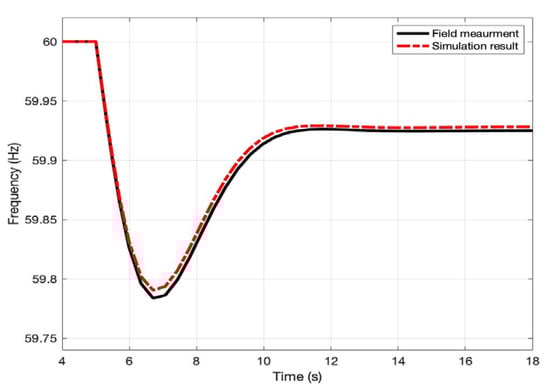
Figure 7.
Frequency response following a power loss of 1206 MW.
The model was validated with a real frequency incident that occurred in the KSA grid when the system frequency dropped to almost 59.78 Hz following a sudden power outage in the eastern operation area, which resulted in a power loss of 1206 MW. The frequency response of the adopted model matched well with the response of the real system for the same power disturbance, which indicates the validity of the adopted model for resembling the KSA power system.
4. Dynamic Stability of the Future KSA Power System
The impact of the high-penetration RESs on the dynamic stability of the KSA’s power system in 2023 and 2030 was evaluated under peak and base load conditions. The dynamic behavior of the KSA system under various penetration RESs has been simulated and analyzed using the MATLAB Simulink simulation software package. A generation loss of 1849.6 MW, which corresponds to the generation trip of the eight power plants in the central region (PP-8), is considered as a power disturbance incident in all case studies (∆PL). The power disturbance incident is assumed to happen after 5 s in all simulations.
4.1. Results for the Year 2023
The transient behavior of the KSA power system in 2023 with various penetration levels of non-synchronous RESs was investigated under peak and base load conditions. The required generation capacity to meet the estimated load demand under peak and base load conditions was designated based on the proposed FESs. The penetration level of RESs is represented in the model through a corresponding reduction in the overall inertia of the KSA’s power system.
4.1.1. Case 1: Peak Load Conditions
The dispatch of the installed generation units for the FESs in 2023 under peak load conditions is shown in Table 5. The estimated values of the overall inertia constant (Heq), based on the renewables target progression, as shown in Table 5, are modeled for each scenario to show the impact of a reduction of the system’s inertia on the inertial response of the system. The frequency responses for each FES in 2023 under peak load conditions following a generation loss of 1849.6 MW are presented in Figure 8.
Table 5.
Online generation under peak load conditions in 2023.
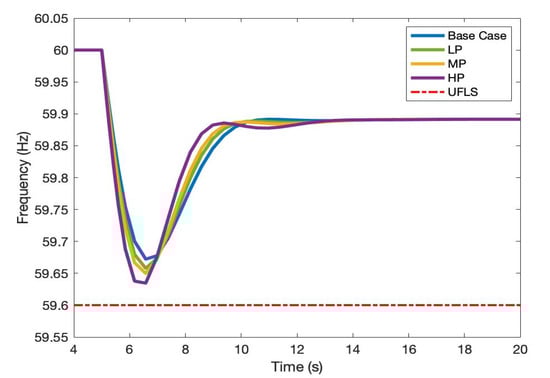
Figure 8.
Frequency response under peak load conditions in 2023.
4.1.2. Case 2: Base Load Conditions
The energy dispatch for all of the generation technologies for the FESs in 2023 under base load conditions is shown in Table 6. The estimated values of the overall inertia constant (Heq), based on the renewables target progression, as shown in Table 6, are modeled for each scenario to show the impact of a reduction of the system’s inertia on the inertial response of the system. The frequency responses following a generation loss of 1849.6 MW for each FES under base peak load conditions in 2023 are shown in Figure 9.
Table 6.
Online generation under base load conditions in 2023.
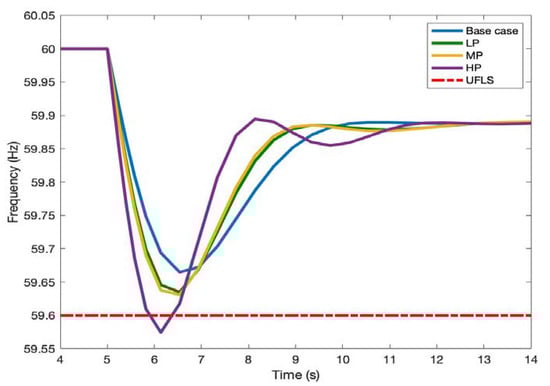
Figure 9.
Frequency response under base load conditions in 2023.
4.2. Results for the Year 2030
The transient behavior of the KSA’s power system in 2030 with various penetration levels from non-synchronous RESs was also investigated under base and peak load conditions. The necessary generation capacity to meet the estimated load demand under peak and base load conditions was selected based on the proposed FESs. The penetration level of the RESs is represented in the model through a corresponding reduction in the overall inertia of the KSA’s power system.
4.2.1. Case 1: Peak Load Conditions
The dispatch of all of the available generation technologies for the FESs in 2030 under base load conditions is shown in Table 7. The estimated values of the overall inertia constant (Heq), based on the renewables target progression, are shown in Table 7. Online generation capacity under peak load conditions in 2030 are simulated for each scenario to show the impact of a reduction in the system’s inertia on the inertial response of the system. The frequency step responses following a generation loss of 1849.6 MW for each FES under peak load conditions in 2030 are shown in Figure 10.
Table 7.
Online generation capacity under peak load conditions in 2030.
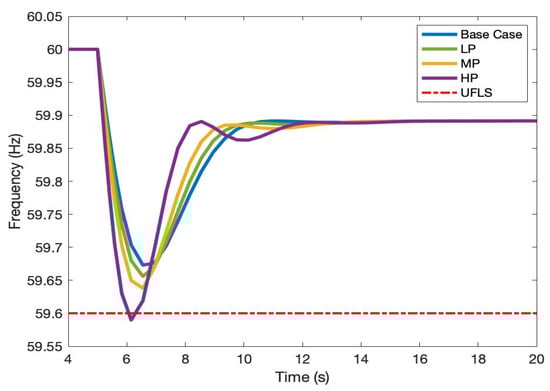
Figure 10.
Frequency response under peak load conditions in 2030.
4.2.2. Case 2: Base Load Conditions
The dispatch of all of the available generation technologies for the FESs in 2030 under base load conditions is shown in Table 8. The estimated values of the overall inertia constant (Heq), based on the renewables target progression as shown in Table 8, are simulated for each scenario to show the impact of a reduction in the system’s inertia on the inertial response of the system. The frequency responses for each FES in 2030 under base load conditions following a generation loss of 1849.6 MW are presented in Figure 11.
Table 8.
Online generation capacity under base load conditions in 2030.
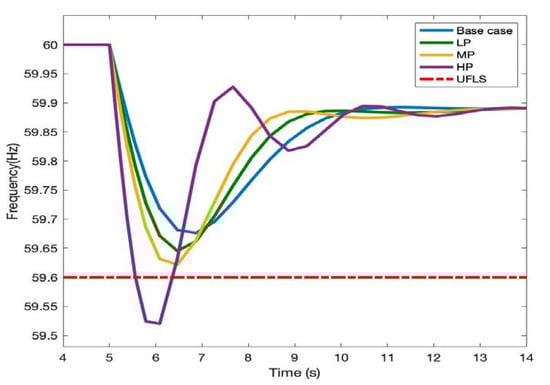
Figure 11.
Frequency response under base load conditions in 2030.
4.3. Analysis of the Results
The simulation results that were obtained in Section 4 revealed that the KSA power system would experience a significant change in the future frequency response because of the reduction in the overall inertia of the system. However, the reduction in the frequency response varies based on the penetration level of the non-synchronous RESs connected to the network. The increase in the frequency deviation is directly proportional to the percentage of the non-synchronous RESs connected to the grid.
The frequency response in 2023 is relatively stable under peak load conditions, even with the high penetration levels of RESs. The simulation results show that the system frequency under peak load conditions following a generation loss of 1849.6 MW drops to the levels that are shown in Figure 8. The worst frequency response occurs in the HP scenario, when 25% of the energy mix is derived from inverter-coupled RESs. The system frequency falls to approximately 59.63 Hz, where the available inertial response will be able to arrest the frequency deviation from triggering the UFLS threshold (as shown in Figure 8). In contrast, the frequency deviation under base load conditions in 2023 is much more vulnerable than in peak load conditions because of the reduction in the Heq. This is attributed to the lower level of synchronous generation units that are connected to the grid under light load conditions when compared to the peak load conditions. The worst frequency response occurs with the HP scenario, where the system frequency falls below 59.6 Hz and triggers the UFLS threshold to restore the frequency to the safe levels as shown in Figure 9.
The reduction in the frequency response in 2030 is higher than in 2023, due to the increase of synchronous RESs that are integrated into the system. Under peak load conditions, the frequency deviation would be much more vulnerable when the level of the non-synchronous RES generation is as high as 41% of the generation mix. The Heq is expected to decrease to about 1.95 s. The frequency response following a power disturbance of 1849.6 MW at 5 s drops rapidly to about 59.58 Hz, which exceeds the UFLS thresholds (as shown in Figure 10. This would result in spontaneous ULFS and would leave many customers without electricity for a period of time.
The KSA’s power system in 2030 under base load conditions would experience the worst transient behavior when the level of the inverter-fed RESs generation is as high as 41% of the generation mix. The frequency following a generation loss of 1849.6 MW at 5 s drops rapidly to almost 59.52 Hz, which exceeds the UFLS thresholds (as shown in Figure 11). This will result in a spontaneous ULFS and would leave many customers without electricity for a period of time. Further practical solutions are required to mitigate the negative effect of the high levels of penetration of the inverter-interfaced RESs on the system’s frequency and ensure a reliable and secure operation of the future KSA power system.
5. Compensating for the Reduction in the System Inertia
Several new control strategies have been developed to mitigate the effect of a high penetration of RESs on the stability of the system’s frequency [35,36,37]. The proposed approaches can be categorized based on the technology used into two approaches. The first approach, as depicted in Figure 12a, is to compensate for the reduction in the synchronous inertial response by adding some traditional synchronous generators (synchronous compensators) to provide the minimum inertia requirement for the system.
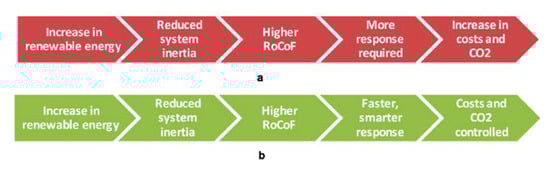
Figure 12.
Control strategies for supporting frequency response: (a) Traditional techniques (b) Smart techniques.
However, applying this solution would require large and costly power plants, which would reduce the system’s efficiency and increase the emissions to higher levels [35,36]. The second approach to ensure the system’s frequency stability under conditions of low system inertia uses smart techniques (as shown in Figure 12b), which include demand-side response (DSR) services, energy storage systems (ESSs), aggregated diesel generators, and synthetic (virtual) inertia services [35,36,37].
The reduction in the inertial response of the KSA’s grid may be compensated by using BESSs. The importance of BESSs for compensating the reduction in the system inertia may be illustrated through simulations that consider the HP scenario of the KSA grid under peak load conditions in 2030 and aggregated BESSs. The aggregated BESSs are simulated and integrated with the adopted model, as shown in Figure 13. It is assumed that the aggregated BESSs have enough capacity to store the minimum required energy from the surplus energy generated by the generating units during off-peak times and then release it immediately once needed to compensate for the reduction in the system’s inertia.
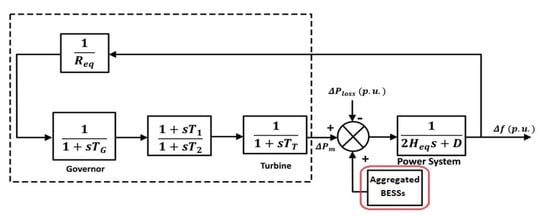
Figure 13.
Schematic diagram of the test model with aggregated BESSs.
The aggregated BESSs is modeled using the first-order transfer function. The transfer function of the aggregated BESSs can be expressed as follows:
where is the gain of the aggregated BESSs and is the time constant of the aggregated BESSs [38].
It is assumed that BESSs can immediately deliver a maximum power output of 1200 MW for a few minutes following a sudden disturbance. The simulation results show the ability of aggregated BESSs to arrest the frequency decay and avoid UFLS. The BESSs raise the system frequency to a safer value by reducing the drop in the system frequency by 0.01 Hz (as shown in Figure 14), which improves the frequency regulation by 25%. This indicates the ability of aggregated BESSs to maximize the use of power-electronics-interfaced RESs in modern power systems.
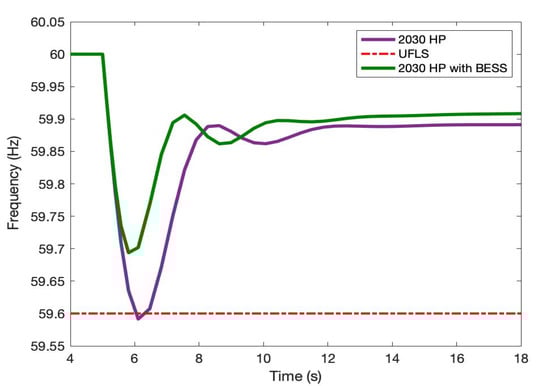
Figure 14.
Frequency response following power disturbance in 2030 with BESS.
6. Conclusions
This paper evaluated the impact of the high penetration levels of inverter-fed RES generation technologies on the future frequency stability of the KSA grid. This paper included a description of the changing energy landscape of the KSA’s electricity grid and investigated the impact of the high penetration levels of inverter-fed RESs on the dynamic behavior of the KSA grid. The impact of RESs has been studied through a simulation of case studies of the future KSA power system using the MATLAB/Simulink simulation software.
A simplified LFC model of the KSA grid was simulated and validated in the MATLAB/Simulink software. The dynamic behavior of the KSA future power system with various penetration levels of RES levels was evaluated under peak and base load conditions.
The simulation results show that the high penetrations of inverter-coupled RESs have a severe impact on the system’s frequency response. The RoCoF is steeper and the system frequency drops rapidly to unacceptable levels, which causes undesirable UFLS and cascading generation failure. The worst frequency response would occur with high penetration levels of RESs under base load conditions, due to the substantial reduction in the overall system inertia.
Several smart control strategies to mitigate the reduction in the overall inertia of the power system were demonstrated. Meanwhile, the reduction in the system’s inertial response was compensated by integrating aggregated BESSs into the KSA network. The simulation results show that aggregated BESSs can substantially enhance the frequency regulation. This demonstrates the importance of using BESSs to maximize the utilization of RESs.
This paper does not cover the regional impact of RESs on the KSA’s power system. Therefore, our future work will model a more detailed power network and investigate the impact of RESs on each operation area of the interconnected KSA power system. In addition, the performance of the SFC and other additional reserve requirements to restore the frequency to the nominal value are beyond the scope of this work and will be discussed in future studies.
Author Contributions
Conceptualization, S.A. and L.C.; methodology, S.A.; software, S.A.; validation, S.A.; formal analysis, S.A.; investigation, S.A. and L.C.; writing—original draft preparation, S.A.; writing—review and editing, S.A., A.S., A.G. and L.C.; visualization, S.A., A.S. and A.G.; supervision, L.C. All authors have read and agreed to the published version of the manuscript.
Funding
This paper is part of the Ph.D. research of the corresponding author, Saad Alqahtani, who is sponsored by King Khalid University, Saudi Arabia. The Open Access (OA) charges of this work have been funded by the Cardiff University Institutional OA Fund: 2023-OA-0167.
Data Availability Statement
The authors declare that all the relevant data and results are presented in this paper, and no further data is available to be provided for the potential researchers.
Acknowledgments
The corresponding author would like to thank King Khalid University, Saudi Arabia, for sponsoring his postgraduate study at Cardiff University, UK. The authors are grateful for the support from the Decarbonising Transport through Electrification (DTE) Network+ funded by the Engineering and Physical Sciences Research Council (EPSRC), grant reference EP/S032053/1. The authors would like to thank the SEC and ECRA for supporting this research through providing real data and technical information for the KSA power system.
Conflicts of Interest
The authors declare no conflict of interest.
References
- Bevrani, H. Hill, Robust Power System Frequency Control, 2nd ed.; Bevrani, D., Hassan, C.J.H., Stankovic, A.M., Eds.; Springer International Publishing: Berlin/Heidelberg, Germany, 2014. [Google Scholar]
- Saudi Arabian National Grid. The Saudi Arabian Grid Code; Saudi Arabian National Grid Company: Riyadh, Saudi Arabia, 2022. [Google Scholar]
- Shrestha, A.; Gonzalez-Longatt, F. Frequency Stability Issues and Research Opportunities in Converter Dominated Power System. Energies 2021, 14, 4184. [Google Scholar] [CrossRef]
- Alqahtani, S.; Shaher, A.; Garada, A.; Cipcigan, L. Frequency Stability in Renewable-Rich Modern Power Systems, Saudi Grid Case Study. In Proceedings of the 2022 57th International Universities Power Engineering Conference (UPEC), Istanbul, Turkey, 30 August–2 September 2022; pp. 1–6. [Google Scholar] [CrossRef]
- Teng, F.; Aunedi, M.; Pudjianto, D.; Strbac, G. Benefits of demand-side response in providing frequency response service in the future GB power system. Front. Energy Res. 2015, 3, 36. [Google Scholar] [CrossRef]
- Ippolito, M.; Musca, R.; Zizzo, G. Analysis and Simulations of the Primary Frequency Control during a System Split in Continental Europe Power System. Energies 2021, 14, 1456. [Google Scholar] [CrossRef]
- Hou, Q.; Du, E.; Zhang, N.; Kang, C. Impact of High Renewable Penetration on the Power System Operation Mode: A Data-Driven Approach. IEEE Trans. Power Syst. 2019, 35, 731–741. [Google Scholar] [CrossRef]
- Milano, F.; Dörfler, F.; Hug, G.; Hill, D.J.; Verbič, G. Foundations and Challenges of Low-Inertia Systems (Invited Paper). In Proceedings of the 20th Power Systems Computation Conference (PSCC), Dublin, The Irish, 11–15 June 2018; pp. 1–25. [Google Scholar] [CrossRef]
- Ortiz-Villalba, D.; Rahmann, C.; Alvarez, R.; Canizares, C.A.; Strunck, C. Practical Framework for Frequency Stability Studies in Power Systems with Renewable Energy Sources. IEEE Access 2020, 8, 202286–202297. [Google Scholar] [CrossRef]
- International Renewable Energy Agency (IRENA). Renewable Capacity Statistics 2022; IRENA: Abu Dhabi, United Arab Emirates, 2022. [Google Scholar]
- International Energy Agency (IEA). Renewables 2021–Analysis and Forecast to 2026; IEA: Paris, France, 2021. [Google Scholar]
- Gielen, D.; Boshell, F.; Saygin, D.; Bazilian, M.D.; Wagner, N.; Gorini, R. The role of renewable energy in the global energy transformation. Energy Strategy Rev. 2019, 24, 38–50. [Google Scholar] [CrossRef]
- Tan, J.; Zhang, Y.; You, S.; Liu, Y.; Liu, Y.; Frequency Response Study of U.S. Western Interconnection under Extra-High Photovoltaic Generation Penetrations. In Proceedings of the IEEE Power and Energy Society General Meeting, Portland, OR, USA, 5–10 August 2018; pp. 1–5. [Google Scholar] [CrossRef]
- Liu, Y.; You, S.; Tan, J.; Zhang, Y.; Liu, Y. Frequency Response Assessment and Enhancement of the U.S. Power Grids Toward Extra-High Photovoltaic Generation Penetrations—An Industry Perspective. IEEE Trans. Power Syst. 2018, 33, 3438–3449. [Google Scholar] [CrossRef]
- Fotis, G.; Vita, V.; Maris, T.I. Risks in the European Transmission System and a Novel Restoration Strategy for a Power System after a Major Blackout. Appl. Sci. 2022, 13, 83. [Google Scholar] [CrossRef]
- Homan, S.; Brown, S. The future of frequency response in Great Britain. Energy Rep. 2021, 7, 56–62. [Google Scholar] [CrossRef]
- Yalman, Y.; Celik, O.; Tan, A.; Bayindir, K.C.; Cetinkaya, U.; Yesil, M.; Akdeniz, M.; Tinajero, G.D.A.; Chaudhary, S.K.; Guerrero, J.M.; et al. Impacts of Large-scale Offshore Wind Power Plants Integration on Turkish Power System. IEEE Access 2022, 10, 83265–83280. [Google Scholar] [CrossRef]
- Sultan, H.M.; Diab, A.A.Z.; Kuznetsov, O.N.; Ali, Z.M.; Abdalla, O. Evaluation of the Impact of High Penetration Levels of PV Power Plants on the Capacity, Frequency and Voltage Stability of Egypt’s Unified Grid. Energies 2019, 12, 552. [Google Scholar] [CrossRef]
- Ameur, A.; Loudiyi, K.; Aggour, M. Steady State and Dynamic Analysis of Renewable Energy Integration into the Grid using PSS/E Software. Energy Procedia 2017, 141, 119–125. [Google Scholar] [CrossRef]
- Feilat, E.; Azzam, S.; Al-Salaymeh, A. Impact of large PV and wind power plants on voltage and frequency stability of Jordan’s national grid. Sustain. Cities Soc. 2018, 36, 257–271. [Google Scholar] [CrossRef]
- National Renewable Energy Program. Saudi Arabia Renewable Energy Targets and Long Term Visibility. 2018. Available online: https://www.powersaudiarabia.com.sa/web/attach/media/Saudi-Arabia-Renewable-Energy-Targets-and-Long-Term-Visibility.pdf (accessed on 9 June 2022).
- Barhoumi, E.M.; Okonkwo, P.C.; Zghaibeh, M.; Ben Belgacem, I.; Alkanhal, T.A.; Abo-Khalil, A.G.; Tlili, I. Renewable energy resources and workforce case study Saudi Arabia: Review and recommendations. J. Therm. Anal. Calorim. 2020, 141, 221–230. [Google Scholar] [CrossRef]
- Solargis. Solar resource maps of Saudi Arabia. 2020. Available online: https://solargis.com/maps-and-gis-data/download/saudi-arabia (accessed on 9 February 2023).
- Saudi Electricity Company. Saudi Electricity Company Annual Report. 2018. Available online: https://www.sctimst.ac.in/AboutSCTIMST/AnnualReport/ (accessed on 5 June 2022).
- U. S. Energy Information Administration. Country Analysis Brief: Saudi Arabia. 2021; pp. 1–19. Available online: http://www.eia.gov/beta/international/analysis_includes/countries_long/Saudi_Arabia/saudi_arabia.pdf (accessed on 5 June 2022).
- Electricity and Cogeneration Regulatory Authority. Electricity Generation Stations Capacities. 2017. Available online: www.ecra.gov.sa (accessed on 6 June 2022).
- Al-mohaisen, A.I. Electricity Network Connectivity between the GCC Countries; GCC Interconnection Authority: Dammam, Saudi Arabia, 2011; pp. 1–31. [Google Scholar]
- Saudi Electricity Company. System Operation & Control Procedures; Saudi Electricity Company: Riyadh, Saudi Arabia, 2022. [Google Scholar]
- Alturki, Y.A.; Edris, A.-A. Saudi Arabia’s Growing Demand for Electricity: Some Strategic Recommendations. J. Energy Power Eng. 2015, 9, 296–302. [Google Scholar] [CrossRef]
- Overbye, T.J.; Glover, J.D.; Sarma, M.S. Power System Analysis and Design, 5th ed.; Cengage Learning: Stamford, CT, USA, 2012. [Google Scholar]
- Kundur, P. Power System Stability and Control; McGraw-Hill: New York, NY, USA, 1994. [Google Scholar]
- Electricity & Cogeneration Regulatory Authority (ECRA). 2017. Available online: https://www.ecra.gov.sa (accessed on 6 June 2022).
- Chown, G.A.; Wright, J.G.; van Heerden, R.; Coker, M. System inertia and Rate of Change of Frequency (RoCoF) with increasing non-synchronous renewable energy penetration. CIGRE Sci. Eng. 2018, 11, 32–43. [Google Scholar]
- Johnson, S.C.; Papageorgiou, D.J.; Mallapragada, D.S.; Deetjen, T.A.; Rhodes, J.D.; Webber, M.E. Evaluating rotational inertia as a component of grid reliability with high penetrations of variable renewable energy. Energy 2019, 180, 258–271. [Google Scholar] [CrossRef]
- Grid, N. Enhanced Frequency Control Capability (EFCC). 2015. Available online: https://www.nationalgrideso.com/document/96486/download (accessed on 9 June 2022).
- Cheng, Y.; Azizipanah-Abarghooee, R.; Azizi, S.; Ding, L.; Terzija, V. Smart frequency control in low inertia energy systems based on frequency response techniques: A review. Appl. Energy 2020, 279, 115798. [Google Scholar] [CrossRef]
- Abuagreb, M.; Ajao, B.; Herbert, H.; Johnson, B.K. Evaluation of Virtual Synchronous Generator Compared to Synchronous Generator. In Proceedings of the 2020 IEEE Power and Energy Society Innovative Smart Grid Technologies Conference, ISGT 2020, Washington, DC, USA, 17–20 February 2020; pp. 1–5. [Google Scholar] [CrossRef]
- Adrees, A.; Andami, H.; Milanovic, J.V. Comparison of dynamic models of battery energy storage for frequency regulation in power system. In Proceedings of the 18th Mediterranean Electrotechnical Conference: Intelligent and Efficient Technologies and Services for the Citizen, MELECON 2016, Lemesos, Cyprus, 18–20 April 2016; pp. 1–6. [Google Scholar] [CrossRef]


Disclaimer/Publisher’s Note: The statements, opinions and data contained in all publications are solely those of the individual author(s) and contributor(s) and not of MDPI and/or the editor(s). MDPI and/or the editor(s) disclaim responsibility for any injury to people or property resulting from any ideas, methods, instructions or products referred to in the content. |
© 2023 by the authors. Licensee MDPI, Basel, Switzerland. This article is an open access article distributed under the terms and conditions of the Creative Commons Attribution (CC BY) license (https://creativecommons.org/licenses/by/4.0/).