
Mobile Application Software Requirements Specification from Consumption Values


Abstract
:
1. Introduction
2. Background of the Study
2.1. Mobile Application Purchase Intention
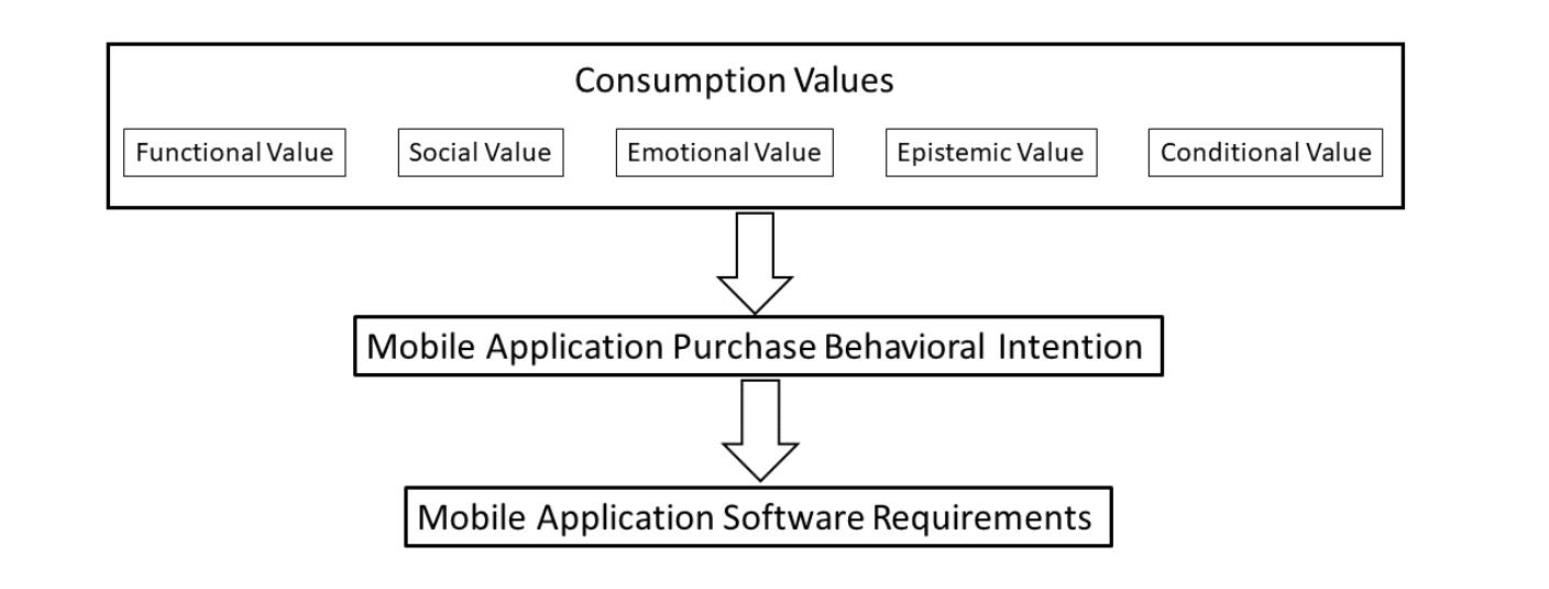
2.2. Consumption Values
2.2.1. Functional Value
2.2.2. Social Value
2.2.3. Emotional Value
2.2.4. Epistemic Value
2.2.5. Conditional Value
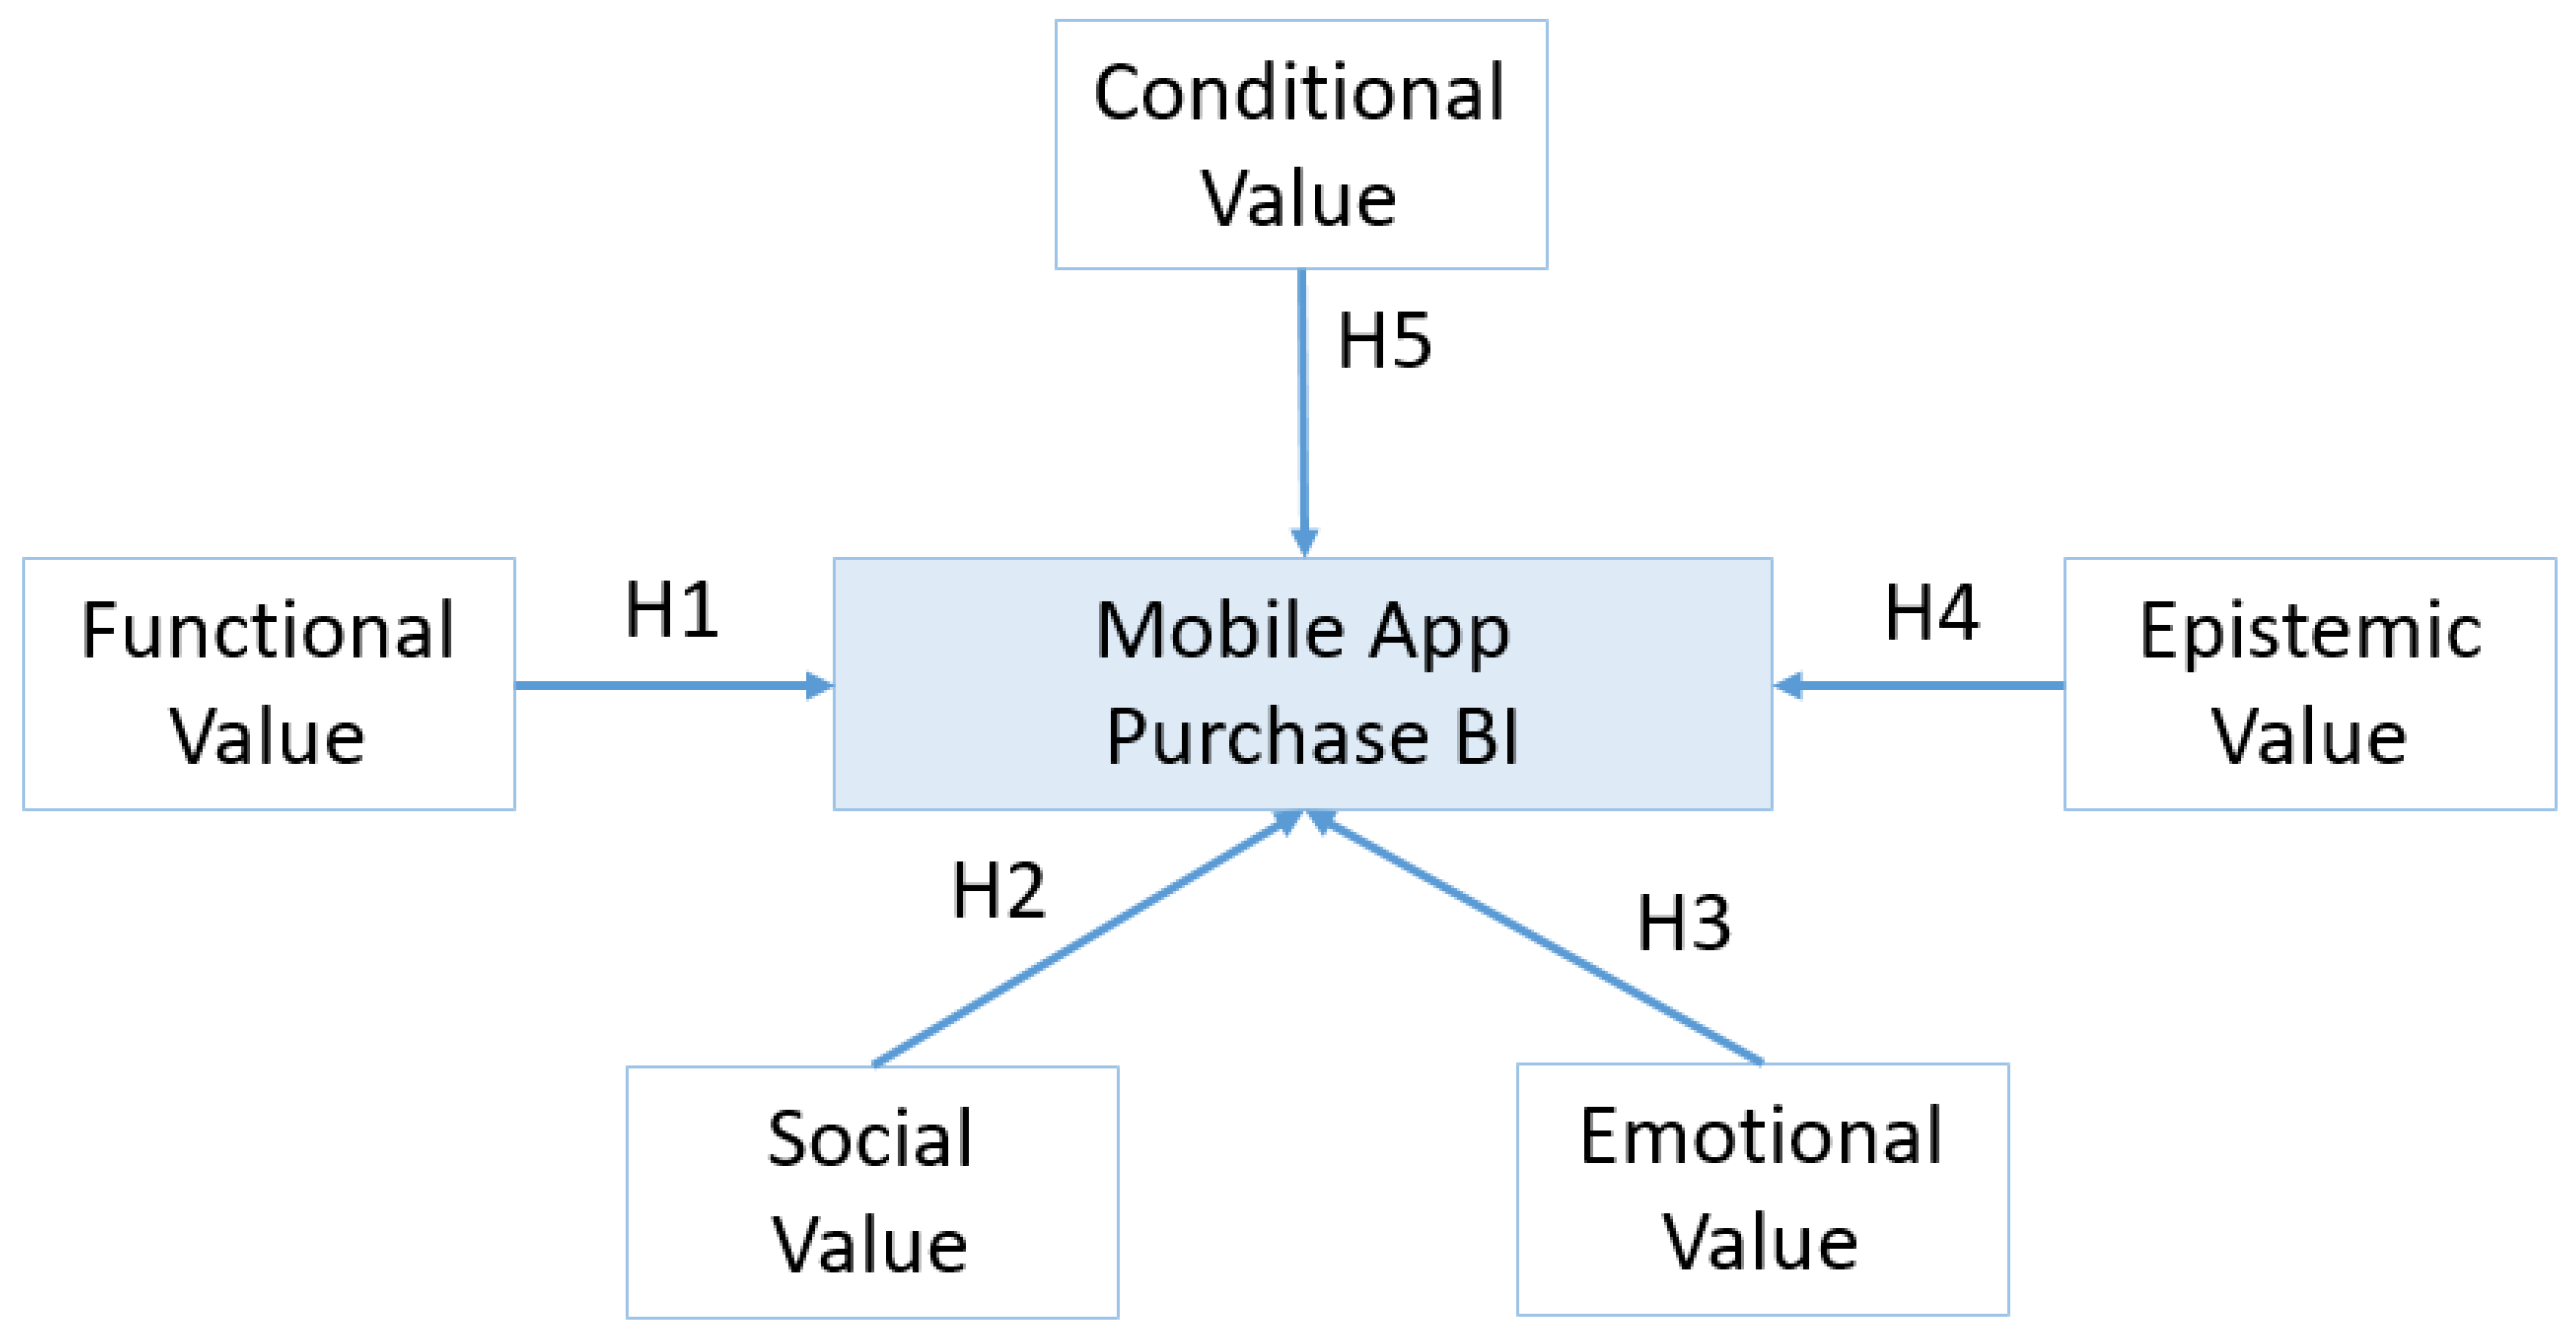
3. Research Framework
Research Questions and Hypothesis of the Study
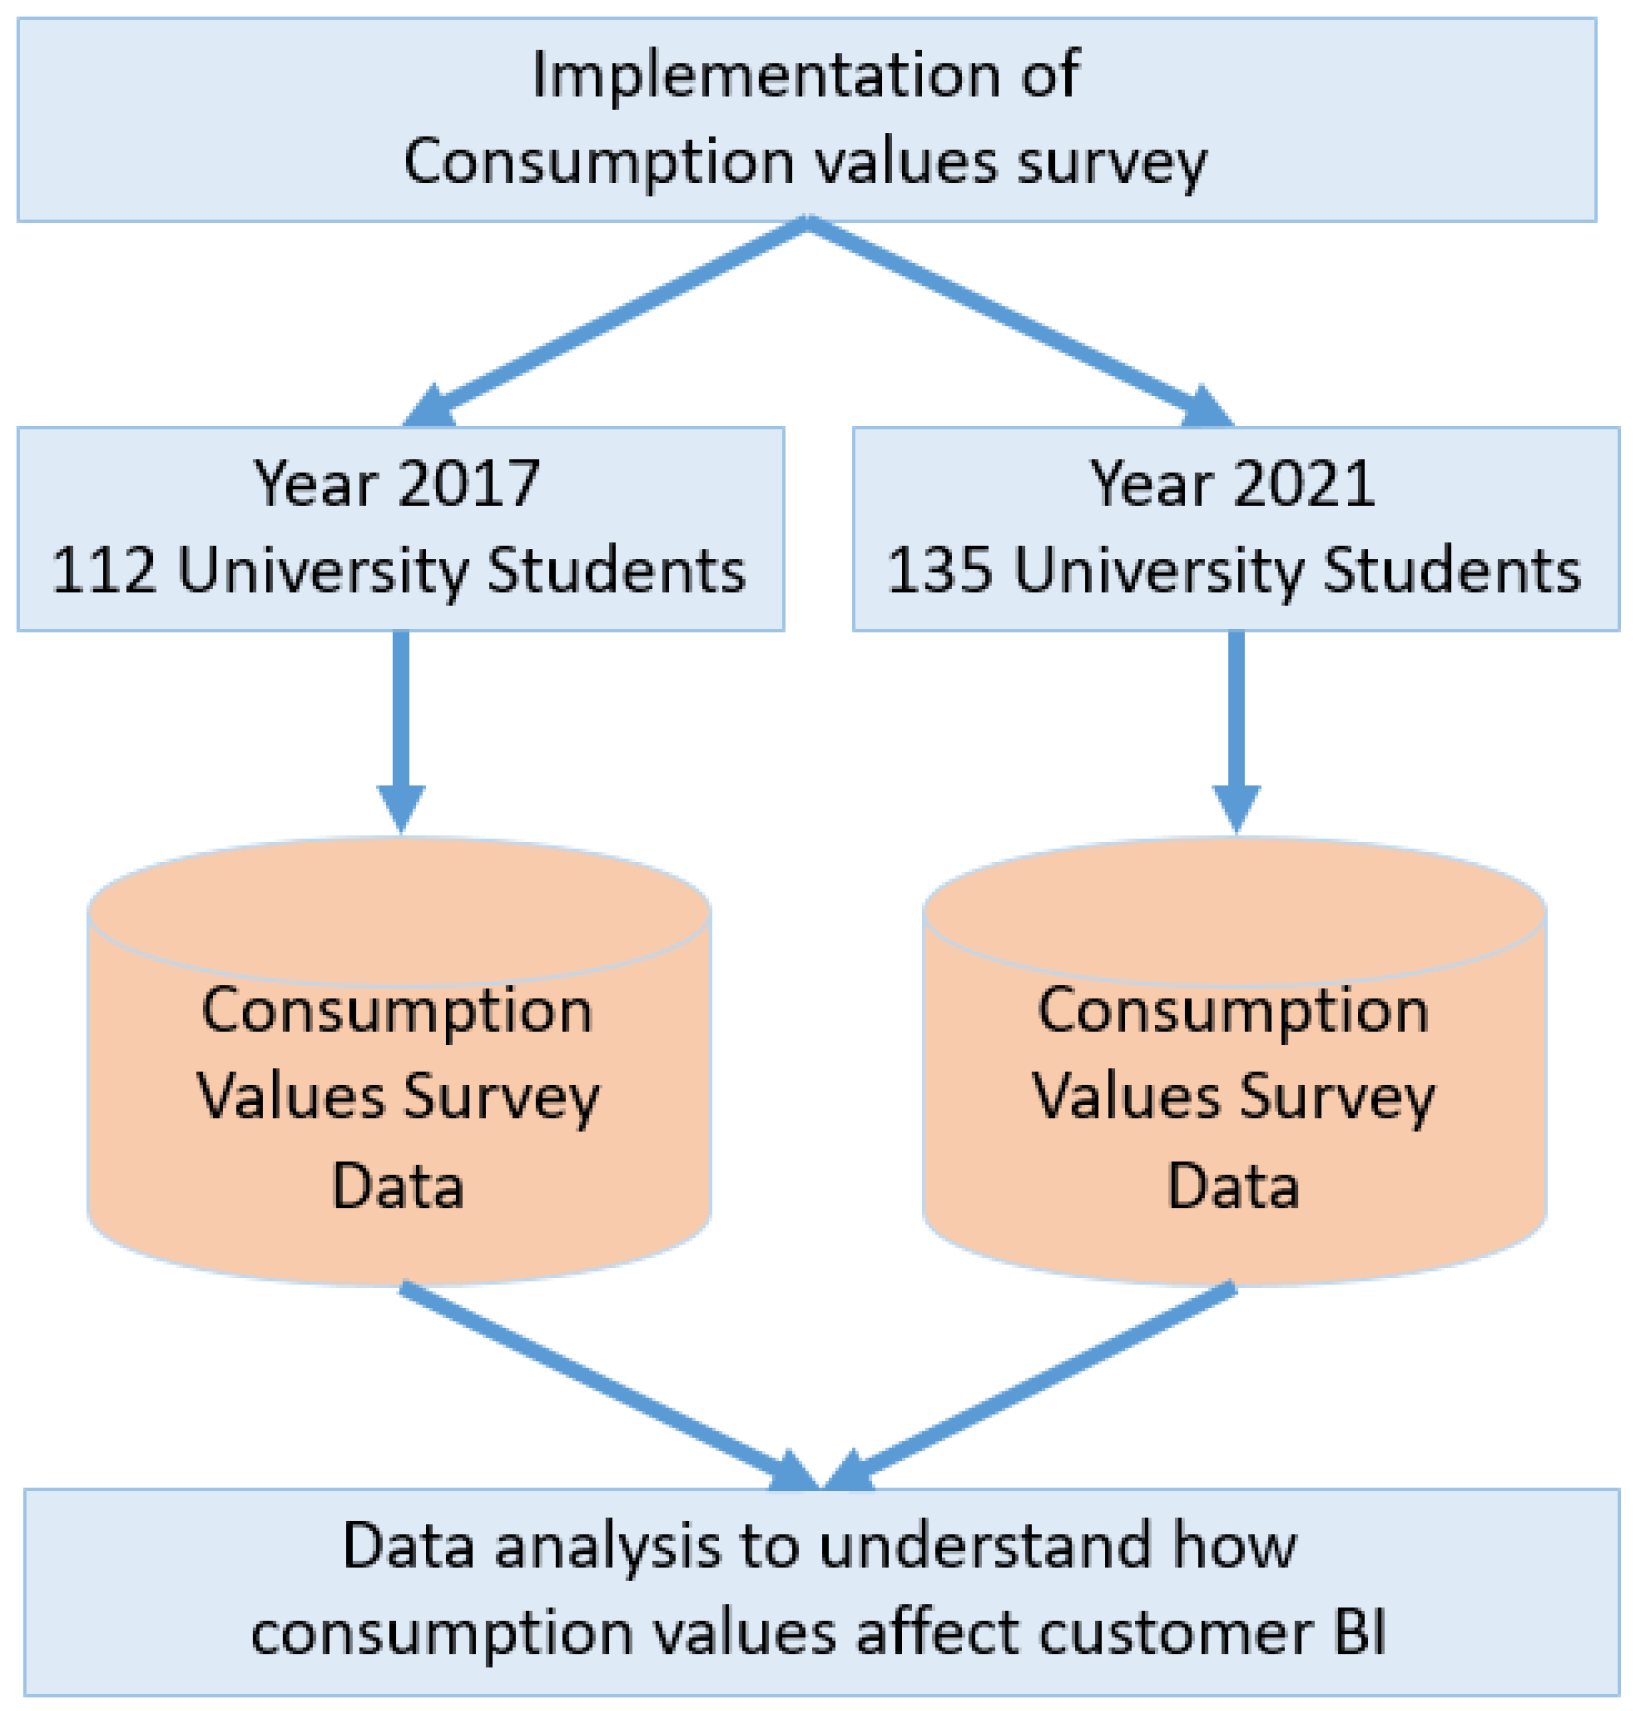
4. Method
5. Results
5.1. Measurement Model Evaluation
5.2. Distribution Analysis
5.3. Scale Comparisons
6. Discussion
7. Conclusions
Author Contributions
Funding
Institutional Review Board Statement
Informed Consent Statement
Data Availability Statement
Acknowledgments
Conflicts of Interest
References
- Wang, Z.; Pan, J.S.; Chen, Q.; Yang, S. BiLSTM-CRF-KG: A Construction Method of Software Requirements Specification Graph. Appl. Sci. 2022, 12, 6016. [Google Scholar] [CrossRef]
- Griva, A.; Byrne, S.; Dennehy, D.; Conboy, K. Software Requirements Quality: Using Analytics to Challenge Assumptions at Intel. IEEE Softw. 2022, 39, 80–88. [Google Scholar] [CrossRef]
- Cheon, J.; Lee, S.; Crooks, S.M.; Song, J. An Investigation of Mobile Learning Readiness in Higher Education Based on the Theory of Planned Behavior. Comput. Educ. 2012, 59, 1054–1064. [Google Scholar] [CrossRef]
- Almaiah, M.A.; Jalil, M.A. Investigating Students’ Perceptions on Mobile Learning Services. Int. J. Interact. Mob. Technol. 2014, 8, 31–36. [Google Scholar] [CrossRef] [Green Version]
- Zolkepli, I.A. Domination of Mobile Apps Market: The Effect of Apps Value on Apps Rating and Apps Costs in Determining Adoption. In Proceedings of the Penang International Symposium on Advanced in Social Sciences and Humanities, Royale Bintang, Penang, Malaysia, 30–31 January 2016. [Google Scholar]
- Martinez, D.; Ferre, X.; Guerrero, G.; Juristo, N. An Agile-Based Integrated Framework for Mobile Application Development Considering Ilities. IEEE Access 2020, 8, 72461–72470. [Google Scholar] [CrossRef]
- Sheth, J.N.; Newman, B.I.; Gross, B.L. Why We Buy What We Buy: A Theory of Consumption Values. J. Bus. Res. 1991, 22, 159–170. [Google Scholar] [CrossRef]
- Mtebe, J.S.; Raisamo, R. Investigating Students’ Behavioural Intention to Adopt and Use Mobile Learning in Higher Education in East Africa. Int. J. Educ. Dev. Using Inf. Commun. Technol. 2014, 10, 4–20. [Google Scholar]
- Briz-Ponce, L.; Pereira, A.; Carvalho, L.; Juanes-Méndez, J.A.; García-Peñalvo, F.J. Learning with Mobile Technologies—Students’ Behavior. Comput. Hum. Behav. 2017, 72, 612–620. [Google Scholar] [CrossRef]
- Biswas, A.; Roy, M. Green Products: An Exploratory Study on the Consumer Behaviour in Emerging Economies of the East. J. Clean. Prod. 2015, 87, 463–468. [Google Scholar] [CrossRef]
- Zailani, S.; Iranmanesh, M.; Hyun, S.S.; Ali, M.H. Applying the Theory of Consumption Values to Explain Drivers’willingness to Pay for Biofuels. Sustainability 2019, 11, 668. [Google Scholar] [CrossRef] [Green Version]
- Belanche, D.; Flavián, M.; Pérez-Rueda, A. Mobile Apps Use and WOM in the Food Delivery Sector: The Role of Planned Behavior, Perceived Security and Customer Lifestyle Compatibility. Sustainability 2020, 12, 4275. [Google Scholar] [CrossRef]
- Osei-Frimpong, K.; McLean, G.; Famiyeh, S. Social Media Brand Engagement Practices: Examining the Role of Consumer Brand Knowledge, Social Pressure, Social Relatedness, and Brand Trust. Inf. Technol. People 2020, 33, 1235–1254. [Google Scholar] [CrossRef]
- Zsóka, Á.; Szerényi, Z.M.; Széchy, A.; Kocsis, T. Greening Due to Environmental Education? Environmental Knowledge, Attitudes, Consumer Behavior and Everyday pro-Environmental Activities of Hungarian High School and University Students. J. Clean. Prod. 2013, 48, 126–138. [Google Scholar] [CrossRef]
- Rahnama, H.; Rajabpour, S. Identifying Effective Factors on Consumers’ Choice Behavior toward Green Products: The Case of Tehran, the Capital of Iran. Environ. Sci. Pollut. Res. 2017, 24, 911–925. [Google Scholar] [CrossRef]
- Lin, P.C.; Huang, Y.H. The Influence Factors on Choice Behavior Regarding Green Products Based on the Theory of Consumption Values. J. Clean. Prod. 2012, 22, 11–18. [Google Scholar] [CrossRef]
- Chakraborty, D.; Siddiqui, A.; Siddiqui, M.; Rana, N.P.; Dash, G. Mobile Payment Apps Filling Value Gaps: Integrating Consumption Values with Initial Trust and Customer Involvement. J. Retail. Consum. Serv. 2022, 66, 102946. [Google Scholar] [CrossRef]
- Chakraborty, D.; Kayal, G.; Mehta, P.; Nunkoo, R.; Rana, N.P. Consumers’ Usage of Food Delivery App: A Theory of Consumption Values. J. Hosp. Mark. Manag. 2022, 31, 601–619. [Google Scholar] [CrossRef]
- Wang, H.-Y.; Liao, C.; Yang, L.-H. What Affects Mobile Application Use? The Roles of Consumption Values. Int. J. Mark. Stud. 2013, 5, 11. [Google Scholar] [CrossRef]
- Groeneveld, R.A.; Meeden, G. Measuring Skewness and Kurtosis. J. R. Stat. Soc. Ser. D 1984, 33, 391. [Google Scholar] [CrossRef]
- Moors, J.J.A. The Meaning of Kurtosis: Darlington Reexamined. Am. Stat. 1986, 40, 283–284. [Google Scholar] [CrossRef]
- Hopkins, K.D.; Weeks, D.L. Tests for Normality and Measures of Skewness and Kurtosis: Their Place in Research Reporting. Educ. Psychol. Meas. 1990, 50, 717–729. [Google Scholar] [CrossRef]
- Bono, R.; Arnau, J.; Alarcón, R.; Blanca, M.J. Bias, Precision, and Accuracy of Skewness and Kurtosis Estimators for Frequently Used Continuous Distributions. Symmetry 2019, 12, 19. [Google Scholar] [CrossRef] [Green Version]
- Demir, S. Comparison of Normality Tests in Terms of Sample Sizes under Different Skewness and Kurtosis Coefficients. Int. J. Assess. Tools Educ. 2022, 9, 397–409. [Google Scholar] [CrossRef]
- Dziuban, C.D.; Shirkey, E.C. When Is a Correlation Matrix Appropriate for Factor Analysis? Some Decision Rules. Psychol. Bull. 1974, 81, 358–361. [Google Scholar] [CrossRef]
- Howard, M.C. A Review of Exploratory Factor Analysis Decisions and Overview of Current Practices: What We Are Doing and How Can We Improve? Int. J. Hum.-Comput. Interact. 2016, 32, 51–62. [Google Scholar] [CrossRef]
- Gefen, D.; Straub, D.; Boudreau, M.-C. Structural Equation Modeling and Regression: Guidelines for Research Practice. Commun. Assoc. Inf. Syst. 2000, 4, 7. [Google Scholar] [CrossRef] [Green Version]
- Bagozzi, R.P.; Yi, Y.; Phillips, L.W. Assessing Construct Validity in Organizational Research. Adm. Sci. Q. 1991, 36, 421. [Google Scholar] [CrossRef]
- Carlson, K.D.; Herdman, A.O. Understanding the Impact of Convergent Validity on Research Results. Organ. Res. Methods 2012, 15, 17–32. [Google Scholar] [CrossRef]
- Nunnally, J.C. Psychometric Theory; McGraw-Hill: New York, NY, USA, 1967. [Google Scholar]
- Field, A.P. Is the Meta-Analysis of Correlation Coefficients Accurate When Population Correlations Vary? Psychol. Methods 2005, 10, 444–467. [Google Scholar] [CrossRef] [Green Version]
- Vörösmarty, G.; Dobos, I. Green Purchasing Frameworks Considering Firm Size: A Multicollinearity Analysis Using Variance Inflation Factor. Supply Chain Forum Int. J. 2020, 21, 290–301. [Google Scholar] [CrossRef]
- Hair, J.F.; Ringle, C.M.; Sarstedt, M. Partial Least Squares Structural Equation Modeling: Rigorous Applications, Better Results and Higher Acceptance. Long Range Plan. 2013, 46, 1–12. [Google Scholar] [CrossRef]
- Gezgin, D.M. Exploring The Influence of The Patterns of Mobile Internet Use on University Students’nomophobia Levels. Eur. J. Educ. Stud. 2017, 3, 29–53. [Google Scholar]
- Vitiello, G.; Sebillo, M.; Fornaro, L.; Di Gregorio, M.; Cirillo, S.; De Rosa, M.; Fuccella, V.; Costagliola, G. Do You like My Outfit? Cromnia, a Mobile Assistant for Blind Users. In Proceedings of the Goodtechs ’18: Proceedings of the 4th EAI International Conference on Smart Objects and Technologies for Social Good, Bologna, Italy, 28–30 November 2018. [Google Scholar]


| Ref. | Summary |
|---|---|
| [17] | Suggests focusing on functional, conditional, epistemic, and emotional values when it comes to mobile app payments. |
| [18] | Shows a significant relationship between functional, social, contextual, and epistemic values and usage intention for food delivery mobile apps. |
| [19] | Reports that contextual value influences mobile app users’ behavioral intentions via the mediation of functional, social, emotional, and epistemic values. Their equational model, on the other hand, is based on the effect of conditional value on other consumption values. |
| Variables | Year | Min | Max | AVG | SD |
|---|---|---|---|---|---|
| Age | 2017 | 21 | 35 | 27.38 | 2.15 |
| 2021 | 17 | 31 | 21.49 | 2.42 | |
| Total | 17 | 35 | 24.16 | 3.73 | |
| # Apps Installed | 2017 | 4 | 135 | 40.35 | 26.82 |
| 2021 | 0 | 155 | 39.29 | 32.65 | |
| Total | 0 | 155 | 39.77 | 30.09 | |
| App Usage Duration | 2017 | 1 | 13 | 6.86 | 2.21 |
| 2021 | 0 | 16 | 8.80 | 2.86 | |
| Total | 0 | 16 | 7.92 | 2.76 |
| Subscale | KMO and Bartlett Test | ||
|---|---|---|---|
| Functional Value | KMO | 0.606 | |
| Bartlett Test | X2 | 577.472 | |
| p | 0.000 | ||
| Social Value | KMO | 0.829 | |
| Bartlett Test | X2 | 581.965 | |
| p | 0.000 | ||
| Emotional Value | KMO | 0.820 | |
| Bartlett Test | X2 | 504.485 | |
| p | 0.000 | ||
| Epistemic Value | KMO | 0.726 | |
| Bartlett Test | X2 | 378.742 | |
| p | 0.000 | ||
| Conditional Value | KMO | 0.658 | |
| Bartlett Test | X2 | 207.746 | |
| p | 0.000 | ||
| Behavioral Intention | KMO | 0.646 | |
| Bartlett Test | X2 | 238.530 | |
| p | 0.000 | ||
| Subscale | Item | Factor Load | VRE | CA |
|---|---|---|---|---|
| Functional Value | Mobile apps have acceptable standard of quality. | 0.741 | 49.849 | 0.745 |
| The price of mobile app is economical. | 0.732 | |||
| Mobile apps offer consistent quality. | 0.697 | |||
| The mobile app is good for current price level. | 0.695 | |||
| Mobile apps fulfill my needs as well. | 0.662 | |||
| Social Value | Using mobile app gives me social approval. | 0.888 | 75.776 | 0.893 |
| Using mobile app makes a good impression on other people. | 0.870 | |||
| Using mobile app helps me to feel acceptable by others. | 0.869 | |||
| Using mobile app improves the way I am perceived. | 0.855 | |||
| Emotional Value | Using mobile app makes me feel good. | 0.842 | 61.576 | 0.835 |
| Using mobile app gives me pleasure. | 0.823 | |||
| Using mobile app makes me feel relax. | 0.817 | |||
| Using mobile app is an enjoyment. | 0.787 | |||
| Using mobile app is interesting. | 0.637 | |||
| Epistemic Value | Mobile apps enable me to test the new technologies. | 0.908 | 79.264 | 0.867 |
| Mobile apps make experiment with new ways of doing things. | 0.903 | |||
| Mobile apps arouse my curiosity. | 0.859 | |||
| Conditional Value | When in an unfamiliar environment of get lost, using mobile app can help me to identify my current location and further direction. | 0.872 | 67.956 | 0.752 |
| When I am in uncertain circumstances and need more information to facilitate decision, mobile apps can provide related real-time information (e.g., bus arrival time, weather, stocks) to help me make the decision. | 0.849 | |||
| No matter what time or place is, using mobile apps can assist me complete those thing that I want to do. | 0.746 | |||
| Behavioral Intention | I expect my use of mobile apps to continue in the future. | 0.884 | 53.321 | 0.633 |
| I intend to use mobile apps in the near time. | 0.828 | |||
| I would use mobile apps without hesitation to satisfy my needs. | 0.715 | |||
| I predict that I would use mobile apps in the short term. | 0.393 |
| Variables | # Indicators | CA | CR | AVE | VIF |
|---|---|---|---|---|---|
| Functional Value | 5 | 0.745 | 0.832 | 0.498 | 1.241 |
| Social Value | 4 | 0.893 | 0.926 | 0.758 | 1.508 |
| Emotional Value | 5 | 0.835 | 0.888 | 0.616 | 1.765 |
| Epistemic Value | 3 | 0.867 | 0.920 | 0.793 | 1.364 |
| Conditional Value | 3 | 0.752 | 0.864 | 0.680 | 1.401 |
| Behavioral Intention | 4 | 0.633 | 0.810 | 0.533 | 1.405 |
| Variables | FV | SV | EMV | EPV | CV | BI |
|---|---|---|---|---|---|---|
| Functional Value (FV) | 0.706 | |||||
| Social Value (SV) | 0.282 | 0.870 | ||||
| Emotional Value (EMV) | 0.330 | 0.560 | 0.785 | |||
| Epistemic Value (EPV) | 0.289 | 0.159 | 0.409 | 0.890 | ||
| Conditional Value (CV) | 0.290 | 0.101 | 0.231 | 0.316 | 0.824 | |
| Behavioral Intention (BI) | 0.247 | 0.059 | 0.216 | 0.348 | 0.489 | 0.730 |
| Independent Variable | Effect | Model | ||||
|---|---|---|---|---|---|---|
| β | t | p | R2 | F | p | |
| Functional Value | 0.076 | 1.255 | 0.211 | 0.288 | 19.535 | 0.000 * |
| Social Value | −0.065 | −0.974 | 0.331 | |||
| Emotional Value | 0.059 | 0.815 | 0.416 | |||
| Epistemic Value | 0.185 | 2.973 | 0.003 * | |||
| Conditional Value | 0.402 | 6.822 | 0.000 * | |||
| Year | Independent Variable | Effect | Model | ||||
|---|---|---|---|---|---|---|---|
| β | t | p | R2 | F | p | ||
| 2017 | Functional Value | 0.156 | 1.785 | 0.077 | 0.299 | 9.035 | 0.000 * |
| Social Value | −0.119 | −1.194 | 0.235 | ||||
| Emotional Value | 0.156 | 1.297 | 0.197 | ||||
| Epistemic Value | 0.237 | 2.398 | 0.018 * | ||||
| Conditional Value | 0.310 | 3.636 | 0.000 * | ||||
| 2021 | Functional Value | 0.067 | 0.827 | 0.410 | 0.298 | 12.379 | 0.000 * |
| Social Value | −0.034 | −0.391 | 0.696 | ||||
| Emotional Value | 0.024 | 0.264 | 0.792 | ||||
| Epistemic Value | 0.158 | 1.900 | 0.060 | ||||
| Conditional Value | 0.456 | 5.585 | 0.000 * | ||||
| 2017 | 2021 | Total | X2 | p | |||||
|---|---|---|---|---|---|---|---|---|---|
| n | % | n | % | n | % | ||||
| Gender | Female | 46 | 41.1 | 45 | 33.3 | 91 | 36.8 | 1.575 | 0.209 |
| Male | 66 | 58.9 | 90 | 66.7 | 156 | 63.2 | |||
| Total | 112 | 100.0 | 135 | 100.0 | 247 | 100.0 | |||
| Purchase of App | Yes | 64 | 57.1 | 79 | 58.5 | 143 | 57.9 | 0.048 | 0.827 |
| No | 48 | 42.9 | 56 | 41.5 | 104 | 42.1 | |||
| Total | 112 | 100.0 | 135 | 100.0 | 247 | 100.0 | |||
| App Usage Duration | <5 years | 21 | 18.8 | 9 | 6.7 | 30 | 12.1 | 54.338 | 0.000 * |
| 6–7 years | 51 | 45.5 | 16 | 11.9 | 67 | 27.1 | |||
| 8–9 years | 25 | 22.3 | 63 | 46.7 | 88 | 35.6 | |||
| >9 years | 15 | 13.4 | 47 | 34.8 | 62 | 25.1 | |||
| Total | 112 | 100.0 | 135 | 100.0 | 247 | 100.0 | |||
| # App Installed | <20 | 25 | 22.3 | 39 | 28.9 | 64 | 25.9 | 12.814 | 0.012 * |
| 20–29 | 20 | 17.9 | 19 | 14.1 | 39 | 15.8 | |||
| 30–39 | 18 | 16.1 | 39 | 28.9 | 57 | 23.1 | |||
| 40–59 | 24 | 21.4 | 12 | 8.9 | 36 | 14.6 | |||
| >59 | 25 | 22.3 | 26 | 19.3 | 51 | 20.6 | |||
| Total | 112 | 100.0 | 135 | 100.0 | 247 | 100.0 | |||
| Scale | Statements | 2017 | 2021 | TOTAL | t | p | |||
|---|---|---|---|---|---|---|---|---|---|
| AVG | SD | AVG | SD | AVG | SD | ||||
| Functional Value | The mobile app is good for current price level. | 3.40 | 0.88 | 2.78 | 1.18 | 3.06 | 1.10 | 4.716 | 0.000 |
| Mobile apps fulfill my needs as well. | 3.35 | 0.82 | 2.64 | 1.17 | 2.96 | 1.09 | 5.540 | 0.000 | |
| Social Value | Using mobile app gives me social approval. | 2.70 | 1.27 | 2.15 | 1.19 | 2.40 | 1.26 | 3.487 | 0.001 |
| Using mobile app makes a good impression on other people. | 2.85 | 1.15 | 2.50 | 1.18 | 2.66 | 1.18 | 2.365 | 0.019 | |
| Using mobile app helps me to feel acceptable by others. | 2.70 | 1.29 | 2.24 | 1.27 | 2.45 | 1.30 | 2.765 | 0.006 | |
| Emotional Value | Using mobile app makes me feel good. | 3.36 | 1.15 | 2.75 | 1.35 | 3.02 | 1.30 | 3.826 | 0.001 |
| Using mobile app gives me pleasure. | 3.64 | 0.98 | 3.27 | 1.19 | 3.44 | 1.11 | 2.735 | 0.007 | |
| Using mobile app is interesting. | 3.71 | 0.97 | 3.22 | 1.21 | 3.44 | 1.13 | 3.471 | 0.001 | |
| Epistemic Value | Mobile apps make experiment with new ways of doing things. | 4.47 | 0.72 | 4.05 | 0.96 | 4.24 | 0.89 | 3.819 | 0.000 |
| Mobile apps enable me to test the new technologies. | 4.31 | 0.68 | 4.07 | 0.91 | 4.18 | 0.82 | 2.285 | 0.023 | |
| Behavioral Intention | I would use mobile apps without hesitation to satisfy my needs. | 4.46 | 0.72 | 4.66 | 0.69 | 4.57 | 0.71 | −2.251 | 0.025 |
| Variables | Years | 2017 | 2021 | ||||||||
|---|---|---|---|---|---|---|---|---|---|---|---|
| n | Avg | Sd | F | p | n | Avg | Sd | F | p | ||
| Functional Value | <5 | 21 | 3.60 | 0.62 | 0.668 | 0.573 | 9 | 3.18 | 0.58 | 2.884 | 0.038 * |
| 6–7 | 51 | 3.67 | 0.42 | 16 | 3.05 | 0.65 | |||||
| 8–9 | 25 | 3.74 | 0.38 | 63 | 3.59 | 0.72 | |||||
| >9 | 15 | 3.80 | 0.45 | 47 | 3.38 | 0.79 | |||||
| Social Value | <5 | 21 | 2.50 | 1.14 | 2.141 | 0.099 | 9 | 2.67 | 0.78 | 2.200 | 0.091 |
| 6–7 | 51 | 2.60 | 1.08 | 16 | 1.83 | 0.82 | |||||
| 8–9 | 25 | 2.96 | 1.03 | 63 | 2.30 | 1.01 | |||||
| >9 | 15 | 3.25 | 1.01 | 47 | 2.53 | 1.15 | |||||
| Emotional Value | <5 | 21 | 3.44 | 0.87 | 0.903 | 0.442 | 9 | 3.27 | 0.48 | 0.918 | 0.434 |
| 6–7 | 51 | 3.52 | 0.81 | 16 | 2.95 | 0.84 | |||||
| 8–9 | 25 | 3.72 | 0.74 | 63 | 3.12 | 1.01 | |||||
| >9 | 15 | 3.76 | 0.43 | 47 | 3.35 | 0.99 | |||||
| Epistemic Value | <5 | 21 | 4.24 | 0.57 | 0.956 | 0.416 | 9 | 3.89 | 0.62 | 0.916 | 0.435 |
| 6–7 | 51 | 4.24 | 0.68 | 16 | 3.85 | 1.00 | |||||
| 8–9 | 25 | 4.24 | 0.60 | 63 | 4.15 | 0.84 | |||||
| >9 | 15 | 4.53 | 0.50 | 47 | 3.94 | 0.88 | |||||
| Conditional Value | <5 | 21 | 4.44 | 0.64 | 0.708 | 0.549 | 9 | 4.00 | 0.62 | 2.463 | 0.065 |
| 6–7 | 51 | 4.32 | 0.57 | 16 | 4.48 | 0.44 | |||||
| 8–9 | 25 | 4.33 | 0.53 | 63 | 4.46 | 0.59 | |||||
| >9 | 15 | 4.53 | 0.47 | 47 | 4.19 | 0.82 | |||||
| Behavioral Intention | <5 | 21 | 4.10 | 0.44 | 1.669 | 0.178 | 9 | 4.03 | 0.51 | 1.104 | 0.350 |
| 6–7 | 51 | 4.02 | 0.59 | 16 | 4.20 | 0.61 | |||||
| 8–9 | 25 | 4.17 | 0.62 | 63 | 4.30 | 0.63 | |||||
| >9 | 15 | 4.38 | 0.58 | 47 | 4.09 | 0.79 | |||||
| Variables | Years | n | Avg | Sd | F | p |
|---|---|---|---|---|---|---|
| Functional Value | <5 | 30 | 3.48 | 0.63 | 0.903 | 0.440 |
| 6–7 | 67 | 3.52 | 0.55 | |||
| 8–9 | 88 | 3.63 | 0.64 | |||
| >9 | 62 | 3.48 | 0.74 | |||
| Social Value | <5 | 30 | 2.55 | 1.03 | 0.852 | 0.467 |
| 6–7 | 67 | 2.41 | 1.07 | |||
| 8–9 | 88 | 2.49 | 1.05 | |||
| >9 | 62 | 2.71 | 1.15 | |||
| Emotional Value | <5 | 30 | 3.39 | 0.77 | 0.404 | 0.750 |
| 6–7 | 67 | 3.38 | 0.85 | |||
| 8–9 | 88 | 3.29 | 0.98 | |||
| >9 | 62 | 3.45 | 0.90 | |||
| Epistemic Value | <5 | 30 | 4.13 | 0.60 | 0.196 | 0.899 |
| 6–7 | 67 | 4.15 | 0.78 | |||
| 8–9 | 88 | 4.18 | 0.77 | |||
| >9 | 62 | 4.08 | 0.84 | |||
| Conditional Value | <5 | 30 | 4.31 | 0.65 | 0.748 | 0.525 |
| 6–7 | 67 | 4.36 | 0.55 | |||
| 8–9 | 88 | 4.42 | 0.57 | |||
| >9 | 62 | 4.27 | 0.76 | |||
| Behavioral Intention | <5 | 30 | 4.08 | 0.45 | 1.491 | 0.217 |
| 6–7 | 67 | 4.06 | 0.60 | |||
| 8–9 | 88 | 4.26 | 0.62 | |||
| >9 | 62 | 4.16 | 0.75 |
| Variables | Number of Mobile Apps | 2017 | 2021 | ||||||||
|---|---|---|---|---|---|---|---|---|---|---|---|
| n | Avg | Sd | F | p | n | Avg | Sd | F | p | ||
| Functional Value | <20 | 25 | 3.56 | 0.45 | 1.307 | 0.272 | 39 | 3.27 | 0.78 | 1.816 | 0.129 |
| 20–29 | 20 | 3.76 | 0.26 | 19 | 3.18 | 0.75 | |||||
| 30–39 | 18 | 3.86 | 0.54 | 39 | 3.61 | 0.78 | |||||
| 40–59 | 24 | 3.66 | 0.49 | 12 | 3.40 | 0.60 | |||||
| >59 | 25 | 3.69 | 0.49 | 26 | 3.57 | 0.64 | |||||
| Social Value | <20 | 25 | 2.48 | 1.08 | 2.934 | 0.024 * | 39 | 2.19 | 1.04 | 1.119 | 0.350 |
| 20–29 | 20 | 2.25 | 1.06 | 19 | 2.51 | 1.13 | |||||
| 30–39 | 18 | 3.14 | 1.17 | 39 | 2.19 | 1.08 | |||||
| 40–59 | 24 | 3.13 | 1.06 | 12 | 2.69 | 1.08 | |||||
| >59 | 25 | 2.77 | 0.89 | 26 | 2.55 | 0.87 | |||||
| Emotional Value | <20 | 25 | 3.19 | 0.78 | 3.396 | 0.012 * | 39 | 3.08 | 1.00 | 1.315 | 0.268 |
| 20–29 | 20 | 3.43 | 0.73 | 19 | 3.38 | 0.91 | |||||
| 30–39 | 18 | 3.81 | 0.67 | 39 | 2.99 | 0.99 | |||||
| 40–59 | 24 | 3.88 | 0.74 | 12 | 3.40 | 0.96 | |||||
| >59 | 25 | 3.64 | 0.74 | 26 | 3.43 | 0.84 | |||||
| Epistemic Value | <20 | 25 | 4.08 | 0.83 | 1.873 | 0.120 | 39 | 3.76 | 0.99 | 1.707 | 0.152 |
| 20–29 | 20 | 4.30 | 0.47 | 19 | 4.16 | 0.88 | |||||
| 30–39 | 18 | 4.19 | 0.60 | 39 | 4.11 | 0.80 | |||||
| 40–59 | 24 | 4.54 | 0.55 | 12 | 3.89 | 0.74 | |||||
| >59 | 25 | 4.28 | 0.52 | 26 | 4.26 | 0.72 | |||||
| Conditional Value | <20 | 25 | 4.17 | 0.73 | 1.191 | 0.319 | 39 | 4.03 | 0.83 | 3.140 | 0.017 * |
| 20–29 | 20 | 4.35 | 0.51 | 19 | 4.35 | 0.72 | |||||
| 30–39 | 18 | 4.46 | 0.57 | 39 | 4.50 | 0.59 | |||||
| 40–59 | 24 | 4.46 | 0.47 | 12 | 4.42 | 0.51 | |||||
| >59 | 25 | 4.45 | 0.45 | 26 | 4.51 | 0.43 | |||||
| Behavioral Intention | <20 | 25 | 4.05 | 0.56 | 0.851 | 0.496 | 39 | 3.98 | 0.73 | 2.494 | 0.046 * |
| 20–29 | 20 | 4.26 | 0.59 | 19 | 4.13 | 0.91 | |||||
| 30–39 | 18 | 4.14 | 0.67 | 39 | 4.35 | 0.58 | |||||
| 40–59 | 24 | 4.19 | 0.52 | 12 | 4.02 | 0.54 | |||||
| >59 | 25 | 3.98 | 0.57 | 26 | 4.41 | 0.51 | |||||
| Variables | Number of Mobile Apps | n | Avg | Sd | F | p |
|---|---|---|---|---|---|---|
| Functional Value | <20 | 64 | 3.38 | 0.68 | 2.091 | 0.083 |
| 20–29 | 39 | 3.48 | 0.62 | |||
| 30–39 | 57 | 3.69 | 0.72 | |||
| 40–59 | 36 | 3.57 | 0.53 | |||
| >59 | 51 | 3.63 | 0.57 | |||
| Social Value | <20 | 64 | 2.30 | 1.06 | 2.726 | 0.030 * |
| 20–29 | 39 | 2.38 | 1.09 | |||
| 30–39 | 57 | 2.49 | 1.19 | |||
| 40–59 | 36 | 2.98 | 1.07 | |||
| >59 | 51 | 2.66 | 0.88 | |||
| Emotional Value | <20 | 64 | 3.12 | 0.92 | 3.401 | 0.010 * |
| 20–29 | 39 | 3.41 | 0.81 | |||
| 30–39 | 57 | 3.25 | 0.98 | |||
| 40–59 | 36 | 3.72 | 0.84 | |||
| >59 | 51 | 3.53 | 0.79 | |||
| Epistemic Value | <20 | 64 | 3.89 | 0.94 | 2.823 | 0.026 * |
| 20–29 | 39 | 4.23 | 0.70 | |||
| 30–39 | 57 | 4.13 | 0.74 | |||
| 40–59 | 36 | 4.32 | 0.68 | |||
| >59 | 51 | 4.27 | 0.62 | |||
| Conditional Value | <20 | 64 | 4.09 | 0.79 | 4.461 | 0.002 * |
| 20–29 | 39 | 4.35 | 0.61 | |||
| 30–39 | 57 | 4.49 | 0.58 | |||
| 40–59 | 36 | 4.44 | 0.48 | |||
| >59 | 51 | 4.48 | 0.44 | |||
| Behavioral Intention | <20 | 64 | 4.01 | 0.67 | 1.590 | 0.178 |
| 20–29 | 39 | 4.20 | 0.75 | |||
| 30–39 | 57 | 4.29 | 0.61 | |||
| 40–59 | 36 | 4.13 | 0.52 | |||
| >59 | 51 | 4.20 | 0.58 |
| Variables | Value | 2017 | 2021 | Total | ||||||
|---|---|---|---|---|---|---|---|---|---|---|
| Age | # App Installed | App Usage Duration | Age | # App Installed | App Usage Duration | Age | # App Installed | App Usage Duration | ||
| Functional Value | r | −0.008 | 0.005 | 0.076 | 0.057 | 0.135 | 0.105 | 0.184 ** | 0.097 | 0.016 |
| p | 0.937 | 0.961 | 0.426 | 0.514 | 0.119 | 0.225 | 0.004 | 0.128 | 0.806 | |
| Social Value | r | −0.089 | 0.132 | 0.165 | 0.089 | 0.054 | 0.078 | 0.152 * | 0.088 | 0.038 |
| p | 0.352 | 0.164 | 0.082 | 0.304 | 0.533 | 0.368 | 0.017 | 0.169 | 0.551 | |
| Emotional Value | r | −0.012 | 0.162 | 0.081 | −0.014 | 0.085 | 0.095 | 0.163 * | 0.113 | 0.006 |
| p | 0.902 | 0.089 | 0.395 | 0.870 | 0.325 | 0.275 | 0.010 | 0.075 | 0.923 | |
| Epistemic Value | r | −0.049 | 0.098 | 0.127 | 0.054 | 0.154 | 0.016 | 0.141 * | 0.136 * | −0.011 |
| p | 0.607 | 0.303 | 0.181 | 0.536 | 0.075 | 0.853 | 0.027 | 0.033 | 0.868 | |
| Conditional Value | r | 0.109 | 0.092 | −0.031 | −0.038 | 0.177 * | −0.038 | 0.034 | 0.147 * | −0.044 |
| p | 0.254 | 0.335 | 0.742 | 0.664 | 0.040 | 0.663 | 0.597 | 0.021 | 0.495 | |
| Behavioral Intention | r | 0.025 | −0.086 | 0.160 | 0.028 | 0.181 * | 0.003 | −0.033 | 0.082 | 0.076 |
| p | 0.793 | 0.366 | 0.092 | 0.744 | 0.036 | 0.972 | 0.607 | 0.199 | 0.232 | |
Disclaimer/Publisher’s Note: The statements, opinions and data contained in all publications are solely those of the individual author(s) and contributor(s) and not of MDPI and/or the editor(s). MDPI and/or the editor(s) disclaim responsibility for any injury to people or property resulting from any ideas, methods, instructions or products referred to in the content. |
© 2023 by the authors. Licensee MDPI, Basel, Switzerland. This article is an open access article distributed under the terms and conditions of the Creative Commons Attribution (CC BY) license (https://creativecommons.org/licenses/by/4.0/).
Share and Cite
Derawi, M.; Dalveren, G.G.M.; Cagiltay, N.E. Mobile Application Software Requirements Specification from Consumption Values. Electronics 2023, 12, 1592. https://doi.org/10.3390/electronics12071592
Derawi M, Dalveren GGM, Cagiltay NE. Mobile Application Software Requirements Specification from Consumption Values. Electronics. 2023; 12(7):1592. https://doi.org/10.3390/electronics12071592
Chicago/Turabian StyleDerawi, Mohammad, Gonca Gokce Menekse Dalveren, and Nergiz Ercil Cagiltay. 2023. "Mobile Application Software Requirements Specification from Consumption Values" Electronics 12, no. 7: 1592. https://doi.org/10.3390/electronics12071592
APA StyleDerawi, M., Dalveren, G. G. M., & Cagiltay, N. E. (2023). Mobile Application Software Requirements Specification from Consumption Values. Electronics, 12(7), 1592. https://doi.org/10.3390/electronics12071592