1. Introduction
Human activity recognition (HAR) is the process of extracting and capturing effective action information features from behavioral data produced by the human body, learning and understanding the actions performed by humans, and further determining the type of action. HAR combines knowledge from machine learning, intelligent biotechnology, smart wearable computing technology, computer vision, and many other disciplines. It plays a crucial role in recognizing a user’s interactions with his or her surroundings. HAR has therefore received a great deal of attention in applications such as home automation systems, medical rehabilitation, motion monitoring, fall prevention, and maladaptive behavior recognition [
1,
2]. For instance, HAR can be used to monitor the daily activities of elderly people who live alone, observing whether elderly individuals experience a fall so that they can seek help from their families in time, or even preventing such a fall [
3]. It can also be used to collect data on the movement status of exercisers for real-time scientific exercise management [
4], to analyze the limb movement status of patients with neurological disorders for diagnosis and treatment, or, according to an individual patient’s movement data, to formulate and adjust the rehabilitation plans in the rehabilitation phase [
5].
HAR can be broadly classified into video-based and sensor-based activity recognition [
6].
The camera-based method extracts the human activity features from images and video streams by placing cameras in the human surroundings. Although this method allows for a more intuitive sense of the various details of the action, it is very restricted in its use to specific scenarios and cannot be used in unstructured scenarios as the camera has high requirements for external conditions, such as weather conditions, lighting conditions, and viewpoint orientation, when collecting data, and the clothing and height of the human targets will differ [
7]. In addition, the presence of cameras may be considered invasive to the privacy of the user, but also increases the overall computational cost due to the sheer volume of data.
The sensor-based method uses multimodal information that is obtained using various wearable sensors to identify, interpret, and evaluate human activities. Initially, sensor technology was mostly used to analyze human gait and joint kinematics to assist in medical diagnosis and rehabilitation monitoring. Sensor technology has since made significant breakthroughs in several key performance indicators, such as better accuracy, smaller size, and lower manufacturing costs [
8]. These advantages have led to a wider range of sensor applications. Compared with the equipment needed for the vision-based method, sensors are portable, lightweight, and can easily be integrated with other devices. They enable the continuous sensing of movements during daily activities without limiting the user’s movement behavior, and they improve the way that users interact with each other and with their surroundings.
Inertial and flexible sensors are commonly used wearable sensors, and inertial sensors have been successfully applied to HAR. However, because inertial sensors are mostly made of rigid materials with poor ductility, wearable devices incorporating inertial sensors are bulky and have poor skin fit leading to comfort problems, and their detection accuracy is greatly affected by the speed of movement [
9]. Researchers have turned their attention to flexible sensors, which are less affected by motion speed and are made of thin, light, and soft materials [
10,
11]. The most prominent of these flexible sensors are stretch sensors, which can be sewn onto clothing to obtain data on bending or straightening at joints, or on breathing and heartbeat. This paper focuses on HAR based on inertial and flexible sensors.
Traditional approaches to activity recognition primarily use machine learning methods to manually extract features from sensor data, and these are typically statistical or structural features, including means, medians, standard deviations, etc., and domain expertise is often required to obtain the most relevant set of manual features. While these types of handcrafted features perform well in limited training data scenarios, the extraction of effective features becomes very complicated and difficult as the number of sensors increases.
These problems can be solved by deep learning algorithms with convolutional neural networks (CNNs), recurrent neural networks (RNNs), deep belief networks, and autoencoders. CNNs excel in local feature extraction [
12], but CNNs do not consider pattern sequences or remember changes in pattern sequences over time based on the lengths of gaps between them [
13]. On the other hand, RNNs have the advantage of being able to effectively capture time series data features, though traditional RNNs suffer from the vanishing gradient problem and lack the ability to capture long-term dependencies [
14]. Therefore, to overcome the above challenges, we propose a two-channel network model based on residual blocks, an efficient channel attention module (ECA), and a gated recurrent unit (GRU).
The main contributions of this paper are as follows:
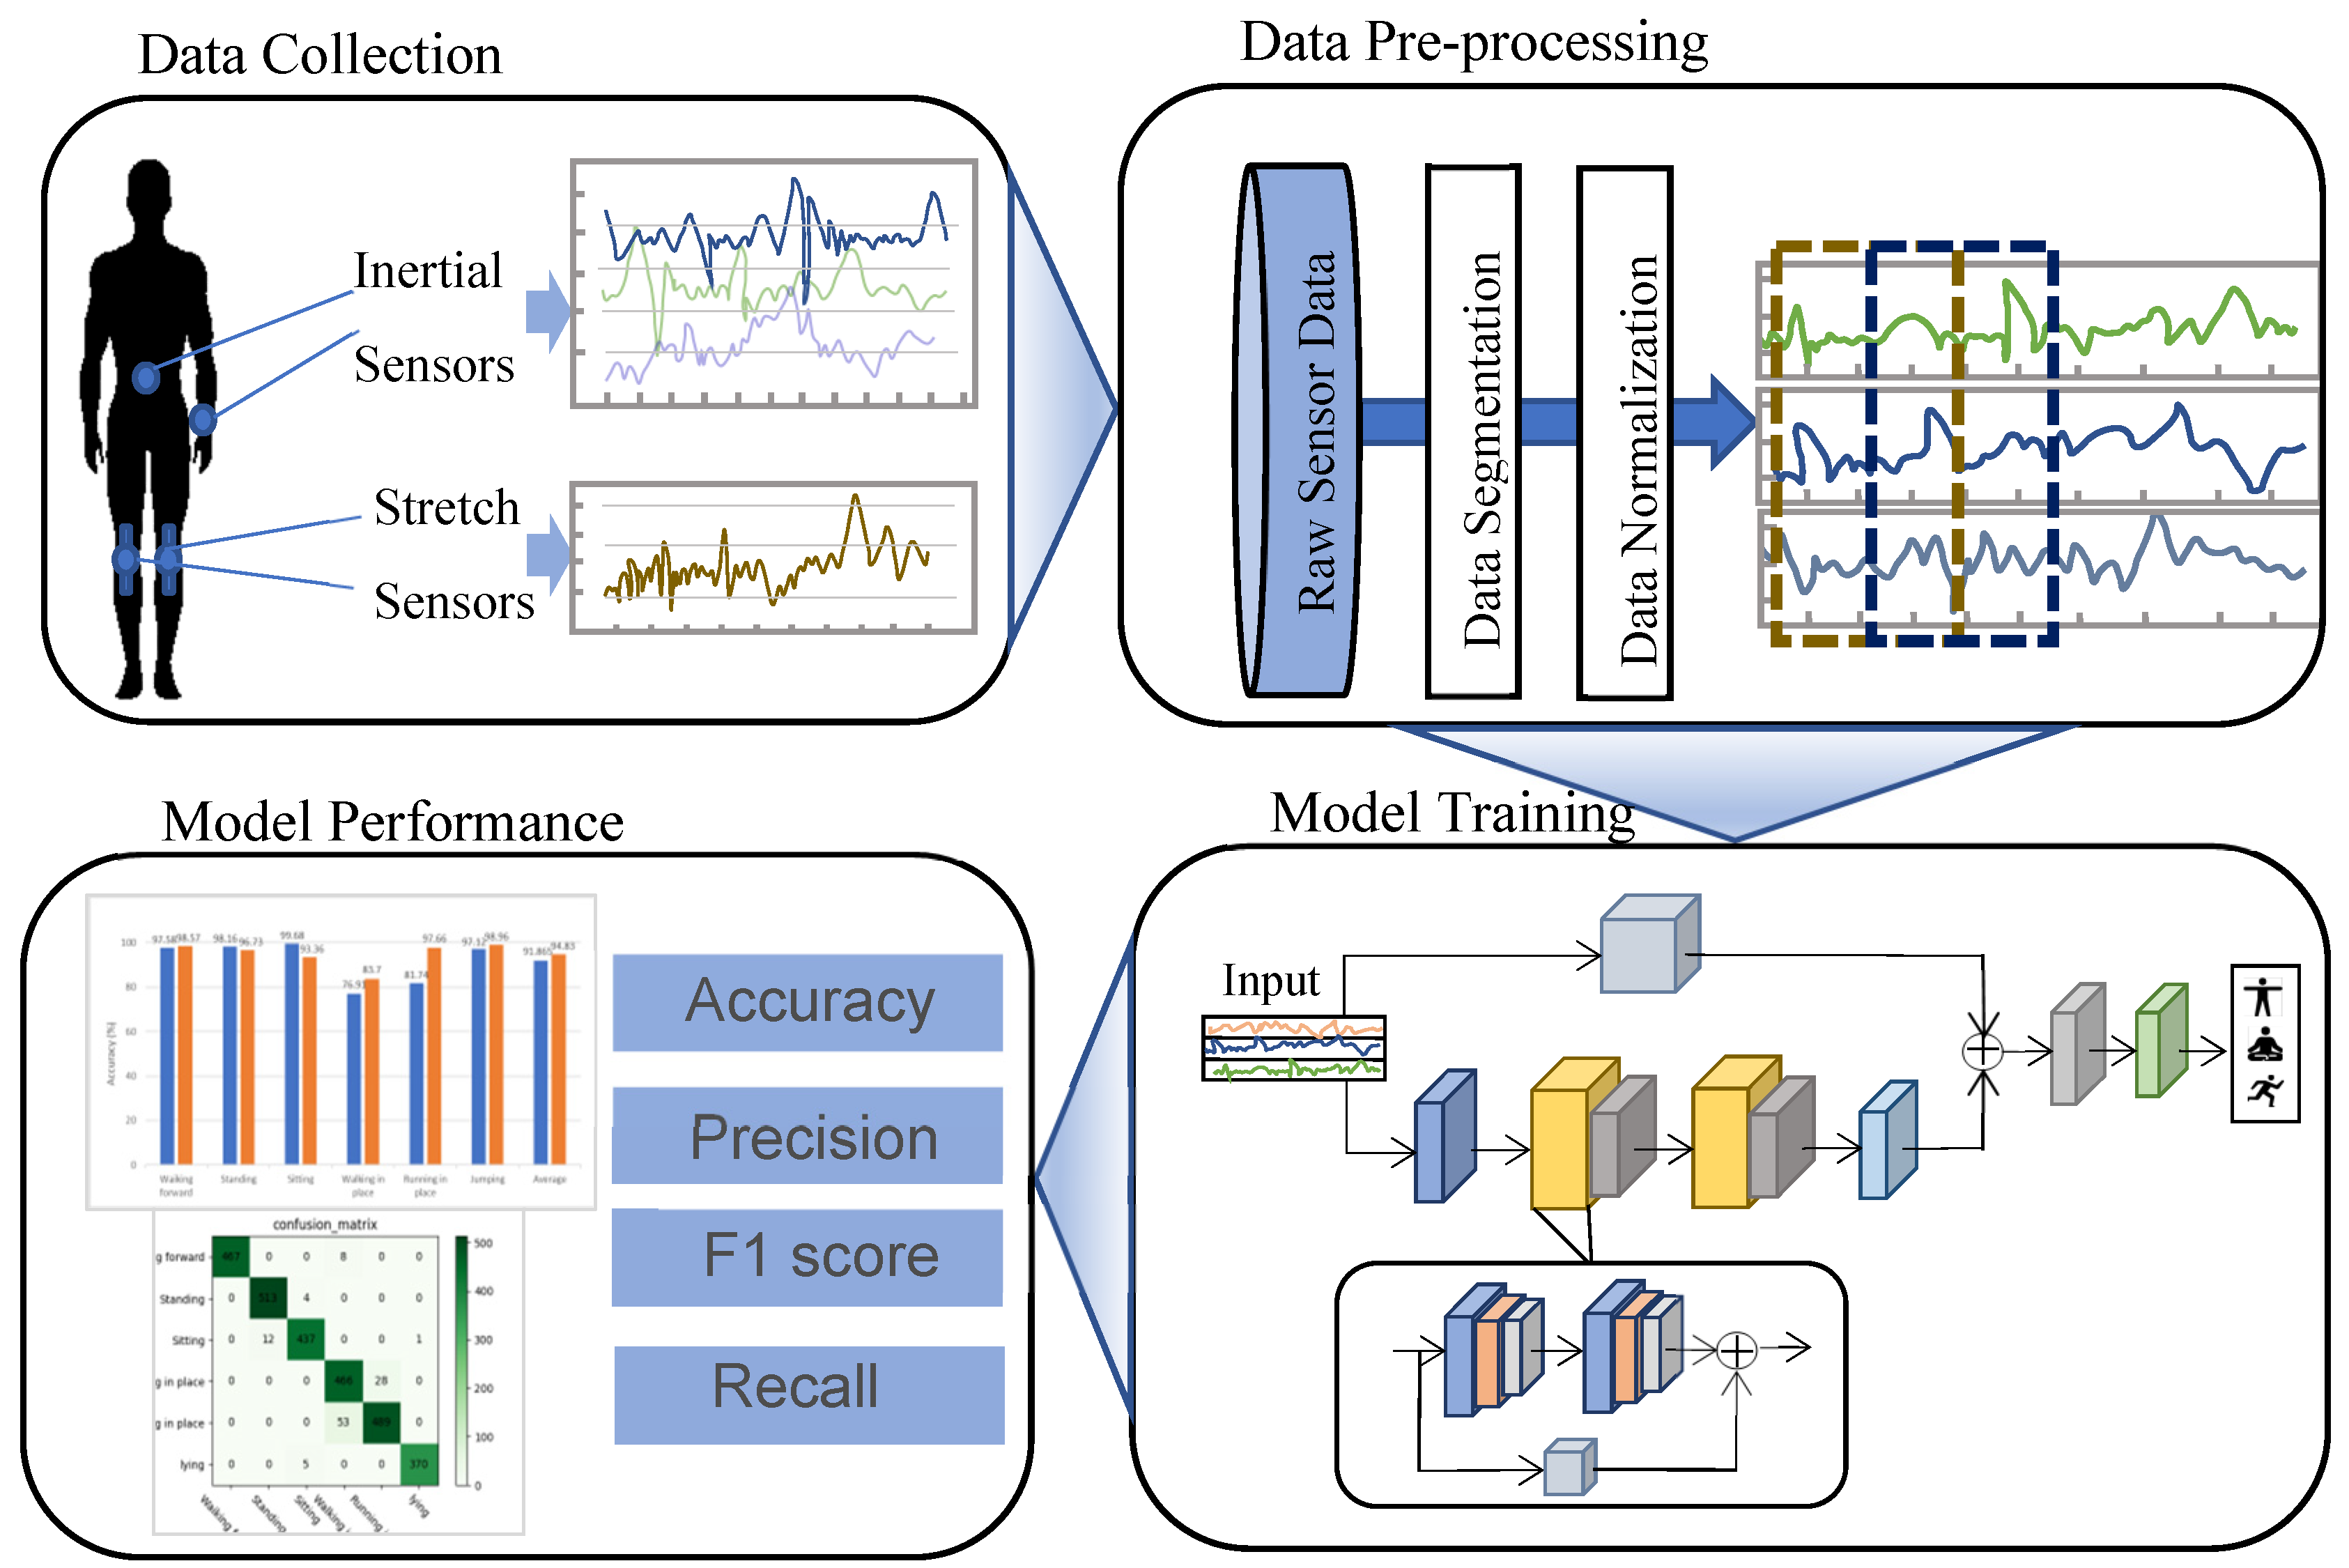
A sensor-based human activity recognition framework which consists of inertial sensors and stretch sensors is proposed to investigate the effectiveness of different combinations of sensor data in human activity recognition and to verify the feasibility of flexible stretch sensors in human action recognition.
A two-channel network model based on residual blocks, an efficient channel attention module (ECA), and a gated recurrent unit (GRU), and which is capable of modelling long-term sequences of data, effectively extracting spatial–temporal features, and performing activity classification, is proposed.
The IS-Data dataset was produced and data were collected using self-developed stretching sensors and inertial sensors. The proposed model was tested on the IS-Data dataset and the publicly available w-HAR dataset, and in both cases the results outperformed the existing solutions.
The remainder of this paper is organized as follows:
Section 2 introduces an overview of related work on HAR and deep learning approaches. The proposed methodology, including the experimental framework and model structure, is described in
Section 3.
Section 4 introduces the dataset, experimental content, evaluation metrics, ablation studies, and analysis of experimental results. Finally, the conclusion of the study is discussed in
Section 5.
4. Experimental Results and Discussion
In order to validate the feasibility of stretch sensor data in human activity recognition, to evaluate the effectiveness of data from different sensors in human activity recognition, and to test the performance of the proposed network model, we performed experimental tests with data from inertial sensors, data from stretch sensors, and combinations of data from inertial sensors and stretch sensors in the IS-Data and w-HAR datasets, respectively. More information concerning activities recorded in the w-HAR dataset and the IS-Data dataset is shown in
Table 1.
4.1. Experimental Dataset
4.1.1. w-HAR Dataset
The w-HAR dataset [
56] was built by researchers from Washington State University. They mounted the IMU on the right ankle of the user and sewed the stretch sensor to a knee sleeve. They had 22 subjects aged 20–45 years (including 14 males and 8 females) carry out 8 activities (jumping, lying down, sitting, walking downstairs, walking upstairs, standing, walking, and transition). Acceleration and angular velocity data obtained from the IMU sensors were collected at a sampling frequency of 250 Hz, and the stretch sensor was sampled at 25 Hz. In this study, we only used six of these activities (jumping, sitting, walking downstairs, walking upstairs, standing, and walking). The IMU sensor data were down sampled from 250 Hz to 25 Hz to reduce the computational cost.
4.1.2. IS-Data Dataset
The dataset produced for this paper was obtained using a self-developed six-axis inertial sensor and a stretch sensor. As is shown in
Figure 6, the stretch sensor used in this study was a capacitive sensor, where the output capacitance increased with increasing strain and decreased with decreasing strain as the sensor extended and contracted.
The stretch sensor module was sewn onto the knee brace and was connected to a circuit module. The bending angle of the sensor was calculated by measuring the resistance of the sensor, and finally the data of the angle were output.
Two stretch sensors were fitted to the knees of the participants, as shown in the figure. When wearing the device, the user just wore the knee pads and ensured that the stretch sensors were aligned with the center of the kneecap. In addition, three six-axis inertial sensors were placed on the wrist, waist, and ankle, all of which used Bluetooth Low Energy (BLE) technology to collect data, using the BLE protocol, and these data were then transmitted to the smartphone and stored in a file. The dynamic range of the accelerometer and gyroscope output data were set to ±8 g and ±2000 dps. Both types of sensors used the same 50 Hz sampling frequency.
Following this, six adult participants with an average age of 26 years wore these sensors and performed the following six activities: walking, standing, sitting, stepping in place, running in place, and jumping. We required the participants to be in a state of health and comfort in order to perform these activities as naturally as possible, and the dataset was named IS-Data.
4.2. Pre-Processing
Since the data from the sensors were transmitted via a wireless Bluetooth connection, some of the data may have been lost, or they may have contained some noise during the acquisition process, so a linear interpolation algorithm was used to fill in the missing values and a Butterworth filter was used to filter the noise from the data signal. The raw data that were collected were normalized to a range of 0 to 1 using Equation (9).
where
denotes the normalized data,
n denotes the number of channels, and
and
are the maximum and minimum values of the
i-th channel, respectively.
The processed data were then segmented using a sliding window with an
L size of 2.5 s and an overlap of 50%, where the sample data
were represented as
where
ax,
ay,
az,
gx,
gy,
gz,
f1 are column vectors containing
L data samples of 3-axial acceleration, 3-axial angular velocity, stretching-shrinking information, respectively.
N is the number of sensors and
L is the length of the sliding window. Finally, all the column vectors are joined together into window data
.
Details concerning the data preprocessing, such as the sampling rate, window size, and overlapping rate, are presented in
Table 2. In the experiments, each dataset was divided into a training set (70%) and a validation set (30%). The other hyper-parameters, such as training epochs, batch size, and learning rate, are also listed
Table 2.
4.3. Experimental Environment
The network in this paper was trained on a computer equipped with an Intel Core i7 CPU, 16 GB of RAM, and a graphics processor (GPU) (NVIDIA GeForce GTX 3060 with 6 GB of memory). The algorithm was implemented using python 3.8 based on Google’s opensource deep learning framework TensorFlow 2.3.0, and the development environment used for the experiments was PyCharm on a 64-b version of Windows 11. The GPU was used to speed up the training and testing of the model.
4.4. Evaluation Metrics
In this paper, the effectiveness of the proposed model was calculated using different performance metrics [
57], described as follows:
Accuracy: this is defined as the fraction of samples predicted correctly to the total number of samples.
Precision: the fraction of positive samples recognized correctly out of the total number of samples recognized as positive.
Recall: the fraction of positive samples recognized correctly out of the total number of positive samples.
F1-score: this is a comprehensive estimate of the model’s accuracy and can be calculated as the harmonic mean of the precision and recall.
Confusion matrix (CM): This is a square matrix that gives the complete performance of a classification model. The rows of the CM signify instances of the true class labels, and columns signify predicted class labels. The diagonal elements of this matrix define the number of points for which the predicted label is equal to the true label.
A multiclass classification issue is represented by collection A that has
n distinct class labels B
i, (
i = 1, 2, 3, …,
n) represented by {B1, B2, B3, …, B
n}. For this situation, the confusion matrix is an
n ×
n matrix. Each row of the matrix corresponds to an actual instance of a class, and each column corresponds to an anticipated instance of a class. An element C
ij of the confusion matrix specifies the number of cases for which the actual class is
i and the signified class is
j, as shown in
Figure 7.
These are mathematically expressed as:
4.5. Experiment Analysis and Performance Comparison
4.5.1. Inertial Sensor and Stretch Sensor Results
A summary of the recognition accuracy, recall, and F1 scores for the various activities recorded in the IS-Data dataset and the w-HAR dataset are shown in
Table 3 and
Table 4. As
Table 3 and
Table 4 illustrate, for the three types of activities—walking, standing, and sitting—the respective stretch sensor recognition precision values are 99.16%, 99.61%, and 100% for the IS-Data dataset, and these values are higher than the inertial sensor recognition accuracy values. The stretch sensor recognition precision values are 96.68%, 97.31%, and 98.56% for the w-HAR dataset, with little difference in classification results between these and those of the inertial sensors. For jumps, the data recognition accuracy values of the stretch sensors are 93.6% and 94.41% in the two datasets, and although these are not as high as under inertial data, they achieve a comparable recognition performance. Thus, one can see that the stretch sensor has performs very well when monitoring activities that involve more significant joint site changes and that it has good potential for differentiating lower limb activities with similar patterns.
Confusion matrices for the proposed model with respect to the IS-Data dataset and the w-HAR dataset are illustrated in
Figure 8 and
Figure 9. As shown in
Figure 8, the stretch sensor has many misclassifications for two activities that walking in place and running in place, as there is a strong similarity between these two activities in the lower limb activities. Similarly, the recognition of upstairs and downstairs can be easily confused as shown in
Figure 8. It is just not possible to distinguish well between running in place and walking in place depending on the degree of flexion of the lower limb joints and the use of inertial sensors is slightly more effective.
4.5.2. Results of Recognition of the Combination of Inertial Sensors and Stretch Sensors
For some very similar activities, the final recognition results are not very good, whether based on the inertial sensors or the stretch sensors. We therefore combined the two types of sensor data to test whether they could improve the recognition of the activities, and we compared the experimental results with data from the inertial sensors and the stretch sensors, respectively.
The confusion matrix obtained by combining the data from the two sensors is shown in
Figure 10. The results obtained from the data of both sensors using the IS-Data dataset and the w-HAR dataset are shown in
Table 5 and
Table 6, respectively. The combined use of data from the two sensors, as described in the previous subsection, led to an improvement in the identification of similar actions. For the activity of walking in place in the IS-Data dataset, there were increases in precision of 30.42% and 1.82% compared with the stretch data and inertial data, respectively. For the activity of running in place, the precision increased by 29.15% and 3.32%, respectively. In the w-HAR dataset, respective precision increases of 15.15% and 6.06% were obtained for walking upstairs compared with the stretch data and inertial data. The precision for walking downstairs increased by 6.66%.
In
Figure 11, the accuracy of the combination of inertial sensor and stretch sensor data in the IS-Data dataset is 97.51%, which is 11.27% higher than the accuracy of stretch sensor data alone, and about 1.4% better than the accuracy of the inertial sensor data alone, which had an accuracy of 96.11%. Similarly, the accuracy of the combination of inertial sensor and stretch sensor data in the w-HAR dataset is 98.24%, which is approximately 2.49% better than that of the stretch sensor data alone, and about 0.58% better than the accuracy of the inertial sensor data alone, which was 97.66%.
Overall, the combination of inertial and stretch sensor data contributes to the effectiveness of activity recognition.
4.5.3. On the Performance of the Proposed Network Model
The proposed model will now be compared with state-of the-art deep learning approaches in the scope of HAR.
As is shown in
Table 7, we begin by comparing it with baseline classification models (CNN, LSTM, and GRU). Next, three hybrid deep learning approaches are compared with the proposed model: CNN–GRU [
48], InnoHAR [
45], and ResNet + AttLSTM [
49]. It should be noted that both the recognition accuracy and the F1 score of our model were better than those of the other models, and that our model achieved the highest accuracy (97.51%) and the highest F1-score (97.63%) when the stretch sensor and inertial sensor data were combined. The proposed model thus achieved the most stable performance.
4.6. Ablation Studies
4.6.1. Impact of Residual Blocks
In order to investigate the impact of the proposed addition of residual blocks on the model’s performance, we conducted ablation experiments on two datasets using combined data from the stretch and inertial sensors.
This experiment used a simple CNN without residual connections as the baseline architecture. The results are displayed in
Table 8. The CNN demonstrated the lowest performance in recognition, perhaps because the capture of spatial relationships could not be carried out smoothly owing to information leakage. In contrast, we obtained better performance with the model which used the residual connection module. The F1 scores produced with the IS-Data dataset and the w-HAR dataset improved by 2.51% and 2.41%, respectively.
4.6.2. Effect of GRU
For the purpose of evaluating the effectiveness of GRU in capturing long-term dependencies in time series, we performed ablation experiments on RNN, LSTM, and GRU using two datasets and a combination of data obtained from stretch sensors and inertial sensors. The results are displayed in
Table 9. Simple RNNs exhibit the poorest recognition performance since the gradient disappearance problem causes simple RNNs to fail to capture long-term dependencies in time series. In comparison, the LSTM achieved better performance, with F1 scores improving by approximately 1.72% and 1.03%, respectively. The GRU performed better than the LSTM, with F1 score increases of about 2.83% and 2.06%, respectively.
4.6.3. Effect of the ECA Module
We wished to determine the effect of the addition of the ECA module on the accuracy of the model recognition, and it is evident from
Table 10 that the F1 scores obtained with the ECA module are slightly higher for both datasets (by 0.83% and 0.59%).
In summary, the proposed two-channel network model based on residual blocks, efficient channel attention (ECA) modules, and gate control recurrent units (GRUs) effectively extracts optimal features from the sensor data. In comparison with other state-of-the-art HAR methods, much higher F1 scores are obtained for the IS-Data datasets and w-HAR datasets.
5. Conclusions and Discussion
In recent years, most sensor-based HAR methods have used inertial sensors, but with the development of flexible sensors, and considering the comfortable nature of wearable sensors and the lack of accuracy of inertial sensors themselves, this may soon change. This paper evaluates the feasibility of using deep learning algorithms for the application of stretch sensors in human activity recognition with respect to the combination of inertial sensors and stretch sensors. It has been demonstrated that stretch sensors can identify certain activities that involve the use of human joints more accurately than inertial sensors. Combining the advantages of two types of sensors will not only improve the comfort and freedom of traditional wearable sensors, but will also improve the accuracy of recognition.
We propose a two-channel network model based on residual blocks, efficient channel attention (ECA) modules, and gate control recurrent units (GRUs). Using residual blocks and GRUs enables the modelling of long-term time series data and the effective extraction of spatial–temporal features, which helps the model learn discriminative features. For further efficient learning, the use of ECA modules with appropriate cross-channel interaction can significantly reduce the complexity of the model and guarantee the performance of the classification of activities. Our experiments on the self-collected IS-Data dataset and a public dataset called w-HAR demonstrated that our proposed model achieves better accuracy.
Although we have only briefly evaluated the feasibility of stretch sensors in human activity recognition with a small amount of human joint flexion data that we collected from stretch sensors, this is enough to demonstrate that stretch sensors hold unique advantages and may soon become a novel and popular choice for multi-modal human activity recognition in this research area.


