Article

An Ultra-Wideband Plane Wave Generator for 5G Base Station Antenna Measurement

School of Electronic and Information Engineering, Beihang University (BUAA), Beijing 100191, China
*
Author to whom correspondence should be addressed.
Electronics 2023, 12(8), 1824; https://doi.org/10.3390/electronics12081824
Submission received: 21 February 2023 / Revised: 4 April 2023 / Accepted: 10 April 2023 / Published: 12 April 2023
(This article belongs to the Special Issue Recent Advances and Applications of Array Signal Processing)

Abstract

:
Plane-wave generators (PWGs) for over-the-air testing of 5G base stations offer the advantages of efficiency and economy. Many new bands, such as n28, are progressively being introduced, driving the bandwidth improvement of PWGs. The cost of amplitude–phase control networks is also increased by the broadband range required for testing. In view of the above challenges, in this paper, a low-frequency ultra-wideband PWG for testing 5G base stations is reported. Firstly, an electrically small antenna unit based on the Vivaldi antenna is design for the PWG. The antenna unit has a wide operating band and compact size, allowing it to reach a quarter of the minimum frequency wavelength. Then, the operating band from 700 MHz to 4 GHz is divided into three sub-bands, and the amplitude and phase excitations within each sub-band are optimized with multiple frequency points. Finally, the designed ultra-wideband PWG is simulated and experimentally tested. The designed 2.64 m one-dimensional linear-array PWG is able to produce a 1.5 m × 1.32 m quiet zone with less than 1.0 dB and 10°. The results of the radiation pattern measurements for the base station agree reasonably well with the MVG SG128.

1. Introduction

In antenna pattern test systems, far-field measurement conditions require the antenna under test (AUT) aperture to be illuminated by a uniform plane wave. In engineering implementations, to reduce the amplitude and phase fluctuations to below a certain threshold under π/8 aperture difference conditions, the minimum test distance for far-field measurements should be greater than 2 D 2 / λ , where D is the maximum diameter of the AUT and λ is the wavelength of the electromagnetic wave at the operating frequency [1]. These two variables need to be taken into account when building test sites. As the working frequency of the AUT decreases, it is not feasible to expand the test site to meet the far-field measurement conditions due to the significant increase in the anechoic chamber construction cost; moreover, the increase in channel road loss caused by long distance affects the dynamic range of the measurements.
Consisting of multiple antenna elements, the PWG limits the amplitude and phase fluctuations of electromagnetic waves of the near-field observation area to a certain range by optimizing the excitation weight of the amplitude–phase feed network and feeding each antenna element [2], as shown in Figure 1. That is to say, the plane wave meeting the far-field test conditions can be synthesized in the near-field distance. This quasi-plane wave area is called the quiet zone, the electromagnetic environment of which is able to restore the far-field test conditions. Thus, the test can be performed under far-field conditions by placing the AUT of the base station in parallel with the PWG in the quiet zone.
The PWG is analogous to the compact antenna test range (CATR) in principle and application mode [3,4,5]. However, the PWG has unique advantages: the size of the PWG is smaller than that of the CATR, and possesses a higher aperture utilization rate, as well as a greater adaptive anechoic chamber size, which plays a positive role in the testing of 5G millimeter wave band equipment with high road loss. Furthermore, the PWG array unit is detachable, so it is suitable for rapid test requirements due to its flexible construction and movement. The manufacturing cost of the PWG antenna unit and the related tools and equipment is low, while the cost of the CATR is relatively high, because of the complex manufacturing process of the reflector and the larger size of the anechoic chamber [3,6,7].
With the development of 5G communication technology, the demand for 5G base station testing has expanded further. PWGs are widely used in 5G base station testing because of their convenience and economic advantages [8]. However, there have also been some challenges that needed to be solved in order to be able to use PWGs for 5G testing. The operating band of 5G is generally broad, and with the authorization of the 700 MHz (n28 bands), the use of PWGs for 5G base station testing needs to be able to meet the requirements of low-frequency ultra-widebands. At the same time, the element spacing of the antenna array is closely related to the operating frequency band. In order to better control the aperture size of a PWG, the antenna unit in the PWG needs to meet the requirement of being electrically small while meeting the requirements of ultra-widebandwidth. In addition, the greater number of antenna units in PWGs limits the use of phasers in the broadband range of the feeder network and increases the cost. In light of the above problems, in this paper, an ultra-wideband PWG is designed for 5G base station testing. Considering the characteristic shape of 5G base stations, which tend to be of a slender shape, the PWG takes the form of a one-dimensional linear array to generate a cylindrical field. In order to meet the low-frequency ultra-wideband characteristics required in 5G base station testing, in this paper, an ultra-wideband antenna unit is designed based on the Vivaldi antenna, which meets the requirements regarding ultra-wideband characteristics while ensuring electrically small characteristics. At the same time, considering the limitations of the amplitude–phase control network for ultra-wideband range control, in this paper, a segmentation test method is proposed to divide the broadband range into multiple sub-bands and optimize multiple frequency points within the sub-bands together to obtain the best amplitude–phase excitation.
The contributions of this paper can be summarized as follows:
  • For the over-the-air test requirements of 5G base stations, in this paper, a low-frequency ultra-wideband 1D linear array PWG is reported;
  • A Vivaldi antenna-based electrically small ultra-wideband antenna unit is proposed, designed using slotting, impedance matching, and feed network to ensure ultra-wideband characteristics. Meanwhile the size of the antenna unit can be as large as a quarter of the minimum frequency wavelength.
  • A multi-frequency optimization and segmented band testing method is proposed to divide the ultra-wideband range into several frequency bands for amplitude and phase excitation optimization and testing to reduce the complexity of the feeder network.
The remainder of this paper is structured as follows: Section 2 introduces the design of the ultra-wideband antenna unit and the optimization of the PWG array arrangement; Section 3 presents the simulation and experimental verification results of the low-frequency ultra-wideband PWG reported in this paper; Section 4 summarizes this paper and provides some future outlooks.

2. Design and Optimization of Ultra-Wideband Plane Wave Generators

This section describes the design and optimization method used for the PWG for 5G base station testing proposed in this paper. Since 5G base stations have a slender shape, a one-dimensional linear array can be used to generate a cylindrical wave that meets the testing requirements. To obtain a low-frequency ultra-wideband PWG, the antenna unit needs to be designed with ultra-wideband characteristics. The ultra-wideband antenna unit was designed based on a Vivaldi antenna by means of slotting, impedance matching, and feed network re-optimization. In addition, multiple factors such as array length, position and size of the quiet zone, and mutual coupling elimination between antenna units need to be taken into consideration in the array design process [9,10,11]. For amplitude–phase excitation optimization in the broadband range, the sub-band was firstly divided, and several frequency points in the sub-band were selected for optimization using the genetic algorithm.

2.1. Low-Frequency Broadband Antenna Unit

According to the slot line radiation theory on the Vivaldi antenna, electromagnetic waves can be effectively radiated only when the width of the slot line is greater than 1/2 of the wavelength corresponding to the operating frequency and less than 2 times the operating wavelength [12]. It can be concluded that the upper and lower limits of the operating frequency of the Vivaldi antenna are limited by the widest and narrowest distance of the exponential slotted line. The size of an antenna cannot be expanded infinitely, so the low cutoff of the operating frequency of the Vivaldi antenna is limited [13,14]. For the design of an ultra-wideband Vivaldi antenna, the main considerations are those of slotting, impedance loading and wideband feed structure design.
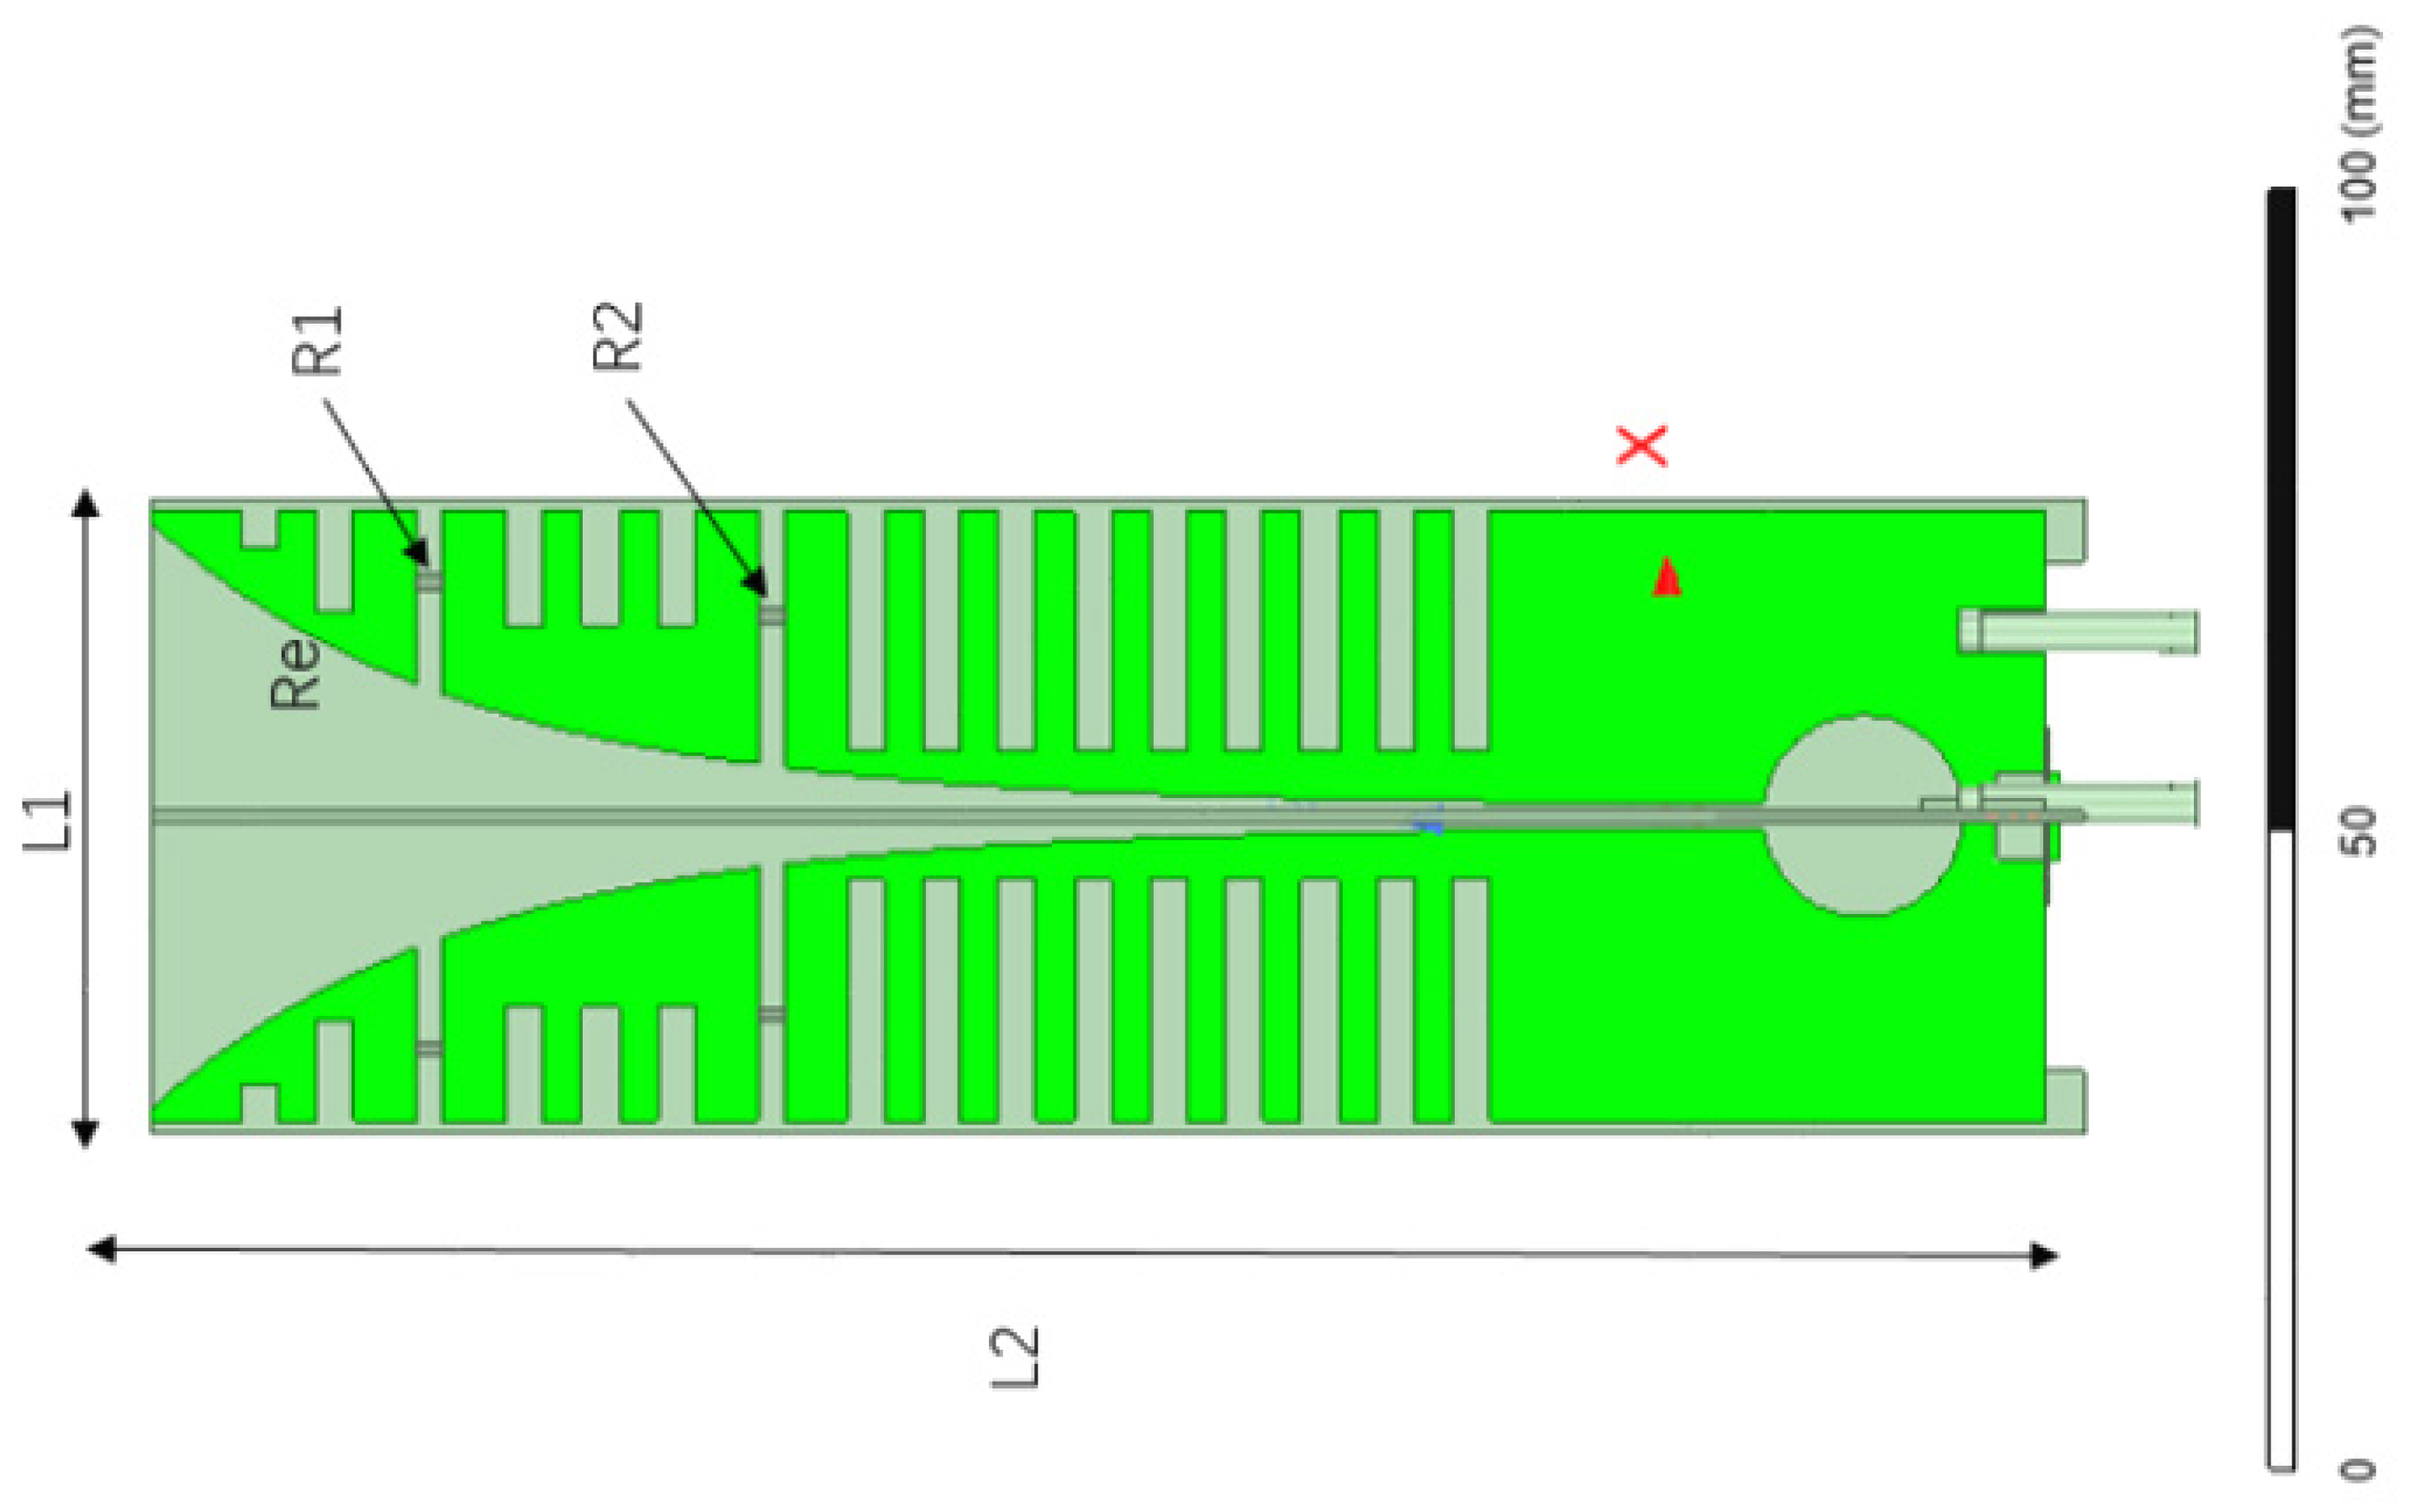
The structure of the ultra-wideband Vivaldi antenna unit designed in this paper is shown schematically in Figure 2. The antenna is equipped with equal-width rectangular slots of different lengths from top to bottom, which reduces the energy distribution along the edge of the radiation arm and causes the current flow along the slot line to improve the radiation efficiency and increase the element bandwidth. After slotting, the current flow path increases significantly, and the operating frequency can be reduced without changing the antenna size and operating mode.
Impedance loads are placed at R1 and R2 in Figure 2. Impedance loading would increase the ohmic loss of the antenna, and decrease the quality factor (Q-value) of the corresponding equivalent resonant circuit, leading to a weakening of the binding of the dielectric substrate to the field, which is more conducive to the outward radiation of the antenna electromagnetic wave and widened working bandwidth. However, the loading of resistance would consume part of the energy and affect the radiation efficiency.
As shown in Figure 3, a coaxial-microstrip slot line was used for feeding, transited to the slot line through multistage microstrip lines, which allowed impedance matching with a greater bandwidth. The extended branch at the lower end of the microstrip line was remodeled into a sector stub structure, enabling the microstrip line to remain open over a wider frequency band. The extended branch at the lower end of the slot line was remodeled into a circular resonator structure, ensuring that the end of the slot line remained short circuited in a wider frequency band to improve the matching bandwidth and radiation efficiency.
As shown in Figure 2 and Figure 3, certain parameters are employed to specify the dimensions of the Vivaldi antenna unit and its individual components. Table 1 presents detailed values for each dimension, serving as an example that can be implemented for reference when constructing the Vivaldi antenna unit. L1 and L2 are the length and width of the antenna unit, L3, L4, L5, L6, L7, and L8 are the dimensions of the microstrip unit in the Vivaldi antenna. R1 and R2 denote the impedance values for impedance matching, and Re is the coefficient value of the exponentially tapered slot line.
By optimizing the Vivaldi antenna for slotting, impedance loading and broadband feed structure design, an ultra-wideband low-frequency Vivaldi antenna is designed, which has a good broadband effect, while also having a small electrical size. In Section 3, the designed antenna is simulated and verified.

2.2. Low-Frequency Broadband Plane Wave Array

In Section 2.1, we designed a Vivaldi antenna with low-frequency ultra-wideband characteristics in the band range of 0.7 GHz to 4 GHz. Figure 4 shows an antenna unit with dual polarization using two Vivaldi antennas, which together form the antenna unit of a PWG, following the addition of a radome. Based on the theoretical analysis and the engineering implementation, the total length of the PWG antenna array was 2.64 m, 22 antenna units were used, and the antenna element spacing was 110 mm. The 22 dual polarized antenna units were fixed on the antenna backplane of three sections, each of which was detachable for ease of assembly and use. To ensure the performance of the antenna array in synthesizing plane waves, the vertical deformation of the antenna backplane, that is, the straightness tolerance, should be within a small range. In our study, the antenna straightness tolerance was ±3 mm. The influence of straightness tolerance should be taken into consideration when calculating the optimal amplitude and phase excitation values of antenna arrays.
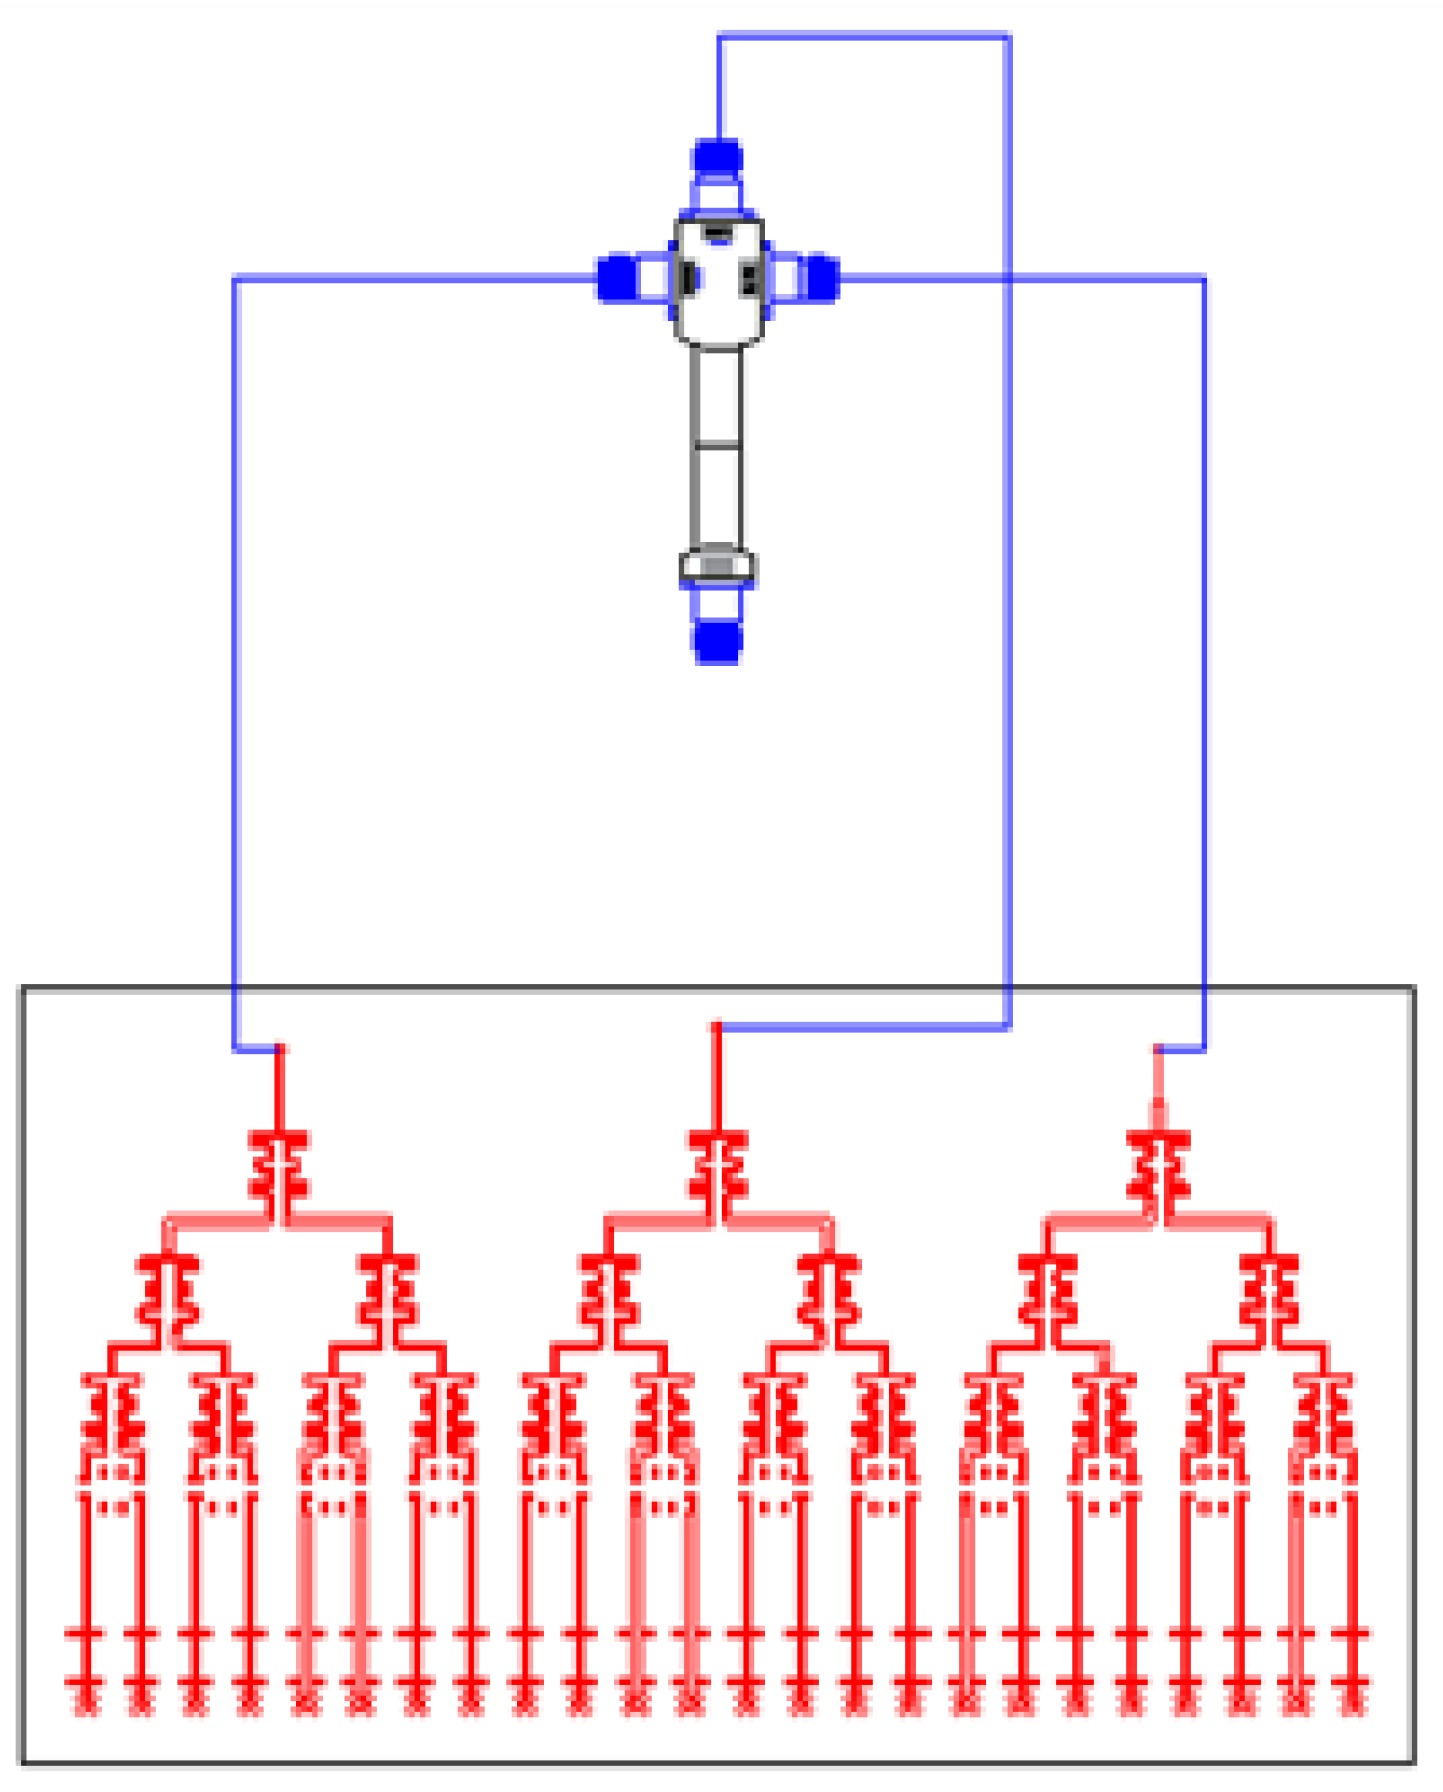
The feed network of the dual polarized antenna array is shown in Figure 5, in which we applied one one–three main port and three one–eight three-section Wilkinson power dividers. The amplitude required to feed the antenna array was attenuated by the π network to achieve the desired output level value, and the required phase was output by coaxial lines with different lengths.
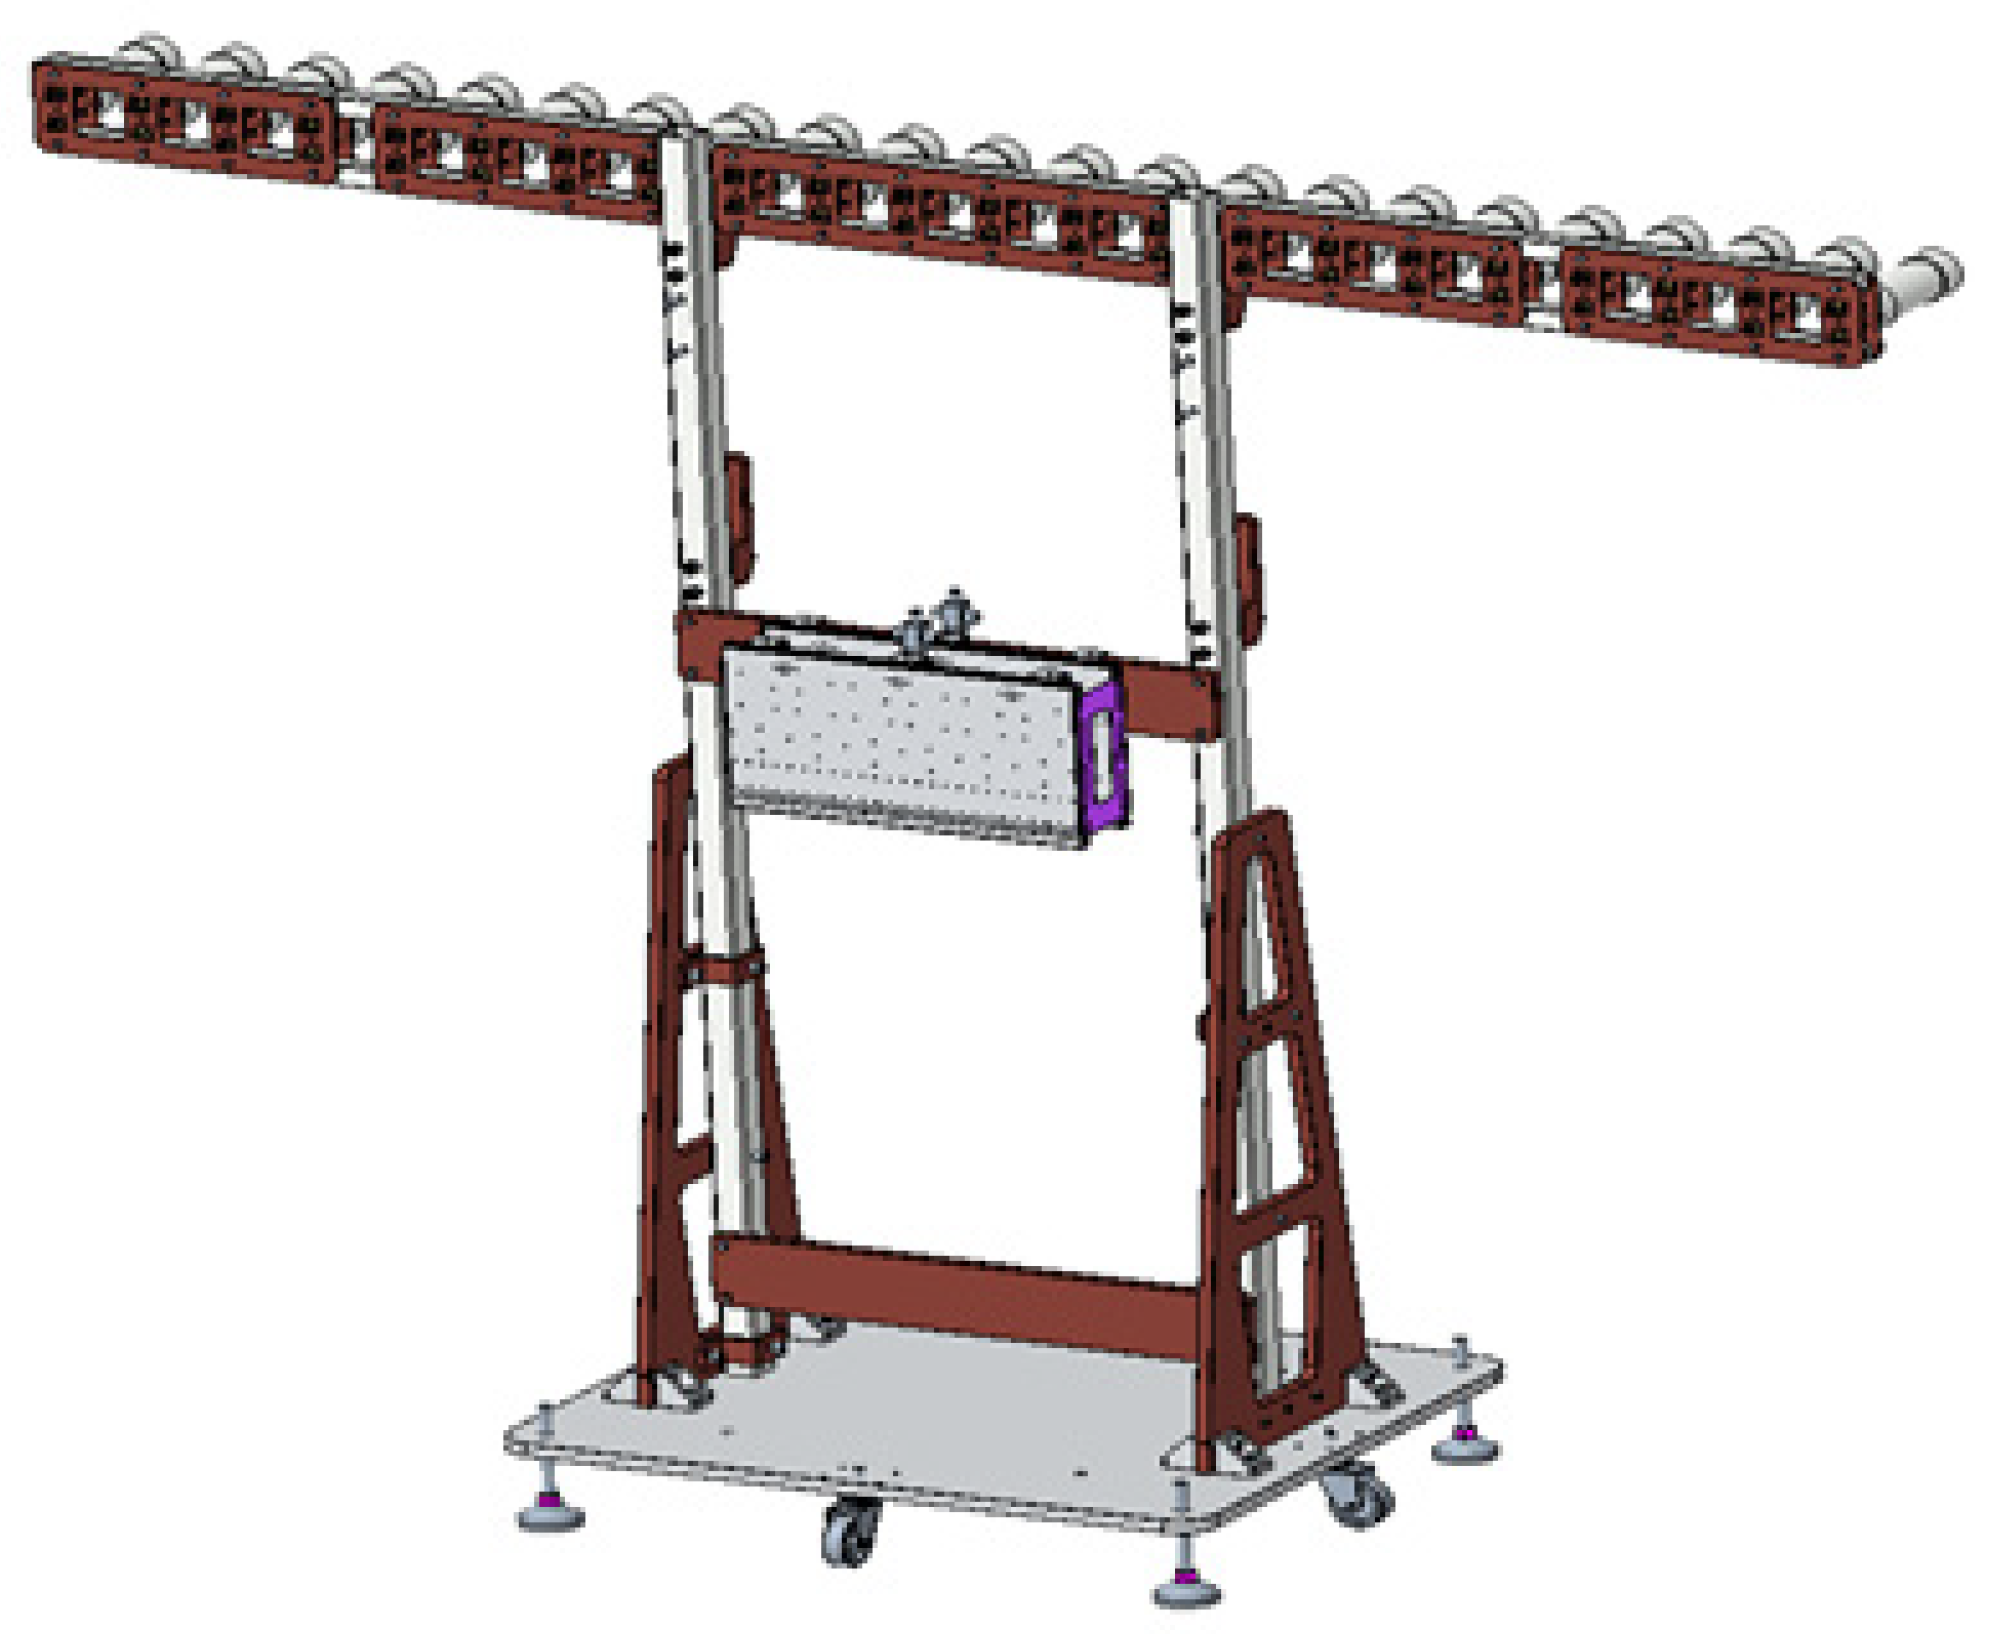
An antenna bracket with flexible adjustment of position and levelness was designed for validation. As shown in Figure 6, the antenna array, backplane, and feed network were all fixed on the bracket.

2.3. Plane Wave Excitation Optimization Algorithm

In the previous section, we designed an ultra-wideband antenna based on the Vivaldi antenna and used it as an antenna unit to construct a PWG for a one-dimensional linear array. By adjusting the amplitude and phase excitation of each unit, an approximate plane wave can be generated in the region in front of the PWG. To determine the optimal amplitude and phase excitation, in this paper, the genetic algorithm is used to find the optimal excitation coefficients. The excitation coefficients can be determined by the mouth surface field cone sharpening function, expressed as a polynomial distribution function, and the excitation values are discretized using the polynomial distribution function. The polynomial distribution coefficients can be expressed as:
f _ t a p e r = [ 1 + ( α | x | D ) β ] γ
where D is the general rectangular mouth size and α , β , γ are three adjustable parameter variables.
In order to alleviate the high cost of broadband for the amplitude phase modulation network and the difficult problem of optimization, in this paper, we propose dividing the broadband into sub-bands. Specifically, the original 0.7–4 GHz broad band is divided into three sub-bands: 0.7–2 GHz, 2–3 GHz, 3–4 GHz. The optimization of the amplitude and phase excitation and the testing of the base station in the working band are carried out in the sub-bands. Additionally, excitation optimization within the sub-bands takes the form of the joint optimization of multiple frequency points.
The genetic algorithm is a randomized search method that simulates the laws of evolution in the biological world, featuring direct operation of structural objects. Without the limitation of derivation and function continuity, the algorithm has inherent implicit parallelism and better capability for global optimization [15]. Taking a sub-band as an example, our purpose is to find the optimal tapering function parameters by genetic algorithm to optimize the amplitude A n m and phase ϕ n m , with ranges of [0, 1] and [0, 2π], respectively. The objective function is:
F = minimize ( i = 1 N F i )
where minimize ( ) represents the minimum value of the objective function to be optimized. F i represents the evaluation function calculated for the i-th frequency point selected in the sub-band, which can be formulated as:
F i = f ( A , ϕ ) = a f 1 + b f 2 + c f 3
f 1 = | max ( E x a m p ) min ( E x a m p ) |
f 2 = | max ( E x p h a s e ) min ( E x p h a s e ) |
f 3 = | E x a m p c A |
where f 1 represents the difference between the maximum and minimum amplitude within the aperture, aiming to minimize the amplitude fluctuation of quasi-plane wave; f 2 represents the difference between the maximum and minimum phase values, aiming to minimize the phase fluctuation of quasi plane wave; f 3 represents difference between the maximum amplitude and the amplitude peak value of uniformly distributed array under the same conditions, aiming to concentrate the energy in the required aperture area [16]. E x a m p c represents the amplitude value of the aperture center point, and A represents the amplitude peak value of the uniformly distributed array. { a , b , c } are the weight relations among the three functions to balance the amplitude and phase fluctuation of quasi plane wave. In this paper, we chose three frequency points in the sub-band. These are the minimum, maximum and center frequencies for PWG operation.
The amplitude and phase fluctuation of our designed PWG were 1 dB and 10°. The coefficient a and b effectively balance the amplitude and phase fluctuation of the PWG. Meanwhile, f 1 and f 3 ensure no distorted reduction of energy around the center point and the concentration of energy in the target area, while the energy drops rapidly beyond the target area. The multi-frequency optimization approach also allows the PWG to meet the requirements of a wide operating band.

3. Simulation Results and Experiments

In the above, we introduced the ultra-wideband PWG proposed in this paper in terms of the antenna unit, the PWG linear array configuration, and the amplitude phase excitation optimization. In order to verify its effectiveness, the results of its placement and experiments are discussed next.

3.1. Low-Frequency Ultra-Wideband Vivaldi Antenna Simulation

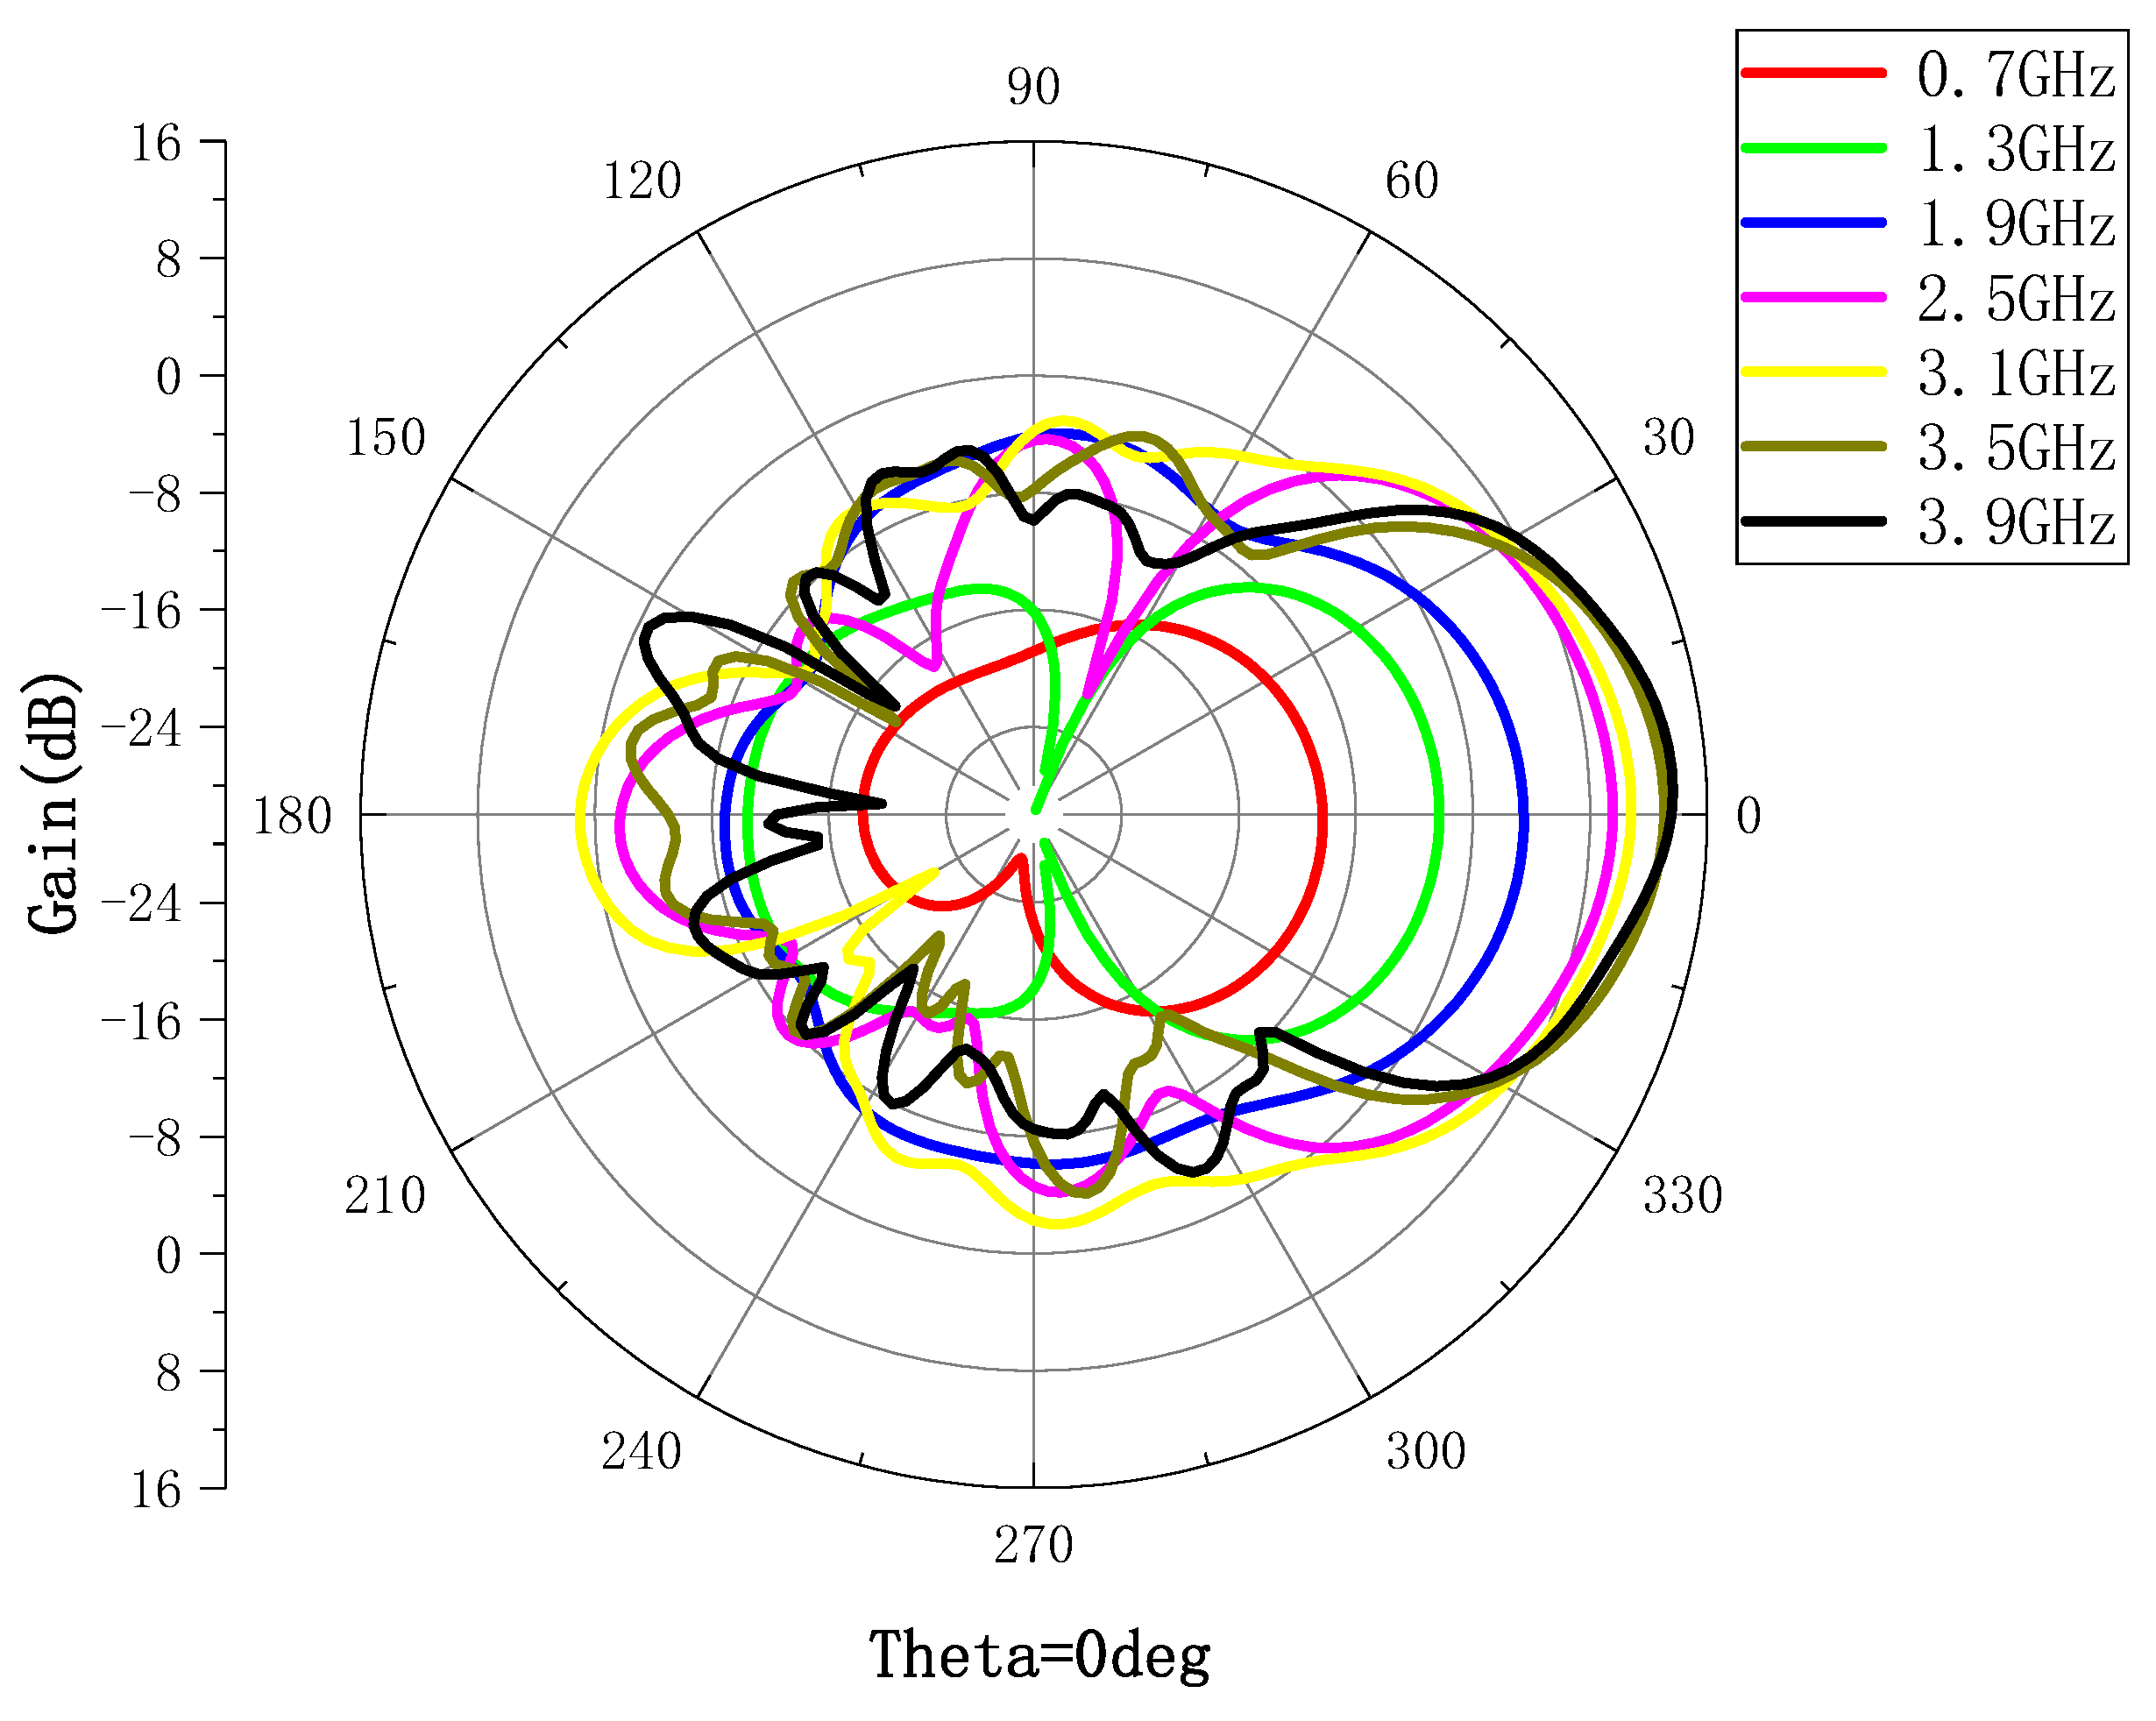
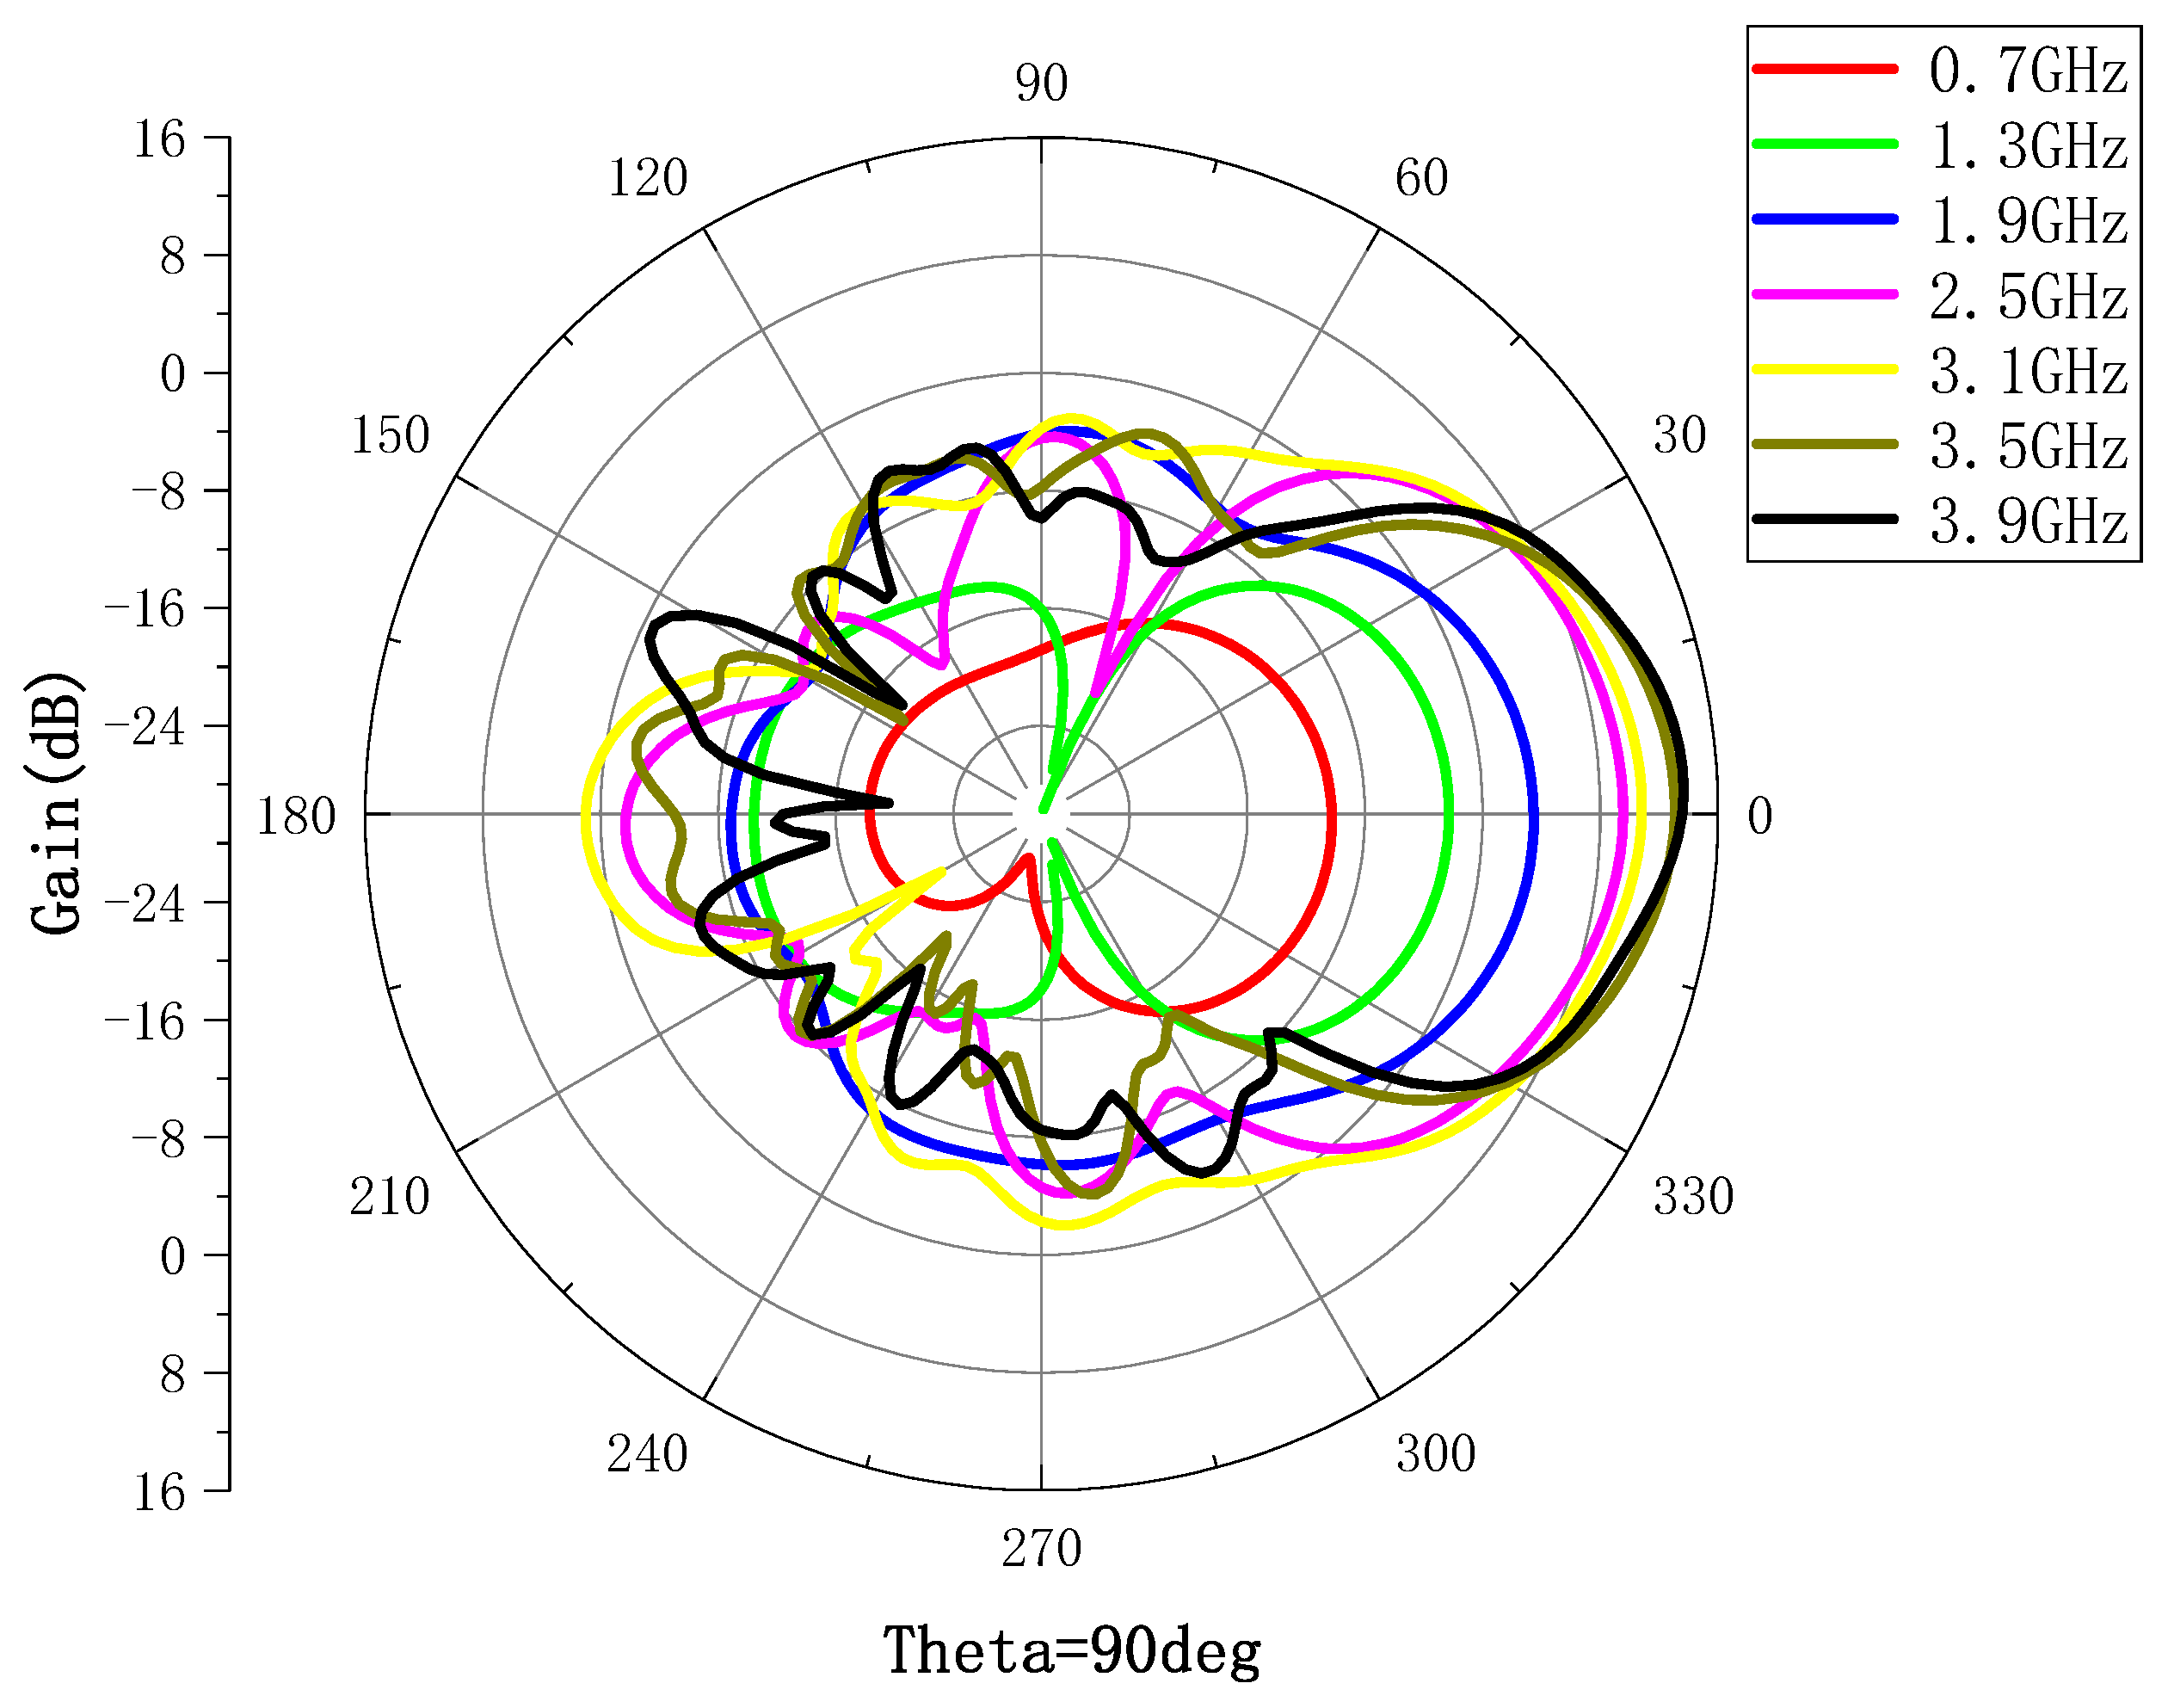
A low-frequency ultra-wideband Vivaldi antenna unit was developed by optimizing the design of the Vivaldi antenna’s slotting, impedance loading, and wideband feed structure. In order to verify the performance of this antenna unit, it was simulated and verified using CST to model and simulate it, and the simulation results are shown in Figure 7 and Figure 8. Figure 7 shows the surface current distribution at different operating frequencies, from which it can be seen that the surface current of the antenna unit is mainly distributed along the slot, and the radiation current on the antenna surface is enhanced. Figure 8 presents the radiation pattern obtained from the simulation of the designed antenna. From the radiation pattern, it can be seen that the pattern distortion of the designed antenna unit is controlled, and the side flap of the pattern is smaller.
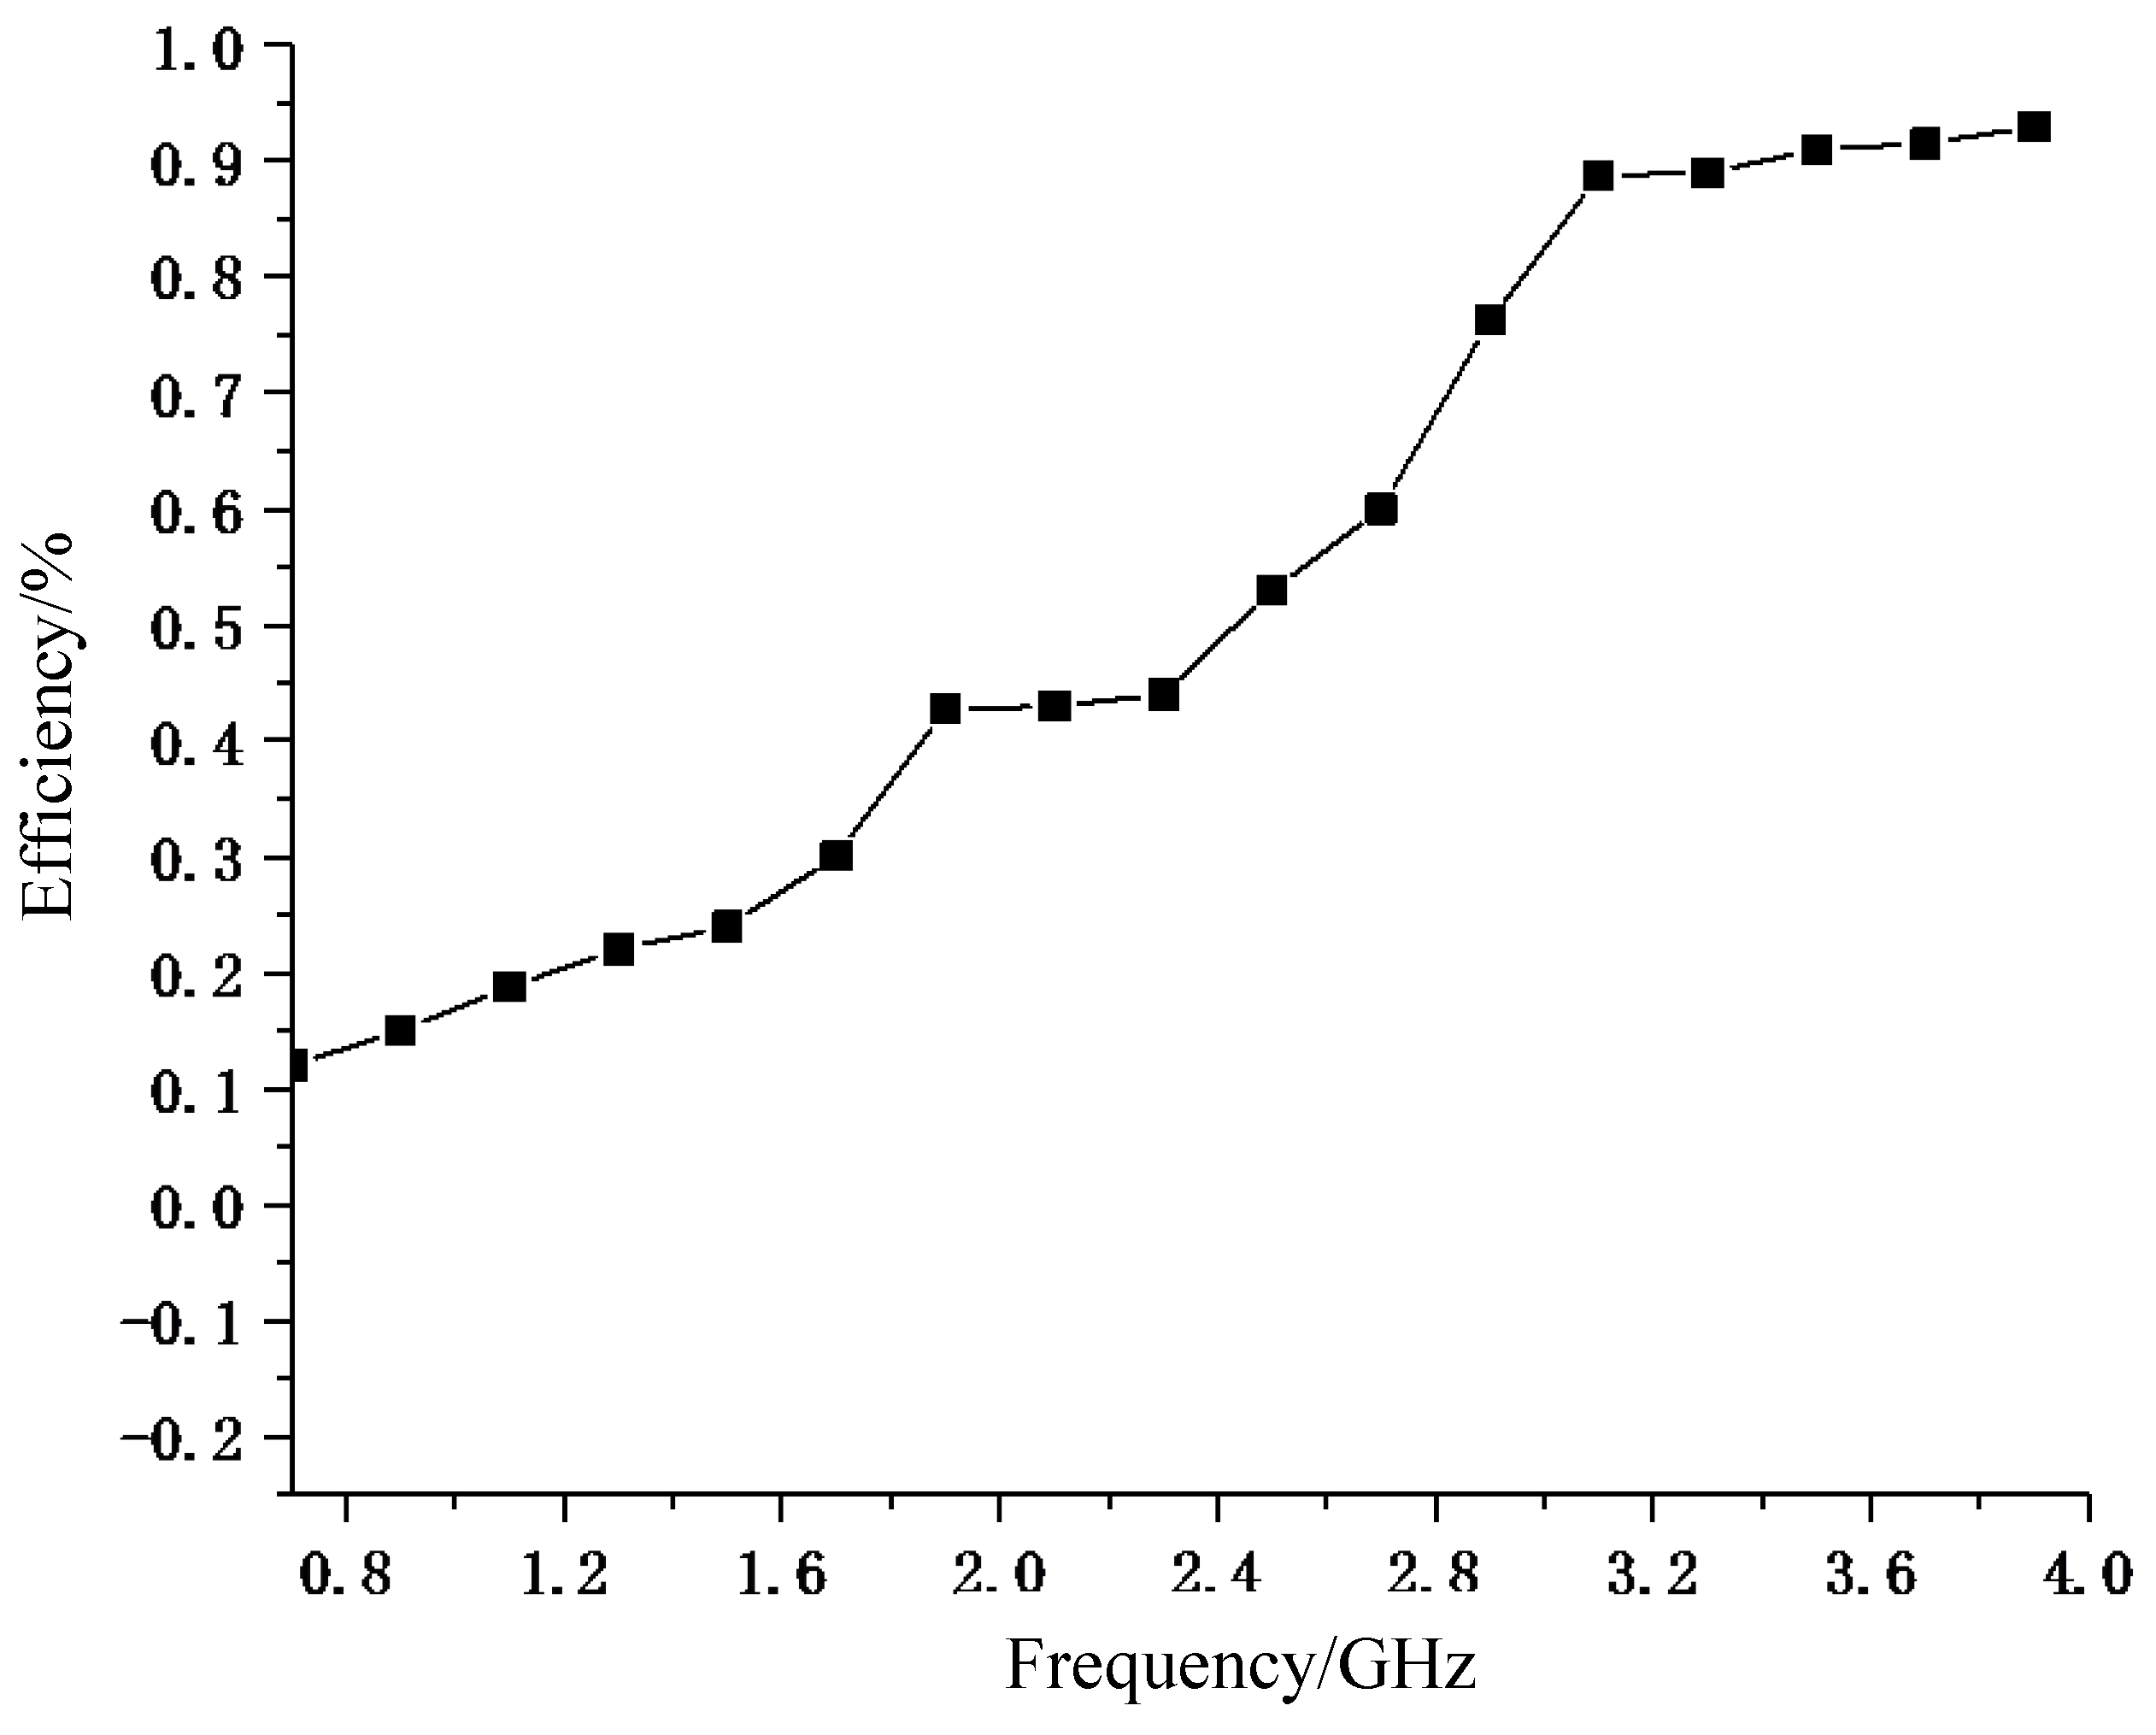
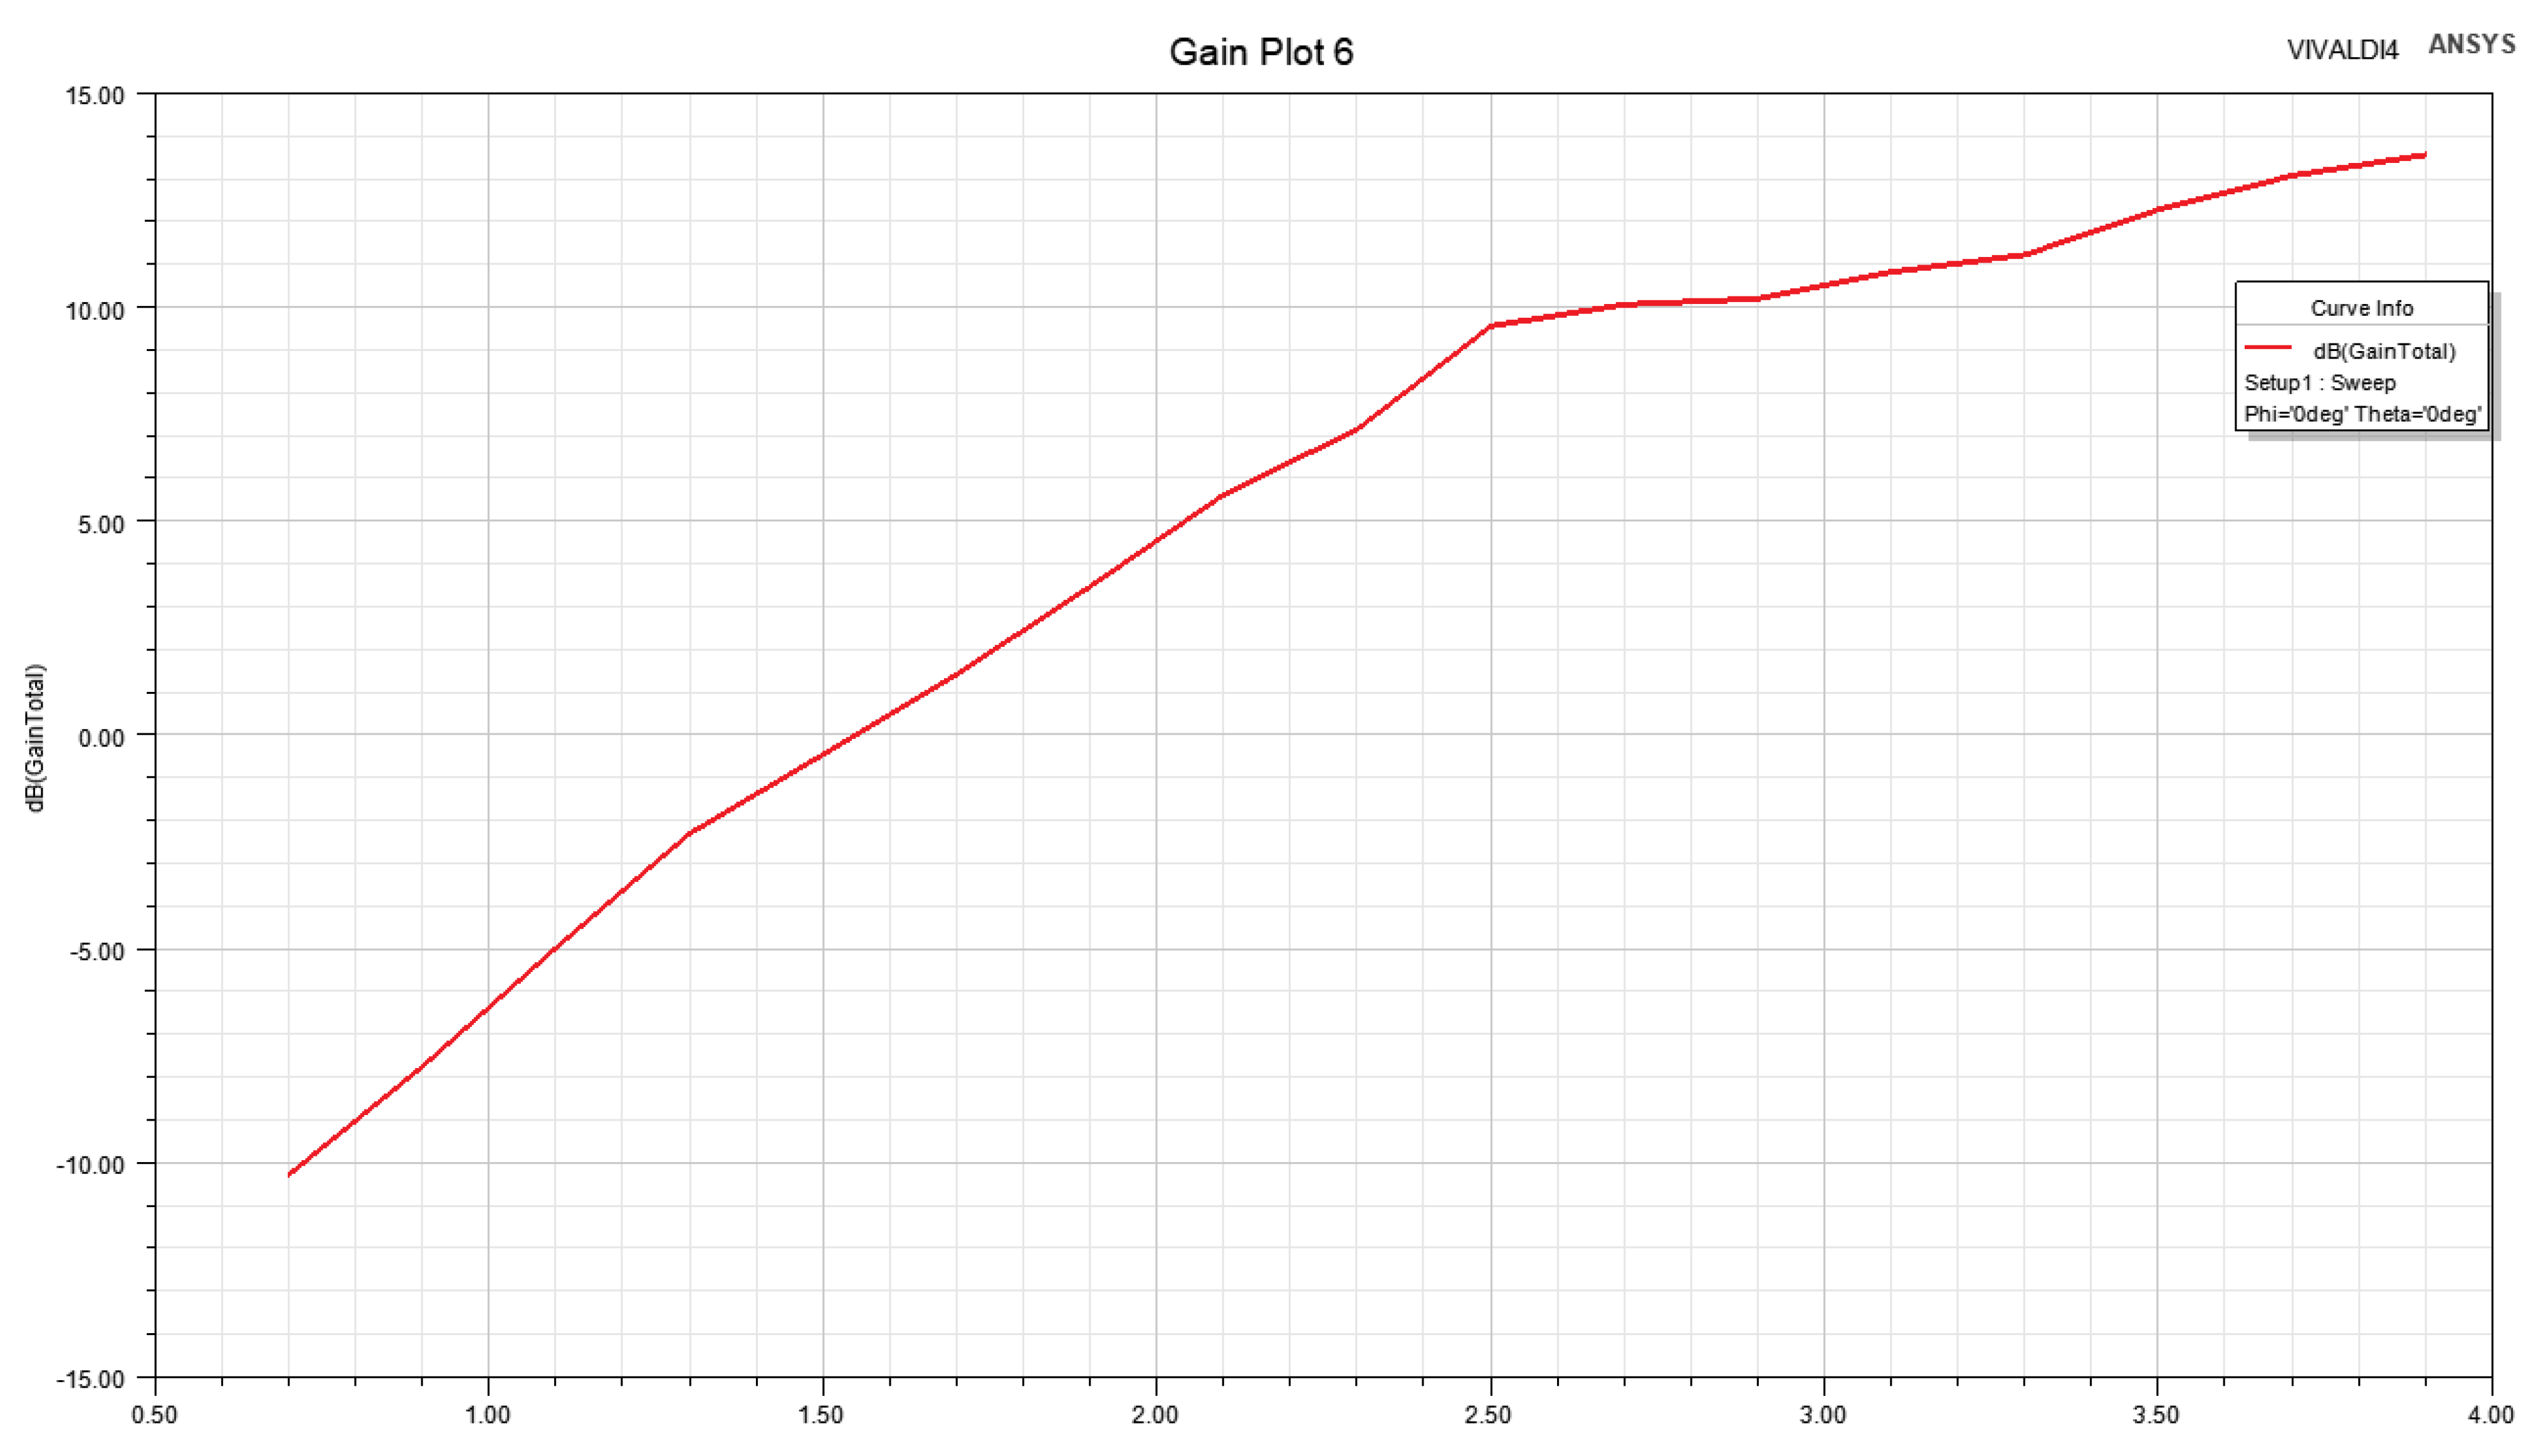
The radiation efficiency and gain of the antenna are shown in Figure 9 and Figure 10. The radiation efficiency is above 45% at 2 GHz and reaches up to 90% at 3.2 GHz. The peak of the gain of the antenna can reach 13.5 dB.

3.2. Antenna Array Excitation Optimization and Simulation Results

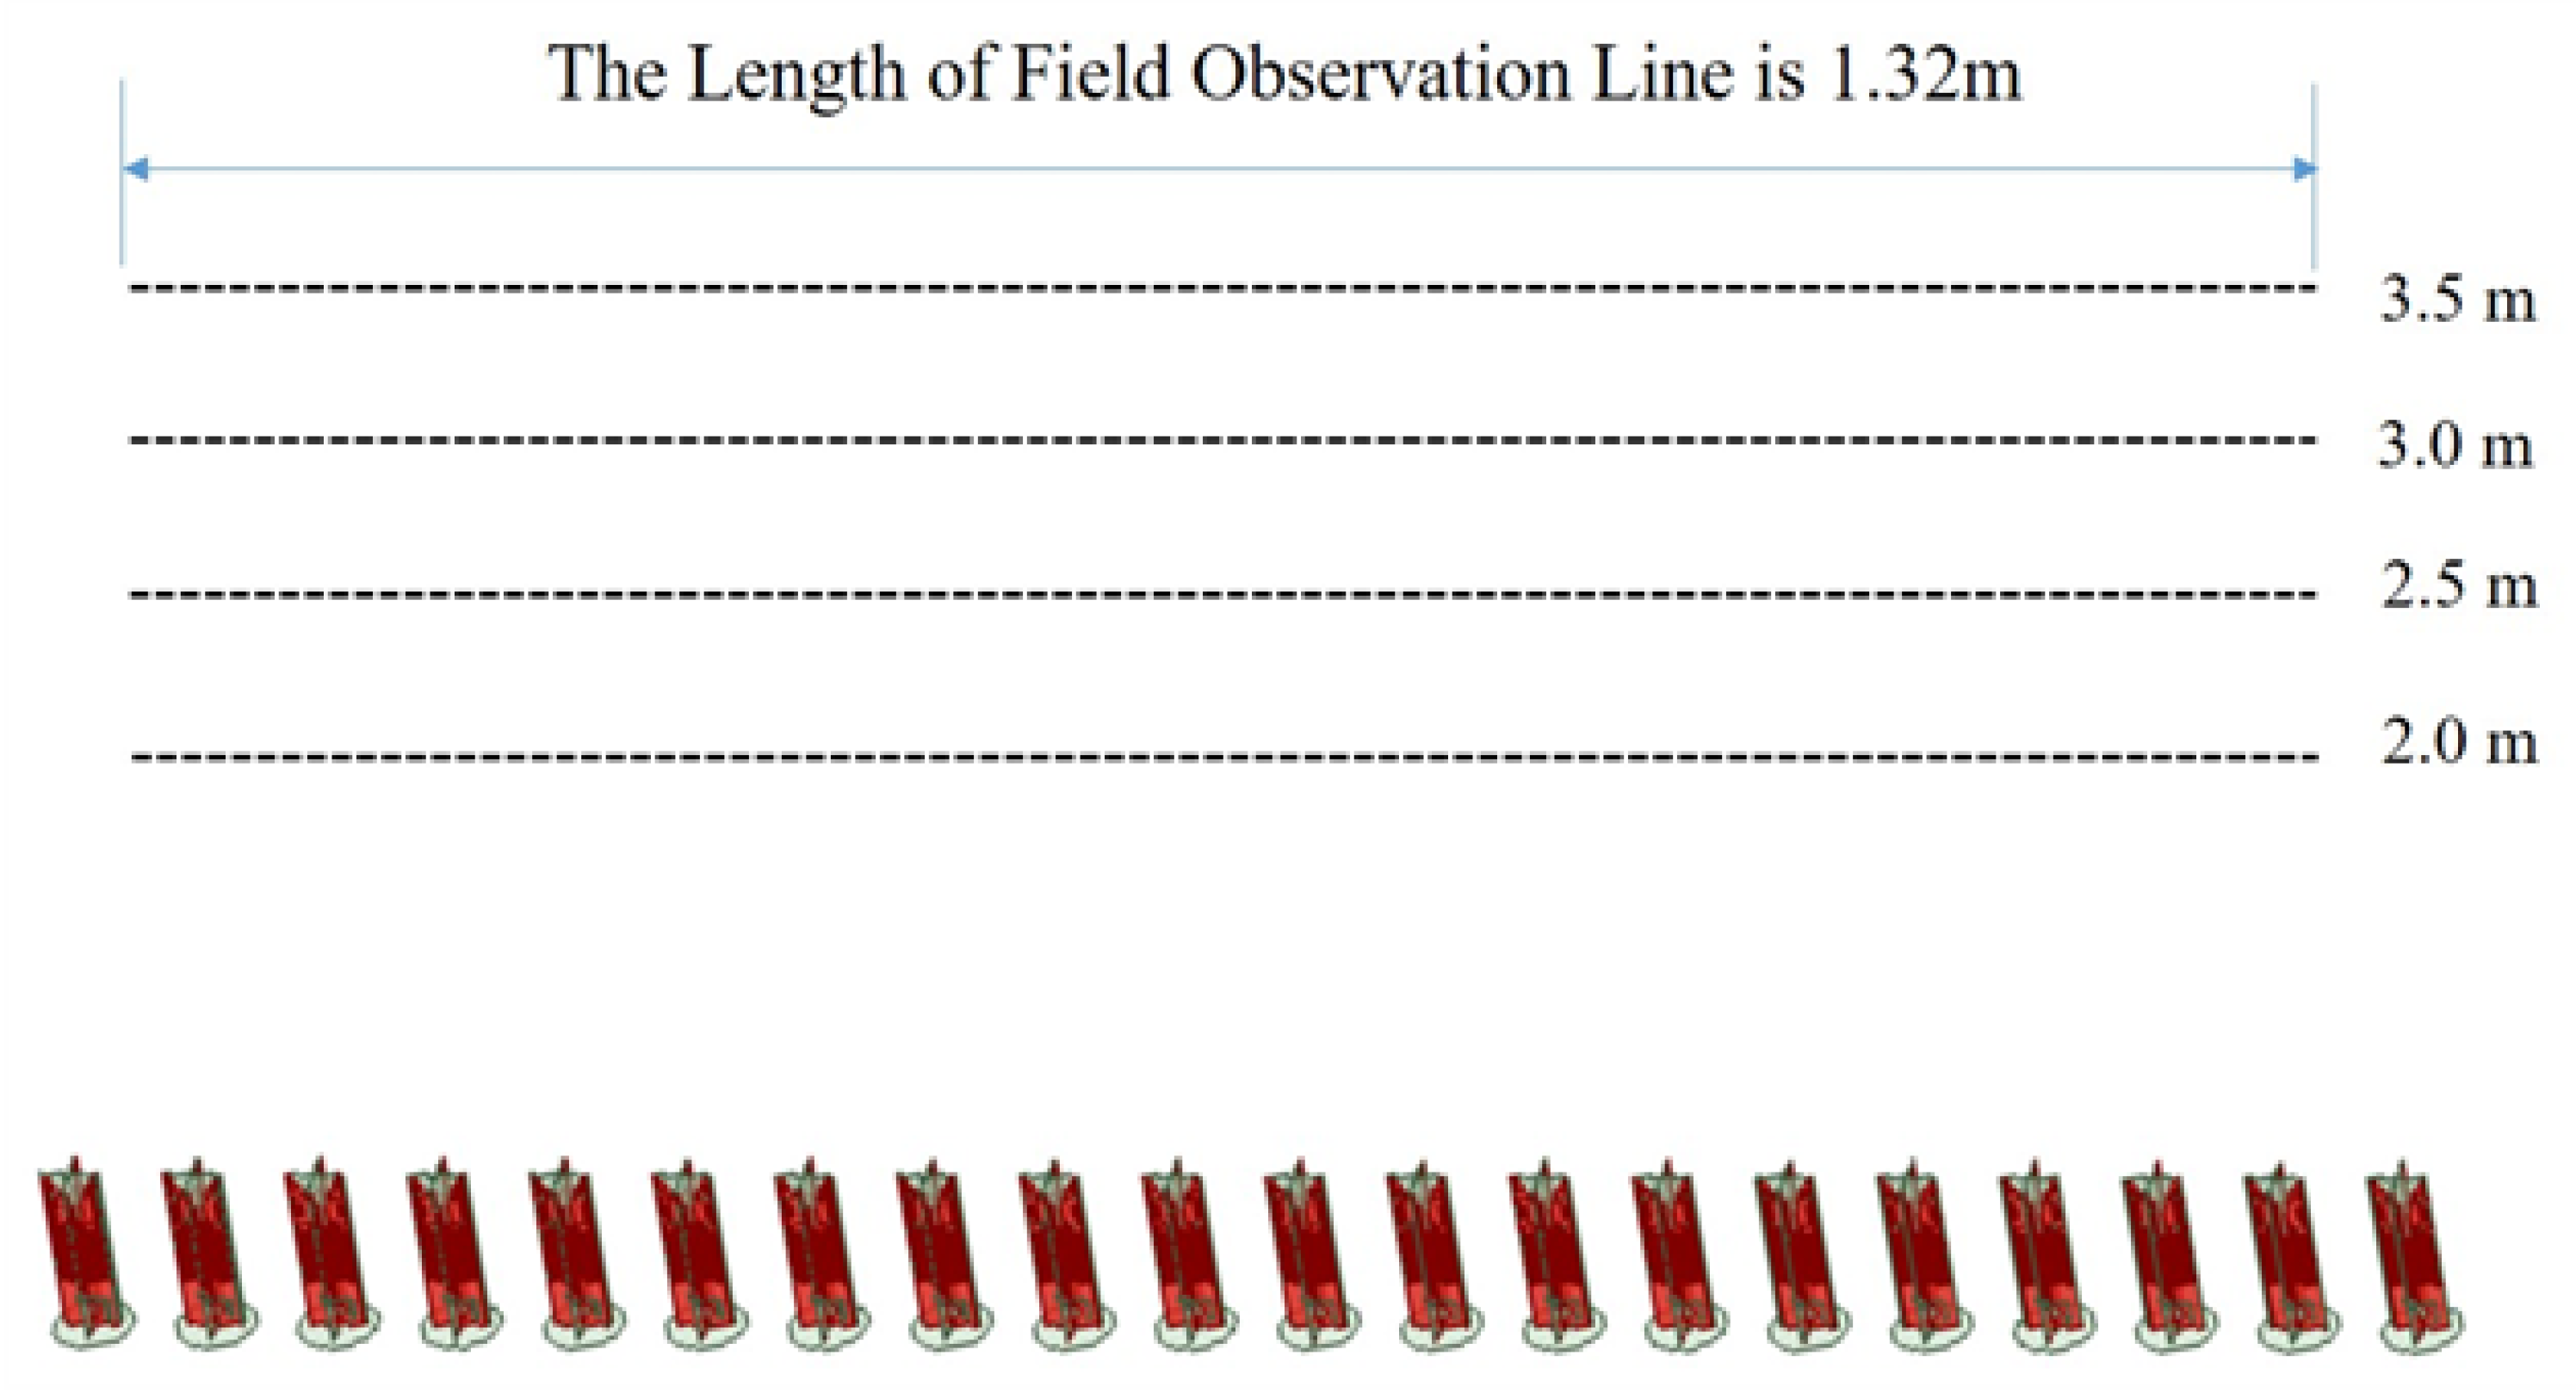
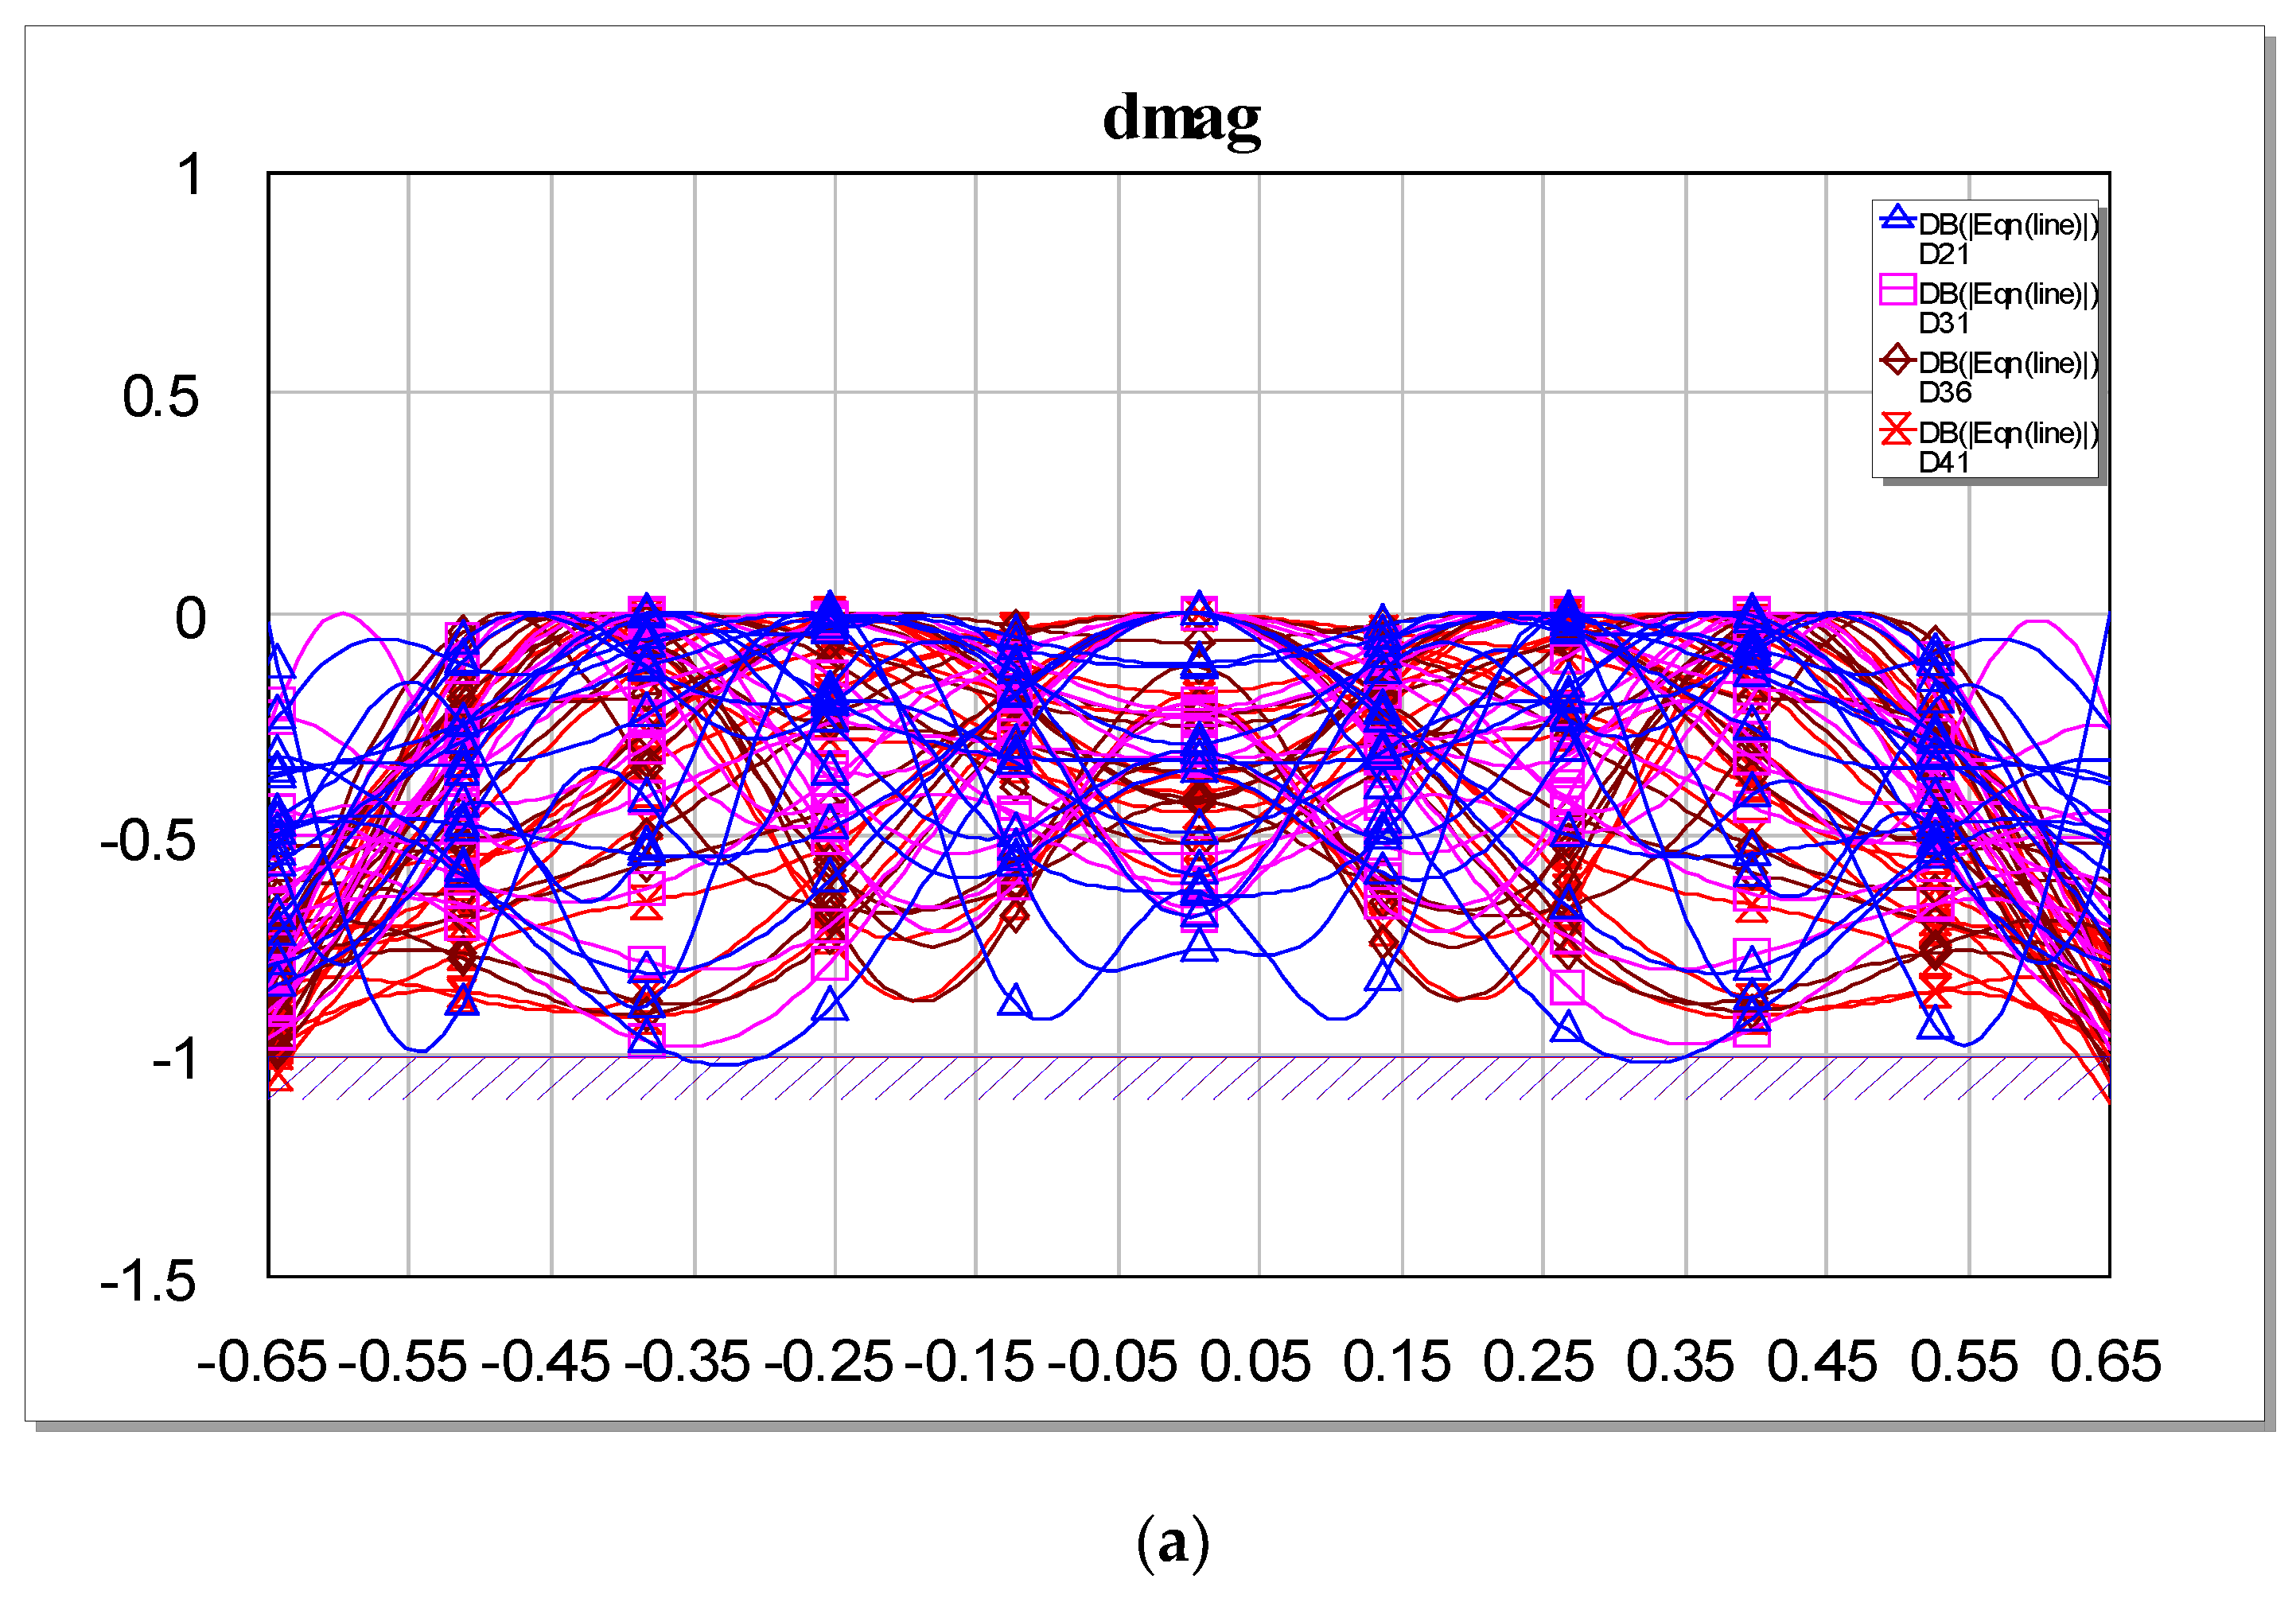
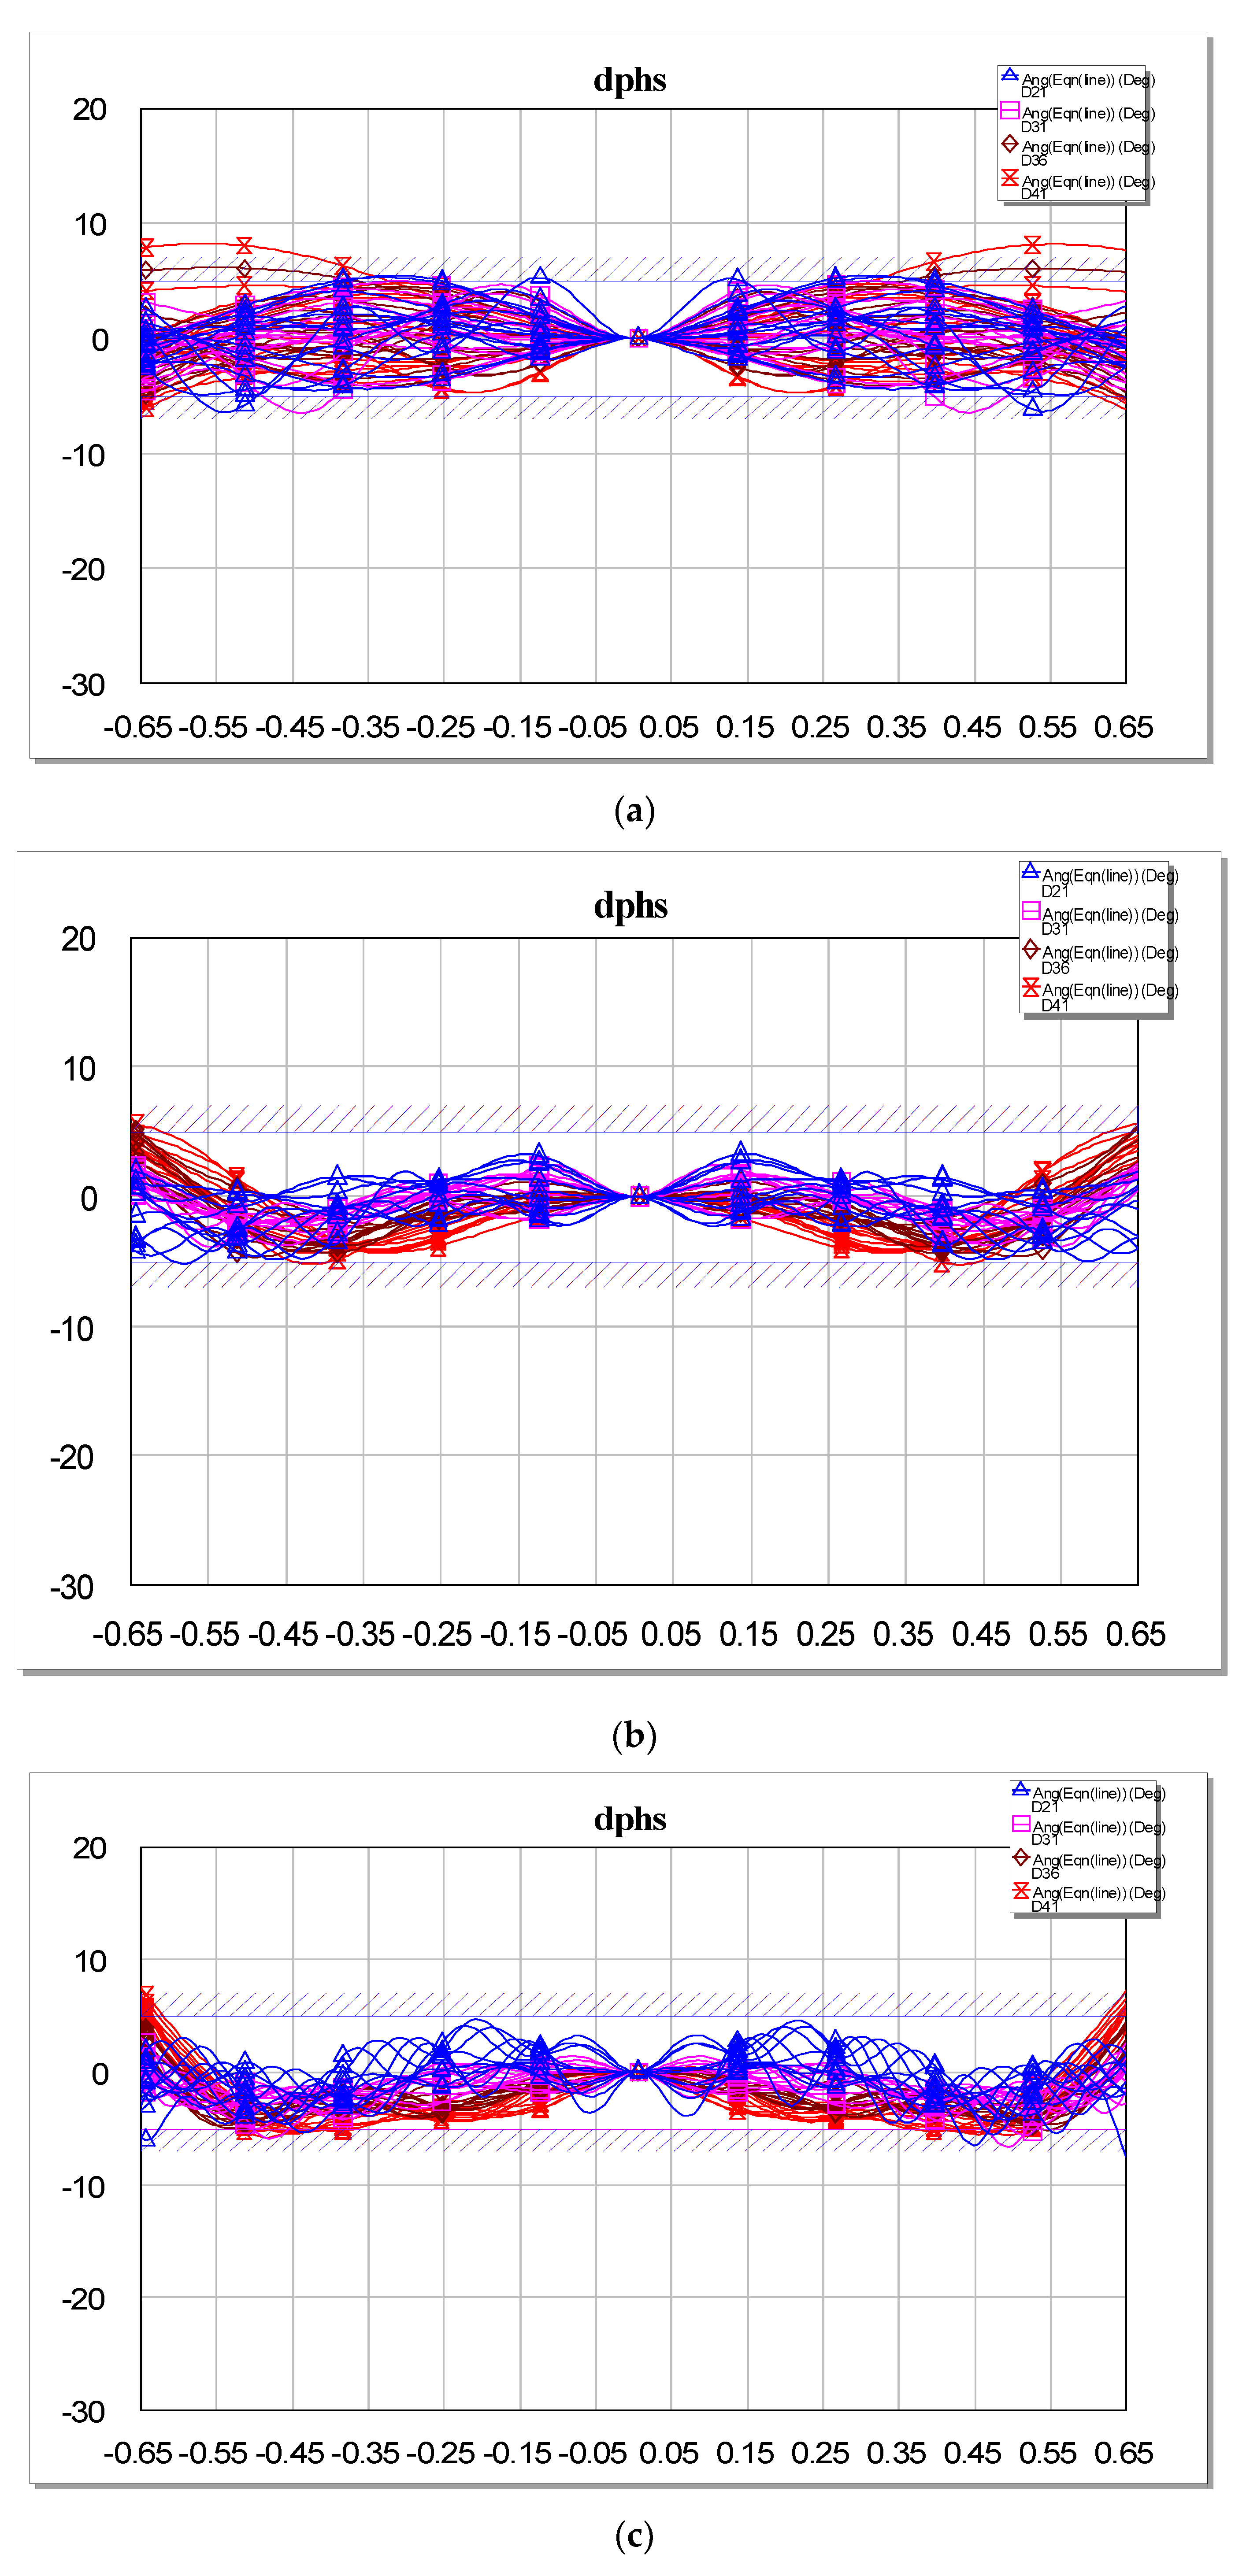
In order to verify the effectiveness of the PWG for generating quasi-plane waves, the PWG was simulated according to the parameters of length and number of units described above, and the quality of the generated plane waves was verified by selecting a suitable observation area. Figure 11 presents a schematic diagram of the position of the set observation area relative to the PWG. The field observation line was set before the antenna array, at distances between 2.0 m and 3.5 m. According to the requirements of the base station antenna under test, the length of the field observation line was 1.32 m, that is, the size of the target quiet zone was 1.32 m. The optimal excitation weight of the antenna array was calculated using rapid iteration of the genetic algorithm, and the quiet zone performance of the plane wave synthesized in the target area was observed on the basis of simulation. In Figure 12 and Figure 13, the simulation results are presented for each of the three sub-bands. As the target distance was 2.75 m from the antenna array aperture within the range of ±0.75 m, the amplitude and phase distribution fluctuation (peak–peak value) of the 1.32-m-long quiet zone was less than 1.0 dB and less than 10°, respectively, that is, the area range of the plane wave quiet zone was 1.5 m (length) × 1.32 m (width).

3.3. Validation of Low-Frequency Broadband Plane Wave Array

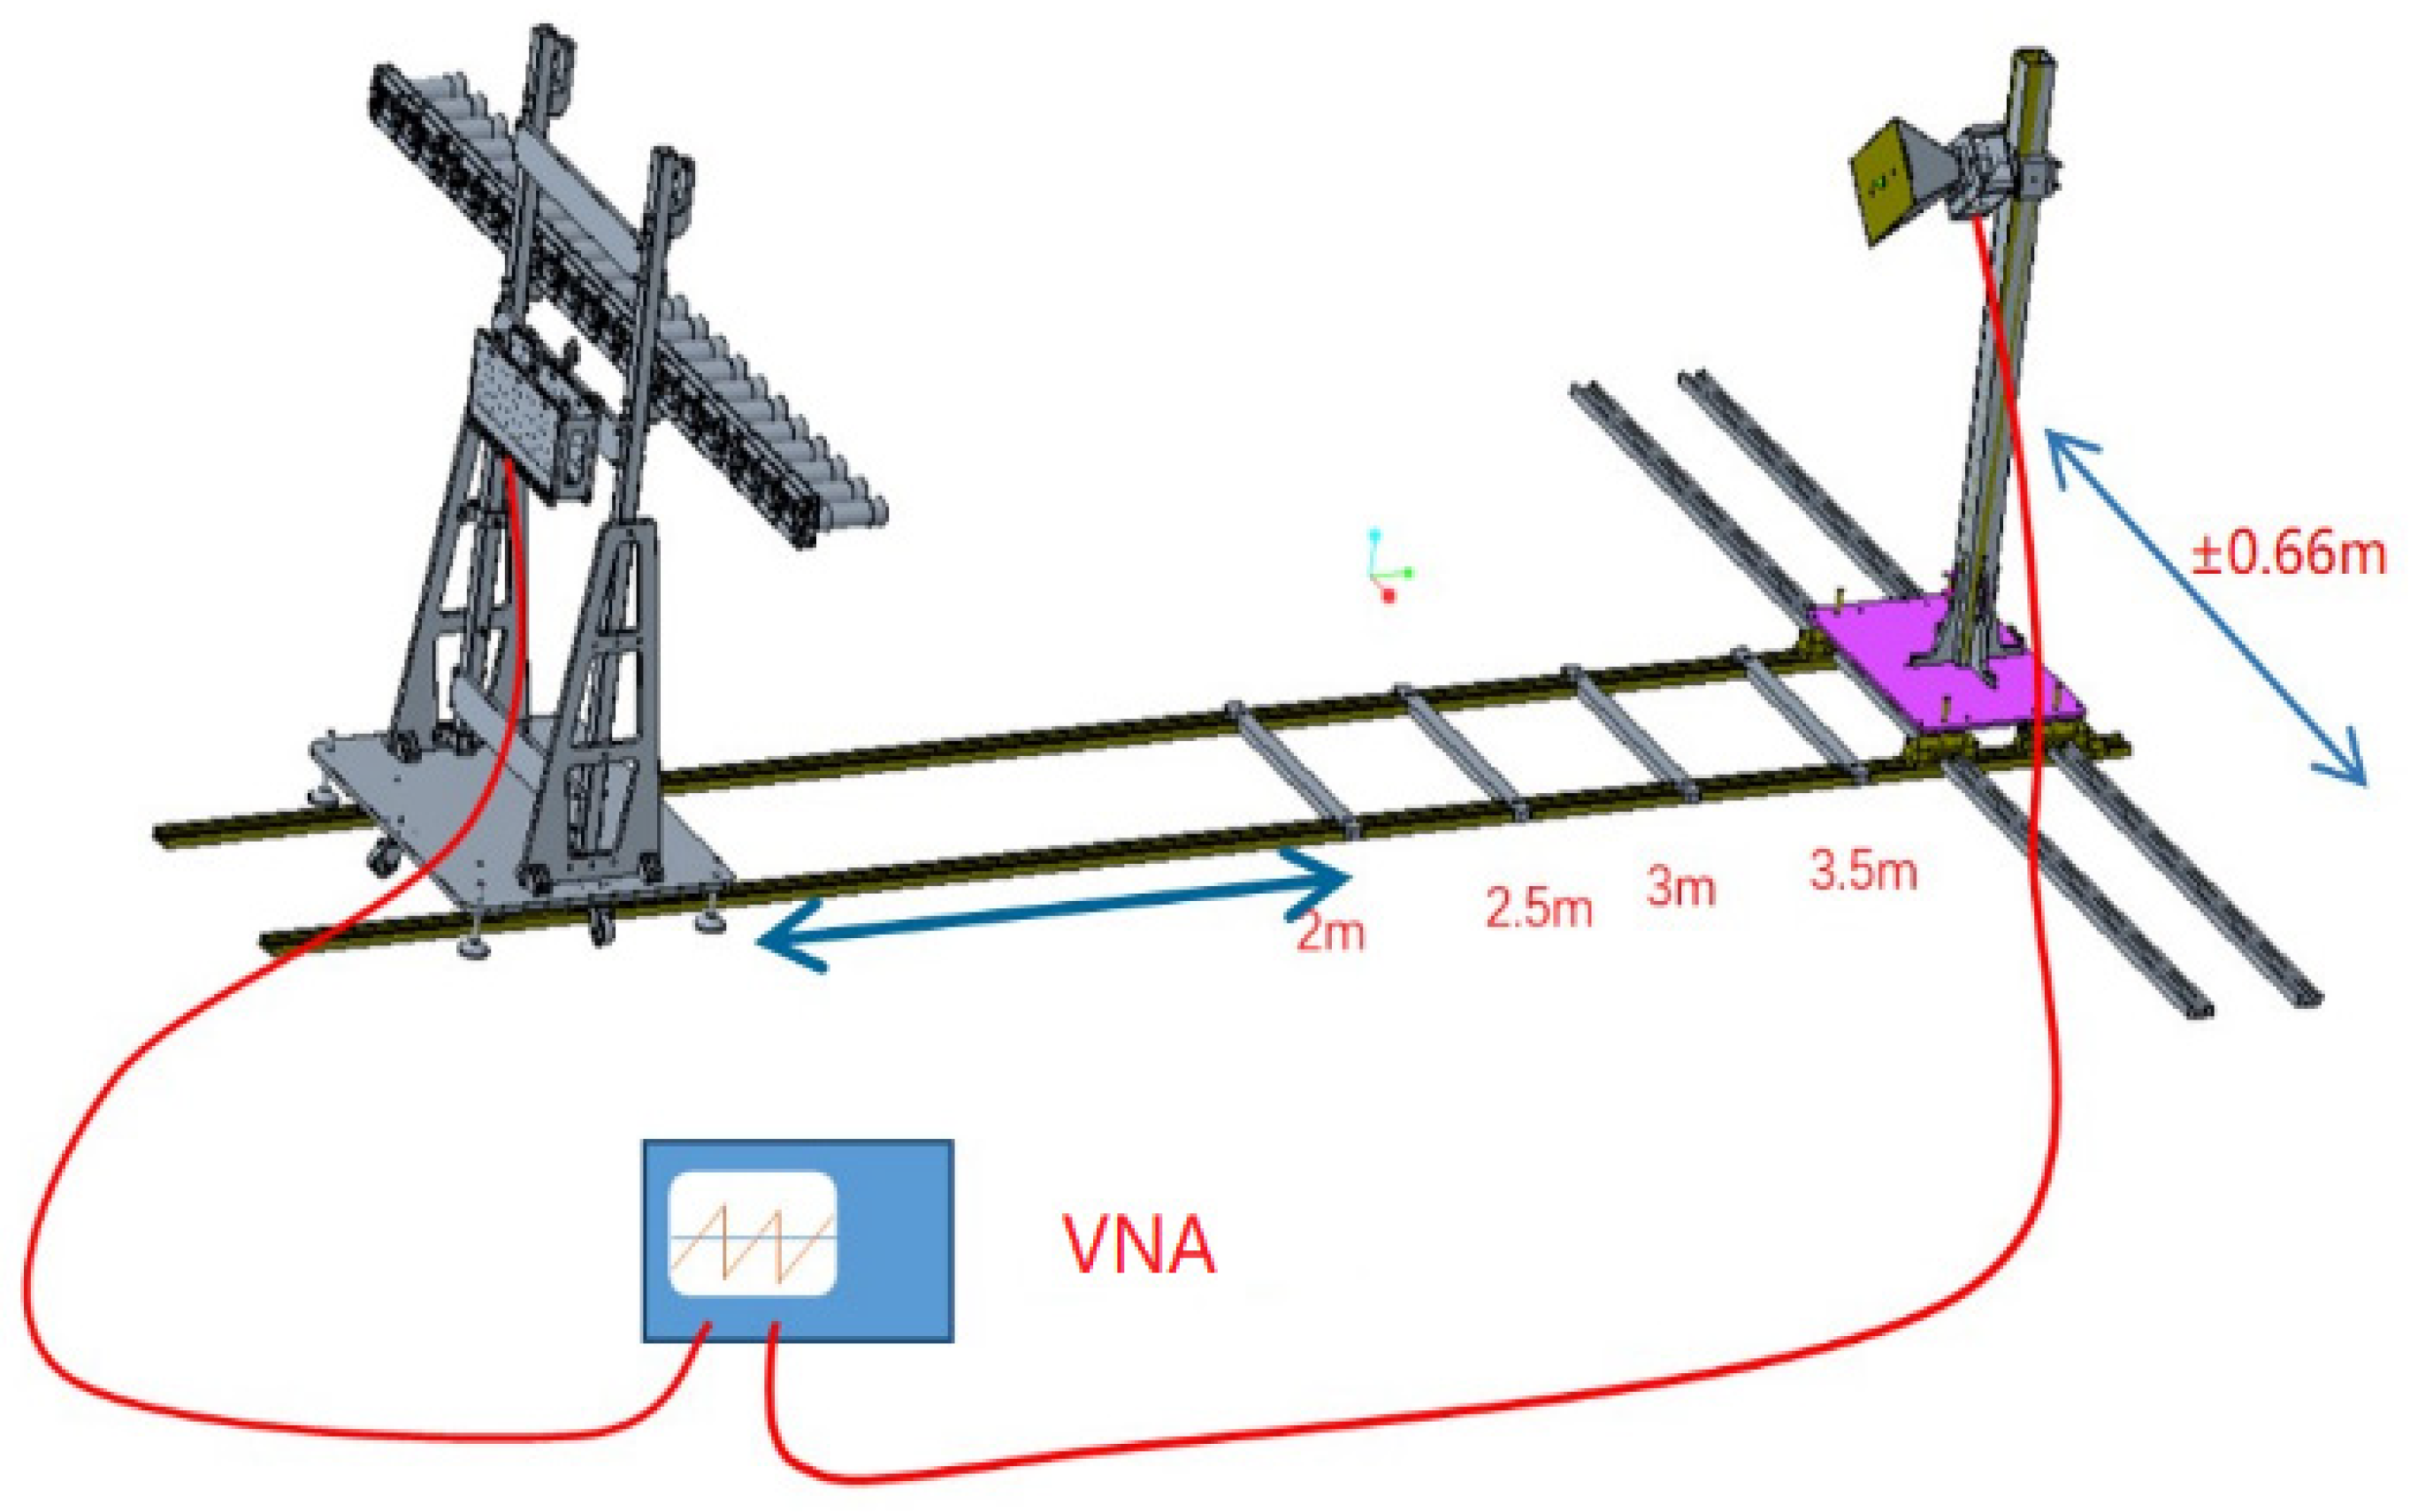
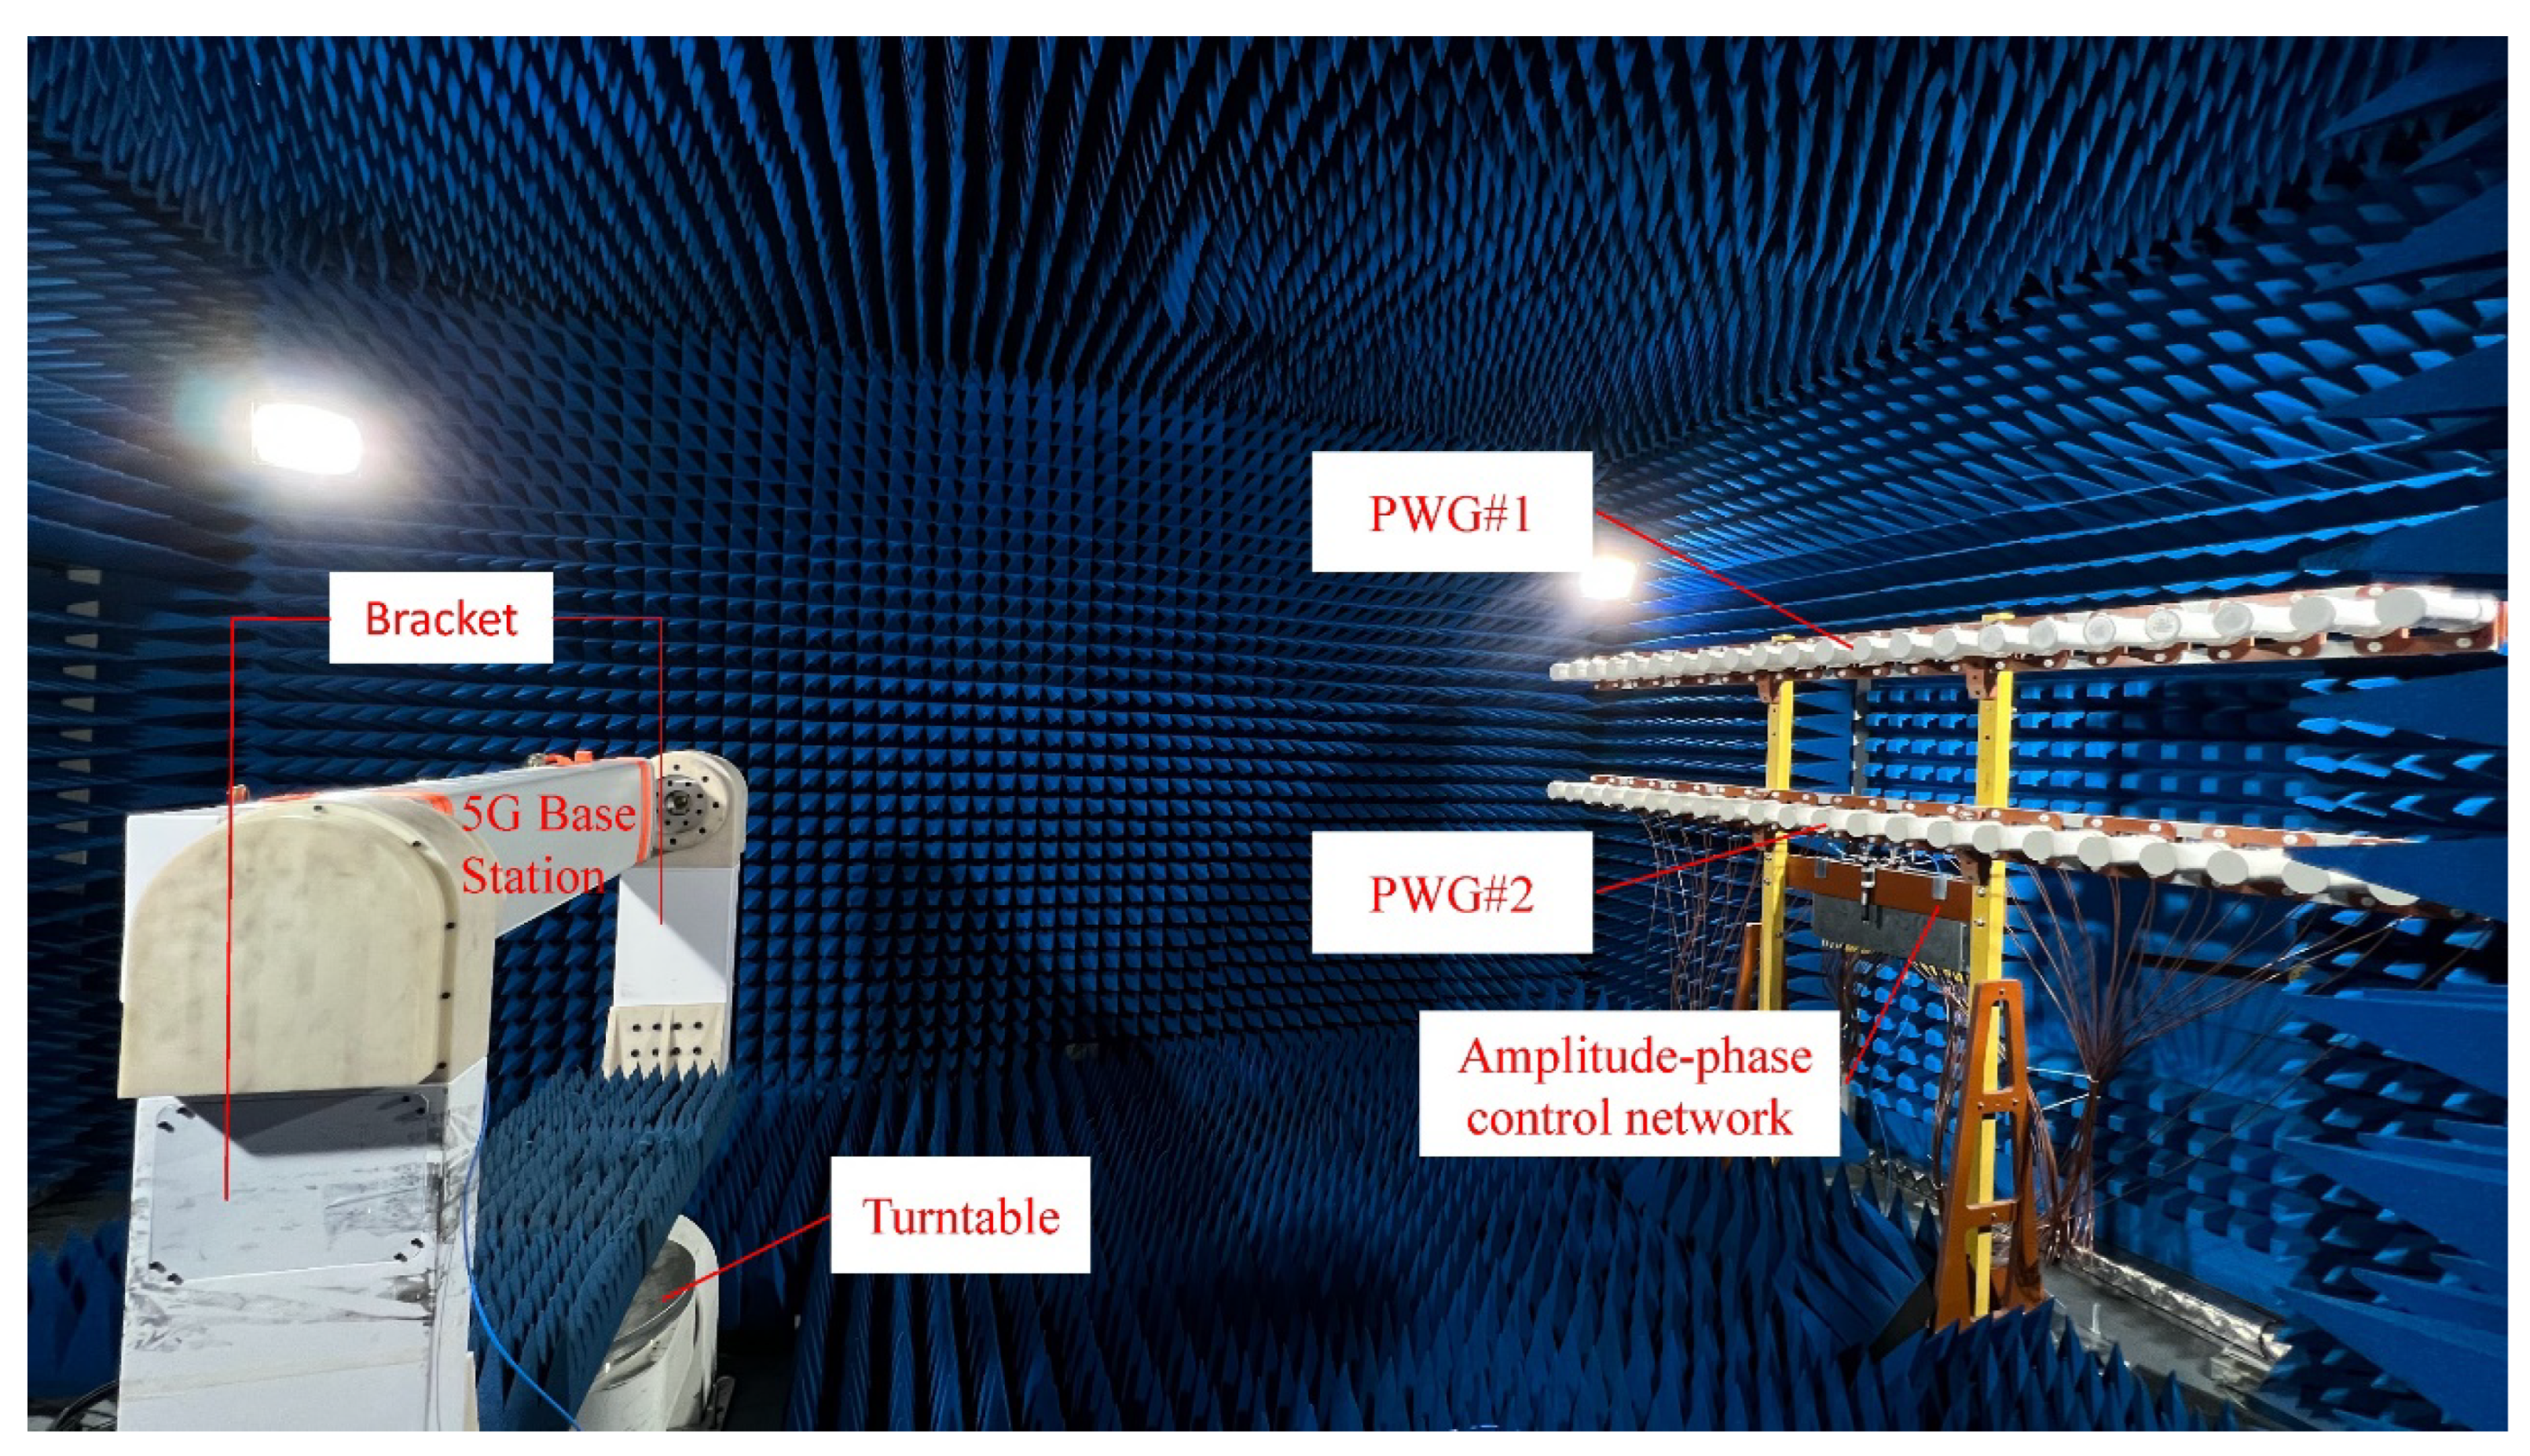
According to the target distance and length range of the plane wave quiet zone, a guide rail and test horn bracket were made, as shown in Figure 14. The test horn was moved along the rail to distances of 2.0 m, 2.5 m, 3.0 m and 3.5 m away from the antenna array aperture within the range of ±0.66 m, and data sampling was conducted per 0.03 m, with 45 sampling points at each position. By testing and calculating the amplitude and phase fluctuation of the 45 sampling points at each position, it was possible to compare and validate the performance of the plane wave quiet zone generated by the PWG in the target area. Figure 15 displays the implemented test system constructed within the darkroom, which provides a detailed schematic of the setup used in our experiments.
The performance validation results of the PWG’s plane wave synthesis in the target area are shown in Table 2. In the frequency range from 700 MHz to 2.0 GHz, the amplitude distribution fluctuations at most positions were between 1.0 and 1.35 dB, with the maximum value being 1.48 dB. The phase distribution fluctuations were between 10 and 13°, and the maximum value was 15.3°. In the frequency range from 2.0 GHz to 3.0 GHz, the amplitude distribution fluctuations at most positions were between 0.91 and 1.5 dB, and the maximum value was 1.63 dB. The phase distribution fluctuations were between 10 and 13°, and the maximum value was 14.65°. In the frequency range from 3.0 GHz to 4.0 GHz, the amplitude distribution fluctuations at most positions were between 1.3 and 1.5 dB, and the maximum value was 1.6 dB. The phase distribution fluctuations were between 10 and 12°, and the maximum value was 14.5°. From the results in the table, it can be found that at low frequencies, the generated quiet zone was limited by the insufficient electrical size of the plane wave generator unit, while the use of broadband feeds did not allow fine control of the amplitude phase modulation network. In the high-frequency range, inadequate sampling resulted in poor static zone performance. In conclusion, in comparison, the performance was best at the intermediate frequencies. We condluded that at the position 2.75 m away from the antenna array aperture, within a range of ±0.75 m, the amplitude distribution fluctuation (peak–peak value) of the 1.32 m quiet zone was less than 1.5 dB, and the phase distribution fluctuation (peak–peak value) was less than 15°, thus meeting the conditions required for the far-field antenna testing.

3.4. Accuracy Evaluation of 5G Base Station Antenna Measurements Using PWG

To verify the performance of the designed PWG for 5G base station testing, we built a 5G test system, as shown in Figure 16. We used two ultra-broadband PWGs operating at different frequencies. A turntable was placed 3.16 m away from the PWG, and the 5G base station was fixed on the bracket of the turntable. The rotation angle of the turntable and the bracket was controlled using a motor, allowing the pattern to be measured at θ and ϕ .
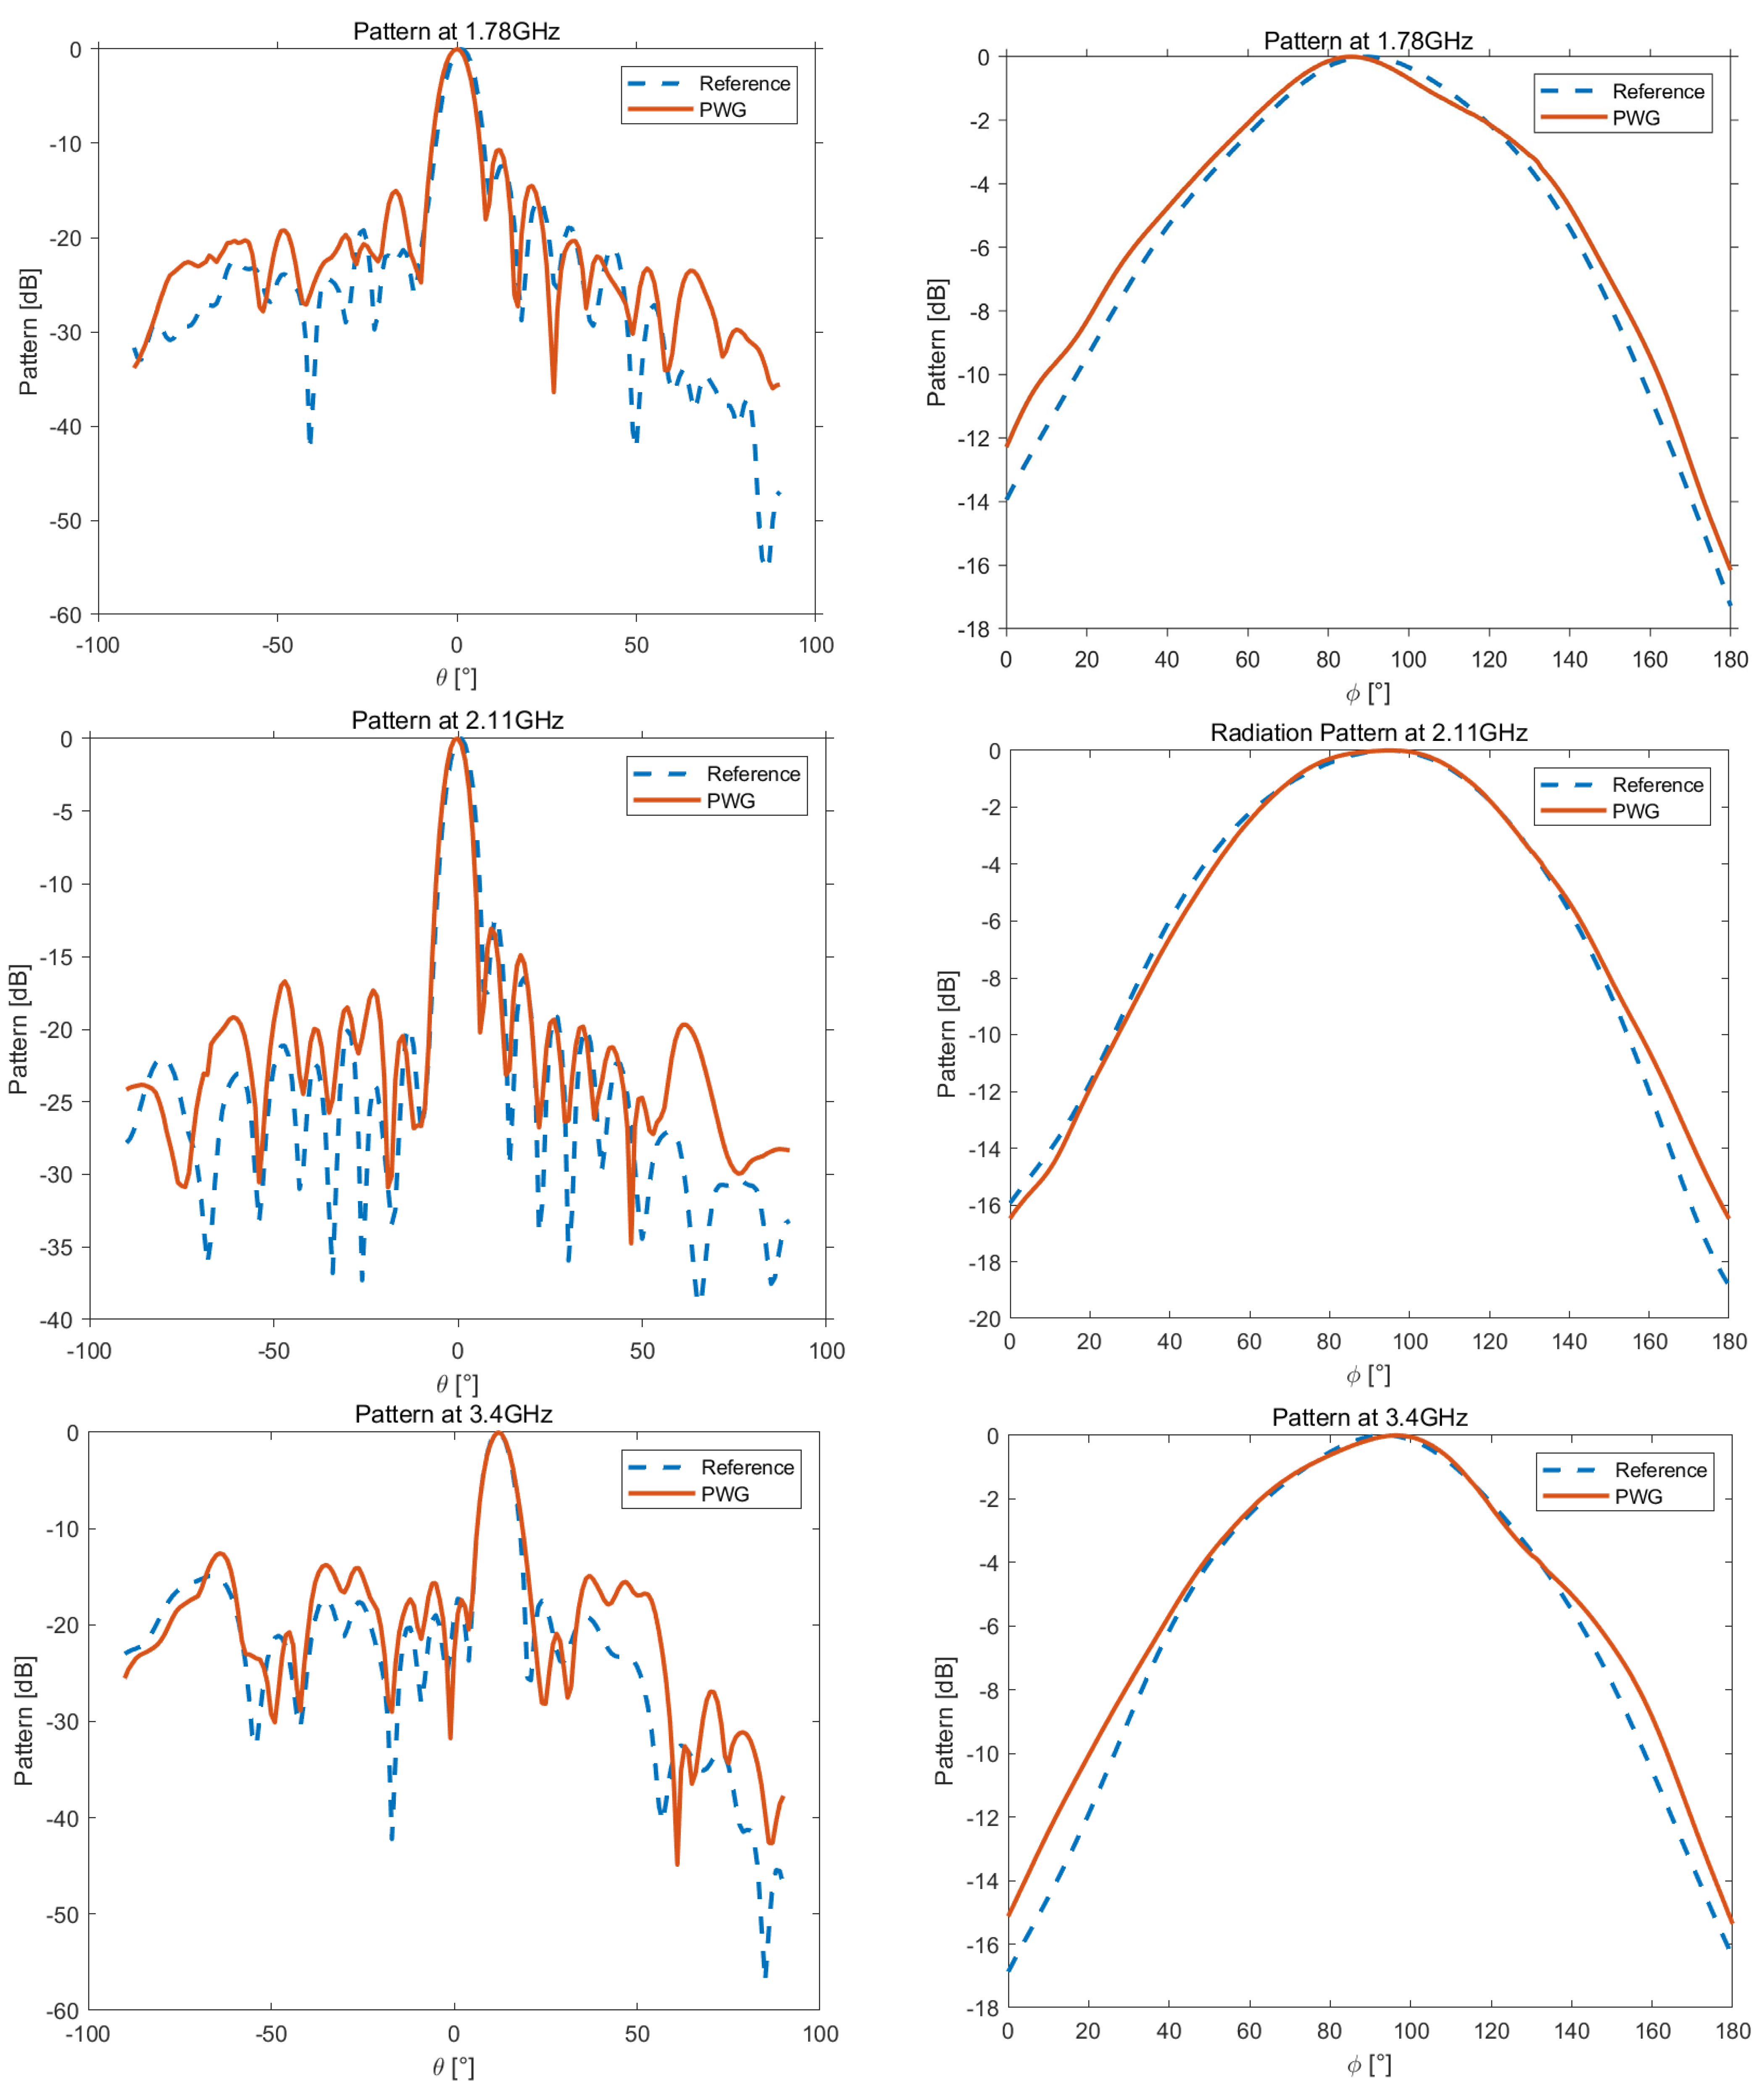
The base station operates in two frequency bands, 1.78–2.13 GHz and 3.4–3.55 GHz. Different optimized excitation values were set for the array by the amplitude phase modulation network, and the data were collected and tested in order to obtain the pattern of the base station. As shown in Figure 17, the patterns of θ and ϕ measured at 1.78 GHz, 2.11 GHz and 3.4 GHz were selected and compared with the MVG SG128 measurement system. By comparing the radiation patterns, the results obtained from ultra-wideband PWG-based measurement system were in reasonably good agreement with those obtaind using the MVG SG128. The designed ultra-wideband PWG thus demonstrated good testing performance and accuracy.
Compared to multi-probe and CATR-based testing methods, the PWG-based testing method requires less space. Multi-probe testing techniques require a darkroom measuring 8 × 8 × 8 m, whereas CATR testing requires a darkroom with dimensions of 5 × 5 × 12 m. In comparison, the PWG-based method only needs a compact 5 × 5 × 4 m darkroom. A significant benefit of the PWG technique is the absence of floor height restrictions, enabling it to be utilized at standard test sites, endowing it with advantage over other methods.

4. Conclusions

In this paper, we designed and manufactured a low-frequency one-dimensional PWG array covering a range from 700 MHz to 4 GHz to be used for antenna measurement of 5G base stations, and validated its performance with respect to generating a plane wave quiet zone. The test results showed that the one-dimensional PWG with a length of 2.64 m was able to generate a plane wave quiet zone of 1.5 m (length) × 1.32 m (width), with an amplitude distribution fluctuation (peak–peak value) smaller than 1.5 dB and a phase distribution fluctuation (peak–peak value) smaller than 15°, meeting the conditions required for far-field antenna testing. With a suitable turntable, the PWG is able to perform radiation performance testing of 5G base station antennae within a distance of 1.32 m. In addition, we performed a preliminary evaluation of the test accuracy of 5G base station antenna patterns when using the PWG on the basis of a numerical analysis.
There are also limitations to this study. The low-frequency broadband PWG in this paper is currently being integrated as a standardized product. The design and production of the ideal turntable required are still in progress. In the future, we will compare the results of the 5G base station antenna tested with the one-dimensional PWG and the far-field test system or a multiple-probe system.

Author Contributions

Writing—original draft preparation, X.L. and K.Y.; Writing—review and editing, X.L., L.C., Z.W., K.Y. and J.M.; methodology, Z.W. and X.L.; validation, K.Y, L.C. and J.M. All authors have read and agreed to the published version of the manuscript.

Funding

This research was funded by the Beijing Municipal Science and Technology Project under Grant Z211100000221002.

Data Availability Statement

The data presented in this study are available on request from the corresponding author.

Conflicts of Interest

The authors declare no conflict of interest.

References

  1. Cutler, C.C.; King, A.P.; Kock, W.E. Microwave Antenna Measurements. Proc. IRE 1947, 35, 1462–1471. [Google Scholar] [CrossRef]
  2. Wang, X.; Zhai, W.; Greco, M.; Gini, F. Cognitive Sparse Beamformer Design in Dynamic Environment via Regularized Switching Network. IEEE Trans. Aerosp. Electron. Syst. 2022, 1–17. [Google Scholar] [CrossRef]
  3. Johnson, R.; Ecker, H.; Moore, R. Compact Range Techniques and Measurements. IEEE Trans. Antennas Propag. 1969, 17, 568–576. [Google Scholar] [CrossRef]
  4. Gillespie, E.S.; Hess, D.W.; Stubenrauch, C.F. Antenna Measurements: A Comparison of Far-Field, Compact Range and near-Field Techniques. In Proceedings of the Conference on Precision Electromagnetic Measurements Digest, Boulder, CO, USA, 27 June–1 July 1994; IEEE: Boulder, CO, USA, 1994; p. 375. [Google Scholar]
  5. Courtney, C.C.; Voss, D.E.; Haupt, R.; LeDuc, L. The Theory and Architecture of a Plane-Wave Generator. In Proceedings of the 24th Annual Meeting and Symposium of the Antenna Measurement Techniques Association, Cleveland, OH, USA, 3–8 November 2002; Volume 3, pp. 353–358. [Google Scholar]
  6. Burnside, W.; Gilreath, M.; Kent, B.; Clerici, G. Curved Edge Modification of Compact Range Reflector. IEEE Trans. Antennas Propag. 1987, 35, 176–182. [Google Scholar] [CrossRef]
  7. Wang, X.; Li, W.; Chen, V.C. Hand Gesture Recognition Using Radial and Transversal Dual Micromotion Features. IEEE Trans. Aerosp. Electron. Syst. 2022, 58, 5963–5973. [Google Scholar] [CrossRef]
  8. Fan, W.; Kyösti, P.; Jing, Y.; Wang, Z. Over-the-Air Testing Metrology of 5g Radios. In Metrology for 5G and Emerging Wireless Technologies; Institution of Engineering and Technology: London, UK, 2022. [Google Scholar]
  9. Zhang, Y.; Wang, Z.; Sun, X.; Qiao, Z.; Fan, W.; Miao, J. Design and Implementation of a Wideband Dual-Polarized Plane Wave Generator With Tapered Feeding Nonuniform Array. Antennas Wirel. Propag. Lett. 2020, 19, 1988–1992. [Google Scholar] [CrossRef]
  10. Scattone, F.; Sekuljica, D.; Giacomini, A.; Saccardi, F.; Scannavini, A.; Gross, N.; Kaverine, E.; Iversen, P.O.; Foged, L.J. Design of Dual Polarised Wide Band Plane Wave Generator for Direct Far-Field Testing. In Proceedings of the 2019 13th European Conference on Antennas and Propagation (EuCAP), Krakow, Poland, 31 March–5 April 2019; pp. 1–4. [Google Scholar]
  11. Li, Y.; Gao, L.; Sun, H.; Zhang, X. Plane-Wave Synthesis: A Sparse Representation Perspective. Antennas Wirel. Propag. Lett. 2020, 19, 1644–1648. [Google Scholar] [CrossRef]
  12. Xia, J.; Kong, W.; Wang, G. Compact UWB Probe for Near-Field Microwave Target Detection and Imaging. In Proceedings of the 2009 5th International Conference on Wireless Communications, Networking and Mobile Computing, Beijing, China, 24–26 September 2009; IEEE: Beijing, China, 2009; pp. 1–4. [Google Scholar]
  13. Li, Y.; Su, M.; Sheng, Y.; Dong, L. Ultra-Wideband Dual Polarized Probe for Measurement Application; IEEE: Piscataway, NJ, USA, 2013; Volume 2, pp. 1025–1028. [Google Scholar]
  14. Fei, P.; Jiao, Y.-C.; Hu, W.; Zhang, F.-S. A Miniaturized Antipodal Vivaldi Antenna with Improved Radiation Characteristics. IEEE Antennas Wirel. Propag. Lett. 2011, 10, 127–130. [Google Scholar]
  15. Bucci, O.M.; Migliore, M.D.; Panariello, G.; Pinchera, D. Plane-Wave Generators: Design Guidelines, Achievable Performances and Effective Synthesis. IEEE Trans. Antennas Propag. 2012, 61, 2005–2018. [Google Scholar] [CrossRef]
  16. Haupt, R. Generating a Plane Wave with a Linear Array of Line Sources. IEEE Trans. Antennas Propag. 2003, 51, 273–278. [Google Scholar] [CrossRef] [Green Version]
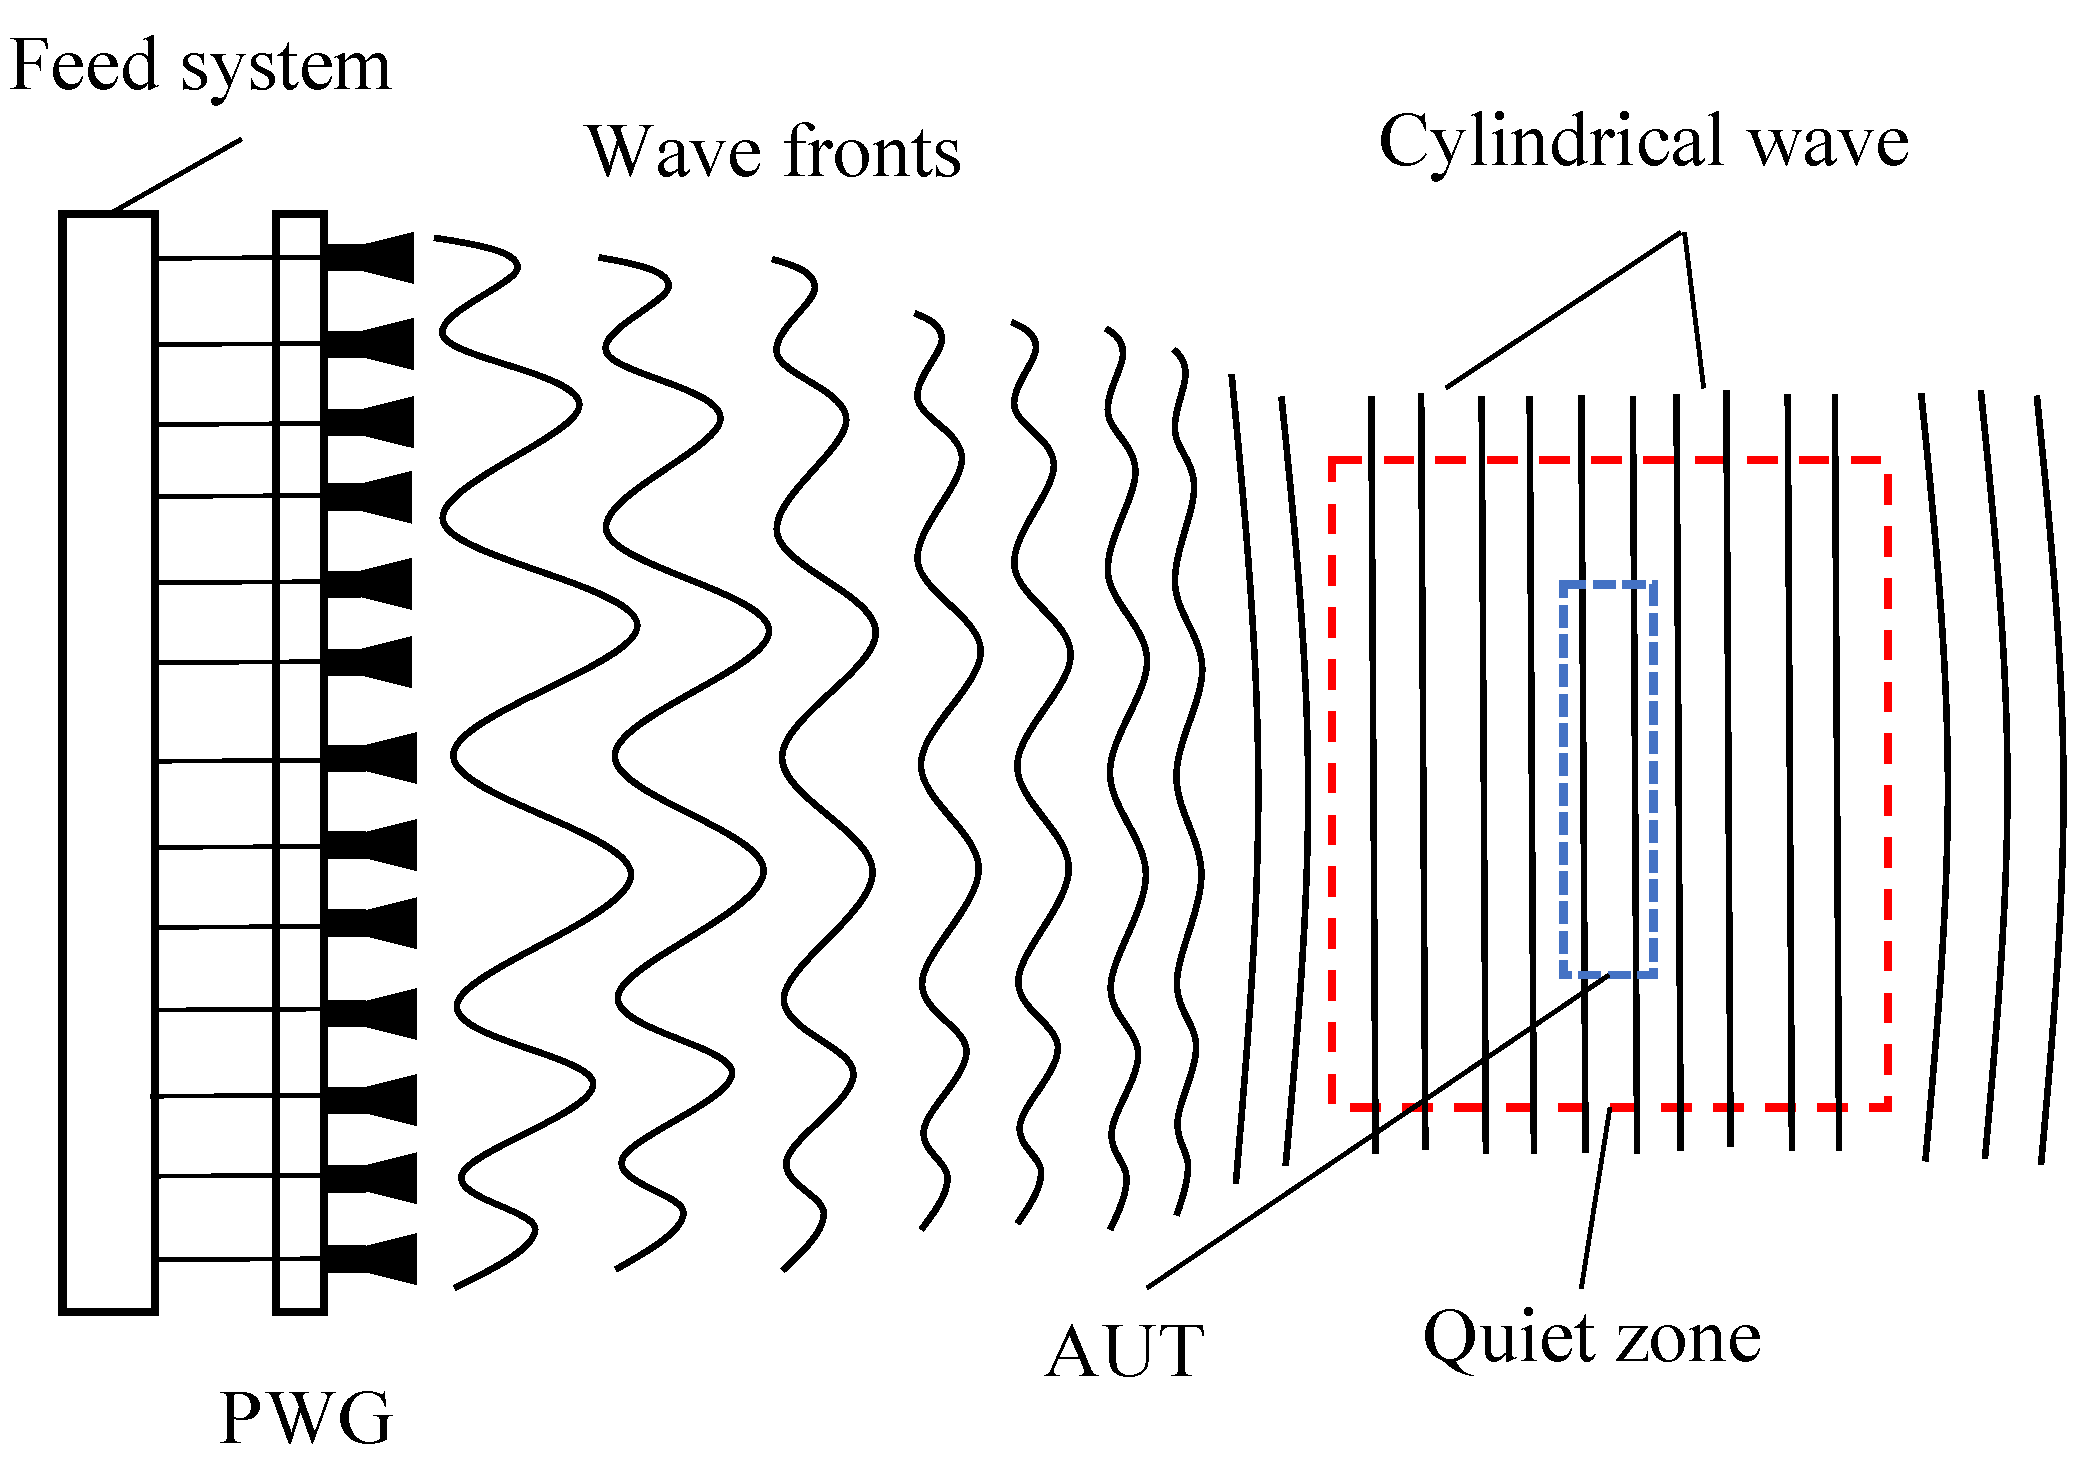
Figure 1. Schematic diagram of a PWG.
Electronics 12 01824 g001
Figure 2. Structure diagram of ultra-wideband Vivaldi antenna.
Electronics 12 01824 g002
Figure 3. Broadband feed structure.
Electronics 12 01824 g003
Figure 4. Vivaldi antenna structure diagram.
Electronics 12 01824 g004
Figure 5. Structure diagram of the feed network of the antenna array.
Electronics 12 01824 g005
Figure 6. Low-frequency broadband plane wave antenna array structure.
Electronics 12 01824 g006
Figure 7. Vivaldi antenna surface current distributions at operating frequencies of 0.7 GHz, 2.1 GHz and 3.9 GHz.
Electronics 12 01824 g007
Figure 8. Vivaldi antenna pattern in horizontal plane (top) and vertical plane (bottom).
Electronics 12 01824 g008aElectronics 12 01824 g008b
Figure 9. Radiation efficiency.
Electronics 12 01824 g009
Figure 10. Gain.
Figure 10. Gain.
Electronics 12 01824 g010
Figure 11. Relative position of plane wave array and field observation line.
Electronics 12 01824 g011
Figure 12. Amplitude variation of composite pattern fields at different frequency points on observation lines at different distances (2 m, 2.5 m, 3 m and 3.5 m). (a) 700 MHz–2.0 GHz. (b) 2.0–3.0 GHz. (c) 3.0–4.0 GHz.
Electronics 12 01824 g012aElectronics 12 01824 g012b
Figure 13. Phase variation of composite pattern fields at different frequency points on observation lines at different distance (2 m, 2.5 m, 3 m, and 3.5 m). (a) 700 MHz–2.0 GHz. (b) 2.0–3.0 GHz. (c) 2.0–3.0 GHz.
Electronics 12 01824 g013
Figure 14. Schematic diagram of the verification scheme for the plane wave quiet zone performance test of the antenna array.
Electronics 12 01824 g014
Figure 15. Test and verification of antenna array plane wave synthesis performance.
Electronics 12 01824 g015
Figure 16. Base station antenna pattern test system.
Electronics 12 01824 g016
Figure 17. Base station radiation pattern test system.
Electronics 12 01824 g017
Table 1. Parameters in the Vivaldi antenna.
ParametersValueParametersValue
L150 mmL717 mm
L2150 mmL83 mm
L32.8 mmR1100 ohm
L411.4 mmR2100 ohm
L54 mmRe0.04
L62.5 mm
Table 2. Verification results of plane wave performance test.
Frequency700 MHz–2.0 GHz2.0–3.0 GHz3.0–4.0 GHz
PolarizationDistance/mAmplitude Fluctuation/dBPhase Fluctuation/degAmplitude Fluctuation/dBPhase Fluctuation/degAmplitude Fluctuation/dBPhase Fluctuation/deg
Vertical polarization2.01.0910.320.9113.241.599.73
2.51.1111.450.9211.971.4610.12
3.01.3411.050.9910.771.4812.01
3.51.1615.301.1012.951.5710.16
Horizontal polarization2.01.0211.521.4812.991.6014.42
2.51.4810.221.3611.081.3014.50
3.01.0211.921.5413.351.5710.25
3.51.3313.821.6314.651.5212.01
Disclaimer/Publisher’s Note: The statements, opinions and data contained in all publications are solely those of the individual author(s) and contributor(s) and not of MDPI and/or the editor(s). MDPI and/or the editor(s) disclaim responsibility for any injury to people or property resulting from any ideas, methods, instructions or products referred to in the content.