Article

Slow-Scale Nonlinear Control of a H-Bridge Photovoltaic Inverter

1
School of Electrical Engineering, Guangxi University, Nanning 530004, China
2
School of Traffic and Transportation, Nanning University, Nanning 530200, China
*
Author to whom correspondence should be addressed.
Electronics 2023, 12(9), 2000; https://doi.org/10.3390/electronics12092000
Submission received: 13 March 2023 / Revised: 18 April 2023 / Accepted: 21 April 2023 / Published: 26 April 2023
(This article belongs to the Section Power Electronics)

Abstract

:
Aiming at the slow-scale nonlinear behaviors of a dual-loop control H-bridge photovoltaic inverter, a slow-scale nonlinear control method based on time-delay feedback control is proposed. Firstly, a feedback signal is formed by the difference between the current error signal and its own delay, and the feedback signal is made to pass through a proportion link so as to obtain a time-delay control signal. Then, based on the necessary conditions of the stability criterion, the value range of the delay feedback proportional coefficient is quickly determined, and the best delay time is chosen by determining the variation curve of the largest Lyapunov exponent. Finally, based on the double-loop PI regulation, the time-delay control signal is added to the original control signal to form the final control signal applied to the inverter. The results obtained show that the slow-scale nonlinear behaviors in the system can be absolutely eliminated, and the stable operation domain of the inverter can be remarkably expanded. When the sun irradiance and temperature change, the proposed control method still has a good control effect and shows strong robustness. In addition, the complex calculation in determining the control coefficient and delay time can be avoided by the method.

1. Introduction

As one of the fastest-growing renewable energy technologies, photovoltaic power generation has many advantages, such as easy maintenance, no pollution, no fuel cost, and so on. It has been widely used in the world [1,2,3]. The H-bridge inverter is a key component that connects a photovoltaic system to a power grid system or load. Its slow-scale and fast-scale unstable nonlinear behaviors will greatly reduce the power supply quality of the system [4]. In recent years, the nonlinear behaviors of H-bridge photovoltaic inverters have become a research hotspot, and important results have been achieved. In [5,6,7], the boundary collision bifurcation phenomenon in a PWM-controlled single-phase H-bridge inverter was studied, a piecewise discrete mapping model and state variable boundary analytical expressions of the system were given, and the nature of the boundary collision phenomenon was analyzed. In [8,9,10,11], the essence of the slow-scale instability phenomenon in a voltage-source inverter is analyzed and the analytical expression of the oscillation frequency is derived. In [12,13], the fast-scale instability phenomenon in a voltage-source single-phase H-bridge inverter was studied, and the essence of this phenomenon was analyzed. These studies revealed the profound mechanism of nonlinear phenomena in H-bridge inverters. However, most of them are focused on a H-bridge inverter under a single feedback control loop or simple proportional control. There is a lack of research on the nonlinear behavior of a double-loop-controlled H-bridge inverter commonly used in practical engineering. The difficulty is that the order of the system equation of state will increase greatly after adding a more complex controller and compensation network, which greatly increases the complexity of system stability analysis.
Moreover, since the nonlinear behaviors of H-bridge inverter will significantly increase the switch stresses, and increase the output harmonic content, it is more important to suppress the harmful nonlinear behaviors to improve performance of the inverter based on determining the mechanism of various nonlinear phenomena. Currently, research on the control methods of the nonlinear behavior of power electronic converters mainly focuses on DC–DC converters. The existing control methods can be divided into non-feedback and feedback control methods. Non-feedback control methods include disturbance control [14] and slope compensation methods [15], while feedback control methods include event-triggered control [16,17], fuzzy consensus tracking control [18], adaptive sliding mode control [19], and time-delay feedback control (TDFC) [20]. Compared with the non-feedback control method, the feedback control method has the advantages of not requiring external control signals and not changing the original dynamic properties of the system, which has been widely used in the nonlinear control of DC–DC converters. In [21], the Washout filter is employed for controlling bifurcation behavior in Cuk converters. Nevertheless, this method requires additional capacitors, which will increase the cost. In [22], the fuzzy control method is utilized for controlling chaos in buck converters. However, this method requires large computations, has difficulty in quickly determining the values of important parameters, which may affect real-time control and response speed, and is unsuitable for systems with explicitly defined mathematical models. In [23], an adaptive slope compensation method is proposed for controlling sub-harmonic oscillation and chaotic behavior in buck and boost converters. Nevertheless, this method requires extra sampling circuits and slope signal generation circuits, and its robustness is weak when it comes to interference.
Compared with the feedback control methods mentioned above, the TDFC has the advantages of simple implementation, good control effect, strong robustness, and no need for additional circuits. It was first proposed by Pyragas [24]. Up to now, TDFC has also been effectively used in the nonlinear control of various nonlinear systems [25,26,27], but there are few reports about its application in the nonlinear control of a dual-loop control H-bridge photovoltaic inverter. There are two main challenges. The first challenge is how to propose a nonlinear control method suitable for the dual-loop control photovoltaic inverter based on the idea of time-delayed feedback control. The second challenge is how to quickly determine the values of control coefficients and delay time which have an important influence on the control effect.
To address the shortcomings and challenges of existing research, aiming at the slow-scale nonlinear behaviors of a dual-loop control H-bridge photovoltaic inverter, a slow-scale nonlinear control method based on TDFC is proposed. Based on the necessary conditions of the stability criterion, the control coefficients and delay time values are quickly selected using numerical analysis. The remaining article is organized as follows: Section 2 introduces the operation principle of the photovoltaic inverter; Section 3 reveals the mechanism of slow-scale nonlinear behavior in the inverter. In Section 4, the proposed control method is introduced to control the slow-scale nonlinear behavior of the inverter, and the specific process is elaborated in detail. Section 5 verifies the correctness and effectiveness of the proposed control method through experimental results and conclusions are given in Section 6.

2. System Description

2.1. Circuit Operation Principle

The structure of the single-phase H-bridge photovoltaic inverter studied in this paper is shown in Figure 1, which consists of a main circuit and a control circuit. In the main circuit, the output of the PV array is in parallel with a capacitor Cpv through a diode D. Cpv is connected to the input end of the Boost converter with the duty ratio d. The capacitor C0 in parallel with the Boost circuit provides the DC side voltage E of the H-bridge inverter. The inverter bridge is composed of four ideal switches S1–S4, in which bipolar sinusoidal pulse width mode for modulation is adopted; L, C, and R represent the filter inductance, filter capacitor, and load resistance, respectively. The control circuit is one with dual closed-loop PI regulation plus a given voltage feedforward control.
The control process can be described as follows: first, the error between the given voltage Vref and the output voltage vC is processed by the voltage outer loop controller H1 to obtain the reference current ILref. The error between ILref and the inductor current iL is processed by the current inner loop controller H2. Then, Vref is processed by the voltage feedforward controller H3. The output signals of H2 and H3 are added to obtain the modulation signal vcon. Finally, vcon is made to compare with the triangular carrier wave signal vtri to generate the SPWM signal to trigger S1–S4 to operate. PI controls are used in the voltage outer loop controller H1 and the current inner loop controller H2, and P controller is used in the voltage feedforward controller H3.

2.2. State Equations

In each switching cycle, the inverter has two operating states: State A, where S1 and S3 are on, and S2 and S4 are off; State B, where S1 and S3 are off, and S2 and S4 are on. According to the circuit structure of each state, the state equations of the system can be expressed as
{ d i L ( t ) d t = 1 L v C ( t ) + 2 S T 1 L E d v C ( t ) d t = 1 C i L ( t ) 1 R C v C ( t ) d I Lref ( t ) d t = k pv d v C ( t ) d t k iv v C ( t ) + k pv d V ref ( t ) d t + k iv V ref ( t ) d v con ( t ) d t = k pc d i L ( t ) d t k ic i L ( t ) + k pc d I Lref ( t ) d t + k ic I Lref ( t ) + k p d V ref ( t ) d t
where kpv and kiv are, respectively, the proportional and integral control coefficients of the voltage outer loop controller H1; kpc and kic are, respectively, the proportional and integral control coefficients of the current inner loop controller H2; kp is the control coefficient of the voltage feedforward controller H3; and ST is a 0–1 variable. When ST = 1, the system operates in state A; when ST = 0, the system operates in state B.

3. Simulation Results and Slow-Scale Nonlinear Behavior Analysis

3.1. Simulation Results

The proportional gain of the PI regulator is the key parameter in the design of the photovoltaic inverter. In this study, a Yingli Energy Solar module (YL295P-35b) is selected as a PV array. Under the standard conditions (sun irradiance S = 1000 W/m2 and temperature T = 25 °C), the variation process of system stability, during which the voltage outer loop proportional control coefficient kpv varies, is studied in detail. Other circuit parameters given are shown in Table 1.
Figure 2a–c, respectively, shows the waveforms of the output voltage vC, the inductor current iL, and the THD of vC when kpv = 0.22 A/V. It can be seen that the waveforms of vC and iL are smooth, and the system operates stably, and the THD of vC is very small, about 0.29%. Figure 3a–c, respectively, shows the waveform of vC, the waveform of iL, and the THD of vC when kpv is reduced to 0.001 A/V. It can be seen that there are low-frequency oscillations throughout the cycle in vC and iL, and the THD of vC reaches 302.40%. This shows that this slow-scale nonlinear behavior with the oscillation frequency far below the switching frequency will greatly reduce the system performance and cause the system to lose stability.

3.2. Analysis of the Slow-Scale Nonlinear Behavior

According to the operation principle of bipolar SPWM, the duty cycle d(t) is expressed as
d ( t ) = 1 2 ( 1 + v con ( t ) V H )
The average state model of the system can be expressed as
{ d i L ( t ) d t = 1 L v C ( t ) + v con ( t ) V H L E d v C ( t ) d t = 1 C i L ( t ) 1 R C v C ( t ) d I Lref ( t ) d t = k pv d v C ( t ) d t k iv v C ( t ) + k pv d V ref ( t ) d t + k iv V ref ( t ) d v con ( t ) d t = k pc d i L ( t ) d t k ic i L ( t ) + k pc d I Lref ( t ) d t + k ic I Lref ( t ) + k p d V ref ( t ) d t
By defining the state vector X = [iL(t) vC(t) ILref(t) vcon(t)]T, the Jacobian matrix of Equation (3) at the equilibrium point Xo can be obtained:
J ( X o ) = [ 0 1 L 0 E V H L 1 C 1 R C 0 0 k pv C k pv R C k iv 0 0 k ic k pv k pc C k pc L + k pv k pc R C k pc k iv k ic E k pc V H L ]
Furthermore, the relationship between kpv and the eigenvalue λ of the Jacobian matrix can be obtained by solving the following equation:
det [ λ I J ( X o ) ] = 0
From Equations (4) and (5), the trajectories of the variation of the Jacobian matrix eigenvalues with kpv can be calculated. Table 2 shows the calculation results. It can be seen that with the decrease in kpv, a pair of conjugate complex roots begins to enter the right half region of the complex plane at kpv = 0.1262, while other eigenvalues are still on the left half plane. According to the stability criterion [4], the slow-scale nonlinear behavior of the system shown in Figure 3 is caused by Hopf bifurcation.

4. Control of Slow-Scale Nonlinear Behavior

The above research shows that with the decrease in kpv, the system will operate in a slow-scale unstable state, which causes the THD of the output voltage to increase sharply, the current stresses of the switches to increase greatly, and the system power supply reliability and operation stability to reduce remarkably. Because this phenomenon is caused by Hopf bifurcation, suppressing the occurrence of the slow-scale nonlinear phenomenon essentially means suppressing the occurrence of Hopf bifurcation.

4.1. A Slow-Scale Nonlinear Control Based on TDFC

In the TDFC, the difference between the state variable and its own delayed value for a certain time is used to act on the chaotic system to achieve the purpose of expanding the stable region of the system. In this paper, based on the original double closed-loop PI regulation plus a given voltage feedforward control, TDFC is introduced in the current inner loop. First, the difference between the current error signal ie and its own delay is taken as the feedback signal. Then, the feedback signal is processed by the controller H4, in which P control is used, and kp1 is utilized to express the delay feedback proportional coefficient. Finally, the output signal of the controller H4 and the original signal vcon are added to form a new modulation signal vcon to drive the corresponding switches, as shown in Figure 4. In Figure 4, τ represents the delay time.
With the control applied, two new state variables, ILref(t − τ) and iL(t − τ), are added to the system. Based on Equation (3), at this time, the average state model of the system can be expressed as
{ d i L ( t ) d t = 1 L v C ( t ) + v con ( t ) V H L E d i L ( t τ ) d t = 1 L v C ( t τ ) + v con ( t τ ) V H L E d v C ( t ) d t = 1 C i L ( t ) 1 R C v C ( t ) d I Lref ( t ) d t = k pv d v C ( t ) d t k iv v C ( t ) + k pv d V ref ( t ) d t + k iv V ref ( t ) d I Lref ( t τ ) d t = k pv d v C ( t τ ) d t k iv v C ( t τ ) + k pv d V ref ( t τ ) d t + k iv V ref ( t τ ) d v con ( t ) d t = k pc d i L ( t ) d t k ic i L ( t ) + k pc d I Lref ( t ) d t + k ic I Lref ( t ) + k p 1 ( d i e ( t ) d t d i e ( t τ ) d t ) + k p d V ref ( t ) d t
where ie(t) = ILref(t)iL(t); ie(tτ) = ILref(tτ)iL(tτ). The delay feedback coefficient kp1 and delay time τ have an important influence on the control effect. However, Equation (6) is a system of the first-order ordinary differential equations without an explicit delay time τ. The analytical expression of kp1 and τ cannot be obtained directly. For this reason, in this paper, a method of numerical analysis is used to determine the values of kp1 and τ quickly. First, based on the necessary conditions of the stability criterion, the value range of kp1 is determined. Then, after fixing the value of kp1, the best value of τ is selected by calculating the variation of the largest Lyapunov exponent with τ. The following is the detailed process.
A state vector X = [iL(t) iL(tτ) vC(t) ILref(t) ILref(tτ) icon(t)]T is first taken, then, based on Equation (6), the Jacobian matrix at the equilibrium point Xo can be determined as
J ( X o ) = [ 0 0 1 L 0 0 E V H L 0 0 0 0 0 0 1 C 0 1 R C 0 0 0 k pv C 0 k pv R C k iv 0 0 0 0 k pv C 0 0 0 0 k ic k pv k pc C k pv k p 1 C k pv k p 1 C k pc L + k pv k pc R C k pc k iv + k p 1 ( k pv R C k iv + 1 L ) k ic 0 ( k pc k p 1 ) E V H L ]
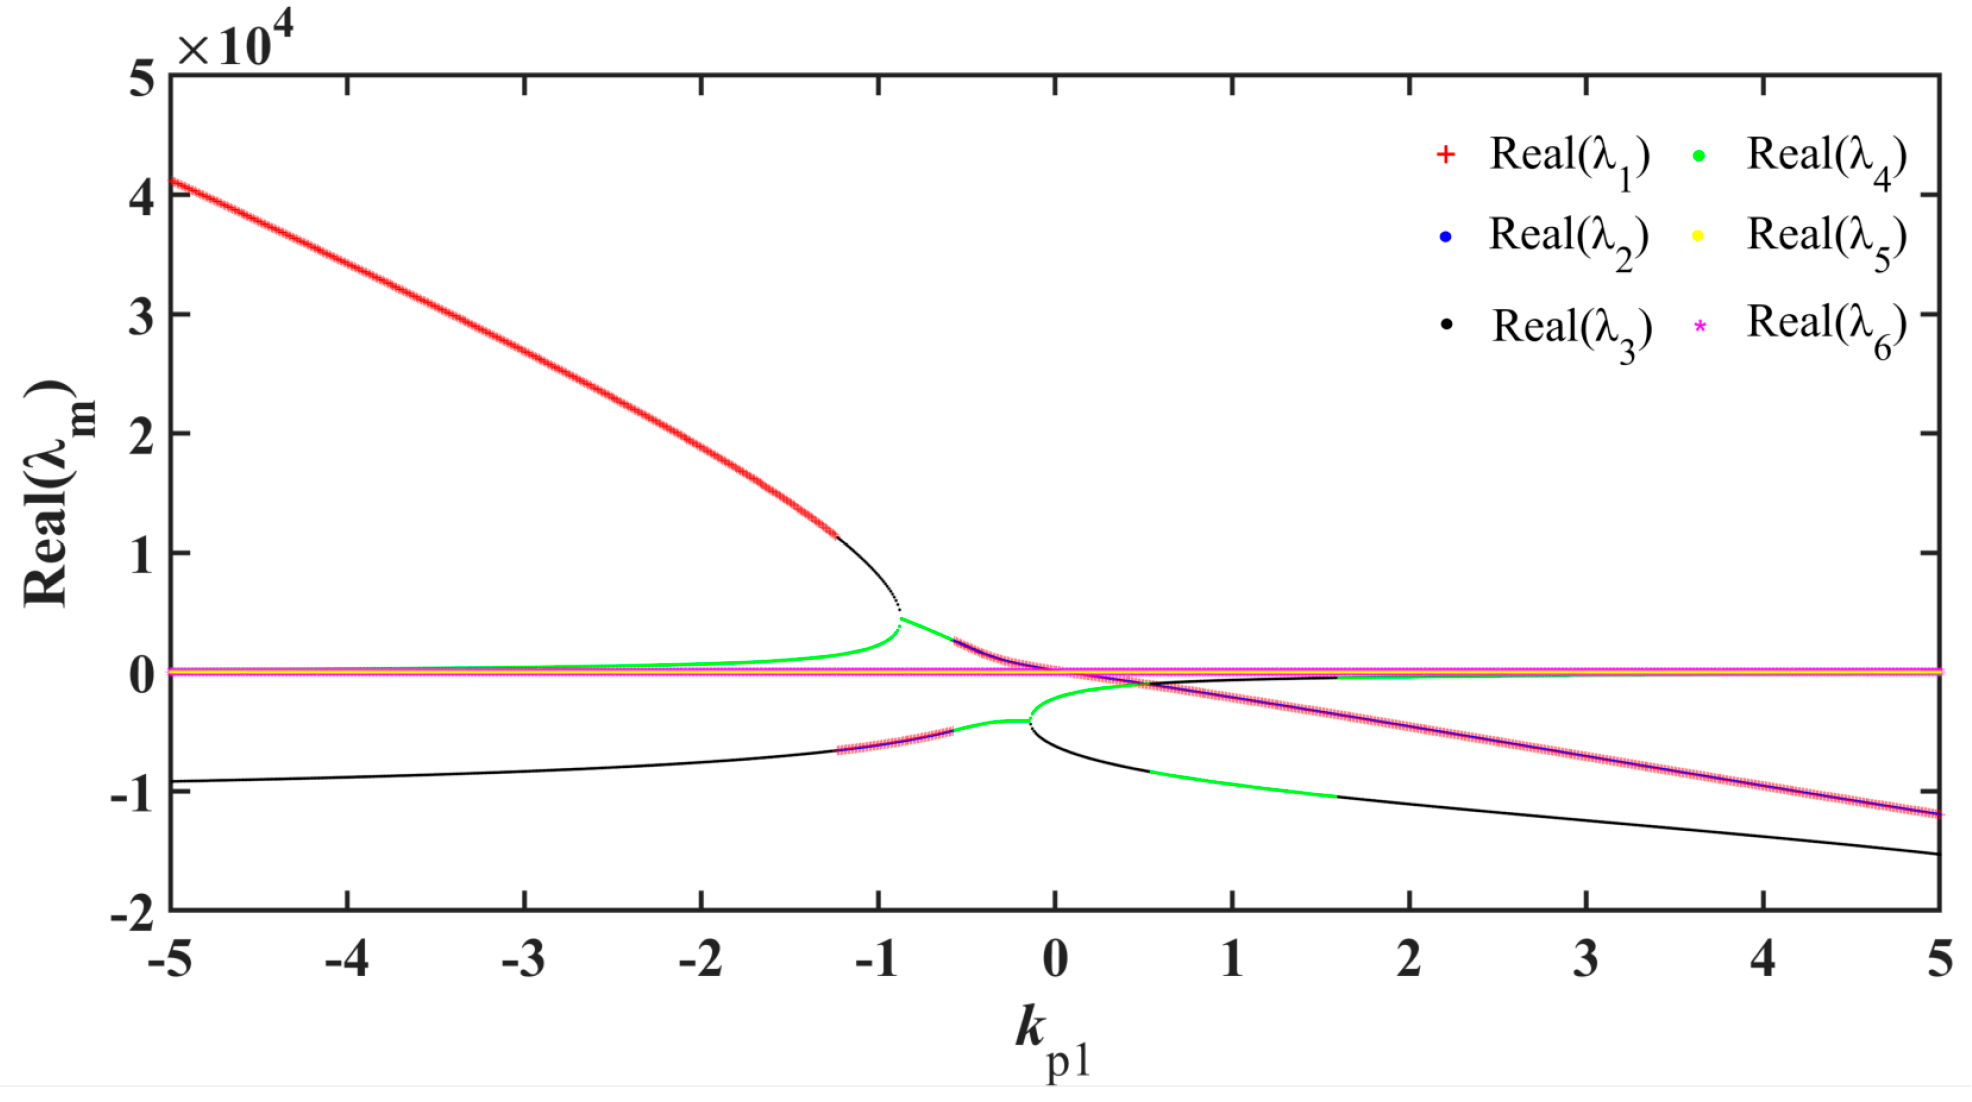
Additionally, kpv = 0.001 A/V is taken. From the above analysis, we know that the original system is in an unstable state because of the occurrence of a Hopf bifurcation. Then, kp1 is taken in the interval −5~5, which can be set arbitrarily, and the step length is set as 0.01, the varying trajectories of the real parts of the six eigenvalues of the Jacobian matrix (7) can be obtained through MATLAB programming, as shown in Figure 5. It can be seen from Figure 5 that when the value of kp1 is in (0, 5], the real parts of the six eigenvalues are all less than zero. In other words, the necessary condition for the system to return to the stable state is that kp1 must be within (0, 5]. For further work, kp1 = 2 is taken randomly.
Without an explicit τ included in Equation (6), Equation (6) is transformed as follows. First, the Laplace transform is taken for the last differential equation in Equation (6) to obtain:
s v con ( s ) = k pc s i L ( s ) k ic i L ( s ) + k pc s I Lref ( s ) + k i c I Lref ( s ) + k p 1 ( s i e ( s ) s i e ( s ) e τ s ) + k p s V ref ( s )
Because τ is very small, eτs can be expanded according to Taylor’s formula and only the first two terms are taken. Equation (8) can be written as
s v con ( s ) = k pc s i L ( s ) k ic i L ( s ) + k pc s I Lref ( s ) + k i c I Lref ( s ) + k p 1 ( s i e ( s ) s i e ( s ) τ s + 1 ) + k p s V ref ( s )
The inverse Laplace transform of Equation (9) is taken, and Equation (10), in which τ is contained explicitly, can be obtained.
d v con ( t ) d t = k pc d i L ( t ) d t k ic i L ( t ) + k pc d I Lref ( t ) d t + k ic I Lref ( t ) + k p 1 ( d i e ( t ) d t i e ( t ) τ ( 1 e t τ ) ) + k p d V r e f ( t ) d t
Equation (11) is obtained by replacing the last differential equation in Equation (6) with Equation (10).
{ d i L ( t ) d t = 1 L v C ( t ) + v con ( t ) V H L E d i L ( t τ ) d t = 1 L v C ( t τ ) + v con ( t τ ) V H L E d v C ( t ) d t = 1 C i L ( t ) 1 R C v C ( t ) d I Lref ( t ) d t = k pv d v C ( t ) d t k iv v C ( t ) + k pv d V ref ( t ) d t + k iv V ref ( t ) d I Lref ( t τ ) d t = k pv d v C ( t τ ) d t k iv v C ( t τ ) + k pv d V ref ( t τ ) d t + k iv V ref ( t τ ) d v con ( t ) d t = k pc d i L ( t ) d t k ic i L ( t ) + k pc d I Lref ( t ) d t + k ic I Lref ( t ) + k p 1 ( d i e ( t ) d t i e ( t ) τ ( 1 e t τ ) ) + k p d V r e f ( t ) d t
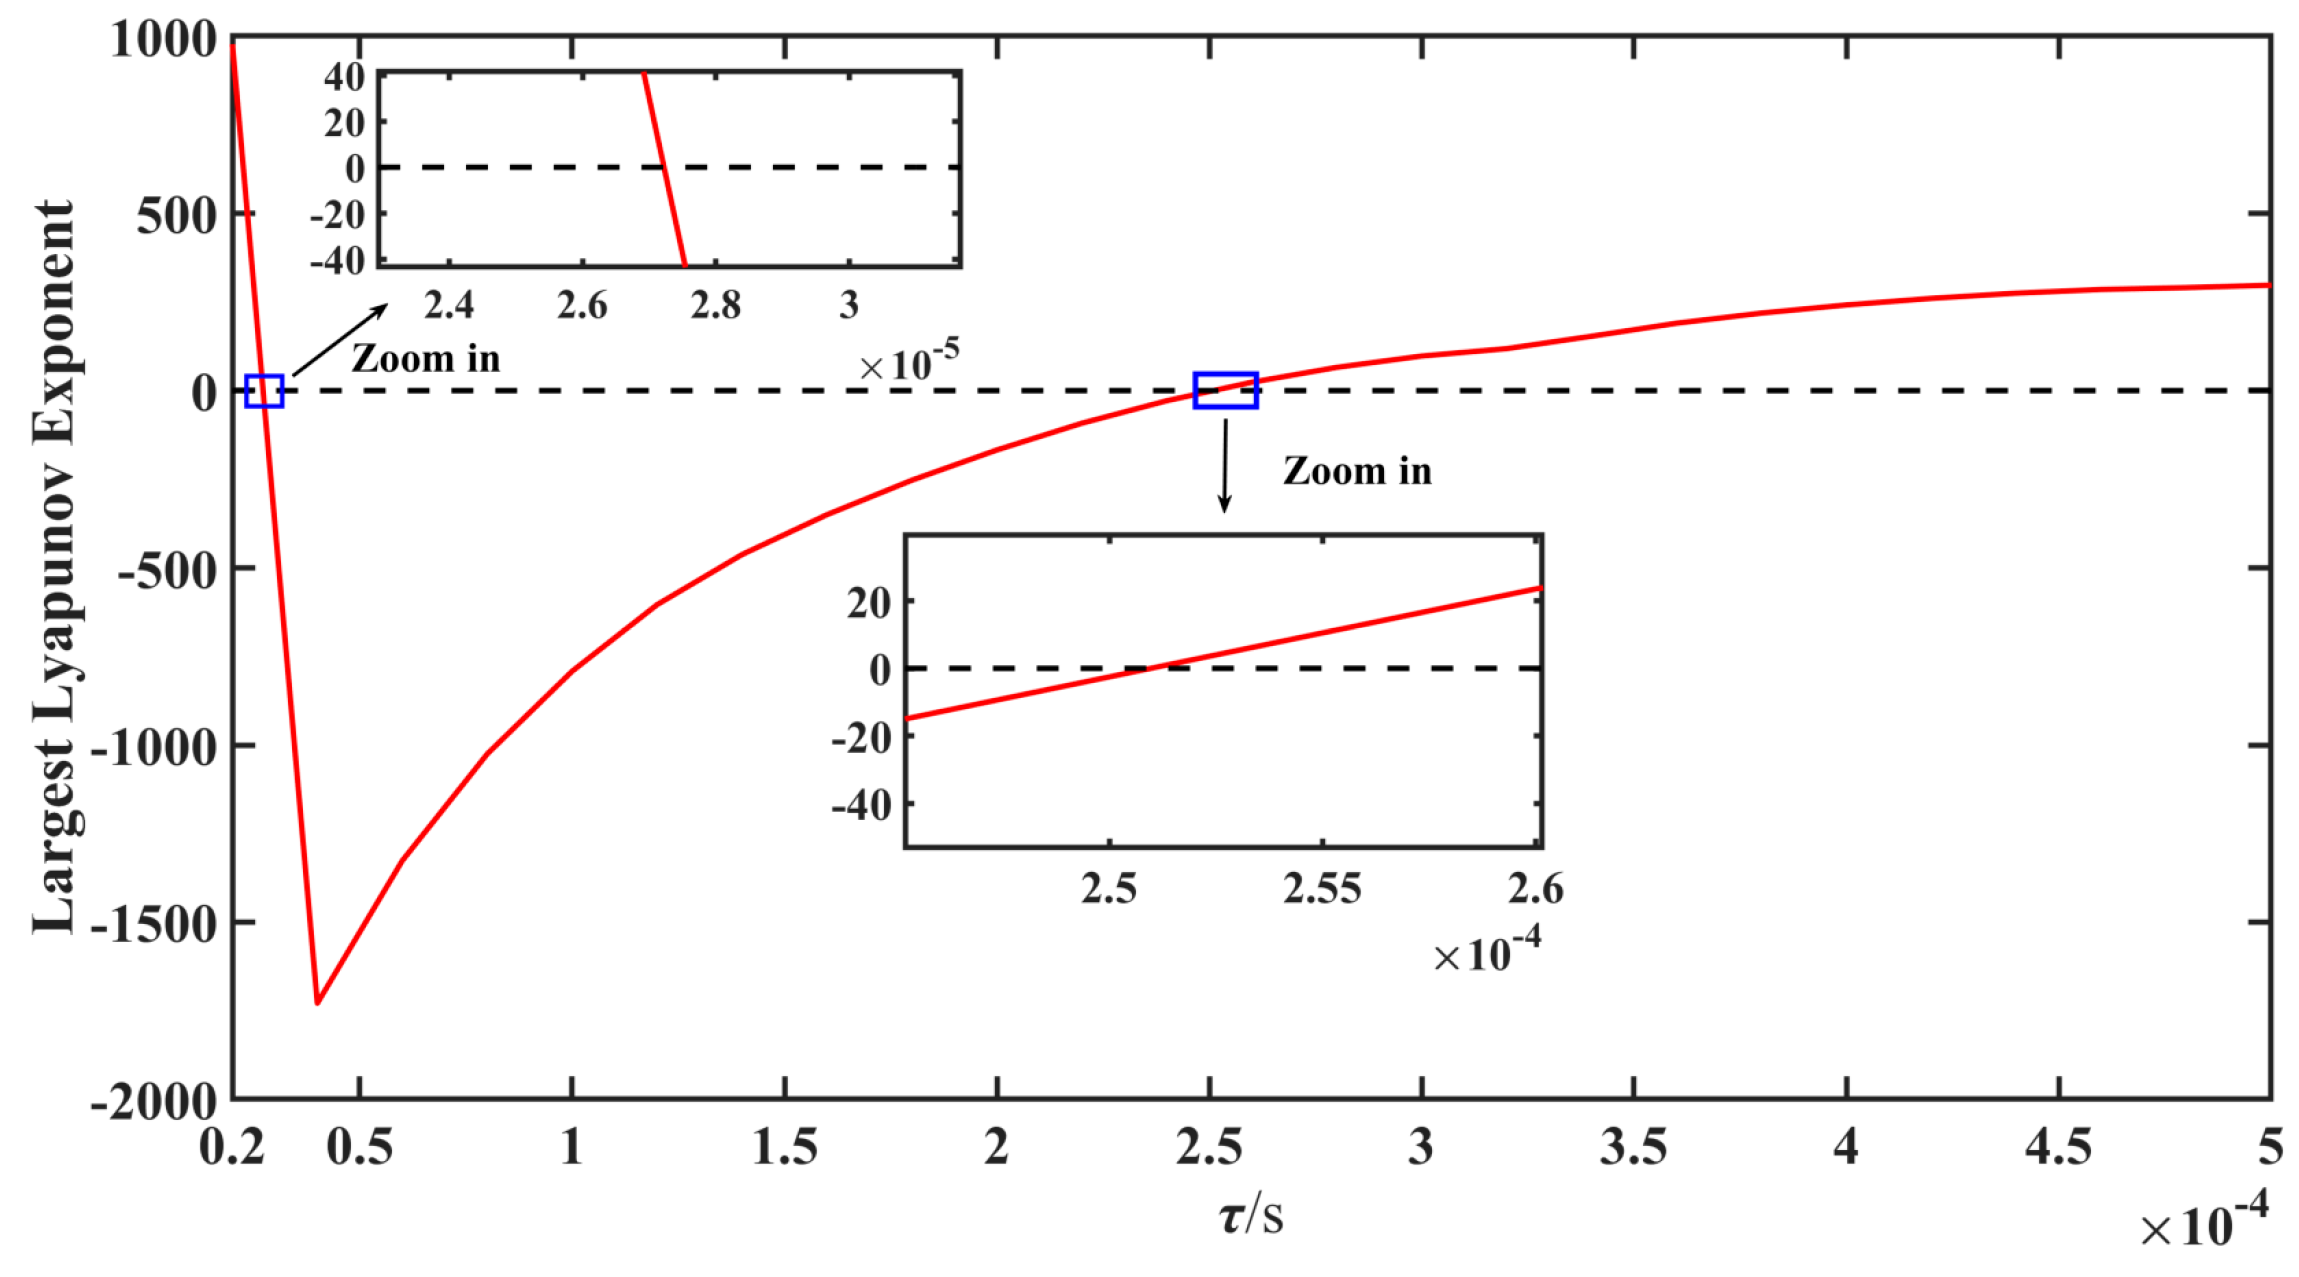
The Jacobian matrix calculated based on Equation (11) is a non-autonomous matrix, and is unable to analyze the influence of τ on the stability of the system based on the stability criterion. With the help of MATLAB, the variation of the system’s largest Lyapunov exponent with τ for kpv = 0.001 A/V and kp1 = 2 is calculated, and the calculation results are shown in Figure 6. It can be seen that when τ is within (2.75 × 10⁻⁵ s, 2.51 × 10⁻⁴ s), the largest Lyapunov exponent is negative, and the system operates stably. Further observation shows that when τ approaches the switching period Ts = 5 × 10⁻⁵ s, the largest Lyapunov exponent is at the minimum. According to the above analysis, if the value of τ exceeds (2.75 × 10⁻⁵ s, 2.51 × 10⁻⁴ s), the system will lose stability, and the system stability is strongest when the value of τ is near Ts. Therefore, the delay time τ = Ts is selected.
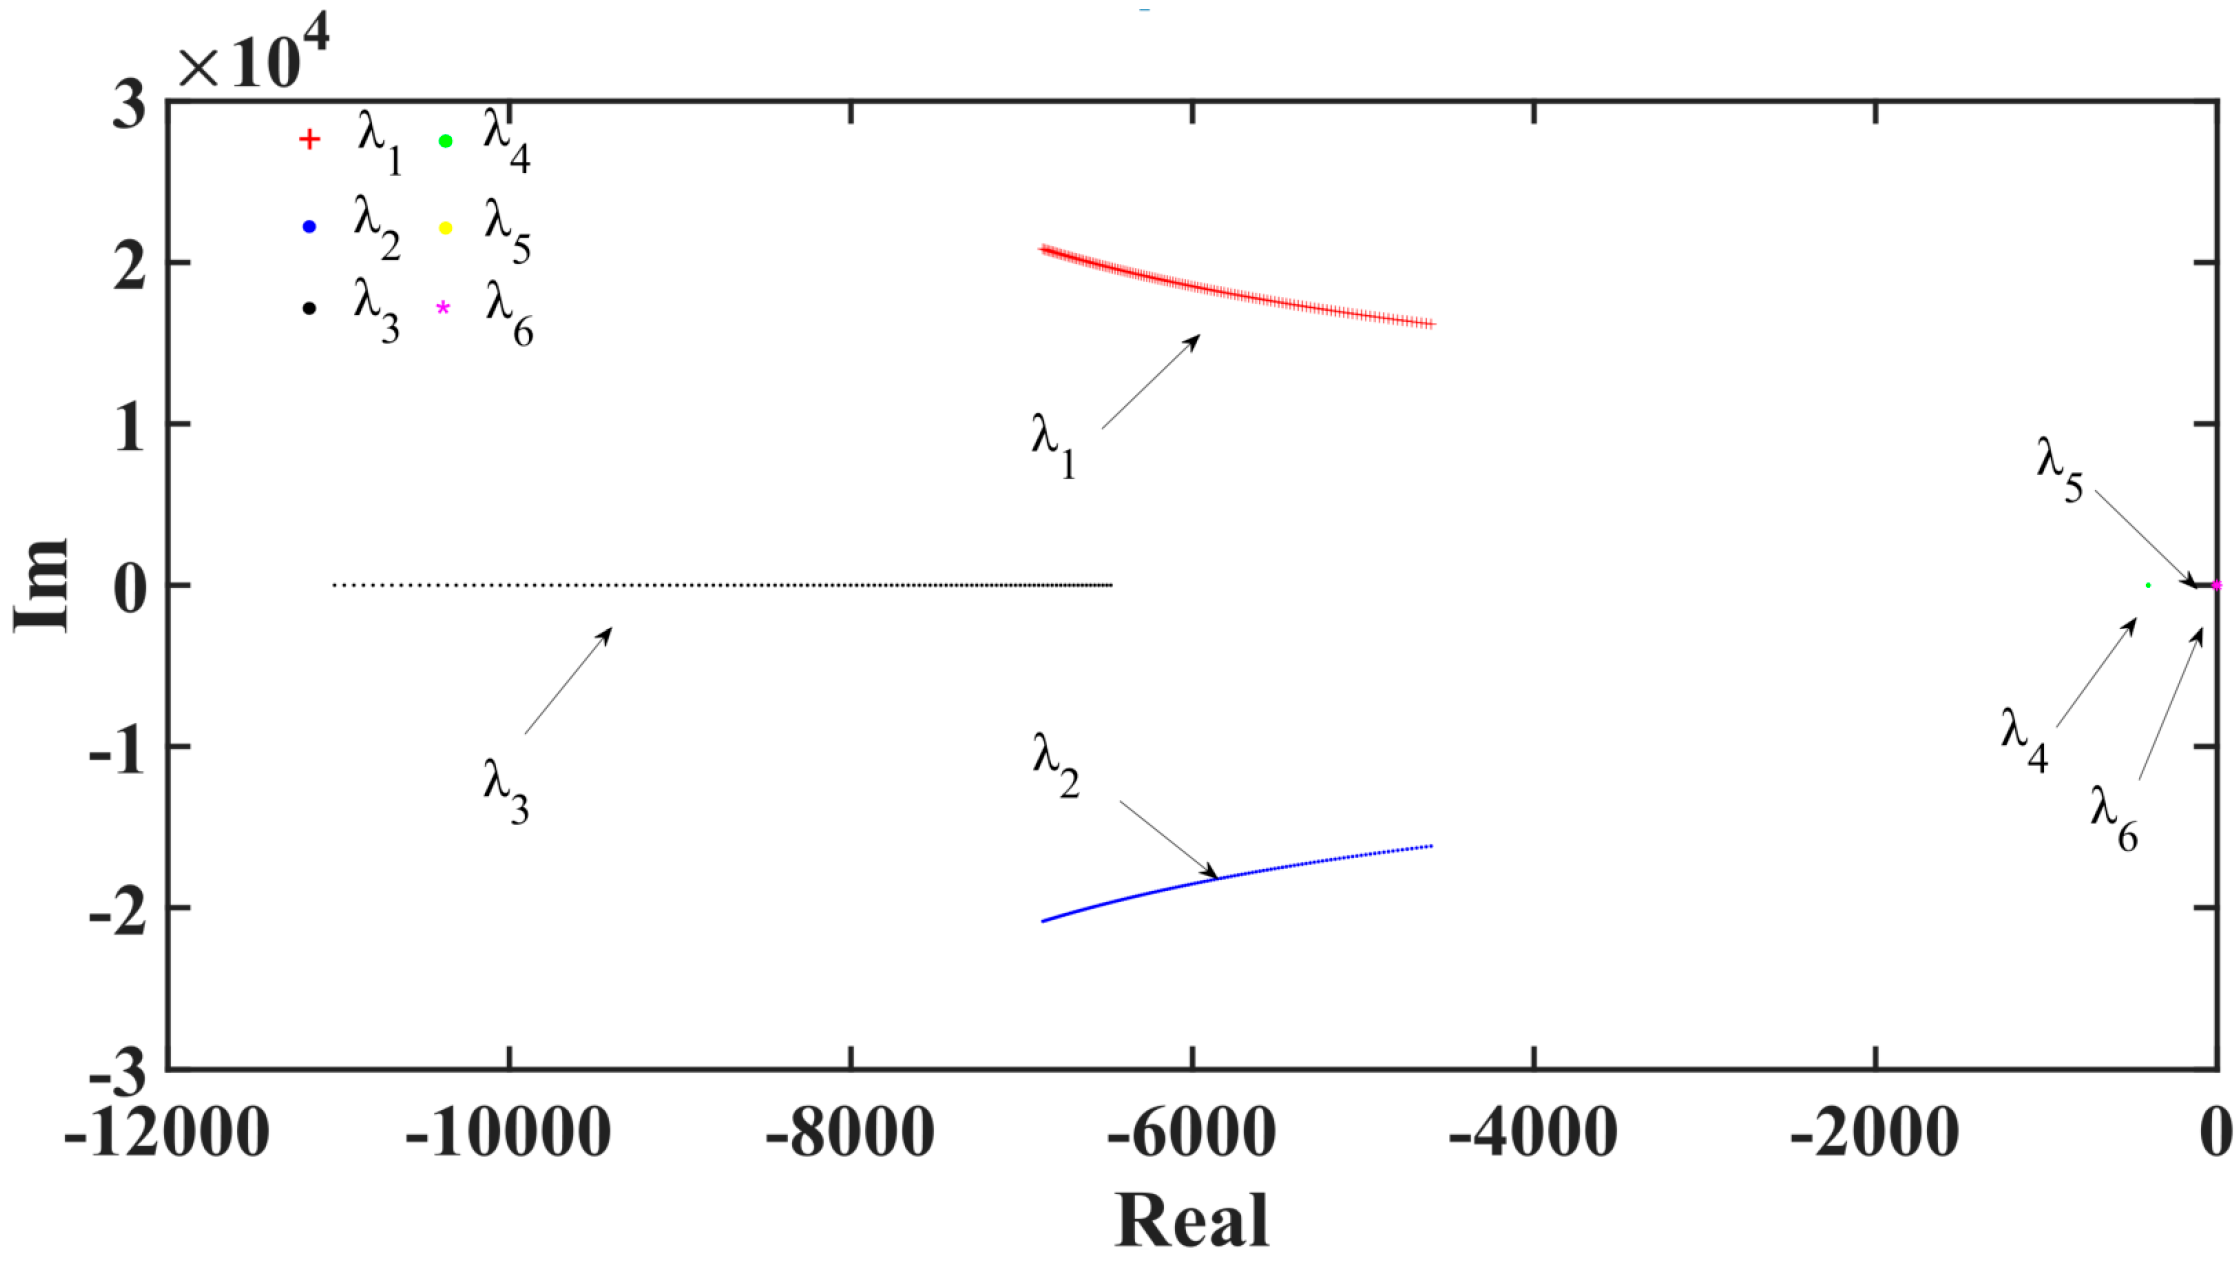
With kp1 = 2 and τ = Ts, the trajectories of the eigenvalues responding to the value range [0.001, 0.3] of kpv can be plotted, as shown in Figure 7. At this time, all the eigenvalues are in the left half plane of the complex plane; therefore, the system operates stably.
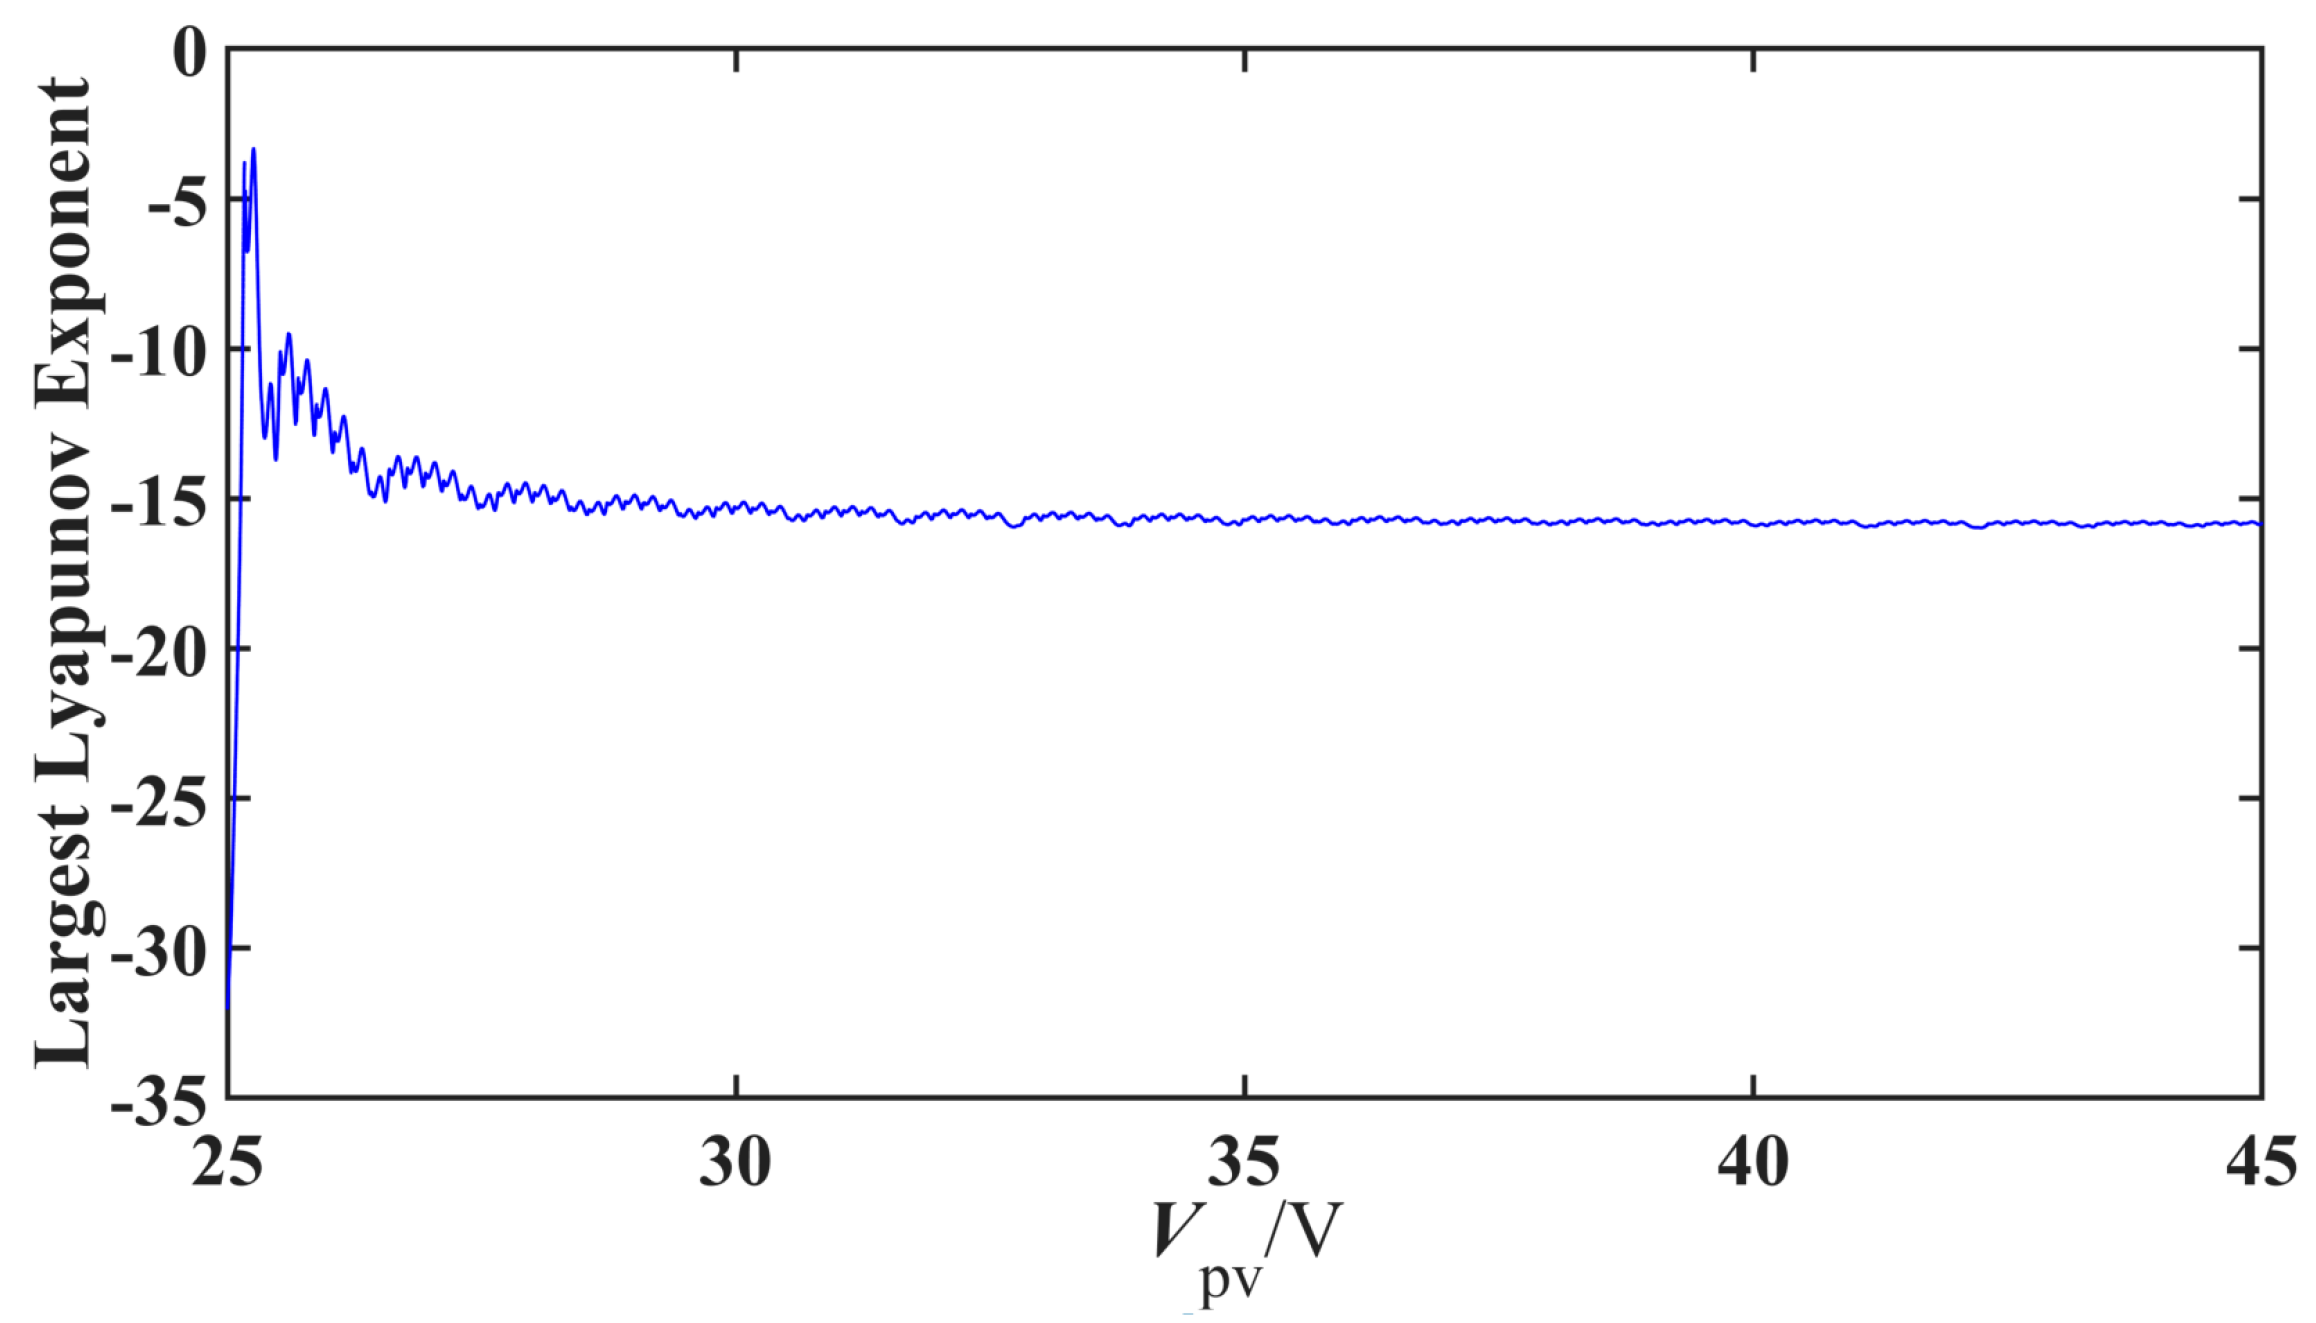
With the proposed control applied, the variation of the largest Lyapunov exponent with Vpv is calculated, as shown in Figure 8. It can be seen that when Vpv varies in the interval of [25 V, 45 V], the largest Lyapunov exponent is always less than 0. Further analysis shows that after the proposed control method is applied, the system remains stable even when Vpv is perturbed and varies in the range of [25 V, 45 V]. This proves that the proposed control strategy has good robustness.

4.2. Validation of Simulation Results

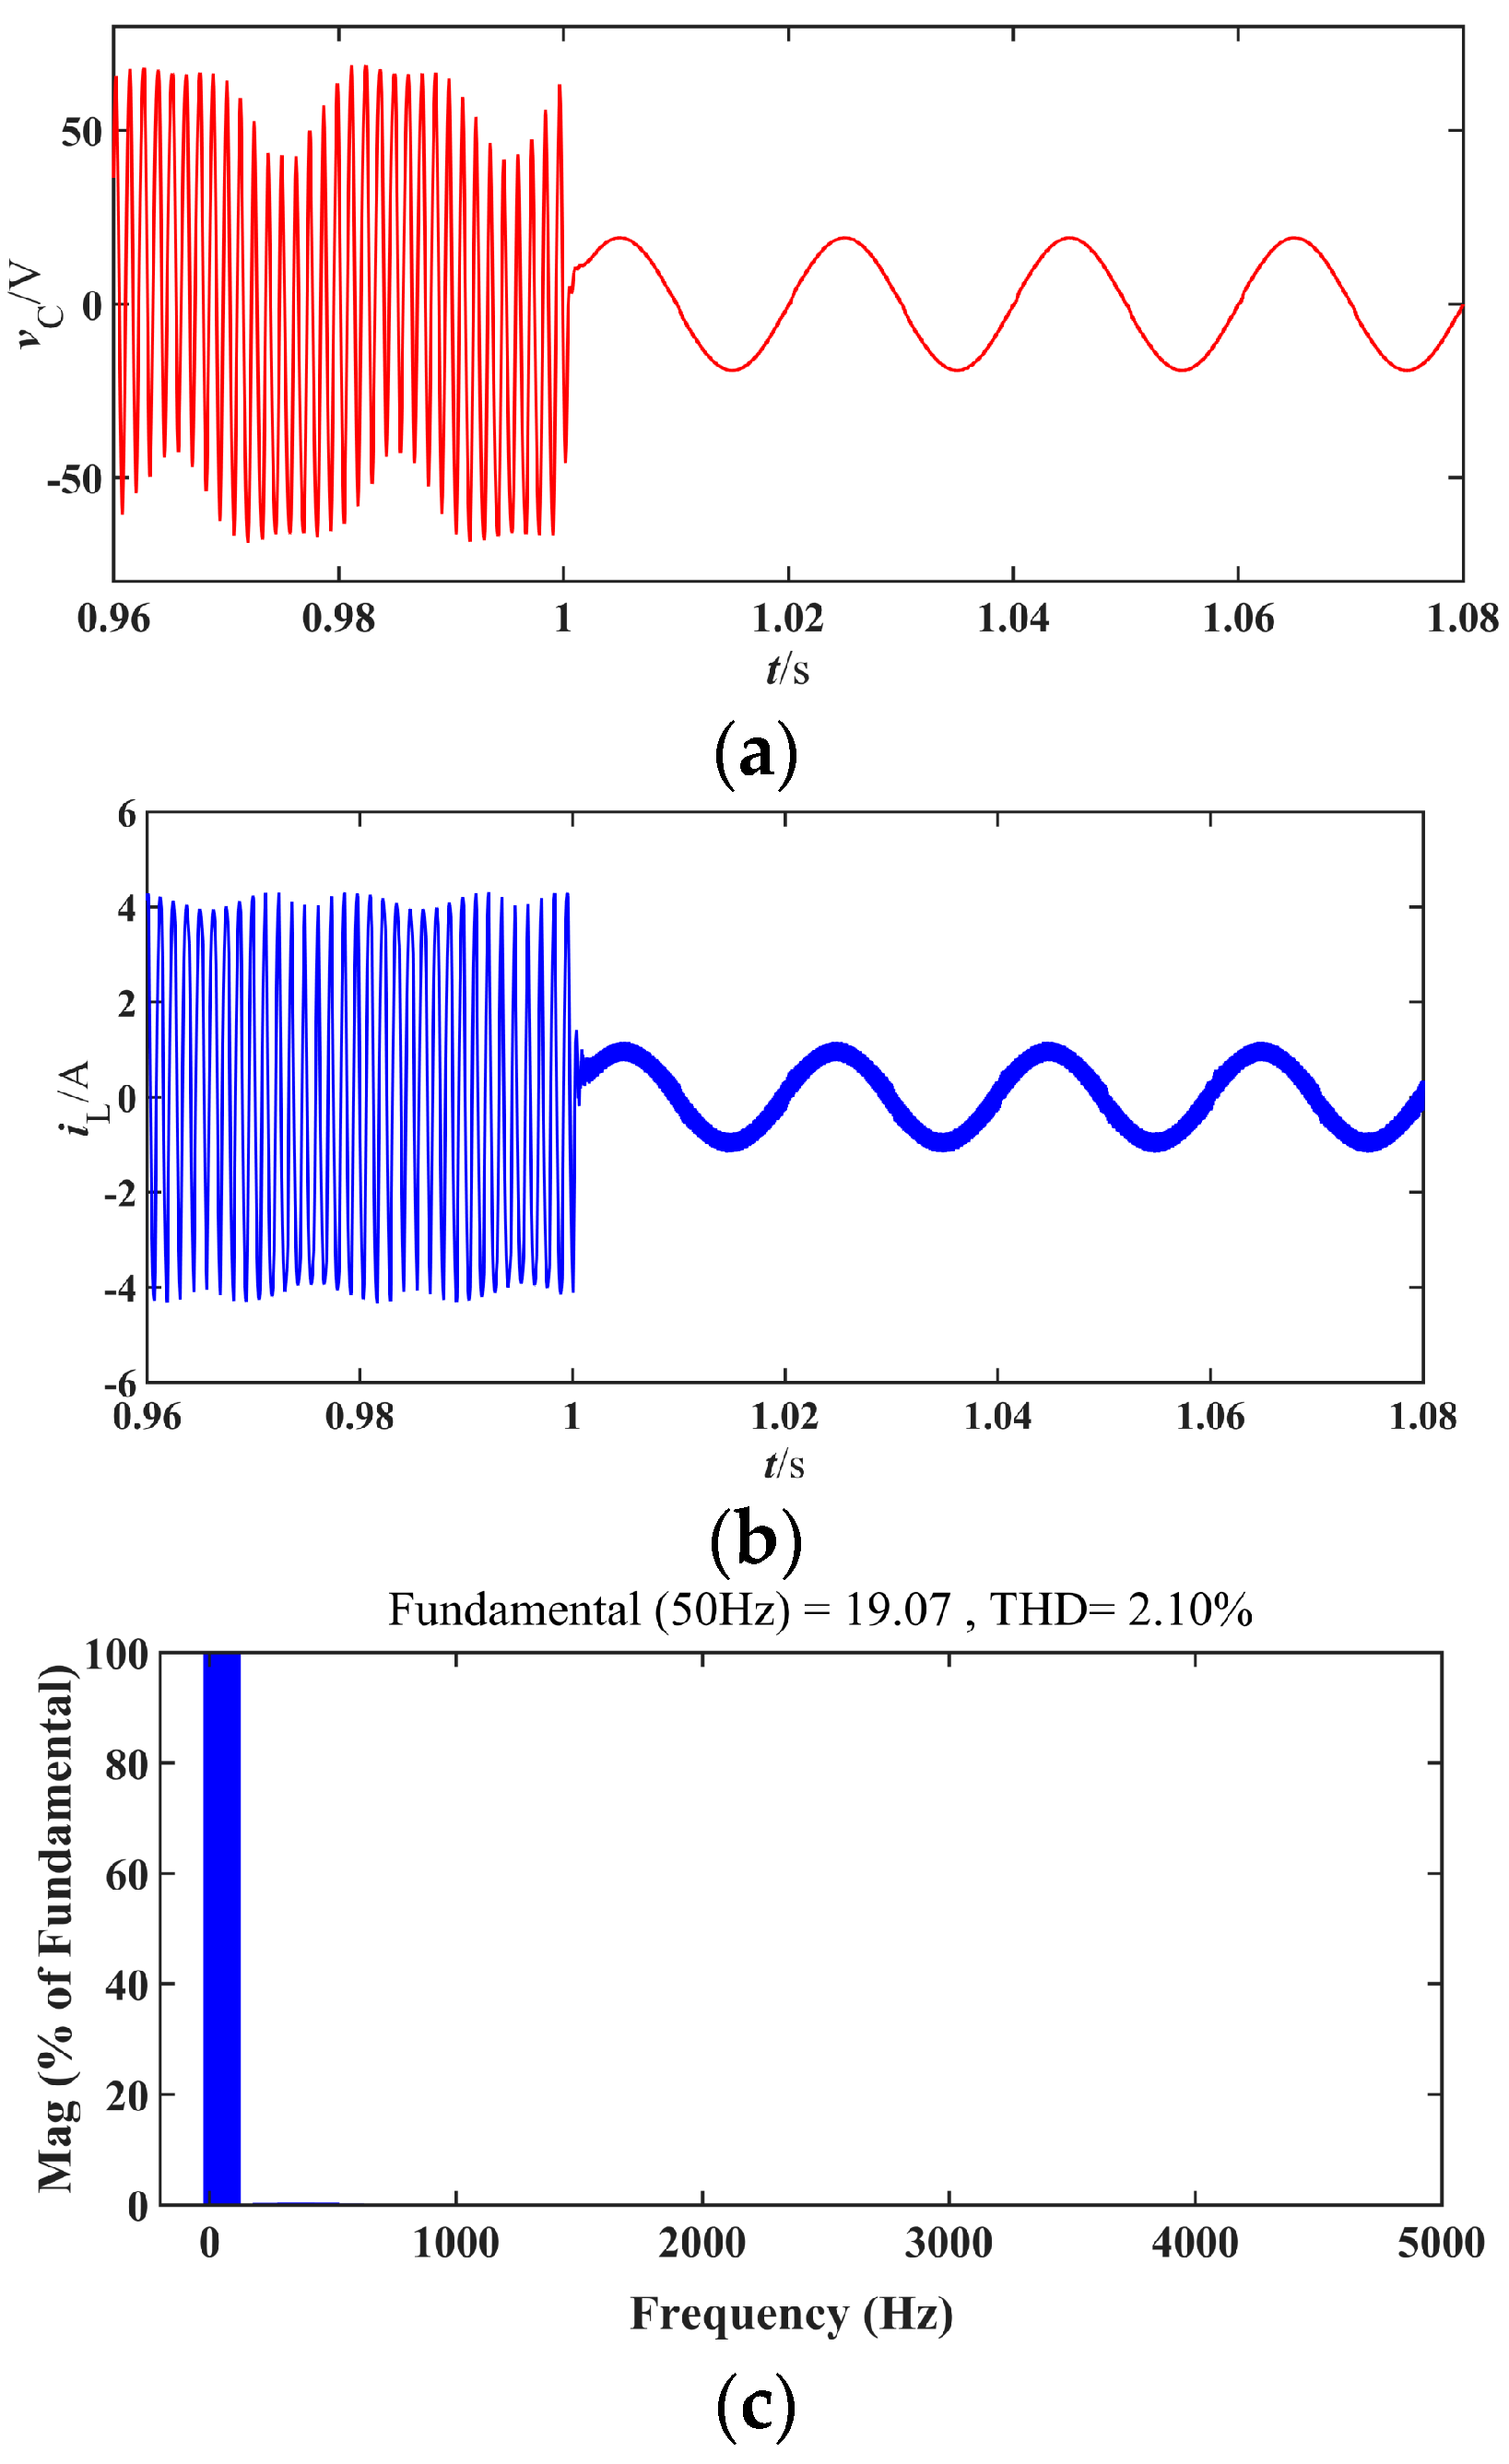
In order to verify the correctness of the theoretical analysis in Section 4.1, a series of simulation experiments are made. Under the standard condition, the simulation results of vC, iL, and THD of vC for kpv = 0.001 A/V are shown in Figure 9. At t = 1 s, the proposed nonlinear control is applied. Additionally, kp1 is set as 2, τ is set as Ts (before that, the control is not applied). It can be seen that when kpv = 0.001 A/V, the system was in a slow-scale unstable state without the control applied, and the output waveforms are seriously distorted, but when the control is applied, the system quickly changes to the stable state from the unstable state, and the waveforms tend to be smooth, and the THD is reduced 302.40% from to 2.10% (as shown in Figure 3c).
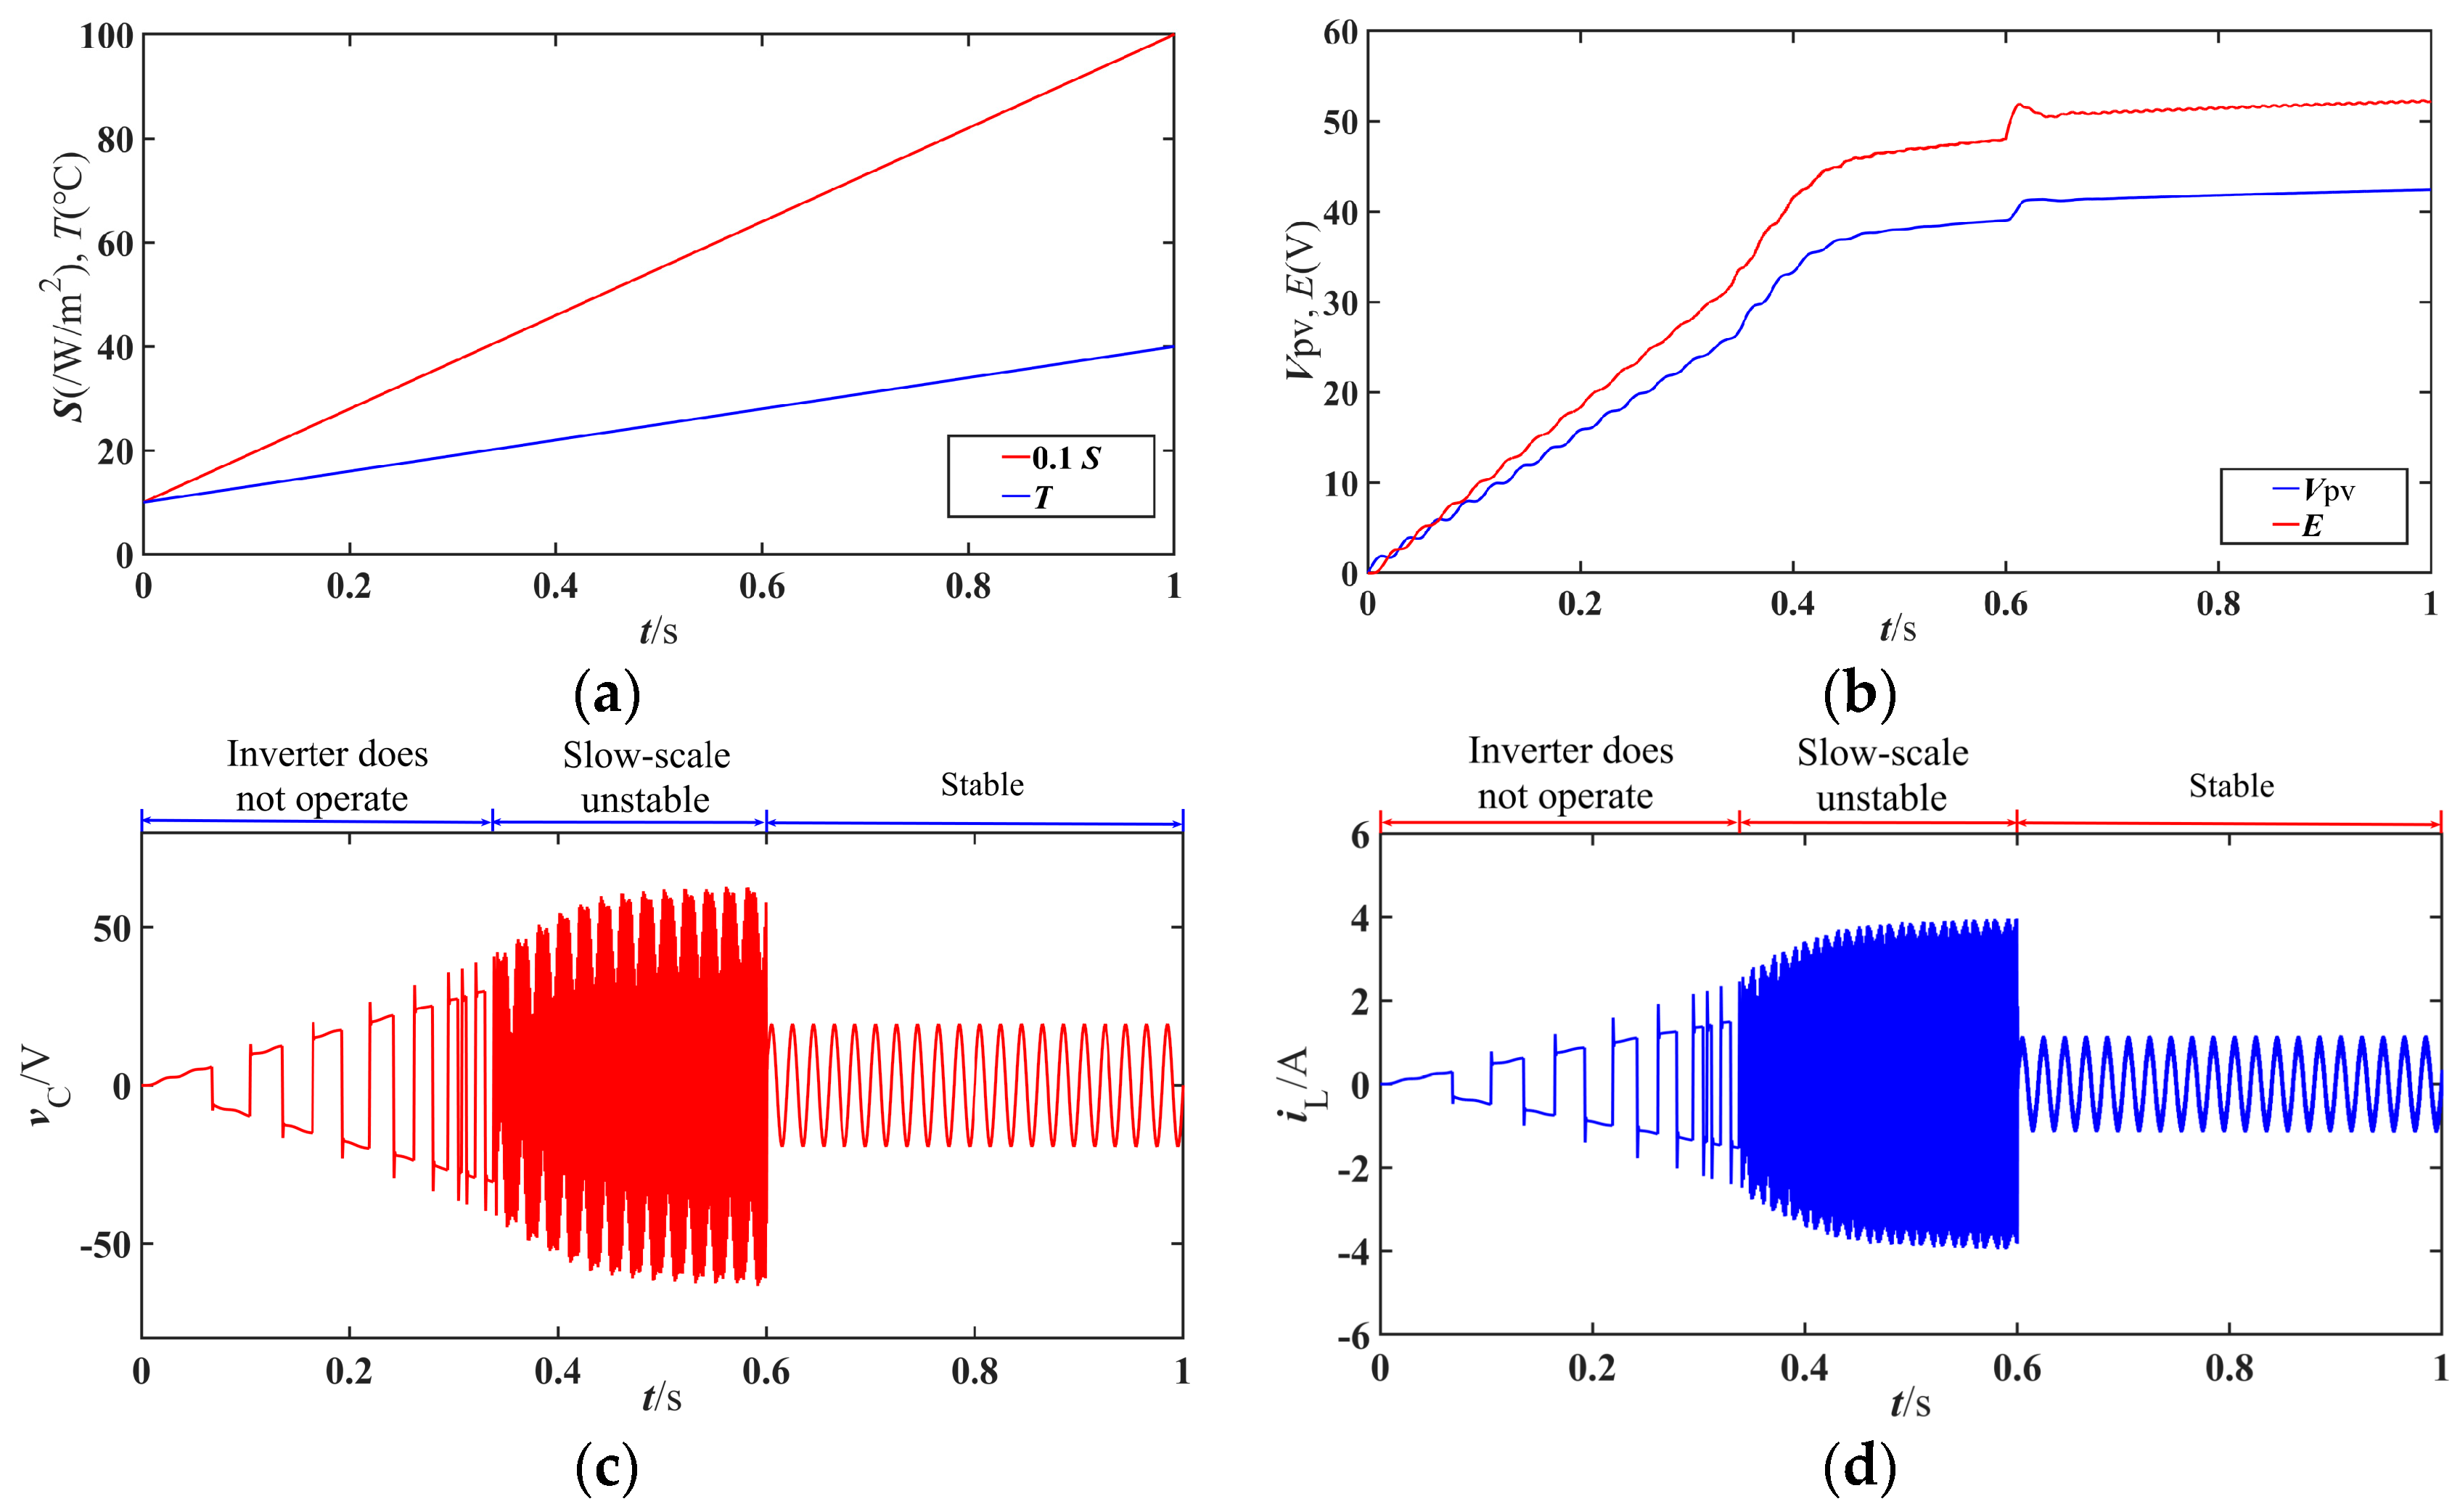
In addition, the influence of sun irradiance and temperature variations on the control effect of the proposed control method was considered, with the other parameters set the same as the above. Figure 10 shows the simulation results. Figure 10a shows that within 1 s, the sun irradiance linearly increases from 100 W/m2 to 1000 W/m2 (0.1 S means that the sun irradiance given in the figure is scaled down by a factor of 0.1), and the temperature linearly increases from 10 °C to 40 °C. Figure 10b shows the case of the nonlinear increase in Vpv and E with the linear increase in the sun irradiance and temperature. From Figure 10c, d, it can be seen that the photovoltaic inverter experiences three operation stages. In the first stage, the inverter does not operate because the input voltage E has not reached the minimum voltage for the inverter to start operating. In the second stage, the inverter operates in a slow-scale unstable state. The waveform exhibits low-frequency oscillations which are caused by Hopf bifurcation. In the third stage, with the proposed control method applied at t = 0.6 s, the system quickly recovers to the stable state.
The simulation results show that with the variations in sun irradiance and temperature considered, even if the photovoltaic inverter operates in the slow-scale unstable state, by using the proposed control method, the slow-scale nonlinear behavior can effectively be eliminated, the output voltage harmonic content can greatly be reduced, stable operation of the system can be ensured, and the operation stability domain can be broadened.

5. Validation of Experimental Results

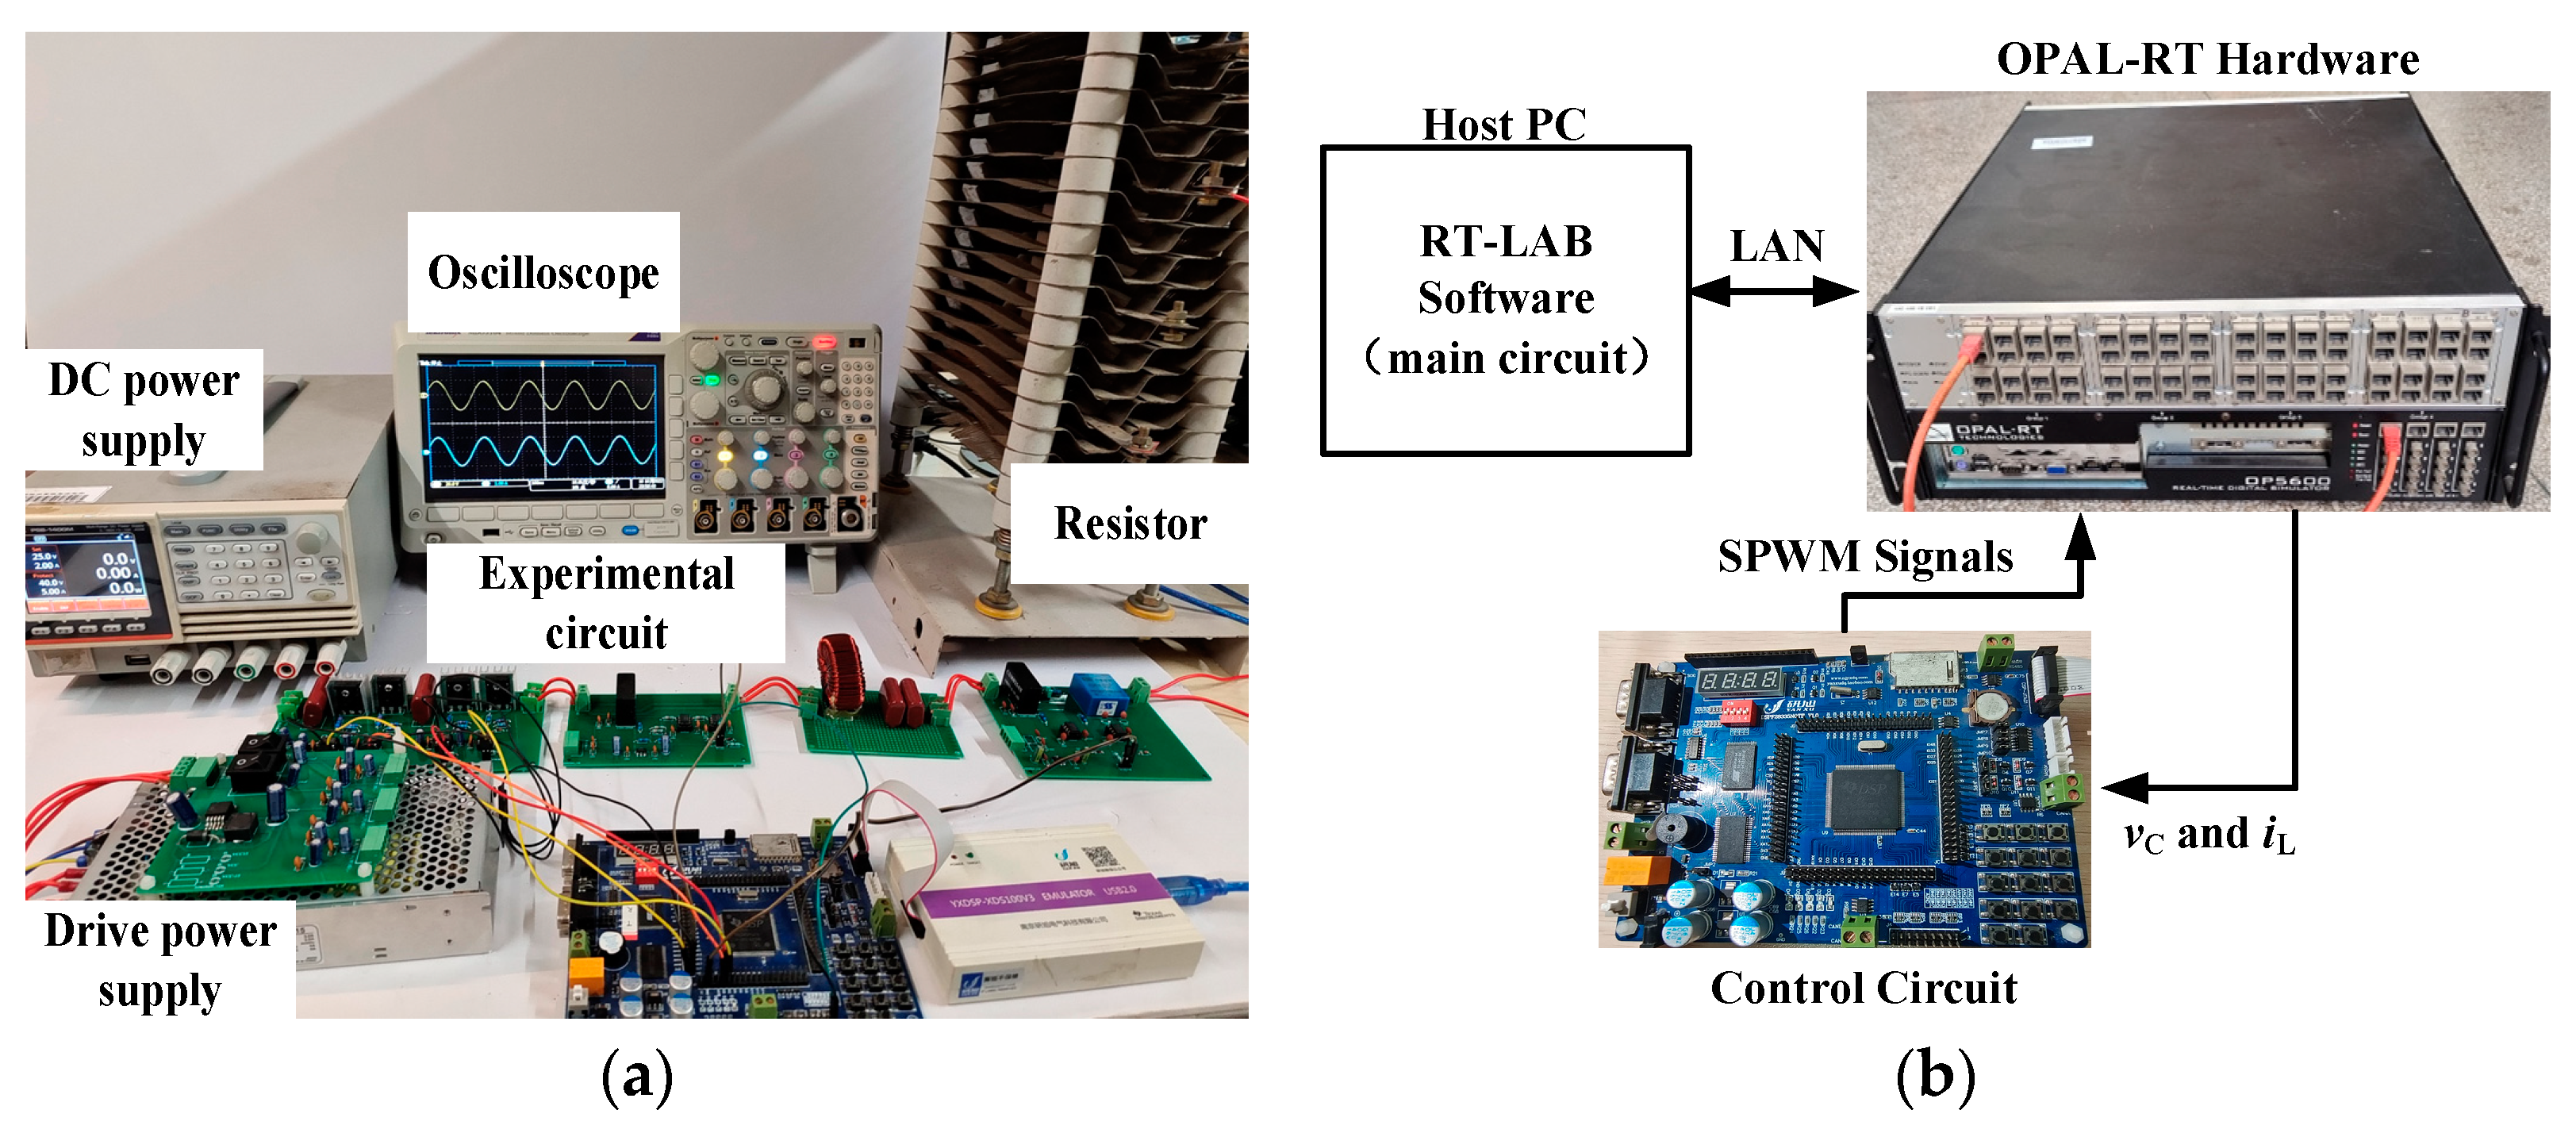
To verify the correctness of the theoretical analysis and simulation results, the experimental platform was built, as shown in Figure 11, and the experiments were conducted according to the simulation parameters configured above. The main devices or equipment and their models of the experimental platform are shown in Table 3. Under standard conditions, the DC power supply can be used as the input power supply. The experimental platform is shown in Figure 11a. Figure 12a illustrates the experimental waveforms of iL and vC for kpv = 0.22 A/V, and it can be seen that the waveforms are smooth and the system operates stably. Figure 12b shows the experimental waveforms of iL and vC with the control applied for kpv = 0.001 A/V. The whole line cycle exhibits oscillations at a frequency lower than the switching frequency with no control. According to theoretical analysis, this slow-scale nonlinear behavior is caused by a Hopf bifurcation, and the system is in a slow-scale unstable state. The waveforms tend to be smooth and sinusoidal with the control applied, and the system also quickly returns to steady-state operation.
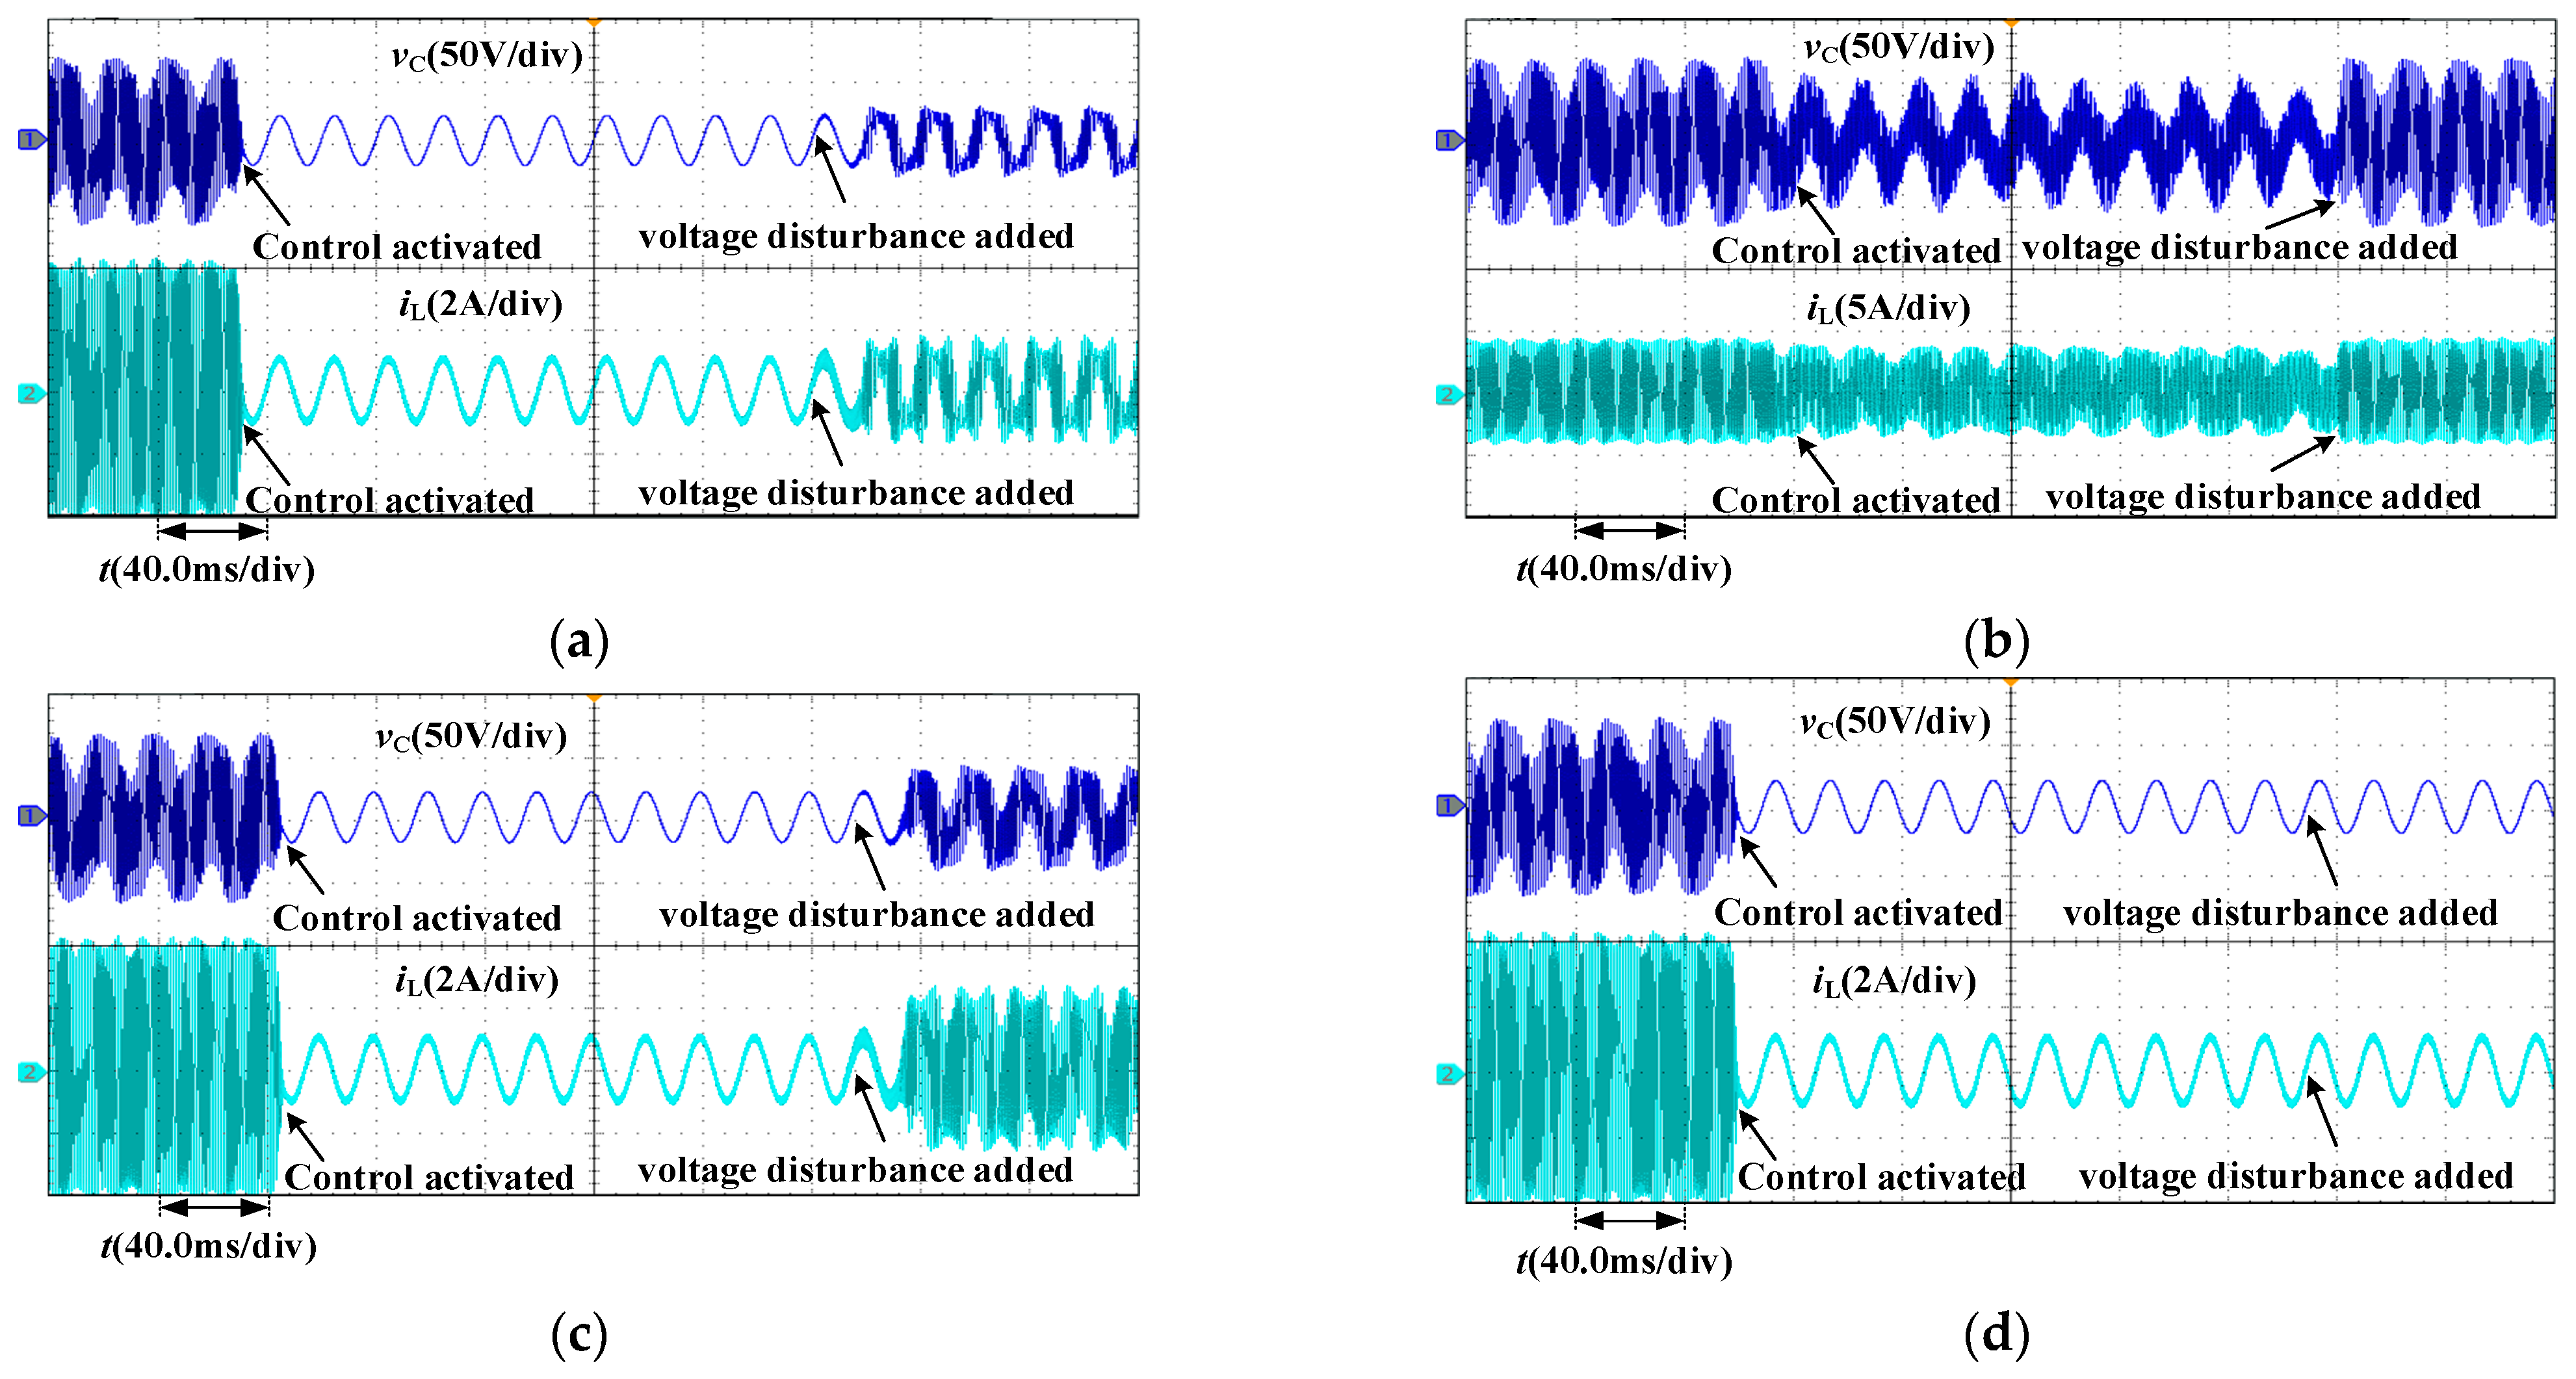
Figure 13a–d shows the experimental results with the system applying Washout filter control [21], fuzzy control [22], adaptive slope compensation control [23], and the proposed control method when kpv = 0.001. It can be seen from Figure 13a,c,d that the waveforms tend to be smooth and sinusoidal with the control methods applied, and the system also quickly returns to steady-state operation. However, from Figure 13b, it can be seen that the distortion of the output waveform can be alleviated by applying fuzzy control, but still not a sinusoidal waveform, and the system is still in a slow-scale unstable state. This indicates that, except for fuzzy control, Washout filter control, adaptive slope compensation control, and the proposed control method can effectively control the slow-scale instability of the system. After these control methods are applied, the voltage disturbance ΔVpv = −5 V is applied. It can be seen from Figure 13a–d that only the proposed method can still effectively control the system to continue stable operation after the voltage disturbance is applied, while other methods cannot control the system to continue stable operation. This indicates that the proposed method has stronger robustness than other methods.
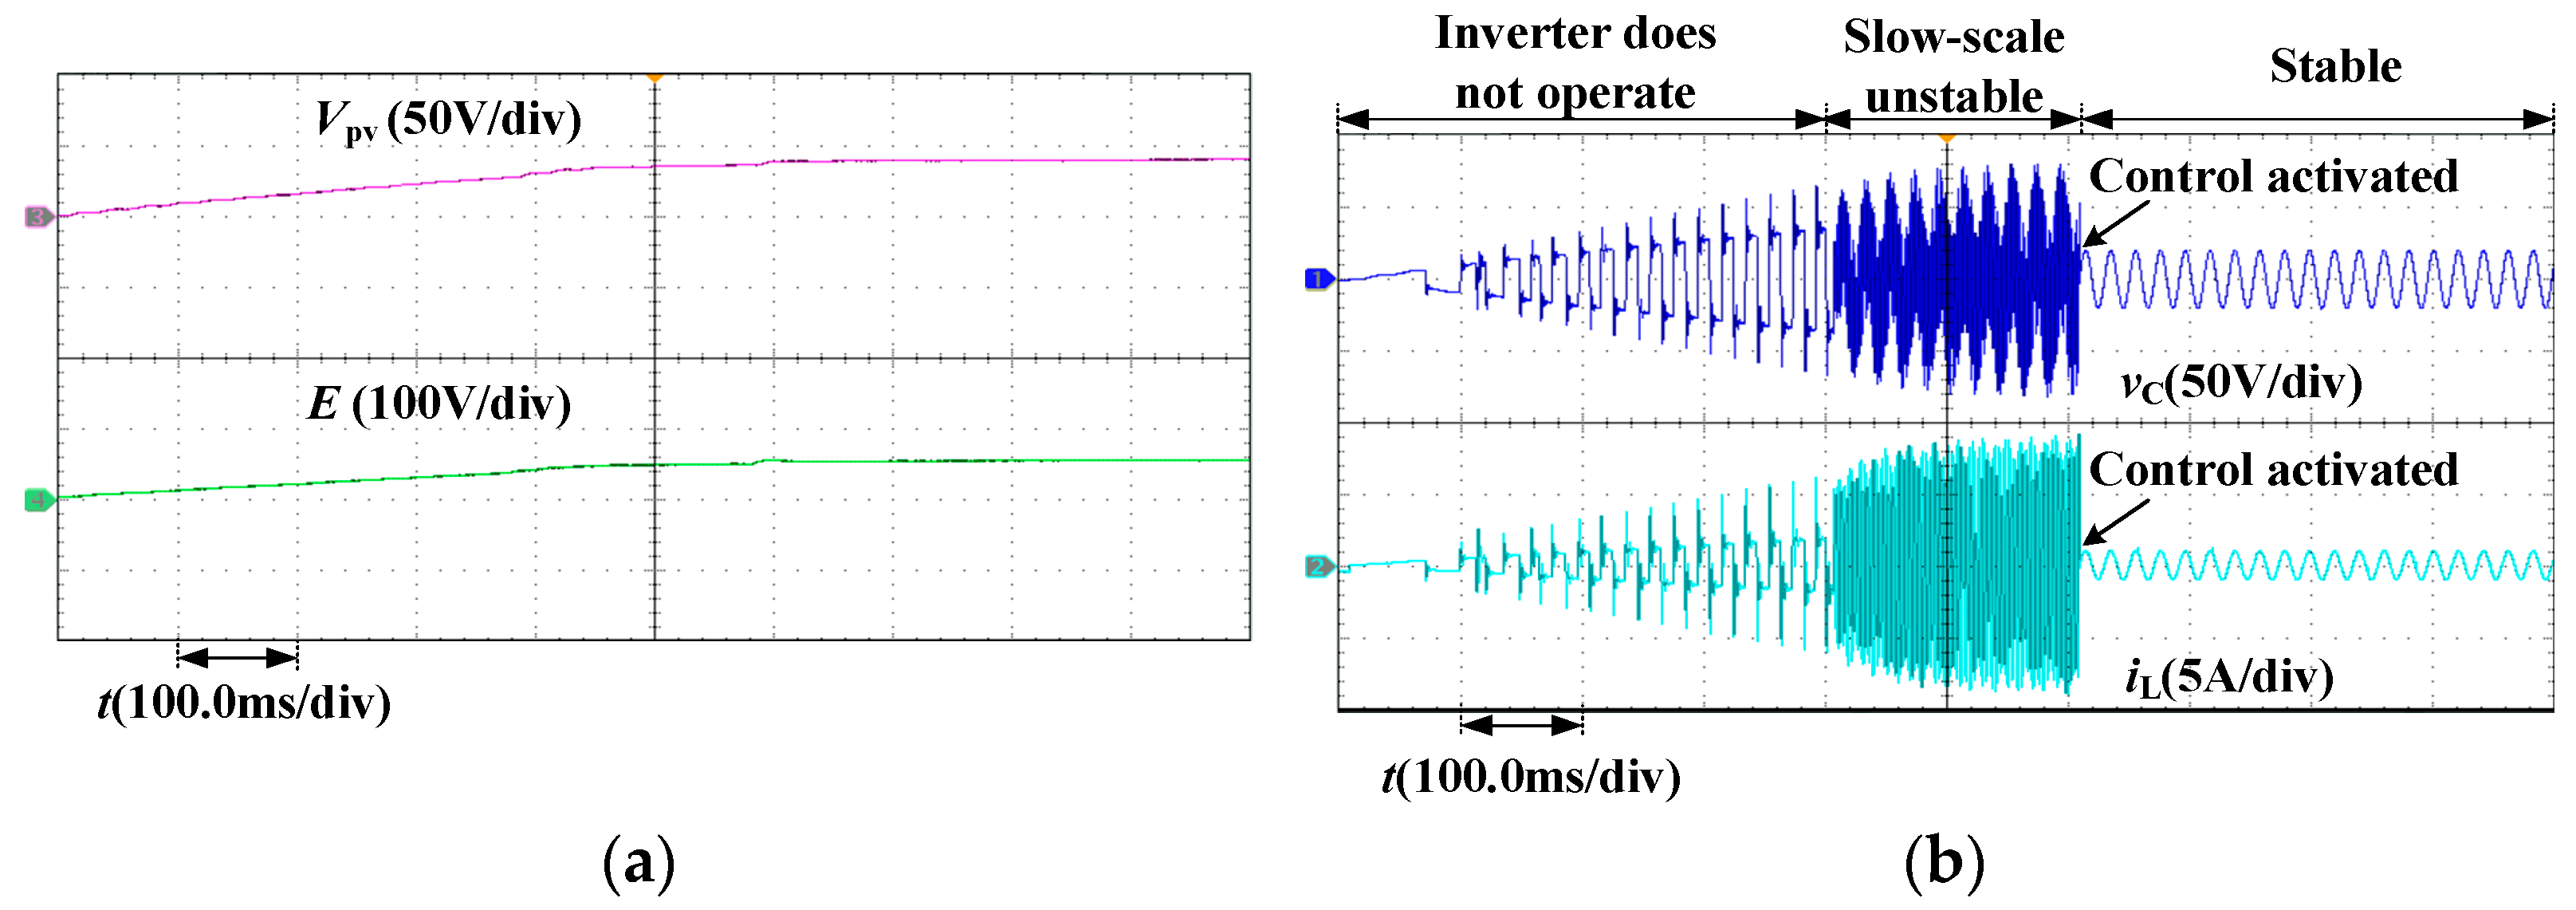
The RT-LAB hardware-in-the-loop simulation platform is used to verify that the proposed control method still has a good control effect when the sun irradiance and temperature change. As shown in Figure 11b, the main circuit is modeled in the RL-LAB software. Additionally, the behavior of the main circuit is simulated by the OPAL-RT hardware. The output voltage vC and inductor current iL are sent to the DSP controller and the SPWM signals are returned to the OPAL-RT hardware. Figure 14a shows the varying curves of Vpv and E when S linearly increases 100 to 1000 W/m2 and T linearly increases 10 °C to 40 °C. Figure 14b shows the three stages of the photovoltaic inverter operation. In the first stage, the inverter does not operate. In the second stage, the inverter is in a slow-scale unstable state. The waveform displays low-frequency oscillations, which are a result of Hopf bifurcation. In the third stage, with the proposed control method applied, the system quickly changes to stable state from the unstable state.
The experimental results show that as kpv decreases, the photovoltaic inverter enters the slow-scale state caused by Hopf bifurcation. With the control method proposed in this paper applied, the slow-scale nonlinear behavior is effectively controlled, and the system rapidly restores to steady state operation. When the sun irradiance and temperature change, the proposed control method still has a good control effect and shows strong robustness. The experimental results are consistent with the theoretical analysis and simulation experimental results.

6. Conclusions

In this paper, in order to effectively control the slow-scale unstable behavior in a photovoltaic inverter, a slow-scale nonlinear control method based on TDFC is proposed, and with the help of numerical analysis, the values of important parameters are quickly determined. The specific principle of the method is described in detail and compared with other methods in experiments. The results obtained show that by the method can simply and effectively determine the value range of the control coefficient and the delay time, avoid complex calculations, effectively eliminate the slow-scale unstable behavior, and greatly reduce the THD of the output voltage. Additionally, the proposed method shows strong robustness when the sun irradiance and temperature vary. In comparison with other methods, the proposed control method is simple to implement without additional circuits, can quickly determine the value of important parameters, and exhibits strong robustness. This paper provides a solution for effectively controlling slow-scale nonlinear behaviors of a high-order converter.

Author Contributions

Conceptualization, Z.Y. and R.G.; methodology, Z.Y. and Y.L.; software, Z.Y.; validation, Z.Y.; writing—original draft preparation, Z.Y.; writing—review and editing, R.G. and Y.L.; project administration, R.G. and Z.Y.; funding acquisition, R.G. and Z.Y. All authors have read and agreed to the published version of the manuscript.

Funding

This research was funded by National Natural Science Foundation of China, grant number 61561007; the Natural Science Foundation of Guangxi, grant number 2017GXNSFAA198168; and the Middle-aged and Young Teachers’ Basic Ability Promotion Project of Guangxi, grant number 2022KY1774.

Data Availability Statement

The data used to support the findings of the study are available within the article.

Conflicts of Interest

The authors declare no conflict of interest.

References

  1. Wang, H.; Wang, X.; Fan, T.; Wang, J.; Lin, Z.; Shen, Y.; Su, J.; Zhang, P. DC Series Arc Fault Detection Method in Photovoltaic System Based on Multiple Frequency Selections for Common-Mode Conductive Voltage. IEEE Trans. Power Electron. 2022, 37, 15538–15553. [Google Scholar] [CrossRef]
  2. Kumaresan, A.; Tafti, H.D.; Kandasamy, N.K.; Glen; Farivar, G.; Pou, J.; Subbaiyan, T. Flexible Power Point Tracking for Solar Photovoltaic Systems Using Secant Method. IEEE Trans. Power Electron. 2021, 36, 9419–9429. [Google Scholar] [CrossRef]
  3. Chen, Y.; Xu, D. Review of Soft-Switching Topologies for Single-Phase Photovoltaic Inverters. IEEE Trans. Power Electron. 2022, 37, 1926–1944. [Google Scholar] [CrossRef]
  4. Yang, L.; Yang, L.; Ma, X. Slow-Scale and Fast-Scale Instabilities in Parallel-Connected Single-Phase H-Bridge Inverters: A Design-Oriented Study. Int. J. Bifurc. Chaos 2020, 30, 2050005. [Google Scholar] [CrossRef]
  5. Asahara, H.; Kousaka, T. Bifurcation Analysis in a PWM Current-Controlled H-Bridge inverter. Int. J. Bifurc. Chaos 2011, 21, 985–996. [Google Scholar] [CrossRef]
  6. Avrutin, V.; Mosekilde, E.; Zhanybai; Zhusubaliyev, T.; Gardini, L. Onset of chaos in a single-phase power electronic inverter. Chaos 2015, 25, 043114. [Google Scholar] [CrossRef]
  7. Avrutin, V.; Zhusubaliyev, Z.T.; Mosekilde, E. Cascades of alternating pitchfork and flip bifurcations in H-bridge inverters. Phys. D 2017, 345, 27–39. [Google Scholar] [CrossRef]
  8. Zhang, H.; Dong, S.; Yi, C.; Guan, W. Fast-scale non-linear distortion analysis of peak-current-controlled buck–boost inverters. Int. J. Electron. 2017, 105, 274–288. [Google Scholar] [CrossRef]
  9. Liu, W.; Wang, F.; Ma, X. Slow-Scale Instability in Voltage-Mode Controlled H-Bridge Inverter with Memristive Load. Int. J. Bifurc. Chaos 2016, 26, 1650200. [Google Scholar] [CrossRef]
  10. Bandyopadhyay, A.; Mandal, K.; Parui, S. A Filippov method based analytical perspective on stability analysis of a DC-AC H-bridge inverter with nonlinear rectifier load. Int. J. Circuit Theory Appl. 2022, 50, 1686–1708. [Google Scholar] [CrossRef]
  11. Cao, H.; Wang, F. Slow-Scale Bifurcation in Three-Level T-Type Inverter With Passive Memristive Load. IEEE Trans. Ind. Electron. 2022, 69, 7963–7973. [Google Scholar] [CrossRef]
  12. Yang, F.; Yang, L.; Ma, X. Fast-Scale Bifurcation Analysis in One-Cycle Controlled H-Bridge Inverter. Int. J. Bifurc. Chaos 2016, 26, 1650199. [Google Scholar] [CrossRef]
  13. Zhang, H.; Wan, X.; Li, W.; Ding, H.; Yi, C. Observer-Pattern Modeling and Slow-Scale Bifurcation Analysis of Two-Stage Boost Inverters. Int. J. Bifurc. Chaos 2017, 27, 1750096. [Google Scholar] [CrossRef]
  14. Kavitha, A.; Uma, G. Control of chaos in SEPIC DC-DC converter. Int. J. Control Autom. Syst. 2010, 8, 1320–1329. [Google Scholar] [CrossRef]
  15. Bao, B.C.; Xu, J.P.; Liu, Z. Mode shift and stability control of a current mode controlled buck-boost converter operating in discontinuous conduction mode with ramp compensation. Chin. Phys. B 2009, 18, 4742–4747. [Google Scholar]
  16. Cao, L.; Pan, Y.N.; Liang, H.J.; Huang, T.W. Observer-Based Dynamic Event-Triggered Control for Multiagent Systems with Time-Varying Delay. IEEE Trans. Cybern. 2023, 53, 3376–3387. [Google Scholar] [CrossRef] [PubMed]
  17. Zhao, G.T.; Cao, L.; Li, X.M.; Zhou, Q. Observer-based dynamic event-triggered control for nonstrict-feedback stochastic nonlinear multiagent systems. Appl. Math. Comput. 2022, 430, 127289. [Google Scholar] [CrossRef]
  18. Zhang, L.L.; Che, W.W.; Chen, B.; Lin, C. Adaptive Fuzzy Output-Feedback Consensus Tracking Control of Nonlinear Multiagent Systems in Prescribed Performance. IEEE Trans. Cybern. 2023, 53, 1932–1943. [Google Scholar] [CrossRef]
  19. Roopaei, M.; Sahraei, B.R.; Lin, T.C. Adaptive sliding mode control in a novel class of chaotic systems. Commun. Nonlinear Sci. Numer. Simul. 2010, 15, 4158–4170. [Google Scholar] [CrossRef]
  20. Ma, W.; Wang, L.; Zhang, R.; Li, J.; Dong, Z.; Zhang, Y.; Hu, M.; Liu, S. Hopf Bifurcation and Its Control in the One-Cycle Controlled Cuk Converter. IEEE Trans. Circuits Syst. II Express Briefs 2019, 66, 1411–1415. [Google Scholar] [CrossRef]
  21. Ma, W.; Wang, M.; Li, C. Control of bifurcation in the one-cycle controlled Cuk converter. Nonlinear Dyn. 2012, 67, 2573–2583. [Google Scholar] [CrossRef]
  22. Fu, C.-B.; Tian, A.-H.; Yu, K.-N.; Lin, Y.-H.; Yau, H.-T. Analyses and Control of Chaotic Behavior in DC-DC Converters. Math. Probl. Eng. 2018, 2018, 7439137. [Google Scholar] [CrossRef]
  23. Morcillo, J.; Burbano, D.; Angulo, F. Adaptive Ramp Technique for Controlling Chaos and Subharmonic Oscillations in DC–DC Power Converters. IEEE Trans. Power Electron. 2016, 31, 5330–5343. [Google Scholar] [CrossRef]
  24. Pyragas, K. Continuous control of chaos by self-controlling feedback. Phys. Lett. A 1992, 170, 421–428. [Google Scholar] [CrossRef]
  25. Telles Ribeiro, J.G.; Pereira, M.; Cunha, A., Jr.; Lovisolo, L. Controlling chaos for energy harvesting via digital extended time-delay feedback. Eur. Phys. J. Spec. Top. 2022, 231, 1485–1490. [Google Scholar] [CrossRef]
  26. Park, M.J.; Lee, S.H.; Kaviarasan, B.; Kwon, O.M. Secure Communication in Complex Dynamical Networks via Time-Delayed Feedback Control. IEEE Trans. Syst. Man. Cybern. Syst. 2022, 53, 1116–1125. [Google Scholar] [CrossRef]
  27. Hong, G.; Zhongmin, D.; Yanlin, Z.; Hongbo, Y.; Xinjie, Z.; Lingzi, M.; Qi, L. Time-delayed feedback control of nonlinear dynamics in a giant magnetostrictive actuator. Nonlinear Dyn. 2022, 108, 1371–1394. [Google Scholar] [CrossRef]
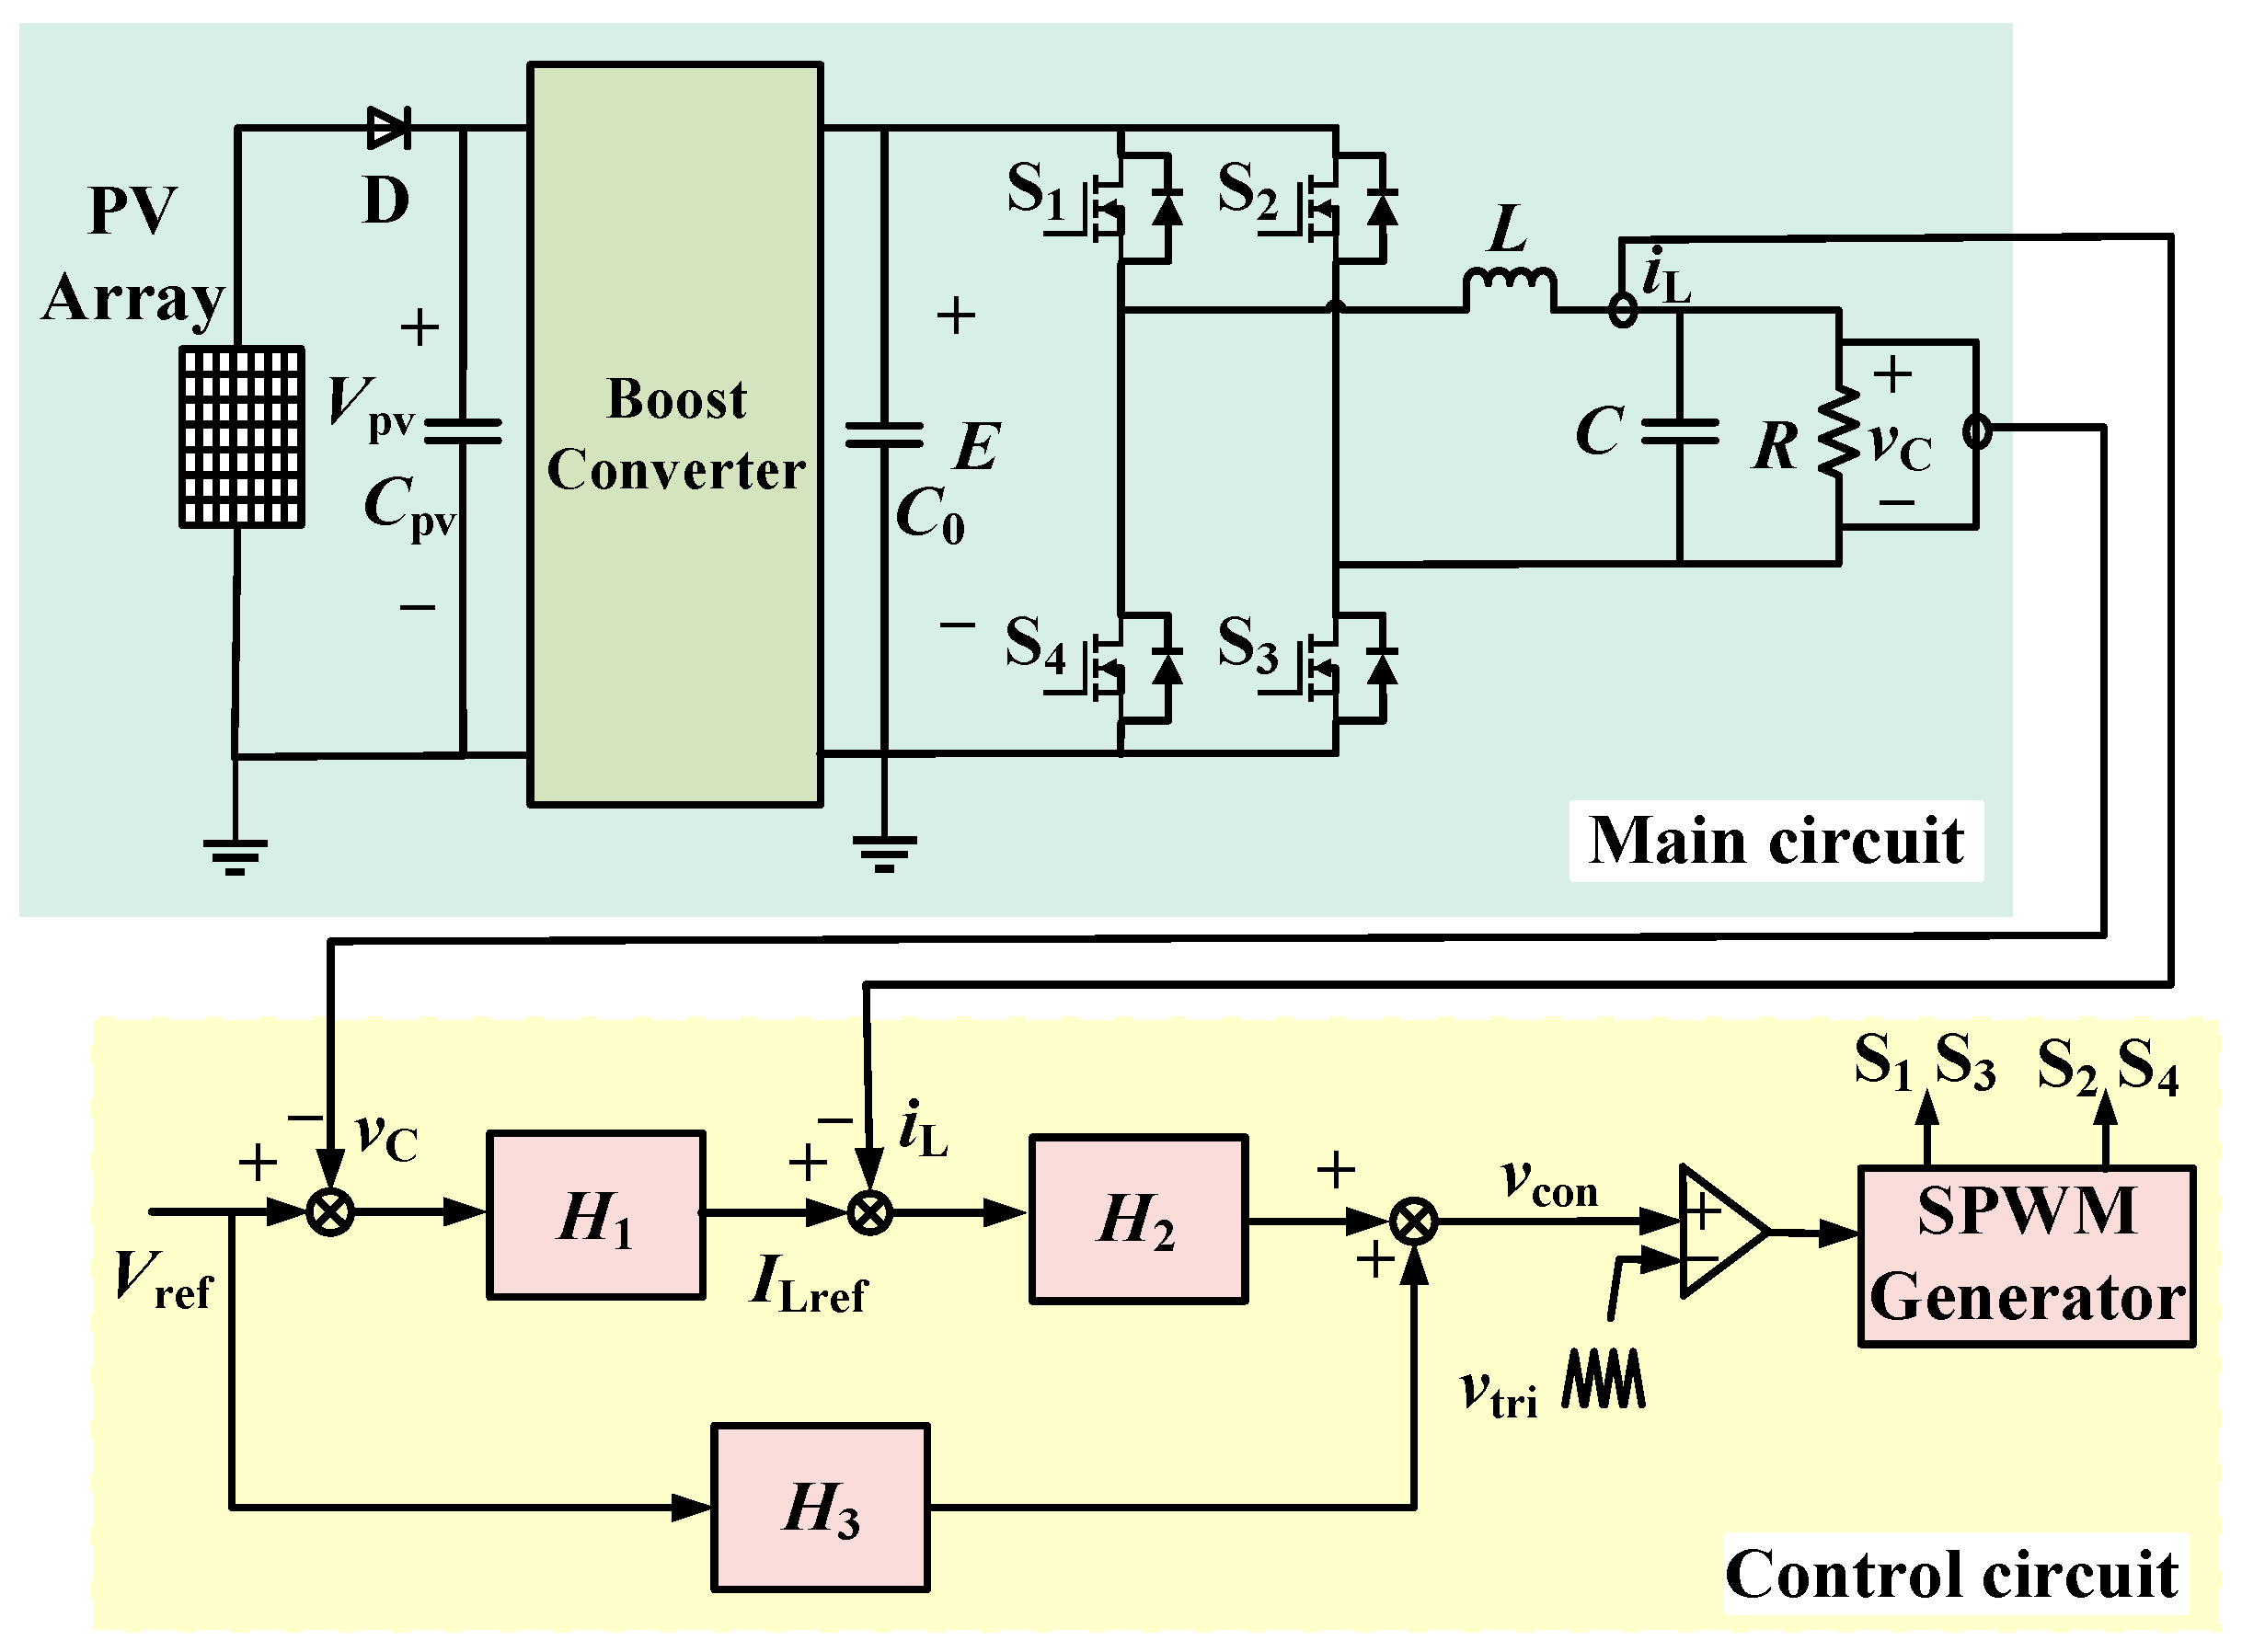
Figure 1. Schematic diagram of a single-phase H-bridge photovoltaic inverter under dual closed-loop PI regulation plus a given voltage feedforward control.
Electronics 12 02000 g001
Figure 2. Numerical simulation results of related parameters for kpv = 0.22 A/V: (a) time-domain waveform of vC; (b) time-domain waveform of iL; (c) spectrum diagram of vC.
Electronics 12 02000 g002aElectronics 12 02000 g002b
Figure 3. Numerical simulation results of related parameters for kpv = 0.001 A/V: (a) time-domain waveform of vC; (b) time-domain waveform of iL; (c) spectrum diagram of vC.
Electronics 12 02000 g003
Figure 4. Control circuit schematic diagram with the slow-scale nonlinear control based on TDFC added.
Electronics 12 02000 g004
Figure 5. Varying trajectories of the real part of eigenvalue λm (m = 1, 2, 3, 4, 5, 6) with kpv = 0.001 A/V and kp1 is −5~5.
Electronics 12 02000 g005
Figure 6. Varying trajectories of the largest Lyapunov exponent with τ.
Electronics 12 02000 g006
Figure 7. Varying trajectories of eigenvalues λm (m = 1, 2, 3, 4, 5, 6) with kpv in 0.001~0.3 for kp1 = 2 and τ= Ts.
Electronics 12 02000 g007
Figure 8. Varying trajectories of the largest Lyapunov exponent with Vpv when applying the proposed control.
Electronics 12 02000 g008
Figure 9. Numerical simulation results of related parameters with kpv = 0.001 A/V, kp1 = 2, and τ = Ts: (a) time-domain waveform of vC; (b) time-domain waveform of iL; (c) spectrum diagram of vC with the control applied.
Electronics 12 02000 g009
Figure 10. Numerical simulation results with variations in sun irradiance and temperature: (a) variation curves of S and T; (b) variation curves of Vpv and E, (c) time-domain waveform of vC; (d) time-domain waveform of iL.
Electronics 12 02000 g010
Figure 11. Experimental platform: (a) experimental platform of the H-bridge inverter based on dual-loop PI regulation; (b) RTLAB hardware-in-the-loop simulation platform.
Electronics 12 02000 g011
Figure 12. Experimental results: (a) kpv = 0.22 A/V; (b) kpv = 0.001 A/V with the control applied.
Electronics 12 02000 g012
Figure 13. Comparative experimental results of the proposed control method with other methods: (a) with Washout filter control applied; (b) with fuzzy control applied; (c) with adaptive slope compensation control applied; (d) with the proposed control method applied.
Electronics 12 02000 g013
Figure 14. Experimental results with S varying from 100 to 1000 W/m2 and T varying from 10 °C to 40 °C: (a) time-domain waveforms of Vpv and E; (b) time-domain waveforms of vC and iL.
Electronics 12 02000 g014
Table 1. Circuit parameter values.
Circuit ParametersValues
PV array output voltage under the standard condition Vpv42 V
Duty cycle of the Boost converter d0.2
DC side input voltage E1.25 Vpv
Inductance L4 mH
Capacitance C10 uF
Resistance R20 Ω
Switching period Ts5 × 10−5 s
Given reference voltage frequency f50 Hz
Given reference voltage amplitude Vrefm20 V
Outer loop integral control coefficient kiv2000 A/(V∗s)
Inner loop proportional control coefficient kpc0.5 V/A
Inner loop integral control coefficient kic1000 V/(A∗s)
Given voltage feedforward control coefficient kp1
Maximum value of vtri (VH)1
Minimum value of vtri (VL)−1
Table 2. Eigenvalues for different values of kpv.
kpvλ1,2λ3λ4State
0.3−1939 ± 14852i−2098−5524Stable
0.22−1188 ± 13256i−2086−7038Stable
0.18−716 ± 12488i−2081−7987Stable
0.12620 ± 11531i−2075−9425Hopf bifurcation
0.10368 ± 11105i−2072−10,164Unstable
0.051078 ± 10360i−2068−11,589Unstable
0.0051704 ± 9755i−2064−12,844Unstable
0.0011759 ± 9703i−2064−12,954Unstable
Table 3. Main devices or equipment in the experimental platform.
Device or EquipmentManufacturer ModelDevice or EquipmentManufacturer Model
DiodeRHRP860Power MOSFETIRFP360
Driver chipHCPL-3120Current sensorCSM025AY
Voltage sensorCHV-25POperational amplifierTL071CP
Digital signal processorTMSF28335OPAL-RT hardwareOP5600
Disclaimer/Publisher’s Note: The statements, opinions and data contained in all publications are solely those of the individual author(s) and contributor(s) and not of MDPI and/or the editor(s). MDPI and/or the editor(s) disclaim responsibility for any injury to people or property resulting from any ideas, methods, instructions or products referred to in the content.