
A Comparison of Dynamic Gait Stability between the Young and Elderly Female Populations Using the Zero-Moment Point Method

 , , ,
, , ,
Abstract
:1. Introduction
2. Materials and Methods
2.1. ZMP Analysis
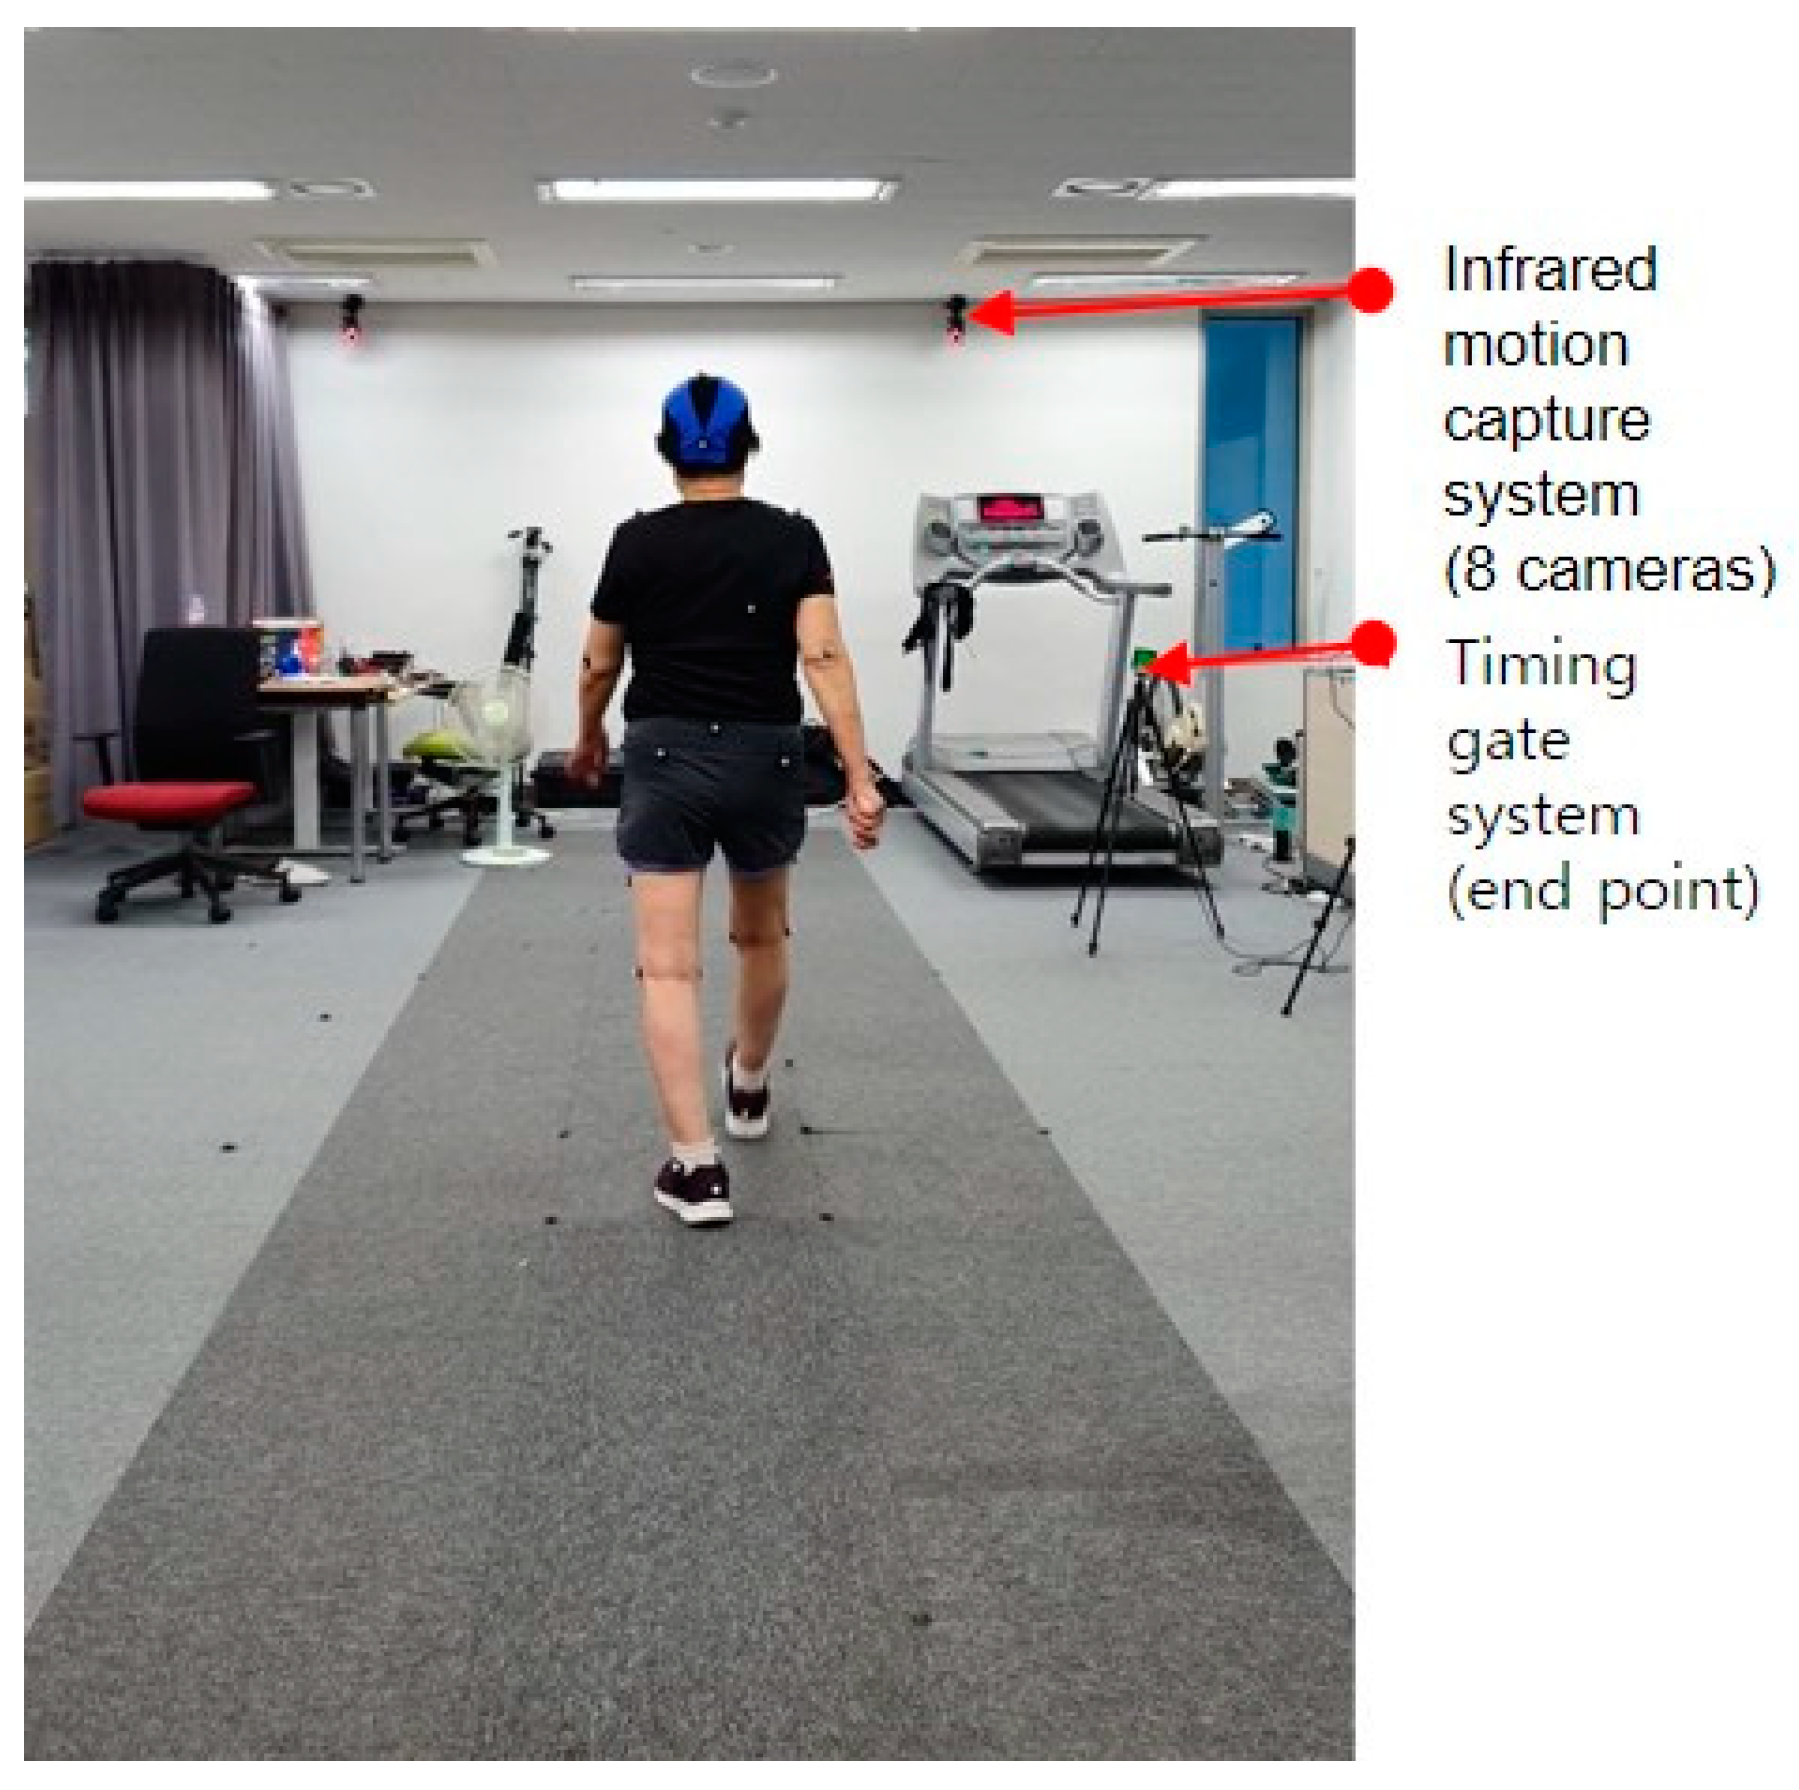
2.2. Experiments
2.3. Data Analysis
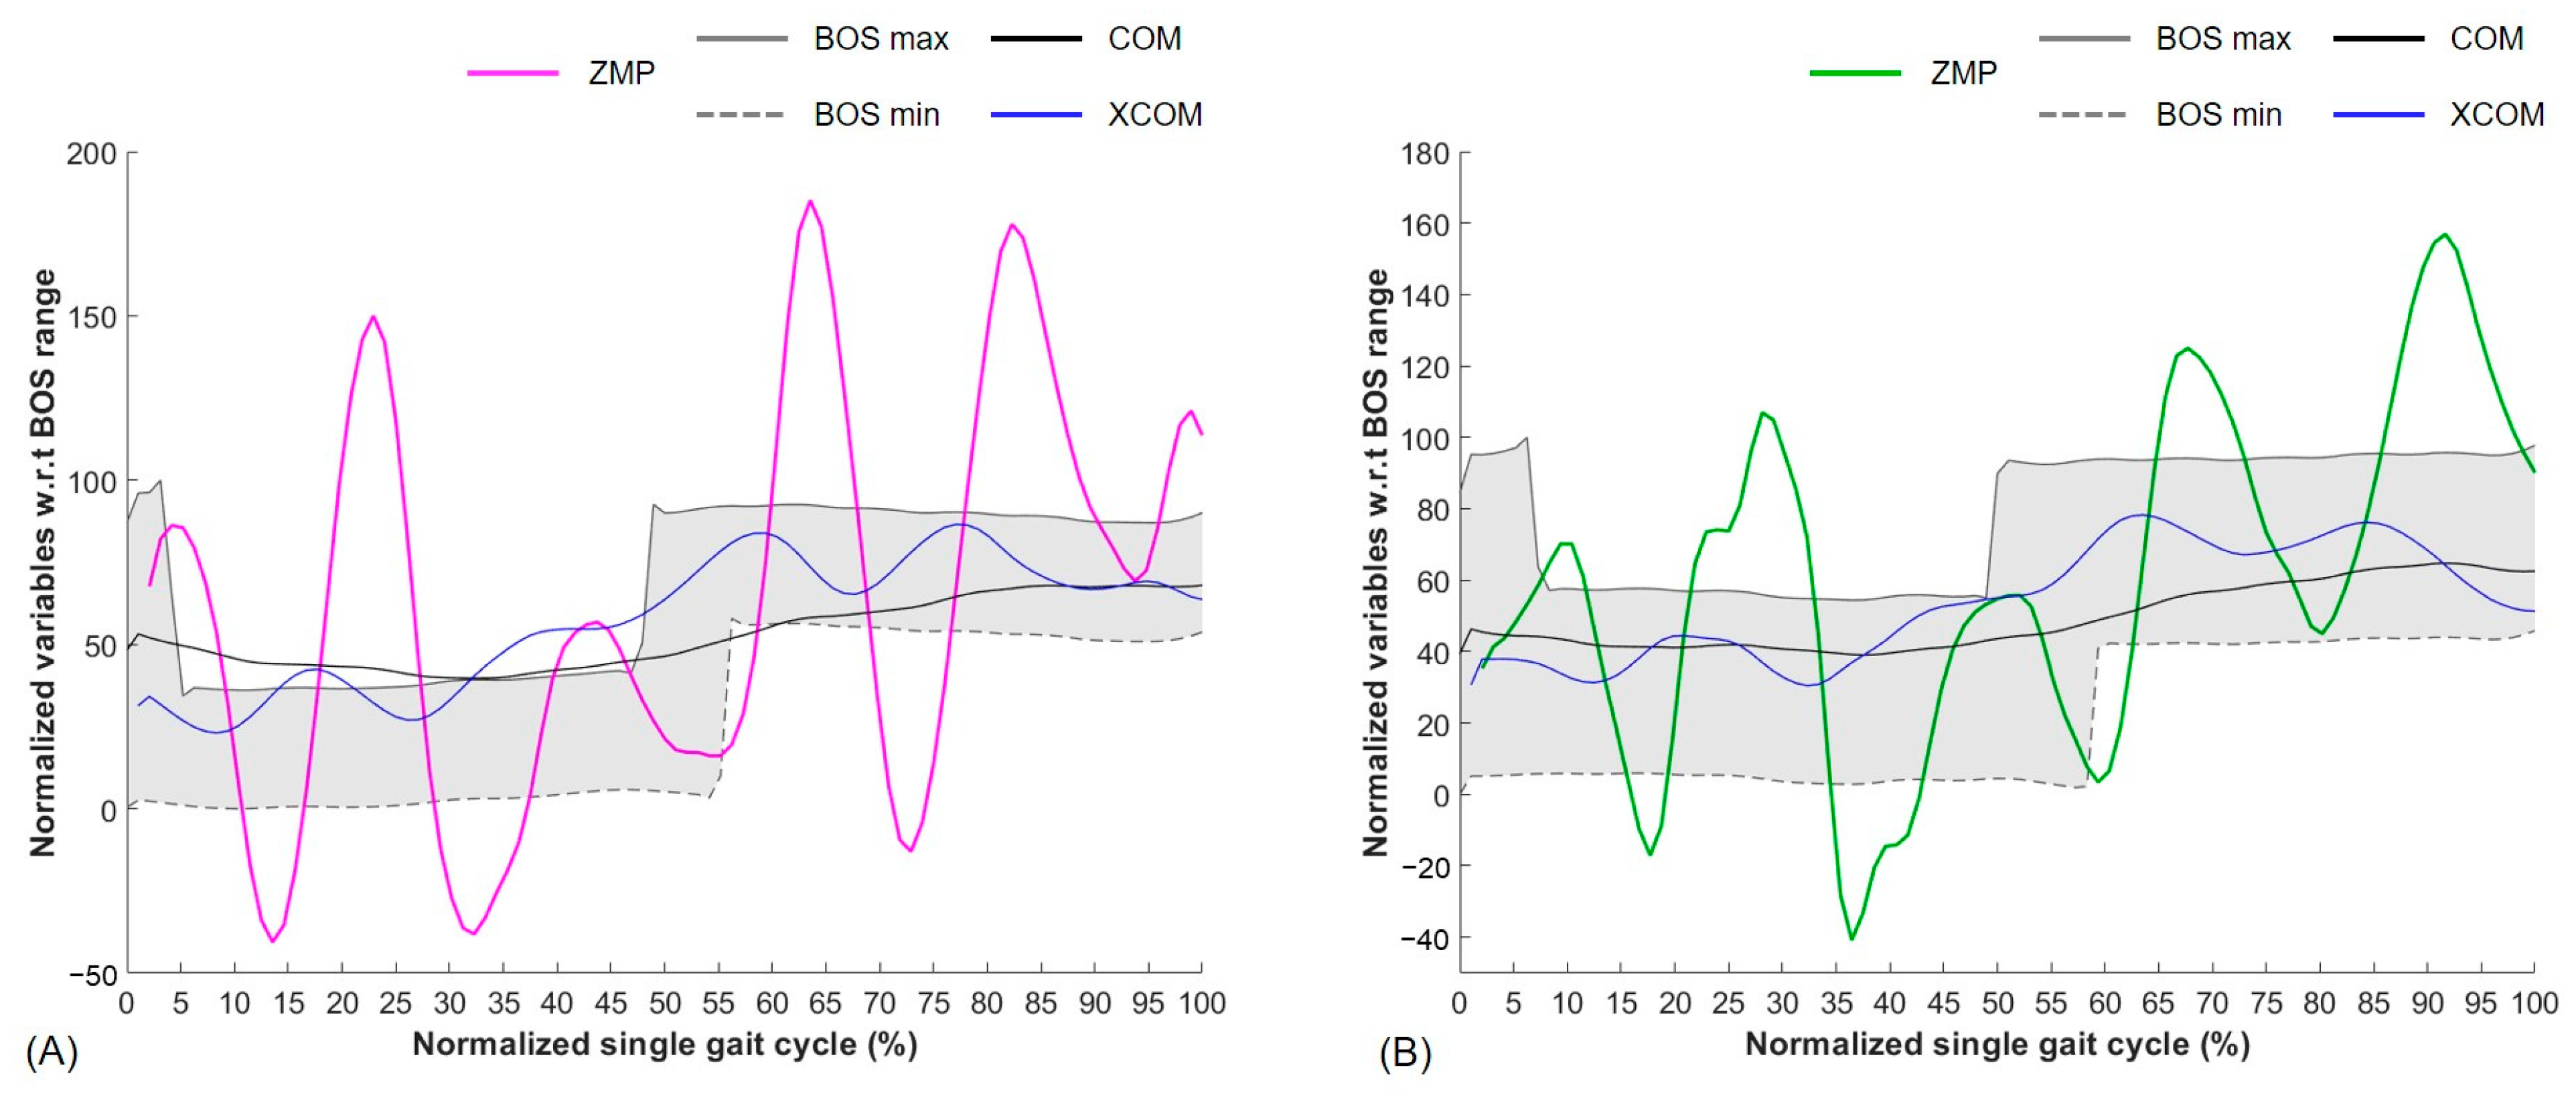
3. Results

4. Discussion
5. Conclusions
Author Contributions
Funding
Institutional Review Board Statement
Informed Consent Statement
Data Availability Statement
Acknowledgments
Conflicts of Interest
References
- Baker, S.P.; Harvey, A.H. Fall injuries in the elderly. Clin. Geriatr. Med. 1985, 1, 501–512. [Google Scholar] [CrossRef] [PubMed]
- Sambrook, P.N.; Cameron, I.D.; Chen, J.S.; Cumming, R.G.; Lord, S.R.; March, L.M.; Schwarz, J.; Seibel, M.J.; Simpson, J.M. Influence of fall related factors and bone strength on fracture risk in the frail elderly. Osteoporos. Int. 2007, 18, 603–610. [Google Scholar] [CrossRef] [PubMed]
- Bahari, H.; Forero, J.; Hall, J.C.; Hebert, J.S.; Vette, A.H.; Rouhani, H. Use of the extended feasible stability region for assessing stability of perturbed walking. Sci. Rep. 2021, 11, 1026. [Google Scholar] [CrossRef] [PubMed]
- Nevitt, M.C.; Cummings, S.R.; Kidd, S.; Black, D. Risk factors for recurrent nonsyncopal falls. A prospective study. JAMA 1989, 261, 2663–2668. [Google Scholar] [CrossRef] [PubMed]
- Wu, G.; Xue, S. Portable preimpact fall detector with inertial sensors. IEEE Trans. Neural Syst. Rehabil. Eng. 2008, 16, 178–183. [Google Scholar] [CrossRef] [PubMed]
- Nyan, M.N.; Tay, F.E.; Murugasu, E. A wearable system for pre-impact fall detection. J. Biomech. 2008, 41, 3475–3481. [Google Scholar] [CrossRef]
- Ahn, S.; Kim, J.; Koo, B.; Kim, Y. Evaluation of Inertial Sensor-Based Pre-Impact Fall Detection Algorithms Using Public Dataset. Sensors 2019, 19, 774. [Google Scholar] [CrossRef]
- Bagala, F.; Becker, C.; Cappello, A.; Chiari, L.; Aminian, K.; Hausdorff, J.M.; Zijlstra, W.; Klenk, J. Evaluation of accelerometer-based fall detection algorithms on real-world falls. PLoS ONE 2012, 7, e37062. [Google Scholar] [CrossRef]
- Mariello, M.; Fachechi, L.; Guido, F.; Vittorio, M.D. Conformal, Ultra-thin Skin-Contact Actuated Hybrid Piezo-/Triboelectric Wearable Sensor Based on AIN and Parylene-Encapsulated Elastomeric Blend. Adv. Funct. Mater. 2021, 31, 2101047. [Google Scholar] [CrossRef]
- Pu, X.; An, S.; Tang, Q.; Guo, H.; Hu, C. Wearable triboelectric sensors for biomedical monitoring and human-machine interface. iScience 2021, 24, 102027. [Google Scholar] [CrossRef]
- Zarzeczny, R.; Nawrat-Szołtysik, A.; Polak, A.; Maliszewski, J.; Kiełtyka, A.; Matyja, B.; Dudek, M.; Zborowska, J.; Wajdman, A. Aging effect on the instrumented Timed-Up-and-Go test variables in nursing home women aged 80–93 years. Biogerontology 2017, 18, 651–663. [Google Scholar] [CrossRef] [PubMed]
- Berg, K.O.; Maki, B.E.; Williams, J.I.; Holliday, P.J.; Wood-Dauphinee, S.L. Clinical and laboratory measures of postural balance in an elderly population. Arch. Phys. Med. Rehabil. 1992, 73, 1073–1080. [Google Scholar] [PubMed]
- Hak, L.; Houdijk, H.; Beek, P.J.; van Dieen, J.H. Steps to take to enhance gait stability: The effect of stride frequency, stride length, and walking speed on local dynamic stability and margins of stability. PLoS ONE 2013, 8, e82842. [Google Scholar] [CrossRef] [PubMed]
- Hof, A.L.; Gazendam, M.G.; Sinke, W.E. The condition for dynamic stability. J. Biomech. 2005, 38, 1–8. [Google Scholar] [CrossRef] [PubMed]
- Goswami, A. Foot Rotation Indicator (FRI) Point: A New Gait Planning Tool to Evaluate Postural Stability of Biped Robots. In Proceedings of the IEEE International Conference on Robotics and Automation, Detroit, MI, USA, 10–15 May 1999; Volume 1, pp. 47–52. [Google Scholar]
- Koolen, T.; De Boer, T.; Rebula, J.; Goswami, A.; Pratt, J. Capturability-based analysis and control of legged locomotion, Part 1: Theory and application to three simple gait models. Int. J. Robot. Res. 2012, 31, 1094–1113. [Google Scholar] [CrossRef]
- Lockhart, T.E.; Liu, J. Differentiating fall-prone and healthy adults using local dynamic stability. Ergonomics 2008, 51, 1860–1872. [Google Scholar] [CrossRef]
- Vukobratovic, M.; Borovac, B. Zero-Moment Point—Thirty Five Years of Its Life. Int. J. Humanoid Robot. 2004, 1, 157–173. [Google Scholar] [CrossRef]
- Dasgupta, A.; Nakamura, Y. Making feasible walking motion of humanoid robots from human motion capture data. In Proceedings of the 1999 IEEE International Conference on Robotics and Automation (Cat. No.99CH36288C), Detroit, MI, USA, 10–15 May 1999; Volume 1042, pp. 1044–1049. [Google Scholar]
- Firmani, F.; Park, E.J. A framework for the analysis and synthesis of 3D dynamic human gait. Robotica 2012, 30, 145–157. [Google Scholar] [CrossRef]
- Firmani, F.; Park, E.J. Theoretical analysis of the state of balance in bipedal walking. J. Biomech. Eng. 2013, 135, 041003. [Google Scholar] [CrossRef]
- Kim, H.J.; Wang, Q.; Rahmatalla, S.; Swan, C.C.; Arora, J.S.; Abdel-Malek, K.; Assouline, J.G. Dynamic motion planning of 3D human locomotion using gradient-based optimization. J. Biomech. Eng. 2008, 130, 031002. [Google Scholar] [CrossRef]
- Qiang, H.; Yokoi, K.; Kajita, S.; Kaneko, K.; Arai, H.; Koyachi, N.; Tanie, K. Planning walking patterns for a biped robot. IEEE Trans. Robot. Autom. 2001, 17, 280–289. [Google Scholar] [CrossRef]
- Tlalolini, D.; Aoustin, Y.; Chevallereau, C. Design of a walking cyclic gait with single support phases and impacts for the locomotor system of a thirteen-link 3D biped using the parametric optimization. Multibody Syst. Dyn. 2009, 23, 33. [Google Scholar] [CrossRef]
- Pai, Y.C.; Patton, J. Center of mass velocity-position predictions for balance control. J. Biomech. 1997, 30, 347–354. [Google Scholar] [CrossRef] [PubMed]
- Winter, D.A. Kinematic and kinetic patterns in human gait: Variability and compensating effects. Hum. Mov. Sci. 1984, 3, 51–76. [Google Scholar] [CrossRef]
- Himann, J.E.; Cunningham, D.A.; Rechnitzer, P.A.; Paterson, D.H. Age-related changes in speed of walking. Med. Sci. Sports Exerc. 1988, 20, 161–166. [Google Scholar] [CrossRef]
- Kaneko, M.; Morimoto, Y.; Kimura, M.; Fuchimoto, K.; Fuchimoto, T. A kinematic analysis of walking and physical fitness testing in elderly women. Can. J. Sport Sci. 1991, 16, 223–228. [Google Scholar]
- Murray, M.P.; Kory, R.C.; Clarkson, B.H. Walking patterns in healthy old men. J. Gerontol. 1969, 24, 169–178. [Google Scholar] [CrossRef]
- Winter, D.A.; Patla, A.E.; Frank, J.S.; Walt, S.E. Biomechanical walking pattern changes in the fit and healthy elderly. Phys. Ther. 1990, 70, 340–347. [Google Scholar] [CrossRef]
- Chung, E.; Lee, S.H.; Lee, H.J.; Kim, Y.H. Comparative study of young-old and old-old people using functional evaluation, gait characteristics, and cardiopulmonary metabolic energy consumption. BMC Geriatr. 2023, 23, 400. [Google Scholar] [CrossRef]


| Symbol | Name | |
|---|---|---|
| Body segment’s mass | ||
| gravity | ||
| Body segment’s position | m | |
| Body segment’s acceleration | ||
| Body segment’s moment of inertia | ||
| Body segment’s angular acceleration | rad/s2 |
| Dynamic Stability in A-P | Dynamic Stability in M-L | Stance Phase | Swing Phase | First Double Limb | Second Double Limb | |
|---|---|---|---|---|---|---|
| Young | 71.3 ± 7.9 | 44.1 ± 11.2 | 56.4 ± 1.4 | 43.6 ± 1.4 | 6.3 ± 1.7 | 6.7 ± 1.2 |
| Elderly | 73.6 ± 7.6 | 53.9 ± 8.6 | 57.9 ± 1.4 | 42.1 ± 1.4 | 8.1 ± 1.7 | 8.0 ± 1.4 |
Disclaimer/Publisher’s Note: The statements, opinions and data contained in all publications are solely those of the individual author(s) and contributor(s) and not of MDPI and/or the editor(s). MDPI and/or the editor(s) disclaim responsibility for any injury to people or property resulting from any ideas, methods, instructions or products referred to in the content. |
© 2023 by the authors. Licensee MDPI, Basel, Switzerland. This article is an open access article distributed under the terms and conditions of the Creative Commons Attribution (CC BY) license (https://creativecommons.org/licenses/by/4.0/).
Share and Cite
Han, S.K.; Ko, J.-B.; Yu, Y.; Hong, J.-S.; Ryu, J.-C.; Lee, K.K.; Kang, S.-J. A Comparison of Dynamic Gait Stability between the Young and Elderly Female Populations Using the Zero-Moment Point Method. Electronics 2024, 13, 135. https://doi.org/10.3390/electronics13010135
Han SK, Ko J-B, Yu Y, Hong J-S, Ryu J-C, Lee KK, Kang S-J. A Comparison of Dynamic Gait Stability between the Young and Elderly Female Populations Using the Zero-Moment Point Method. Electronics. 2024; 13(1):135. https://doi.org/10.3390/electronics13010135
Chicago/Turabian StyleHan, Sang Kuy, Jeong-Bae Ko, Yeonwoo Yu, Jae-Soo Hong, Jei-Cheong Ryu, Ki Kwang Lee, and Sung-Jae Kang. 2024. "A Comparison of Dynamic Gait Stability between the Young and Elderly Female Populations Using the Zero-Moment Point Method" Electronics 13, no. 1: 135. https://doi.org/10.3390/electronics13010135
APA StyleHan, S. K., Ko, J.-B., Yu, Y., Hong, J.-S., Ryu, J.-C., Lee, K. K., & Kang, S.-J. (2024). A Comparison of Dynamic Gait Stability between the Young and Elderly Female Populations Using the Zero-Moment Point Method. Electronics, 13(1), 135. https://doi.org/10.3390/electronics13010135