1. Introduction
Public speaking anxiety is a prevalent challenge confronting a vast segment of the global population. Manifested as discomposure when addressing a crowd, its intensity spans from nervousness to panic. Such anxiety does not only disrupt an individual’s oration skills but often affects their professional advancements and social engagements, potentially inhibiting them from pursuing leadership roles, promotions, or even casual interactions.
Historical solutions used to combat this anxiety include cognitive behavioral therapy, exposure therapy, and certain medications. While these methodologies exhibit efficacy in mitigating the problems associated with public speaking, their applicability and accessibility remain confined, necessitating innovative solutions.
Virtual reality (VR), as a technological advancement, offers promise in this domain. VR generates a three-dimensional world, granting users the privilege of navigating and interacting through immersive environments, typically facilitated by specialized devices like headsets. The essential element of VR is its ability to emulate reality, making the user’s experience feel realistically authentic, which, in turn, produces emotional and behavioral responses. Historically, VR’s therapeutic benefits have been leveraged to address an array of psychological maladies, from anxiety disorders to post-traumatic stress disorder and specific phobias.
Nevertheless, using VR as a therapeutic tool specifically for public speaking anxiety remains in its early stages, and the scholarly discourse surrounding its efficacy is inconclusive. Some studies endorse VR’s potential in reducing fear of public speaking. This article delves into the potency of VR in improving public speaking skills and focuses on key metrics that could potentially be expanded towards treating public speaking anxiety. The scope of this article does not cover the treatment of FPS, since our system has not been tested with people that suffer from glossophobia. However, our findings suggest that the proposed solution can be applied to this area as well.
One prevalent approach to training centers around the deployment of Information and Communication Technology (ICT). This often incorporates virtual agents, essentially computer programs, as well as study groups that leverage ICT to enhance user interaction. Such strategies have been documented in prior research [
1,
2,
3].
An ICT-based public speaking training solution, divergent from virtual reality paradigms is presented in [
4]. Here, an artificial entity, or a virtual coach, guides users, offering real-time feedback and post-session analysis. These digital coaches evaluate aspects of speech including volume, rhythm, and word choice. Enhancing the real-world training simulation, many of these virtual agents sport avatars, meticulously designed to emulate human figures. The rationale behind such avatars is to instill a sense of empathy and foster a social connection between the user and the virtual trainer, thus amplifying the impact of feedback.
Moving a step further, there are VR ICT training tools; some of them even available on the market for customers, as detailed by [
5]. These platforms submerge users in virtual landscapes where they present in front of simulated audiences. This section delves into a series of VR ICT solutions, particularly those that offer comprehensive insights into their operational dynamics and features.
A solution that utilizes a small room with three virtual characters as audience members is presented by [
6]. The audience’s adaptive attention system tracks metrics such as eye contact, body and hand position, body orientation, spoken words per minute, speech recognition, filler words, and elapsed time for the presentation. In a similar way, ref. [
7] represent the user in the virtual environment to provide a sense of ownership of the body, thus enhancing immersivity. Tracked metrics include eye contact, filler words, body language, and elapsed time for the presentation, which comprise the audience’s attention score. A significant aspect of this solution is the communication of metrics to the user, which is achieved through heatmaps of the user’s position and gazing direction.
A software-as-a-service solution to be utilized in conjunction with a therapist, which can accommodate multiple rooms with an expanding audience and room size is discussed in ref. [
8]. The solution features a dedicated dashboard for the therapist and several interaction and session settings, such as making the audience applaud or appear happy or disapproving. Biofeedback sensors are connected to the VR application, tracking electroencephalography (EEG) signals, heart rate, and galvanic skin responses to provide a basic overview of the user’s state during therapy.
A gamified approach, adopted in [
9], framing their solution as a video game. This aims to drive user motivation and optimize their learning journey. Real-time audience reactions are determined based on the user’s voice, speech patterns, and gaze. By tweaking the attention score based on these metrics, they craft a gamified user experience.
In a scientific study [
10], it was explored the prerequisites of a virtual audience for effective public speaking training. Their research underscores the significance of increased customization capabilities—spanning audience attributes, event scenarios, and formats—as a linchpin in aiding users to conquer their public speaking apprehensions.
A literature review [
11] examined various studies on the use of VR technology to alleviate public speaking anxiety. They analyzed multiple papers, including those that compared treatment modalities such as cognitive behavioral therapy, exposure therapy, and VR. The quantitative findings of their study indicated that VR sessions moderately decreased levels of public speaking anxiety, though not significantly. The study highlighted the importance of the consistent use of VR technology as a strategy for effectively addressing public speaking anxiety [
12,
13].
A solution was proposed in [
14] that involves monitoring and analyzing users’ movements using a pose estimation model. Speech analysis is conducted using Whisper, a model that transcribes speech to text, allowing for further text-based analysis. Metrics related to speech, such as the clarity, number of pauses, and speaking rate, are tracked. Additionally, the solution incorporates a heart-rate sensor to assess nervousness, assigning a score based on recorded heart rate data.
A work-in-progress VR application is described in [
15], integrated with an algorithmic classification model for detecting stress during public speaking in real-time by analyzing the speaker’s voice. It offers real-time virtual feedback for the training of public speaking skills. A stress detection model that recognizes stress with three different classifier models was constructed by extracting and identifying overall significant voice features. The results show that it achieves high accuracy in the detection of stress.
2. Materials and Methods
2.1. Overview of Virtual Reality for Public Speaking (VR4PS)
We developed the VR4PS (Virtual Reality for Public Speaking) application as a practical and accessible tool that can help people overcome their public speaking apprehensions or improve their public speaking skills in a controlled virtual environment.
To improve public speaking skills, the application immerses the user in a simulated environment where they give a presentation before a dynamic virtual audience. Users have the option to incorporate their personalized slide decks for a more tailored and real-world presentation experience. The consistent practice of making presentations in front of the public is important for improving public speaking skills, and, potentially, overcoming FPS. Recognizing this, our system is designed to let users redo sessions multiple times, such that they can strengthen their self-assurance in public speaking.
For those looking to refine their public speaking skills, our system offers different settings, which enable users to define the desired training scenario. Such settings include the virtual room dimensions, number of people in the audience, and audience profile. This customization not only allows for skill enhancement but also equips users to experiment with varied real-world presentation environments. Enhancing presentation skills boosts the speaker’s confidence, which, in turn, could also diminish FPS.
The application emphasizes task-based training, where users focus on improving specific aspects of their presentation—their movement, gaze, stance, or speech. Such concentrated efforts act as a way to prevent users from becoming overwhelmed. Leveraging task-centric and gamified training aligns with the successful strategies employed in various VR exposure therapies, as evidenced by some studies [
16,
17,
18,
19,
20,
21,
22].
Upon accessing the application, users are provided with the flexibility to personalize their presentation. This encompasses various parameters and settings, allowing them to replicate scenarios that resonate with their real-world fears or challenges. Subsequently, as they embark on their virtual presentation, they are greeted by an interactive digital audience.
An important feature embedded within the application is its real-time monitoring and feedback system. During the user’s presentation, the system evaluates multiple aspects, such as voice modulation, head orientation, and others, and displays them to the user in real-time. Also, upon the completion of a presentation, a comprehensive report is generated, spotlighting areas of proficiency and those requiring improvement. Through this feedback, users can iteratively practice and improve specific elements of their presentation technique, encouraging gradual confidence and mastery in their public speaking endeavors.
As for the hardware for the VR, we have chosen the Oculus Quest 2 headset due to its portability and ability to be used standalone, compared to other headsets that require a computer to run. This helped immensely in our testing endeavors. Thus, VR4PS was developed using the Unity game engine and the Oculus Quest 2 development kit. The avatars from the virtual audience were crafted using Adobe Fuse (
https://www.adobe.com/wam/fuse.html, accessed on 20 May 2024), and their animations were implemented with the help of Adobe Mixamo (
https://www.mixamo.com/#/, accessed on 20 May 2024).
2.2. Customization of the Presentation Session in the Virtual Environment
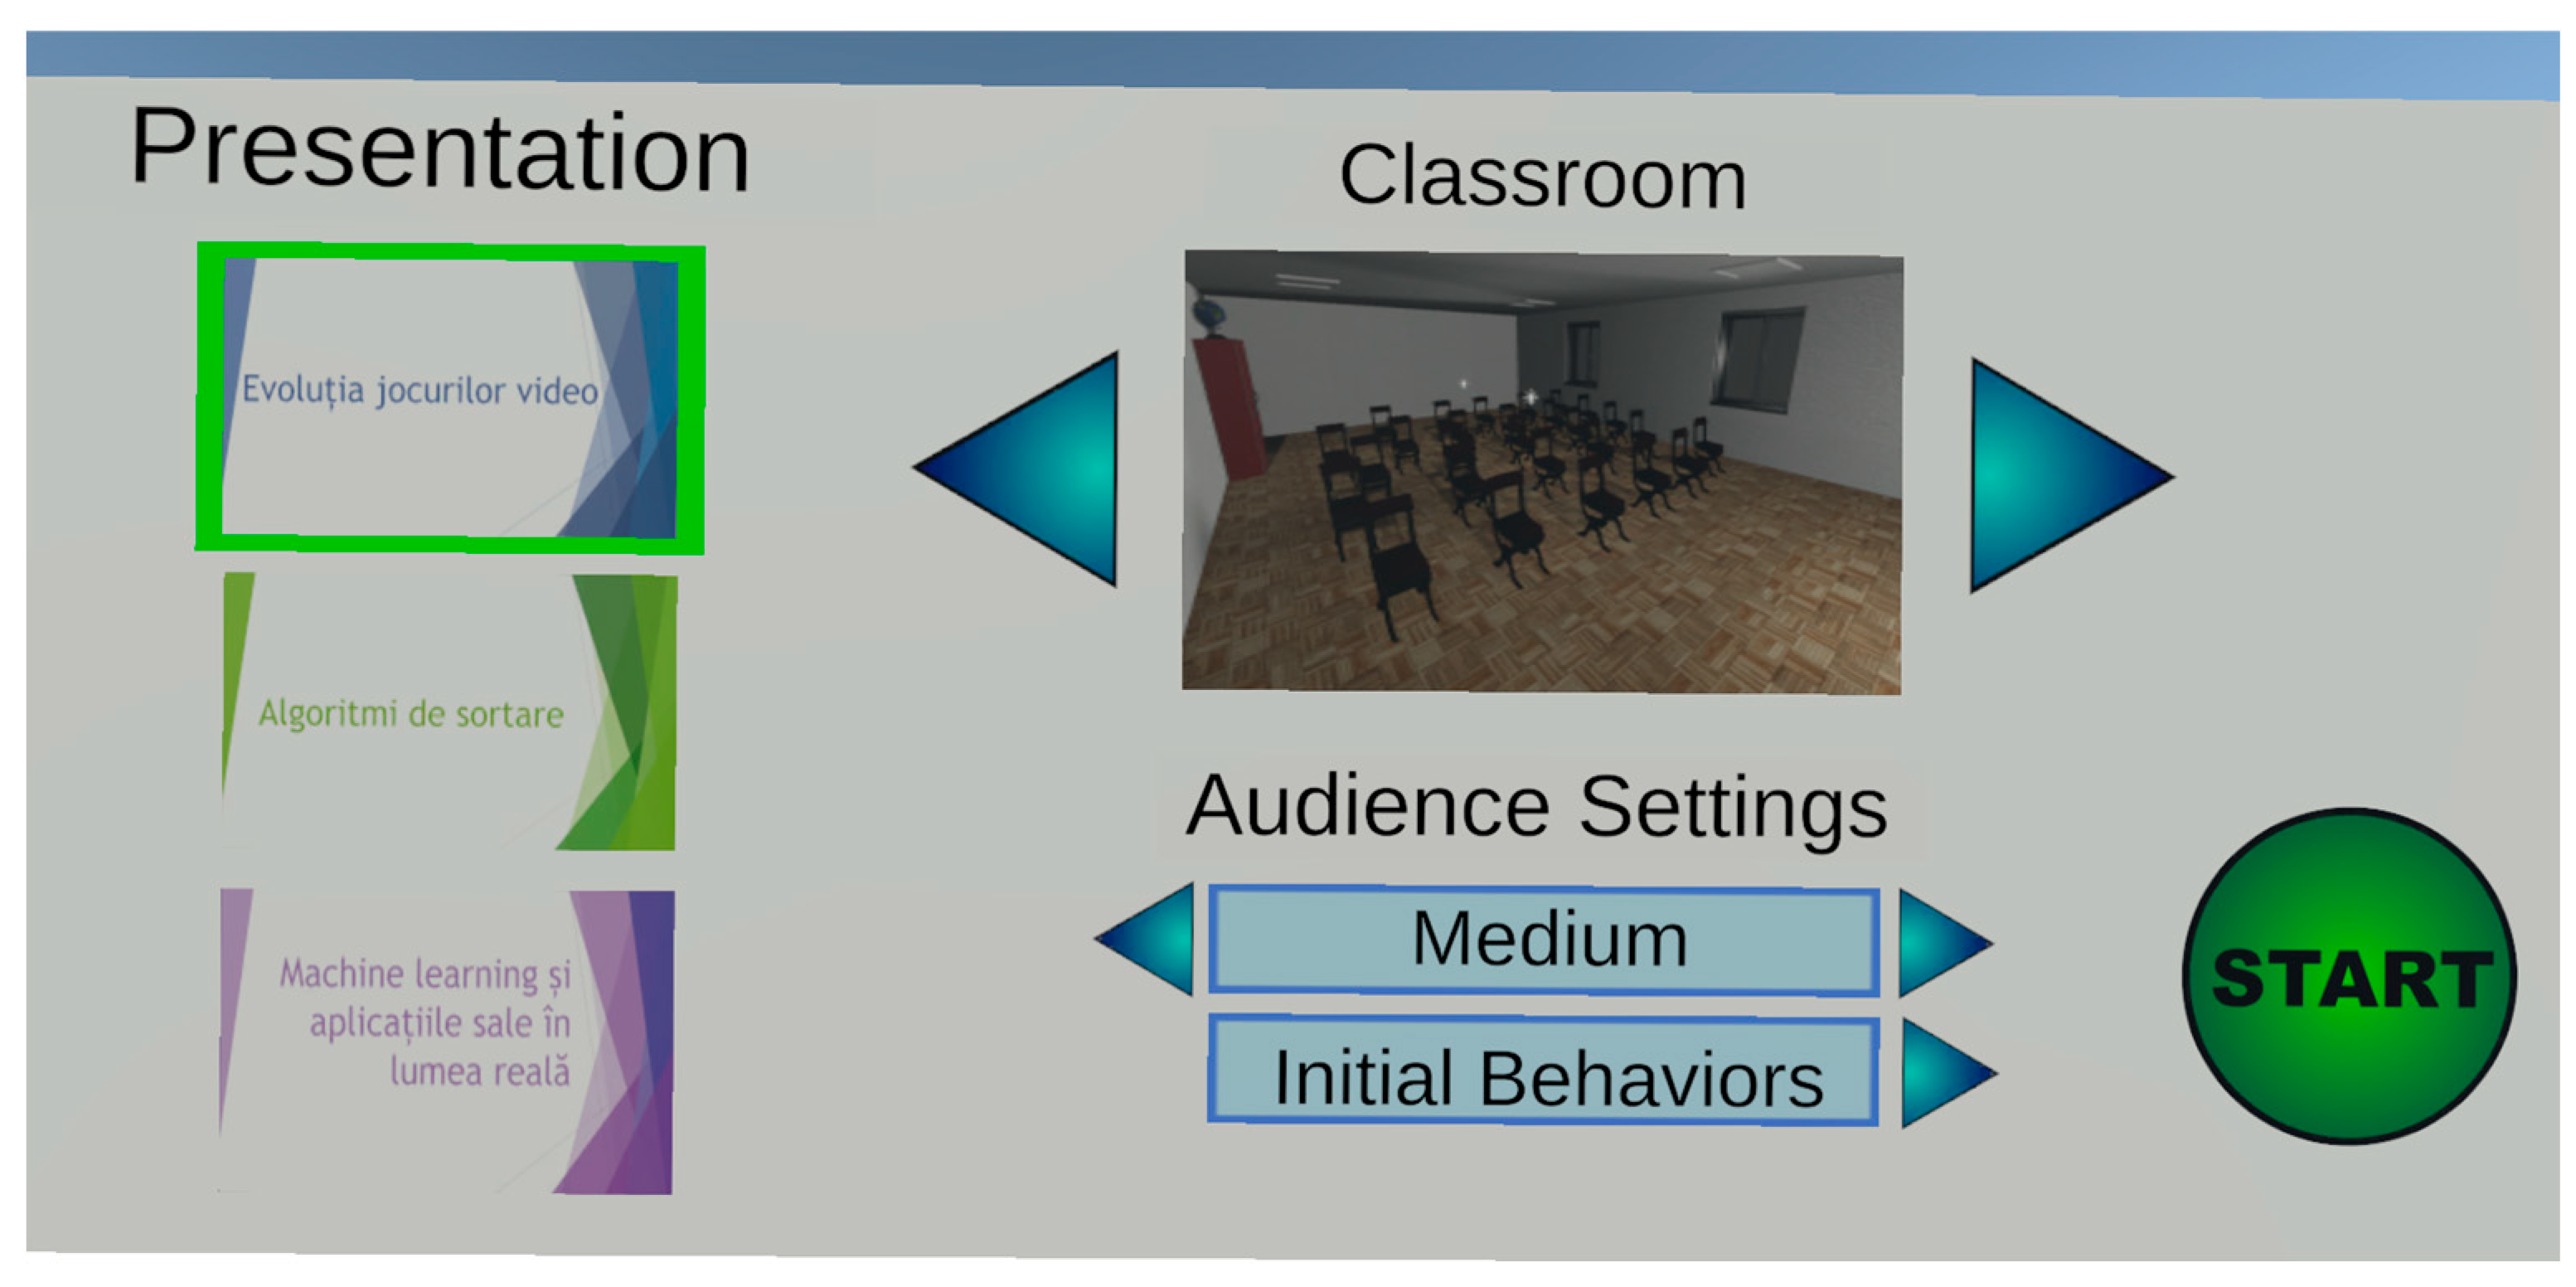
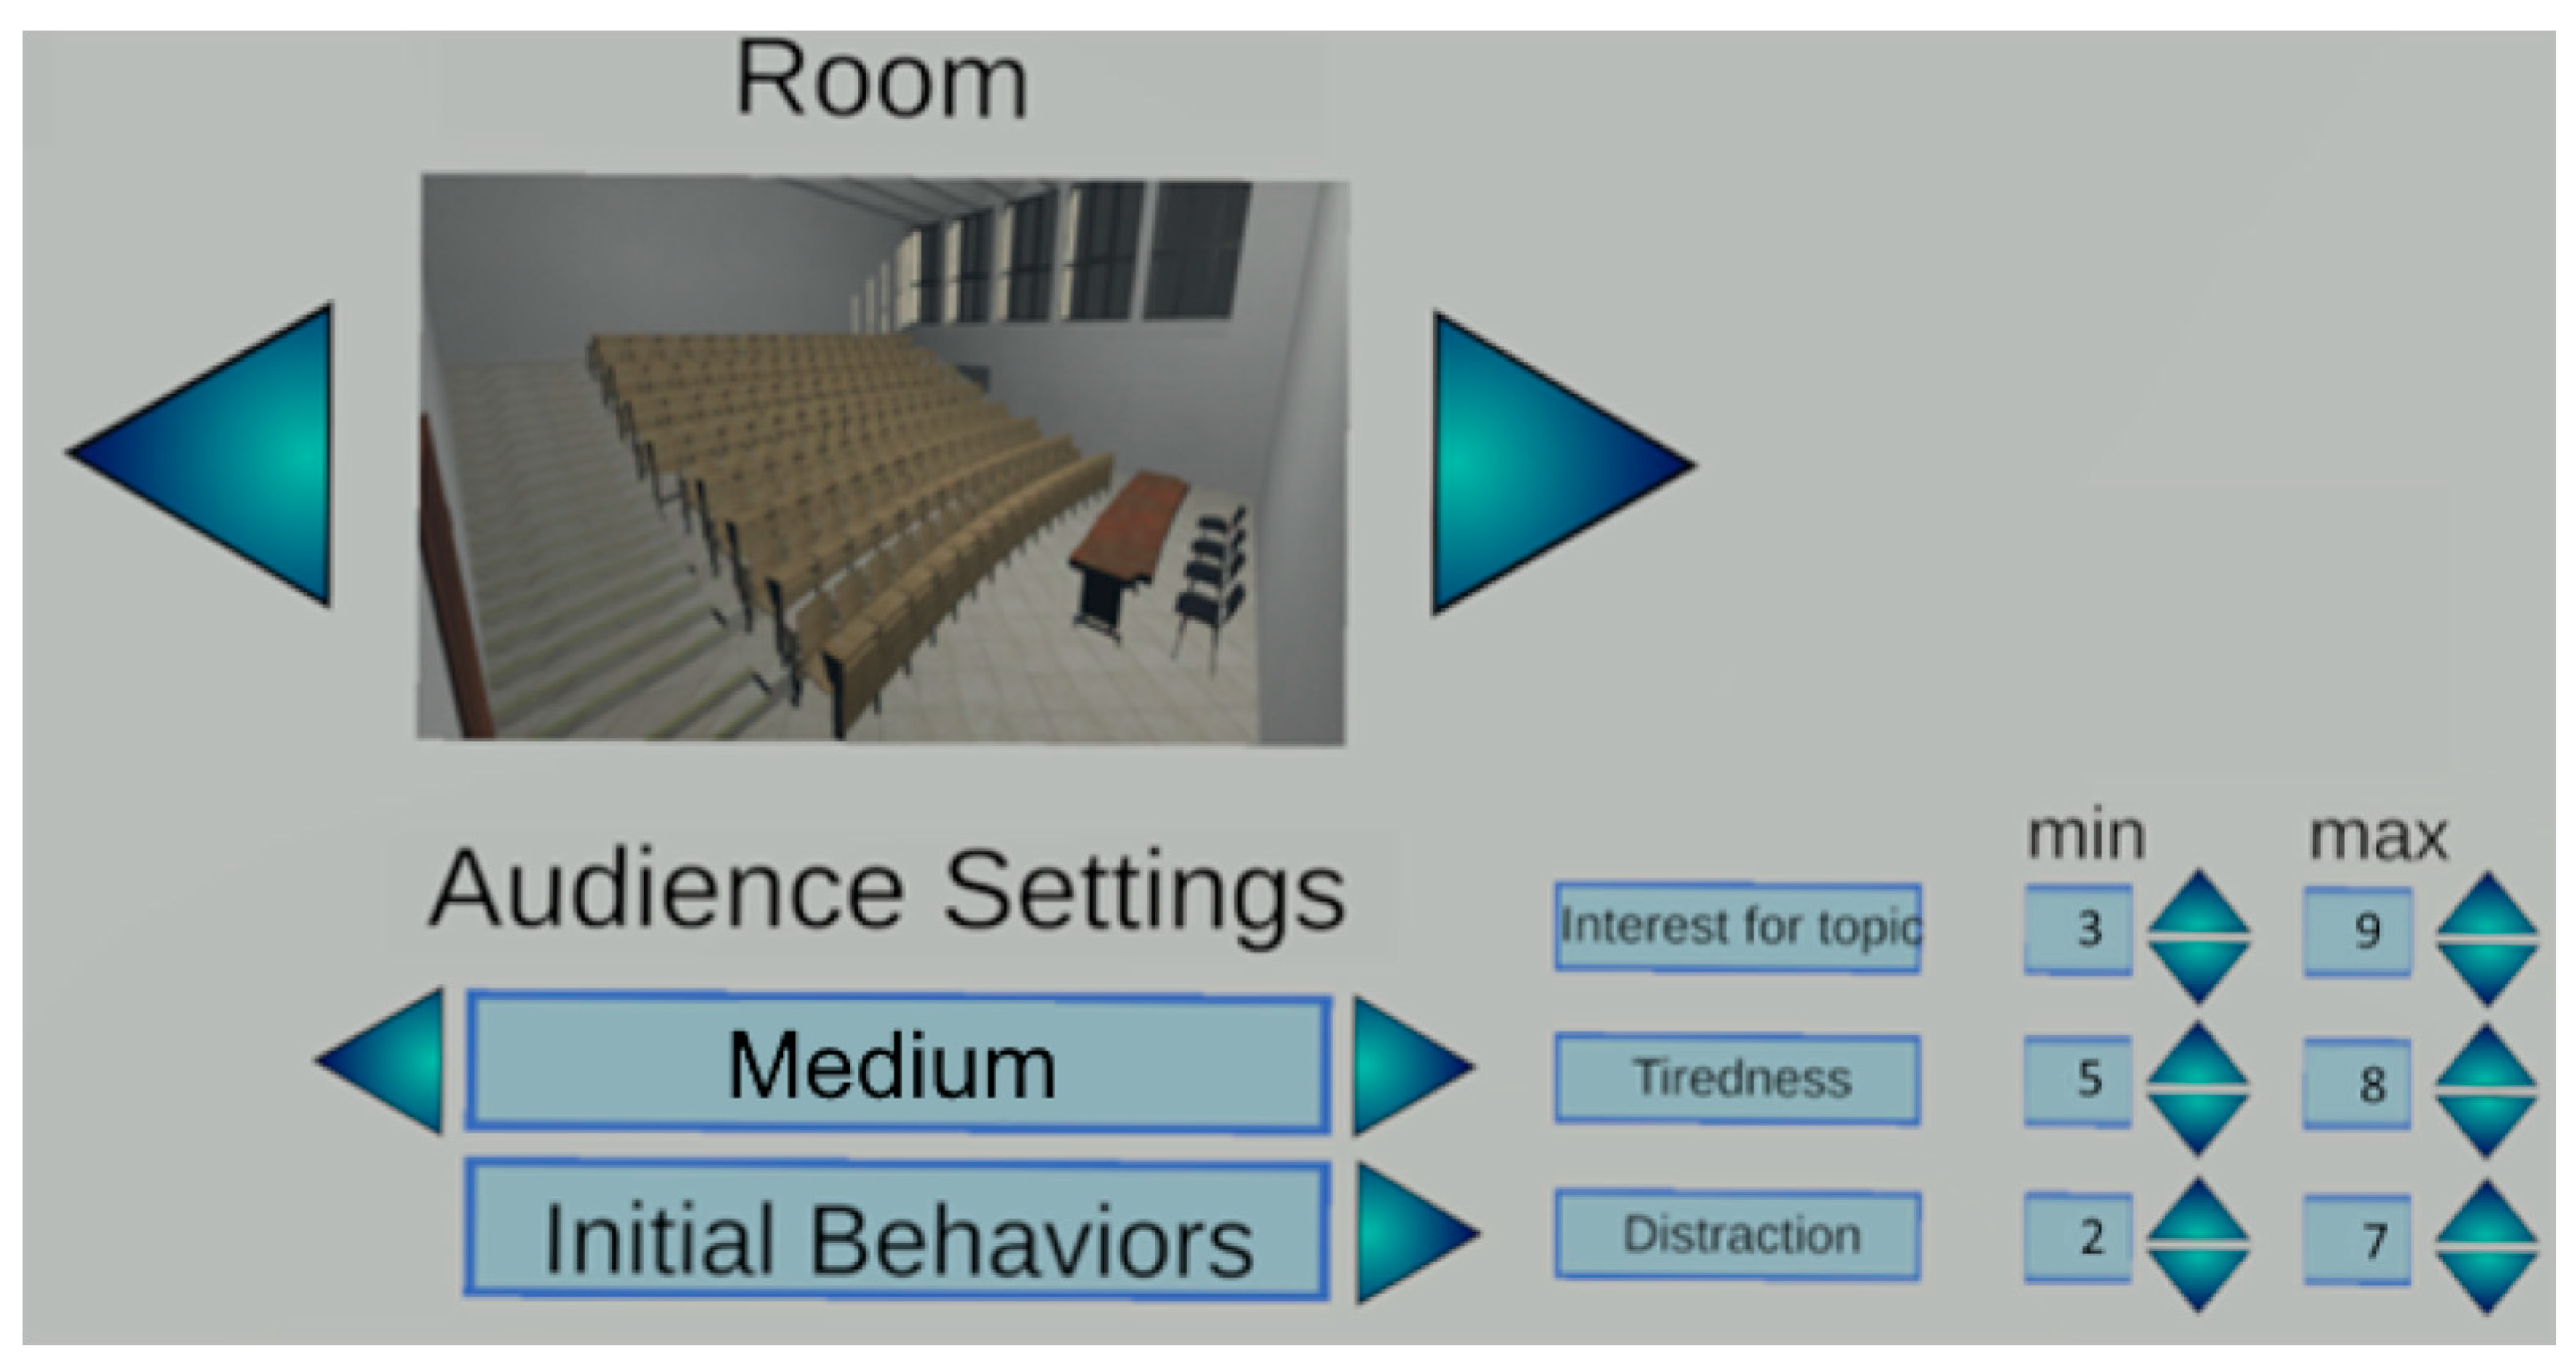
Upon launching the application, users are greeted with an interface (
Figure 1) that allows them to customize their presentation experience by choosing from various settings, such as number of people in the audience, audience behavior, room type, and presentation.
The user can choose the room type from the following options:
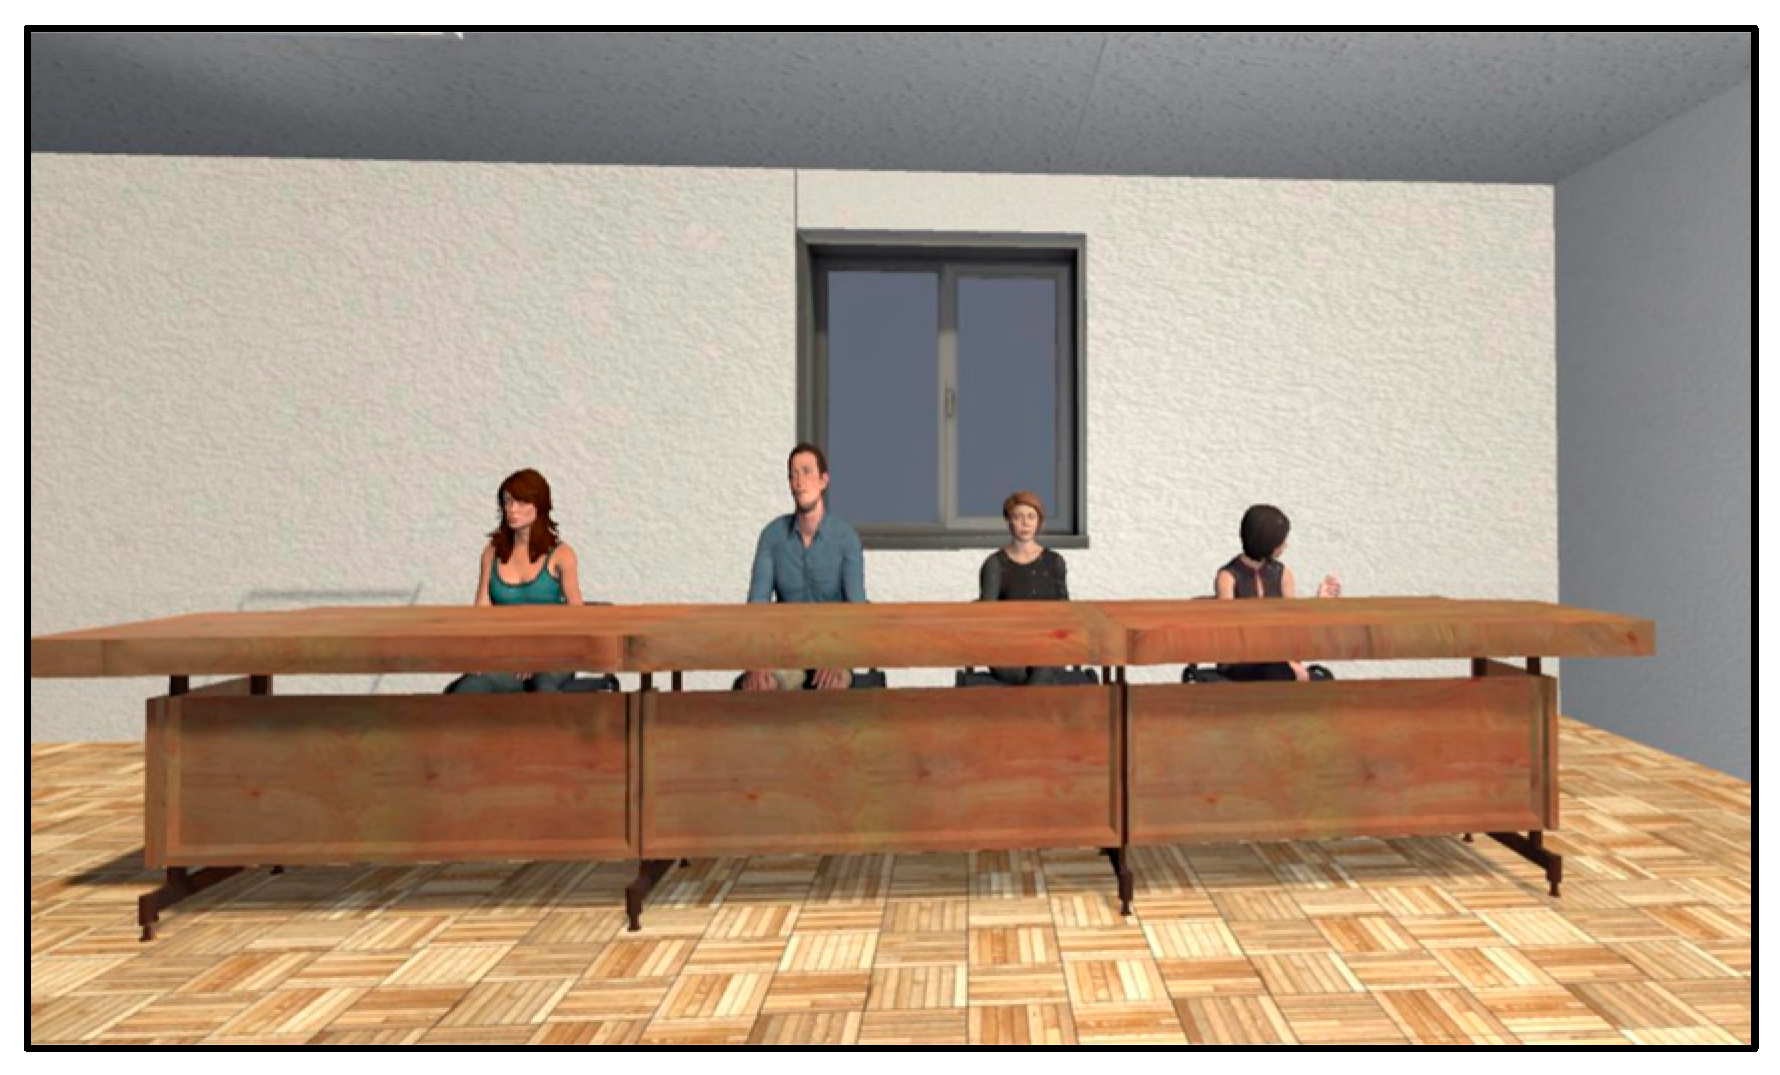
Small-sized room (
Figure 2): can accommodate an audience of up to four individuals;
Medium-sized room (
Figure 3): maximum seating capacity of 27 attendees;
Amphitheatre (
Figure 4): designed for a larger audience of up to 124 people.
For the Audience Presence setting, the user can select from five possible configurations:
Empty room (0% seat occupancy);
Small audience (25% of seats occupied);
Medium-sized audience (50% of seats occupied);
Large audience (75% of seats occupied);
Full room (100% seat occupancy).
Within the Audience Initial Behavior settings, the user can set a range for the following three behaviors. Going forward, these initial behaviors will be referred to as audience metrics:
Depending on the specified behavior range, values will be randomly assigned to the audience using uniform distribution (
Figure 5).
For users keen on integrating their PowerPoint presentations, the application offers a feature allowing them to do so. They simply need to save their presentation in a designated directory before accessing the application.
2.3. Metrics and Scoring
Our application offers a comprehensive model, analyzing numerous intricate factors that influence audience engagement. To quantitatively assess such factors, our application uses a set of metrics. The metrics implemented in our application are used to evaluate a user’s public speaking performance. Going forward, these metrics will be referred to as user metrics.
Hand and head movement: Both the hand and head movements of the user are captured in real-time in the 3D virtual environment. The system calculates the extent of their movement by computing the distance between their previous and current positions, offering insights into their range of motion and interaction with the virtual space;
Head swings: each time a user oscillates their focus between the PowerPoint presentation and the virtual audience, it is counted as a head swing, offering insights into the number of times the user disconnects from the audience;
Presentation gaze: This metric is important in understanding user engagement. It calculates the duration in which a user directs their attention towards the presentation slides versus the virtual audience;
Usage of presentation pointer: Highlighted in
Figure 6, the application tracks the duration the presentation pointer targets the slide content. This metric is invaluable, differentiating between moments when a presenter is actively using the pointer to showcase important content on the slides versus speaking without engaging with the audience. Analyzed in tandem with gaze direction, this offers deeper insights into user–slide interactions. The usage of the pointer is tracked while the user is actively looking at the presentation, hence a strong correlation with presentation gaze;
Voice volume: This is ascertained by measuring the amplitude of microphone-detected sound levels, providing a clear understanding of the user’s audibility;
Advanced voice analysis: For metrics like voice clarity, rhythm, filler words, and long pauses, our system integrates [
23] with Azure’s Speech-to-Text algorithm. This algorithm transcribes the recorded voice into textual content, facilitating subsequent text-based evaluations. For instance, consider the following:
- ○
Rhythm: assessed as the rate of spoken words per minute;
- ○
Clarity: defined by the algorithm’s confidence level in accurately transcribing spoken content;
- ○
Long pauses: evaluated by contrasting silent audio durations against a preset threshold;
- ○
Filler words: the system identifies these through a string-matching process, comparing the transcribed content against a predefined list of common filler words.
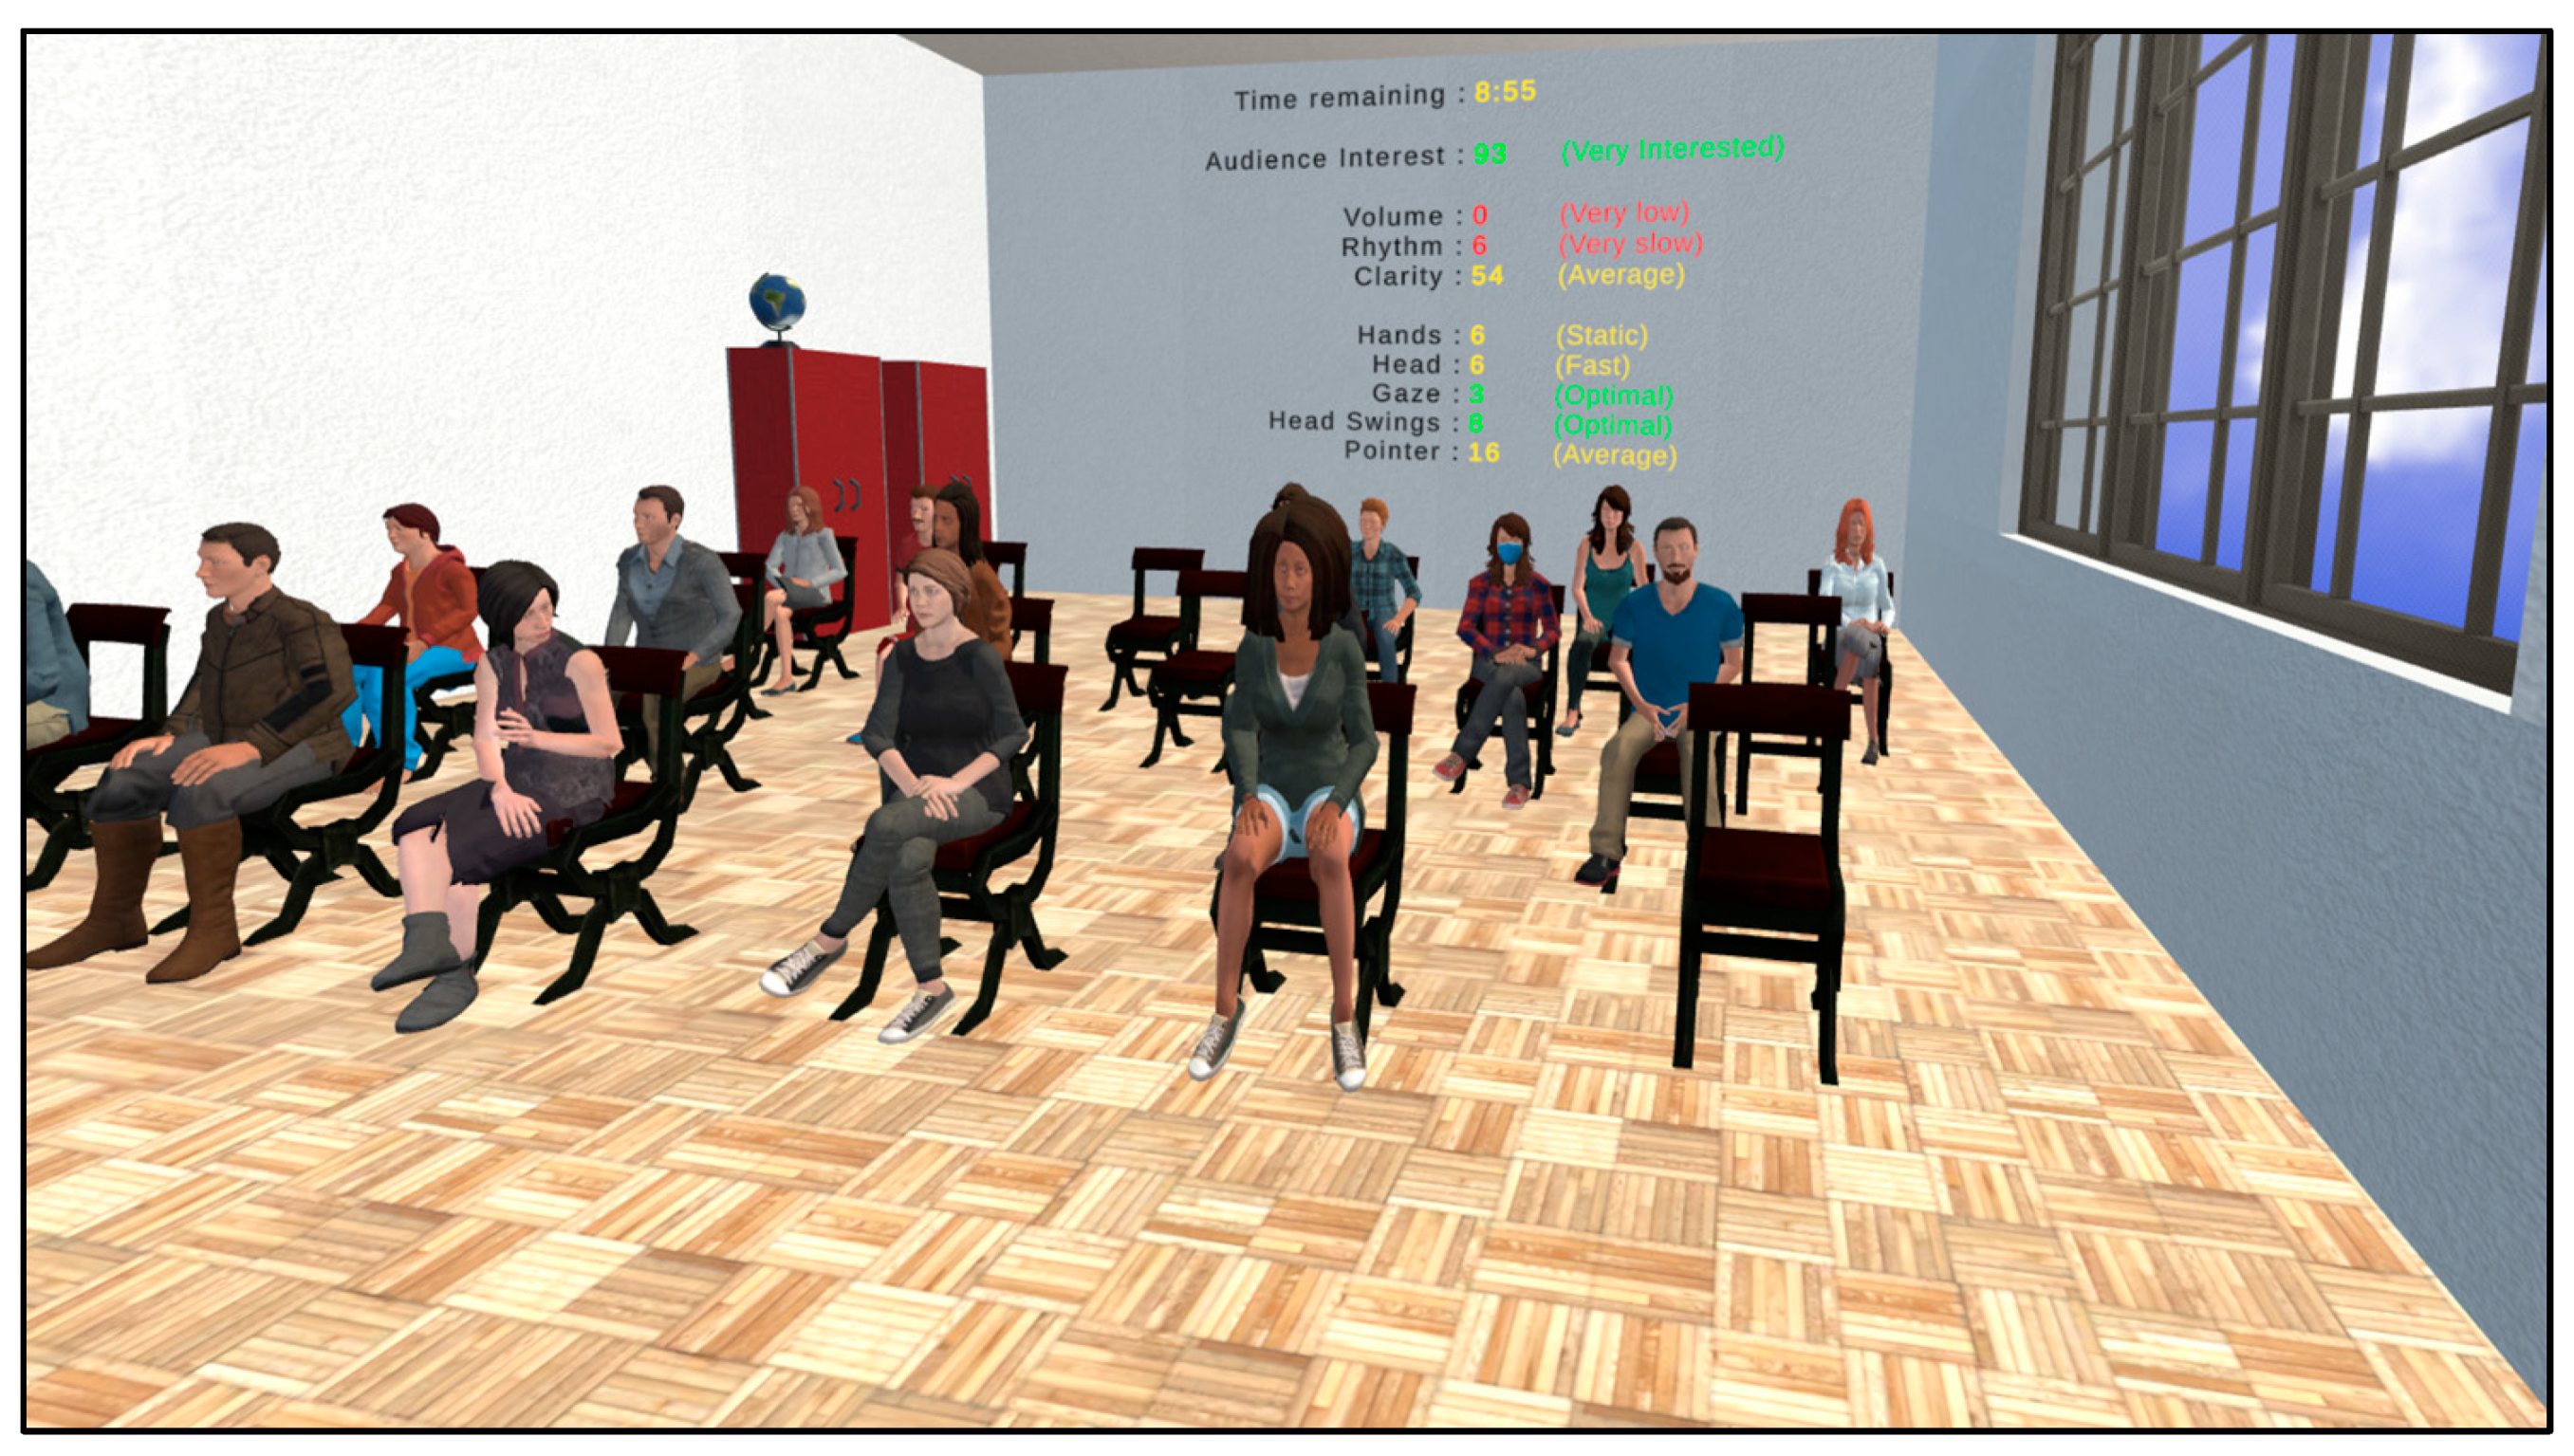
Throughout the duration of the user’s presentation, these metrics are constantly assessed and displayed, as depicted in
Figure 7. Based on this real-time data, the application provides the user with immediate feedback, both during and after the presentation.
Figure 6.
User pointing the red laser towards a slide on the PowerPoint presentation.
Figure 6.
User pointing the red laser towards a slide on the PowerPoint presentation.
Figure 7.
Metrics displayed at the back of the room, based on the user’s performance during the presentation.
Figure 7.
Metrics displayed at the back of the room, based on the user’s performance during the presentation.
2.4. Implementation Details
Together, these multifaceted metrics present a thorough analysis of a user’s public speaking capabilities. Using the aforementioned metrics, which assess the user’s performance, the system computes a score named the “Audience Interest Level”. This score has values from 0, meaning complete disinterest, to 100, representing total captivation by the presenter.
The score is computed with Formula (1), which combines the values of various individual metrics (
Mi) from both user and audience metrics (
n is the total number of metrics), each having their own weight (
Wi):
Empirical testing has revealed that for each metric, there exists an optimal range within which the metric reveals a good user performance. Consequently, values that fall outside this optimal range exhibit a proportional decrease in effectiveness, with the degree of impact directly related to their deviation from the specified range.
Some metrics, when exhibiting favorable behavior, contribute positively to the score. For instance, using the presentation pointer aptly or maintaining a consistent speech rhythm can enhance the audience’s interest value. Conversely, behaviors that may detract from the presentation’s effectiveness, such as excessive glancing at the slides or frequent usage of filler words, are deemed negative. The values of such metrics are subtracted in the formula, reducing the final score. The weights assigned to the metrics are derived from iterative fine-tuning during testing phases. The result of each metric is a positive integer, which together make up the final score in Formula (1). Which metric contributes positively or negatively can be seen in
Table 1. In essence, the formula provides a general view of a user’s presentation efficacy.
The following metrics are not included in Formula (1). Their role is to influence the audience metrics.
Audience Proximity: affects the audience metrics proportionally to the distance from the user to each audience member;
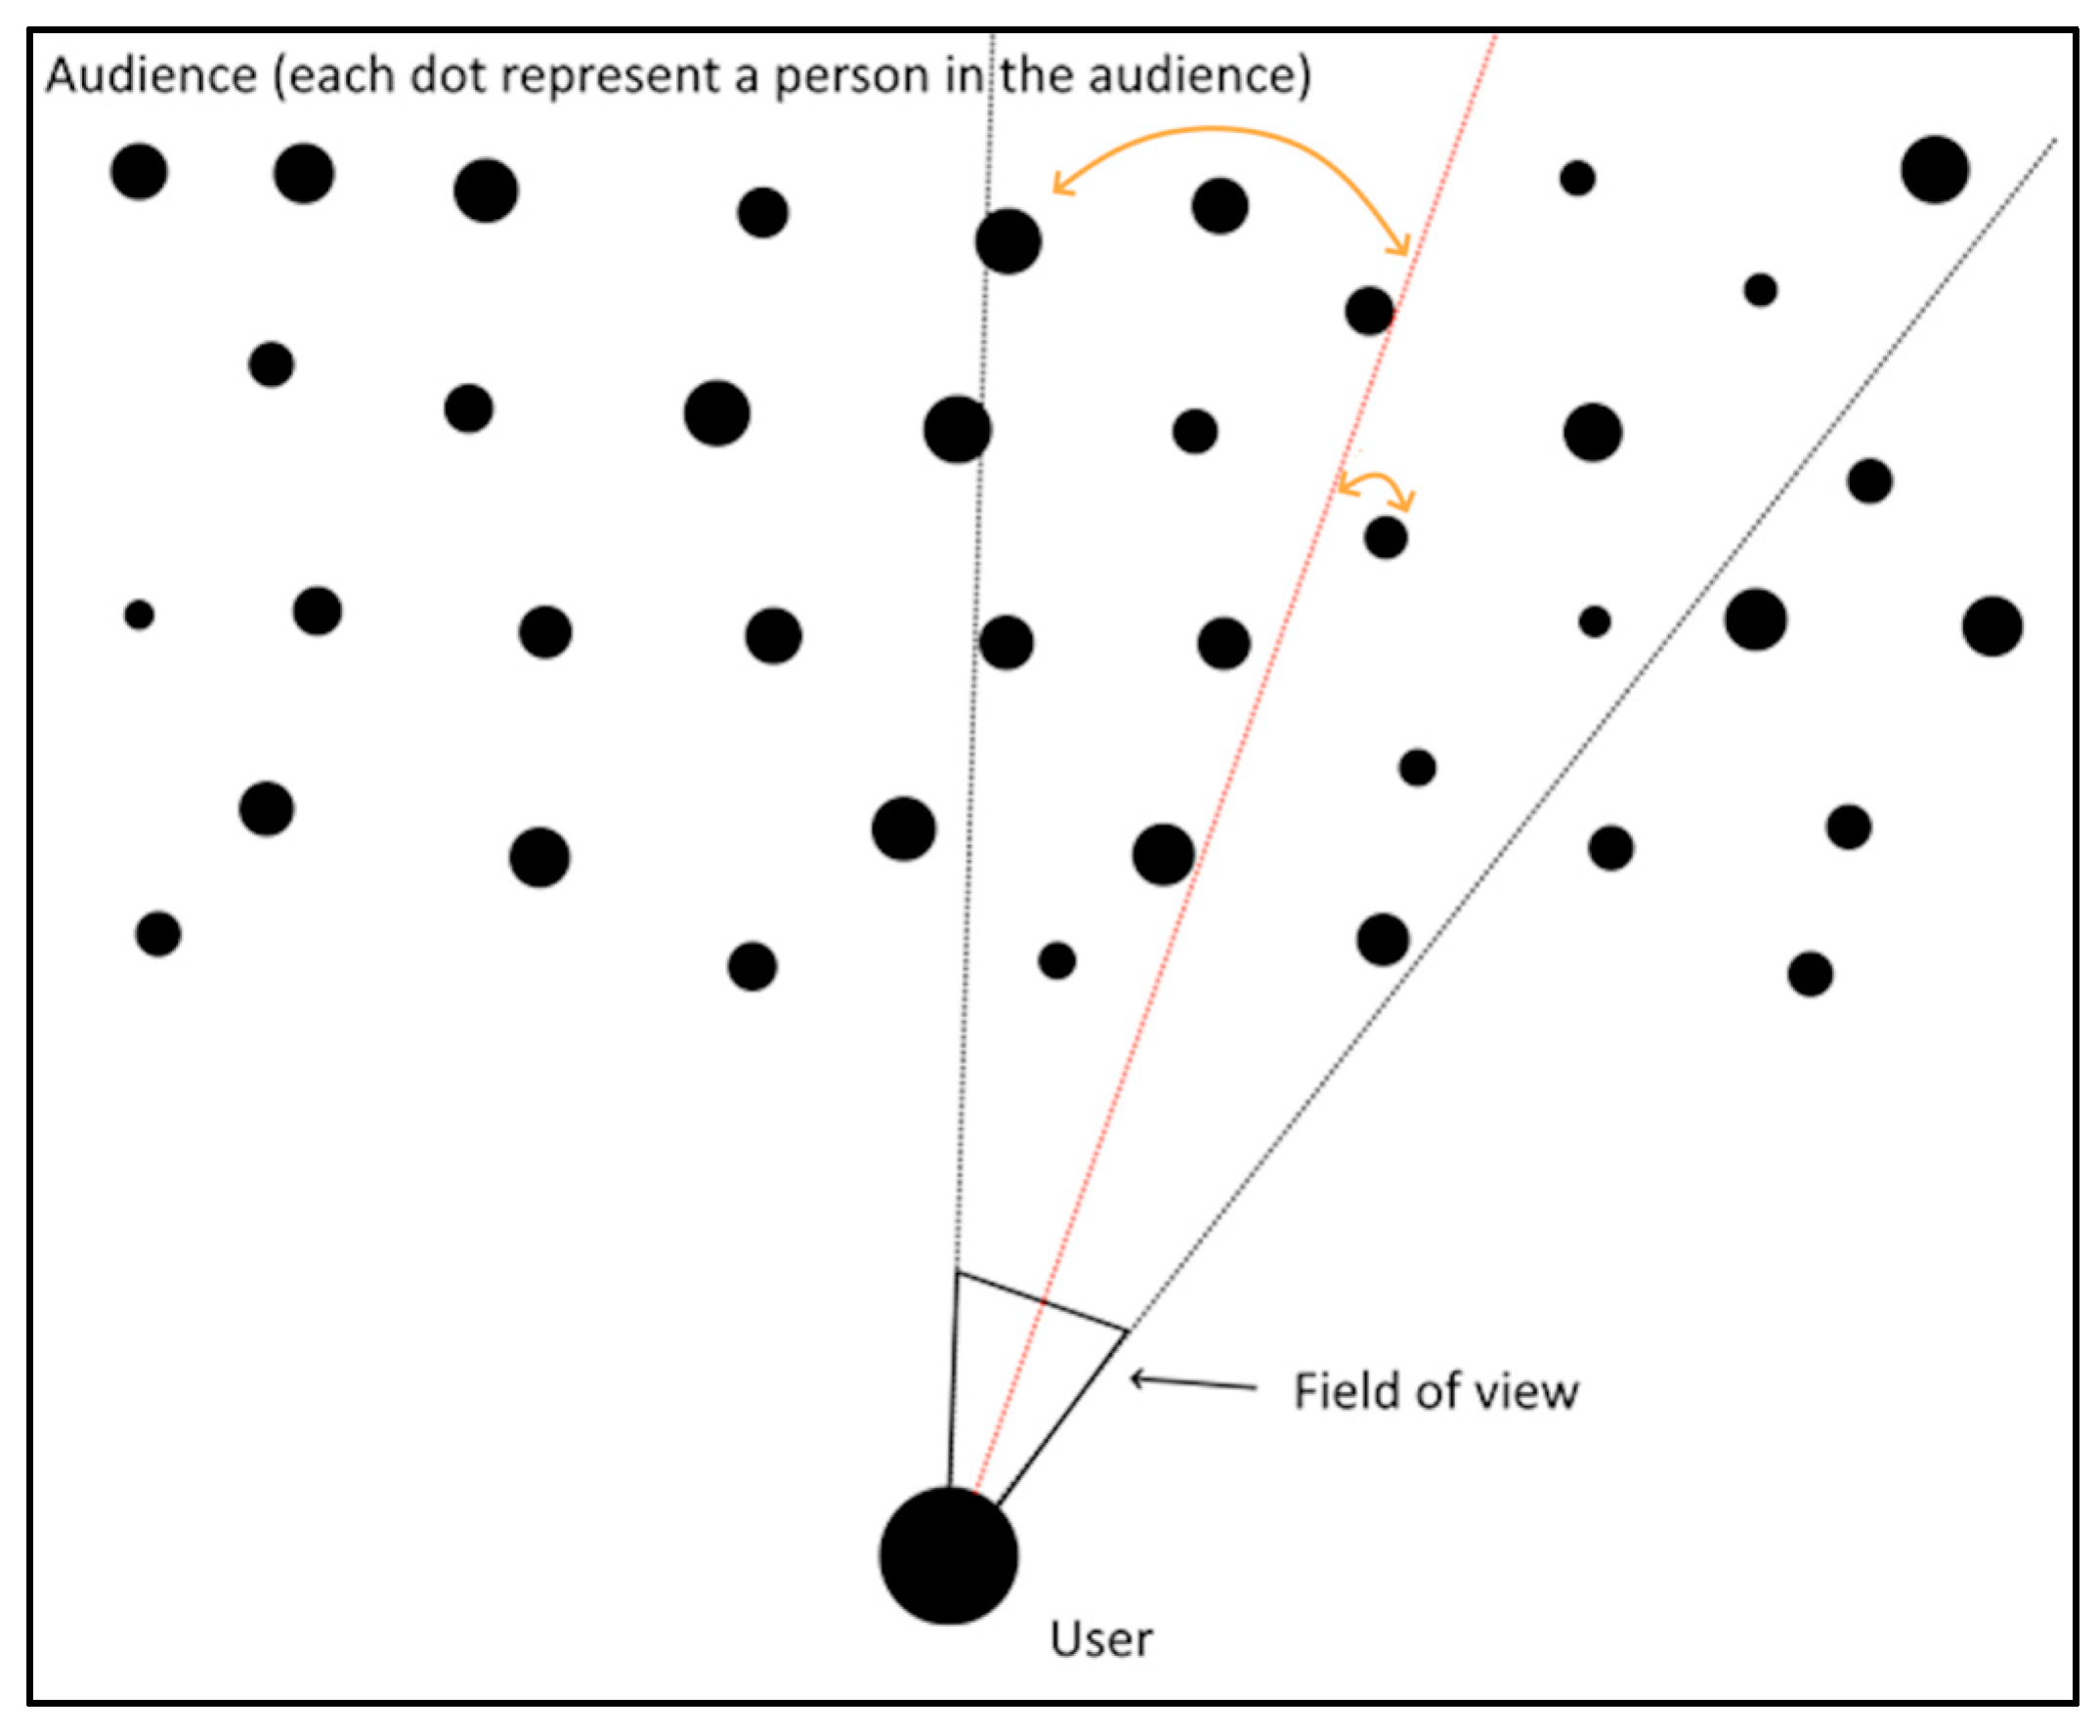
Audience Gaze: affects the audience metrics proportionally to the viewing angle (
Figure 8);
Audience Interact: The user has the capability to direct the controller’s pointer at a specific audience member, simulating the action of addressing that individual directly. As a result, this targeted interaction enhances the particular audience member’s metrics, which in turn radiates out to positively influence the engagement levels of nearby individuals in a radial manner.
Figure 8.
Gaze metric influencing each person from the audience (image from [
19]).
Figure 8.
Gaze metric influencing each person from the audience (image from [
19]).
Table 2 showcases which user metric and computation impacts which audience metric. The audience metrics increase or decrease each second by a percentage. The percentage in the table applies when the respective metrics are in their optimal intervals, as shown in
Table 1. When outside the optimal interval, the percentage decreases linearly, up to a turning point, when it starts to negatively affect the audience metrics, decreasing the score, up to the negative maximum percentage (
Figure 9). For the last three, there is no turning point, because Audience Proximity and Audience Gaze affect the audience metrics up to the percentage and can reach 0, but not negative values. Audience Interact is an action by the user which increases by the percentage the targeted audience member’s attention and decreases radially in individuals around the target.
Recognizing the fluidity of research and user needs, our application has been designed as an adaptive framework, enabling straightforward adjustments of various parameters, weights, and computational functions. This flexibility not only eased the calibration process during various stages of development but also ensured seamless adaptability during subsequent evaluations and user-centric testing.
2.5. Evaluation
This section delves into the methodology employed for testing, providing a comprehensive view of both the processes and the insights derived from user feedback. The two-sided approach—user testing and user experience—offers an understanding of the application’s efficacy and areas of potential enhancement.
We outline the key performance indicators and metrics used to gauge the application’s efficiency, usability, and reliability. This includes any quantitative tests conducted, as well as any technical benchmarks met. We present details about the user testing phase—the number of participants, their demographic details, the structure of the trial, and any specific tasks or challenges they were presented with.
Insights derived from user trials are described, emphasizing common patterns, recurring issues, or particularly noteworthy observations, as well as a summary of the feedback, both qualitative and quantitative, sourced from user questionnaires. This also includes any surprising findings or unexpected outcomes from the user trials.
The evaluation of the application was executed in two phases to ensure that both functionality and user experience were thoroughly assessed.
The initial testing phase [
24] was conducted at the University of Bucharest, Faculty of Biology. Four participants were involved, and each of them delivered a presentation on the topic of the human spine, experimenting with different virtual environments. After their presentations, they provided immediate verbal feedback. Among the insights shared, participants expressed their appreciation for the option to select presentations directly within the application. They also indicated the value of having an exploration phase within the virtual environment before the actual performance metrics have been applied. An important piece of feedback was the participants’ desire to be informed in real-time about the time spent during their presentation. Another suggestion was the need for greater diversity within the virtual audience to amplify the feeling of realism.
After completing the initial testing phase, we undertook a thorough review process. This involved gathering both user feedback and monitored metrics. The monitored metrics were particularly important for making necessary adjustments to Formula (1) weights. Following this, we analyzed the collected user feedback, and, based on it, we made several improvements to the application.
The subsequent phase was geared toward identifying and analyzing key metrics that could be used to assess a participant’s ability to deliver an effective presentation. For this, participants were given presentations prepared in advance, centered around the ICT domain, a day in advance, ensuring they were familiar with the content. Given that the participants were primarily students from a Computer Science faculty, this domain was chosen for relevance. Maintaining a consistent environment was crucial; hence, specific application settings were standardized for all participants (the options settings were locked). Every participant was placed in a medium-sized room with half the seats occupied. The virtual audience’s behavior was preset with values ranging from 5 to 10, uniformly distributed. Each participant was then required to deliver three separate presentations spread out over three non-consecutive days.
To facilitate the evaluation of the application, we incorporated three predefined presentations related to the realm of ICT, varying in complexity:
‘The Evolution of Video Games’ (Presentation 1);
‘An Overview of Sorting Algorithms’ (Presentation 2);
‘Machine Learning and Its Practical Applications’ (Presentation 3).
As part of this phase, participants also engaged in a series of questionnaires. They completed an initial questionnaire before embarking on any of the presentations, followed by three smaller sets of questionnaires, each given before and after every individual presentation. Finally, after the completion of all three presentations, they filled out a concluding questionnaire. This strategy was important in understanding each participant’s adaptability and progression from one session to the next. The aim was to understand both the application’s features and the evolution of participants’ public speaking skills across varied sessions.
3. Results and Discussion
The evaluation of the VR4PS application involved a detailed and continuous feedback mechanism, which was crucial in understanding the participants’ experiences and tracking their progression. This was facilitated through the inter-test questionnaire, designed to capture feedback before and after each presentation session.
The per-presentation questionnaire was split into two parts: the first half was filled out before the presentation and the second half immediately after. This design allowed us to gauge the participant’s expectations, preparation, and mindset before the presentation and then contrast it with their post-presentation reflections.
Pre-presentation questions focused on the duration of their preparation for the presentation, mastery over the topic, physical condition on the day, and their anticipated performance. Analysis of this data across all three presentations for each participant (totaling 75 entries) revealed interesting trends:
Most participants spent between 10 and 60 min preparing each presentation. The averages for Presentation 1, Presentation 2, and Presentation 3 were 29, 48, and 51 min, respectively;
A high level of mastery over the presentation subject was indicated, with scores mainly falling between seven and nine;
The physical well-being of participants varied, with most feeling well, but some reported feeling average;
Expectations regarding their performance were generally optimistic, with most predicting a score of around seven.
Analyzing the results per session revealed a notable improvement in performance and confidence from one session to the next (as detailed in
Table 3). The result in each presentation column represents the mean scores the participants gave in each questionnaire, from 1 (lowest score) to 10 (highest score). The time spent on studying increased with each session, indicating growing interest and engagement. Mastery of the presentation topic improved from the first to the second session, though there was a slight drop in the third session, possibly due to the novelty of the topic for some participants. The contrast between anticipated and actual performance showed a positive trend, with participants generally rating their performance higher post-presentation. The application received strong positive feedback throughout, particularly concerning its ease of use and effectiveness in aiding participants.
The VR4PS application incorporated a comprehensive set of metrics to evaluate various aspects of public speaking performance. These metrics were tracked during the presentation sessions and displayed to participants at the end of each session for self-assessment and improvement (
Table 4).
Upon examining the post-session results of the participants (as shown in
Table 4), a consistent upward trend is evident in all the metrics. There is also a strong correlation between these results and the time dedicated to preparing for the presentations (
Table 3). Notably, the most significant improvement was observed in the reduction of filler words, which decreased by nearly 24% from the first to the third presentation. The usage of the pointer also showed a marked improvement, increasing by 20%. Other metrics exhibited notable enhancements, ranging from 5 to 10%. The overall score, which amalgamates all these metrics (
Table 1), showed an overall increase of 11.56% after the three presentations. These data strongly suggest that our system is effectively contributing to the improvement of public speaking skills.
The proposed system, VR4PS, was tested for improving public speaking skills. We do have another statistical study, under review for publication in another journal, that is not in the scope of the current article, from which we concluded that FPS is inversely proportional to the number of held presentations. Through repetition, the fear is minimized.
Based on the results from the testing phase from this article, together with the findings from our other study, we extrapolate that the system could have the potential to cover the aspect of “overcoming fear of public speaking”, in addition to “improving public speaking skills”. It is a flexible application, which could be used by a psychologist, but we have not tested the application yet in people with glossophobia. We intend to conduct in the future a broader assessment of the system, including studies with people who suffer from FPS.
Key distinguishing features of VR4PS set it apart from other commercial or proposed solutions. One feature is to allow users to easily import any PowerPoint presentation for immediate accessibility within the application. Moreover, all parameters used in the metrics’ calculation are highly customizable. This flexibility is important, enabling psychologists to tailor settings based on individual patient responses. Furthermore, the application’s scoring mechanism considers a wide array of factors, elaborated on in
Table 1 and
Table 2. Depending on the chosen settings, the audience dynamically responds to the user’s performance, enhancing the overall interactive experience. The received user feedback has indicated that the application is intuitive and user-friendly.
Evaluation Limitations
This study evaluated training for public speaking, and not the treatment of fear of public speaking. There was a relatively small number of participants, and none of the participants suffered from glossophobia. The demographic was not diverse; all participants came from the same faculty and were close in age and experience. In the future we intend to conduct a broader study, piloting the solution with a considerably larger and more diverse population.
4. Conclusions
In conclusion, the extensive evaluation of the system, including the user questionnaire results, along with an in-depth analysis of presentation durations and post-session results, confirms its efficacy as a public speaking training tool. This comprehensive assessment, expanded by data on time spent per presentation and per participant, as well as metrics like rhythm, head and hand movements, voice clarity, pointer use, gaze, and head swings, provides an in-detail view. The analysis of time spent on each presentation revealed trends in participants’ engagement and adaptability, offering insights into how they managed content and presentation length. Metrics like voice clarity, pointer use, gaze, and head swings provided a deeper understanding of participants’ interaction with the audience and content, essential components of effective public speaking.
Moreover, the application’s success in addressing common public speaking fears and challenges was evident. It provided a safe, controlled, and realistic environment where users could practice and enhance their skills. More importantly, a significant increase in confidence and proficiency in public speaking was noted over time, indicating the application’s usefulness beyond the immediate training sessions.
The feedback and data collected throughout these phases are invaluable for the further development of the application. They highlight areas of success and opportunities for improvement, ensuring that the system evolves in response to user needs and experiences. The application’s ability to create realistic scenarios and offer detailed feedback makes it a powerful tool for individuals at various levels of public speaking expertise.
In essence, the framework has proven to be a promising application in the realm of VR-based educational tools. Its comprehensive approach to simulating real-world scenarios and providing insightful feedback positions it as an essential asset for anyone looking to improve their public speaking skills.
There are a few enhancements that could elevate the user experience and the efficacy of the application: Firstly, to bolster the realism and avoid the redundancy of duplicated audience members, especially in larger settings, there is the potential to implement procedural generation. This would ensure a unique and diverse virtual crowd, further enhancing the immersive feel. Additionally, building on the user interactivity, a promising avenue would be to refine animations so that the audience members’ heads follow the user’s movements. This would simulate a more engaged and natural audience, mirroring real-world interactions. Ultimately, the existing evaluation criteria, while effective, could benefit from further refinement. Through extensive user testing and gathering feedback, it is feasible to glean more insights into the scoring nuances. Moreover, integrating a neural network could be invaluable in fine-tuning the weights attributed to the audience’s interest levels. This machine learning approach could allow the system to adapt and provide more tailored feedback based on various user performances. Incorporating these enhancements not only augments the realism of the application but also provides a more personalized and insightful experience for users aiming to hone their public speaking skills.


 ,
, 


