Abstract
Game platforms have different impacts on player experience in terms of affective states and workloads. By studying these impacts, we can uncover detailed aspects of the gaming experience. Traditionally, understanding player experience has relied on subjective methods, such as self-reported surveys, where players reflect on their experience and effort levels. However, complementing these subjective measures with electroencephalogram (EEG) analysis introduces an objective approach to assessing player experience. In this study, we examined player experiences across PlayStation 5, Nintendo Switch, and Meta Quest 2. Using a mixed-methods approach, we merged subjective user assessments with EEG data to investigate brain activity, affective states, and workload during low- and high-stimulation games. We recruited 30 participants to play two games across three platforms. Our findings reveal that there is a statistically significant difference between these three platforms for seven out of nine experience factors. Also, three platforms have different impacts on play experience and brain activity. Additionally, we utilized a linear model to associate player experience aspects such arousal, frustration, and mental workload with different brain regions using EEG data.
1. Introduction
1.1. Background
Emotional responses play a crucial role in shaping human experiences and impact decision-making, psychological well-being, physical health, and interpersonal relationships [1]. Despite the importance of emotions, the subjective nature of individual experiences poses a significant challenge. It is common for two people to experience similar levels of arousal but interpret them differently. This variability complicates the process of drawing conclusions based solely on subjective data such as user testimonies [1,2].
Recent advancements in neurotechnology—particularly, non-invasive electroencephalogram (EEG) devices like Emotiv, Muse [3], and NeuroSky [4]—have opened new avenues for understanding the intricate relationship between emotions and brain activity [5,6]. These devices provide insights into how the brain reacts to different stimuli, enabling researchers to link EEG patterns to emotional states when a specific stimulus is introduced to trigger emotional responses [7,8]. The literature review by Dadebayev et al. on consumer-grade EEG devices highlighted the expanding use of EEG in medicine, education, and entertainment. Their findings indicated low-cost EEG devices perform comparably to research-grade devices [9]. Therefore, low-cost EEG devices are a viable option for conducting user studies in fields such as user experience design, video games, human–computer interaction, and emotion recognition.
Video games encompass a wide range of genres, play styles, and platforms alongside rapidly evolving design trends. These variations make evaluating player experiences more challenging. By incorporating neurotechnology or EEG to gauge players’ emotional states, we can bring a new dimension to user research for games and enrich the evaluation of play experiences. While several user research methods are currently employed to gauge player experience [10,11], leveraging EEG to understand players’ brain activity, mental workload, and emotional states can further improve the quality of data analysis in user research. EEG data give insight into the brain’s activity during video game gameplay, allowing researchers to examine user attention, emotion, stress, and engagement and assess the qualities of those specific games that contribute to data fluctuations for game developers [12]. The EEG approach can offer insights beyond those captured by traditional methods and thereby open opportunities for more nuanced and player-centric game design.
Despite the potential of EEG in games research, the literature reveals several gaps in combining subjective and objective data, applying EEG in videos games and virtual reality (VR), and comparing multiple game platforms using EEG. So in this research, we carried out user gameplay sessions and explored EEG data across multiple game platforms to evaluate each console’s effectiveness and play experience.
1.2. Research Questions
We framed the following four research questions (RQs) to address player experience and brain activity across the gaming platforms:
- RQ1: How do players’ emotional responses to low- versus high-stimulation games differ across PlayStation 5, Nintendo Switch, and Meta Quest 2 (VR device)?
- RQ2: What differences in cognitive load are observed between low- and high-stimulation games across different gaming platforms?
- RQ3: How does brain activity differ in players playing low- and high-stimulation games across different gaming platforms?
- RQ4: Which brain regions are associated with subjective user experiences and EEG measures across different platforms?
RQ1 and RQ2 explore variations in emotional responses and workload across game stimulation levels and platforms. RQ3 expands this analysis to the neural activity associated with these experiences and provides insights into the brain’s response patterns to gaming. RQ4 further identifies brain regions linked to these subjective and objective experiences and aims to associate EEG data with player perceptions. Collectively, these questions aim to explore how gaming platforms affect player experience, focusing on emotional response, cognitive workload, and brain activity.
1.3. Analysis and Evaluation
We conducted user studies and gathered EEG data and self-reported responses from 30 users interacting with three gaming platforms: PlayStation 5 (a traditional console), Nintendo Switch (handheld), and Meta Quest 2 (virtual reality). The goal was to evaluate how each platform influenced affective responses and the overall workload (mental and physical) that players experience when engaging with different game types. We applied the Russell–Valence Emotion Model to assess user emotions [13], focusing on three dimensions: arousal (intensity of emotion), valence (positive or negative emotion), and dominance (degree of control). We hypothesized low-stimulation games induce emotions characterized by positive valence and low arousal, whereas high-stimulation games were expected to have positive valence and high arousal. This method enabled us to examine how game types and consoles influence emotional states of players. During gameplay, we used the Emotiv EPOC Flex headset to record the raw EEG data and frequency bands.
In our findings, we observed distinct brain activity patterns in EEG data in response to game stimulation levels. These patterns show the sensory–motor cortex’s role in physical and cognitive engagement during gameplay. Further, we identified specific brain regions that closely associate with players’ subjective experiences. This includes linking the prefrontal cortex and sensory–motor areas to emotional states and workload, providing insights for game design and user experience optimization. We anticipate that our findings will provide the game research community with insights into brain activity across various gaming platforms and game types and also open up opportunities for future investigations into the integration of games and EEG analysis.
2. Related Works
EEG-based analysis is utilized across diverse fields, including rehabilitation, emotion recognition, brain state identification, video games, and virtual reality. This section highlights the various applications of EEG technology, demonstrating its versatility and effectiveness in different contexts.
2.1. Application of EEG for Emotion Recognition and Brain State Detection
Surangsrirat et al. explored the feasibility of using low-cost EEG devices in research by recording brainwaves from Buddhist monks during meditation using the Muse EEG headset. In their study, they collected data from seven sensors and four data channels and also captured additional information like eye blinks and jaw clenches. Their preliminary findings indicate that low-cost EEG devices are capable of effectively recording EEG signals and can be applied in contexts where high-cost equipment may be challenging for deployment. This study illustrates the growing utility of affordable EEG technology in diverse study settings [14]. Sabio et al. reviewed the current literature on the use of consumer-grade EEG devices for gathering neural data. They discovered that Emotiv EEG devices were predominantly utilized in a variety of studies. Additionally, they observed that these EEG devices were employed for purposes such as brain–computer interfaces (BCIs), data validation, and clinical research [15].
EEG-based studies also play a major role in the application of brain–computer interfaces (BCIs), especially in rehabilitation and therapeutic settings [16,17]. For instance, Chen et al.’s research demonstrates the potential of BCIs for individuals with motor impairment through the hybrid use of functional near-infrared spectroscopy (fNIRS) and electroencephalography (EEG). They emphasize the significance of BCIs for improving communication, controlling robotic prosthetics, and aiding motor rehabilitation by providing real-time feedback and continuous monitoring of brain states [18].
Another area where EEG studies can be applied is in road safety. Drowsiness significantly contributes to traffic and industrial accidents, impacting lives and productivity. LaRocco et al. conducted a systematic review of EEG headsets as potential drowsiness detectors; this is particularly valuable for small businesses and developing countries. They examined devices like Neurosky MindWave, InteraXon Muse, Emotiv Epoc, Emotiv Insight, and OpenBCI [19] across 46 studies [20]. Chen et al. employed an EEG-based protocol in a simulated driving environment to explore the relationship between panic emotions and accident-avoidance ability [21]. In this study, they were able to simulate driving scenarios and observe emotional states of drivers [21].
EEG analysis has also been applied in studies involving emotion recognition in students using approaches combining machine learning models and EEG data [22,23]. Avola et al. developed the Empátheia system, which encodes EEG signals into images using the PRISMIN framework to create a compact representation [24]. This system classifies the encoding with convolutional, recurrent, and transformer models. The model was tested on the Shanghai Jiao Tong University (SJTU) Emotion EEG Dataset (SEED), and their approach significantly reduced data size while maintaining high performance. Sánchez-Reolid et al. compared the low-cost Emotiv EPOC+ with the high-end BrainVision EEG for detecting emotions among 20 participants [25]. Their study revealed more significant features in the high-end EEG but highlighted that both devices performed well at emotion classification.
Suhaimi et al. conducted a study using a VR headset to induce four emotions (happy, scared, calm, and bored) and collected data with a low-cost EEG headset [26]. They evaluated the emotion recognition system using machine learning algorithms with a focus on intra-subject and inter-subject classifications. Their findings showed strong performance for four-class emotion classification using support vector machines [26]. Sakib et al. explored the use of EEG for screening anxiety disorders among university students by using a wireless 14-channel EEG headset. Their study utilized an SVM classifier to analyze EEG data filtered into six frequency bands. This approach suggests the potential of combining EEG and machine learning models to effectively identify anxiety [27]. Findings from the literature review by Dadebayev et al. outlined that the participants’ age and gender could affect the EEG data outcomes, and also, there is no specific feature extraction method that applies to all cases [9]. Another challenge with EEG analysis is that the data introduce complexities such as intrusion of artifacts. So it is essential that studies employing EEG should also consider these factors [28].
2.2. Application of EEG in Video Games and Virtual Reality Environments
The research conducted by Liu et al. investigates real-time EEG-based human emotion recognition, focusing on identifying emotions from EEG signals. This aspect aligns with our exploration of emotional responses in gaming environments. Their work addresses the challenges of accuracy in emotion recognition algorithms and the scarcity of labeled EEG databases, which closely aligns with our objectives to refine emotion recognition methods within gaming contexts [29]. Also, this research method employed audio stimuli to evoke emotions in participants and utilized fractal dimension analysis on EEG data. The insights gained from this approach informed our experimental design. Additionally, their technique of mapping emotional states onto 3D avatars in real-time has the potential to enhance the monitoring and analysis of emotional responses during gaming sessions. In the studies conducted by Cano et al. and Ahonen et al., EEG analysis was employed to assess mental workload and brain activity in gaming environments [30,31].
Marucci et al. explored the impact of multisensory stimuli on target detection in a virtual reality setting by using EEG and galvanic skin response measurements under high and low perceptual loads [32]. Their findings showed that the combination of visual, auditory, and tactile stimuli improved performance and also enhanced the sense of presence within the virtual environment. The study carried out by Zyma et al. examined EEG characteristics during mental serial subtraction tasks using the International 10/20 system. Participants were categorized as good or bad counters based on their task performance [33].
The research study by Babusiak et al. evaluated the effectiveness of serious games for enhancing logical thinking by monitoring EEG activity among 21 participants [34]. The findings indicated that serious games designed in the context of this study activated beta waves during puzzle-solving activity. This study also illustrated the importance of using EEG analysis to investigate cognitive functions in educational settings.
Pellouchoud et al. analyzed the mental effort involved in video game gameplay by monitoring EEG signals. Their research revealed modulations in EEG signals related to cognitive load during gaming, showing the potential of video games to engage cognitively diverse populations, including children with epilepsy [35]. Malik et al. explored the impact of large screen sizes on EEG activity during video game gameplay [36]. Their study provides a framework for understanding the neural correlates of gaming on large displays, with techniques like absolute power computation and coherence analysis offering insights into active brain regions and inter-region phase stability during gameplay. This research is also an inspiration for our study on how different gaming consoles and screen sizes influence emotional and cognitive responses. Mondéjar et al. investigated the relationship between video game mechanics and executive functions using EEG, highlighting the cognitive skills utilized during gaming. Their findings on how game mechanics induce specific brain activity patterns are similar to our research into the effects of gaming on neural and emotional functions [37].
We further expanded our literature review to explore visual stimulation and cognitive response. Specifically, a study by Khairuddin et al. [38] investigated how 2D and 3D gaming modes impact EEG signal complexity, with the goal of understanding variations in brain activity in response to different visual stimuli. Cabañero-Gómez et al. focused on the integration of EEG with video games, mapping out the essential tools and methodologies for EEG data analysis in gaming research [39]. Research conducted by GomezRomero-Borquez et al. [40] investigated the cognitive effects of different VR game categories on concentration levels, emphasizing the unique cognitive engagements induced by each genre. This study showed how specific VR game types uniquely influence cognitive focus and engagement, providing insights into designing more effective VR gaming experiences.
The study by Laura et al. [41] focused on predicting video game difficulty levels in games such as Tetris through EEG data; this marks a significant shift from traditional binary classification in BCIs to detecting nuanced mental states like cognitive workload. McMahan et al. [42] investigated the impact of stimulus modalities within gaming environments on cognitive processes. They advocated for the use of psychophysiological measures instead of subjective questionnaires to more accurately assess gamers’ cognitive experiences, illustrating the importance of objective metrics in cognitive research. Oliviera et al. [43] explored differences in inter-hemispheric brain wave activation during VR motor tasks, providing insights into how VR affects brain activity and cognitive functions broadly. This research highlighted VR’s potential to influence various cognitive domains, informing the understanding of VR’s impact on cognitive enhancement.
Paranthaman et al. conducted a study to examine factors such as immersion and comfort in mixed reality (MR) and virtual reality (VR) environments during obstacle clearance tasks. Twelve participants were recruited to experience both VR and MR conditions. The study utilized self-reported questionnaires to assess the levels of immersion and comfort. The results indicated that participants reported significantly higher levels of immersion and enjoyment in VR compared to MR [44].
Beyer et al.’s research combined objective and subjective data to analyze video streaming bandwidth and player experiences in cloud gaming [45]. In addition to objective assessments, EEG analysis has been applied to predict difficulties in video games using classification techniques [41] and to detect addiction in gaming [46]. Another innovative approach involves integrating EEG with other sensors like heart rate monitors to gauge player experience [47]. Similarly, Amjad et al. combined the Xbox 360 Kinect with the Emotiv EEG headset to investigate the effects of Xbox 360 cognitive games on the cognitive functions of older participants [48].
Utilizing methodologies and insights from previous studies has further contributed to our understanding of how gaming technology influences neural functioning. Building on these findings, we identified key research gaps in the application of EEG within the gaming context. Firstly, there is a notable lack of studies that combine subjective and objective data collection methods in video games and VR, which restricts the depth of insights achievable through either approach alone. Secondly, integrating VR with EEG is relatively sparse, likely due to technical challenges and the difficulty of managing EEG artifacts from physical movements within VR settings. Additionally, while some research has examined EEG in gaming, these studies often focus on a single platform, limiting the breadth of understanding across different gaming environments. Lastly, there is a demand for more precise brain activity data, prompting us to use a 32-channel EEG headset over a 14-channel setup [49] to achieve a more detailed examination of the neural dynamics in gaming. By addressing these identified gaps, this research aims to contribute to the broader fields of game user research, brain–computer interface technology, and interaction design.
3. Experiment Design
3.1. Participants
We recruited 30 participants for this study. First, we conducted a demographics survey prior to the study, for which we collected information on age, gender, and previous gaming experience. The participant pool included 24 males, 4 females, 1 non-binary individual, and 1 individual who preferred not to disclose their gender (participant age: mean = 20.03; SD = 1.45). All participants had prior experience with video games, with 19 identifying as expert players. Specifically, 28 had previously played on the Nintendo Switch, 21 had used a virtual reality headset, but only 9 were familiar with the PlayStation 5. This lower familiarity with the PlayStation 5, as opposed to the 20 participants who had experience with the PlayStation 4, suggests the newer console’s relative unpopularity at the time of the study.
3.2. Apparatus
3.2.1. Consoles and EEG Device
We used the Emotiv EPOC Flex EEG headset: a 32-channel BCI device that records electroencephalogram signals [50]. In addition to the headset, we selected three game consoles for analysis. The Nintendo Switch, our first console, features button controllers and a handheld touchscreen alongside joystick controls. Our second console, the PlayStation 5, operates via HDMI with a stationary display screen and controllers that offer advanced feedback based on in-game actions. The final console we analyzed is the Meta Quest 2 VR headset (see Figure 1).

Figure 1.
Participants wearing the Emotiv EPOC Flex EEG cap in user study sessions across three different platforms: (left) a participant engages in the high-stimulation game (Spider-Man 2018) on PlayStation 5; (center) a participant plays Mario Kart on Nintendo Switch; (right) a participant interacts with The Room VR on Meta Quest 2.
3.2.2. Low- and High-Stimulation Games
We selected a low-stimulation and high-stimulation game for each console. For the low-stimulation game, we assigned Minecraft (in Creative mode) for the Nintendo Switch and PlayStation 5 and The Room VR: A Dark Matter for Meta Quest 2. These games require minimal mental effort and physical dexterity and provide creative freedom or relaxed-paced puzzle-solving. They aim to elicit emotional responses characterized by low arousal and positive valence.
On the other hand, the high-stimulation games in the context of this research study challenge players with tasks that demand constant mental focus and dexterity, aiming to elicit emotional states of high arousal and positive valence. For Meta Quest 2, we selected Beat Saber: a rhythm game that requires players to slice blocks to the beat, demanding continuous attention and physical movement. Mario Kart for the Nintendo Switch and the Spider-Man: Remastered “Clearing the Way” mission for PlayStation 5 were chosen for their action-packed and challenge-rich gameplay, respectively, both necessitating high mental concentration and physical engagement/interaction.
3.3. Procedure
Before the user study sessions began, we prepared the Emotiv EEG head cap by hydrating all sensor felts and fitting them onto the EEG cap, which involved 32 channels. We then wirelessly connected the EEG headset to a computer for data collection and placed the cap on the user’s head; this process took approximately 20 to 25 min. Each session started with a pre-test, where users filled out demographic information and consented to the use of their responses and gameplay data for research. Prior research indicates that EEG studies involving VR with gameplay lasting more than 5 to 10 min may cause discomfort in users and affect EEG data [49]. So we limited gameplay and data collection to 5 min per game. We first assigned the low-stimulation game, and after this, the users completed a post-test questionnaire, took a 5-min break, and then proceeded with the high-stimulation game following the same procedure. At the end of the study, users received a USD 10 Amazon gift card, and the entire study lasted 40–60 min for each participant.
For data collection, we utilized subjective post-test self-reported questionnaires and objective measures from the EEG headset. We recorded raw EEG data from the 32-channel Epoc Flex head cap, covering sensors AFz (DRL), FCz (CMS), Fp1, Fp2, F7, F3, Fz, F4, F8, FT9, FC5, FC1, FC2, FC6, FT10, T7, C3, Cz, C4, T8, CP5, CP1, CP2, CP6, TP9, TP10, P7, P3, Pz, P4, P8, O1, Oz, and O2 (10–20 System) [50]. For subjective data collection, we assessed player affect and workload using the Self-Assessment Manikin (SAM) for measuring valence, arousal, and dominance [51] and the NASA Task Load Index (NASA TLX) for measuring mental, physical, and temporal demands, including effort, performance, and frustration levels [52].
4. Results and Discussion
In this section, we analyze subjective responses and EEG data, focusing on the SAM, NASA TLX, and brain activity from EEG. This analysis aims to address our four research questions framed in Section 1.2 by exploring the impact of game stimulation levels on emotional response, cognitive load, and brain activity.
4.1. Affective Experience Analysis Using Self-Assessment Manikin (Low- and High-Stimulation Games)
To address our first research question (RQ1), we investigated emotional responses from SAM during low- and high-stimulation games on the three platforms. Figure 2 illustrates these levels in two graphs, while Figure 3 presents the mean and standard error.
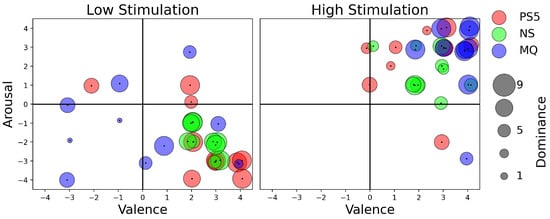
Figure 2.
Affective experience: valence, arousal, and dominance scores from SAM for all the players for low- and high-stimulation games across three game consoles: namely, PS5—PlayStation 5, NS—Nintendo Switch, and MQ—Meta Quest 2.
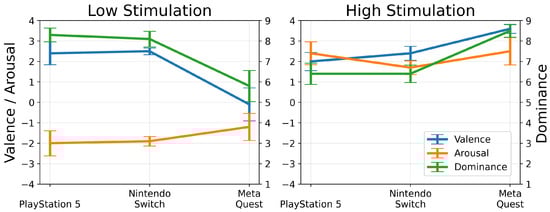
Figure 3.
Average scores of valence, arousal, and dominance from game consoles for low- and high-stimulation games along with standard error.
We found that dominance, or the level of control users felt, varied significantly in high-stimulation games, particularly with Meta Quest 2 players experiencing the highest sense of control. The variability in dominance for Nintendo Switch and PlayStation 5 suggests that game choice impacts perceived control. For instance, Meta Quest 2’s Beat Saber, with its repetitive block patterns, likely enhances players’ sense of control compared to the more unpredictable gameplay on the other consoles. Conversely, for low-stimulation games, players on the PlayStation 5 and Nintendo Switch reported higher dominance levels, whereas Meta Quest 2 users showed varied levels of dominance. This variation might stem from the different gameplay experiences offered by Minecraft (on PlayStation 5 and Nintendo Switch), which allows for environment control, versus The Room VR (on Meta Quest 2), which presents a fixed environment with some challenges (see Figure 2 and Figure 3).
Valence remained predominantly positive for both low- and high-stimulation games across all platforms, except for the low-stimulation game on Meta Quest 2, suggesting most of the gameplay elicited positive emotional responses. The negative responses for Meta Quest 2’s low-stimulation game, The Room VR, could relate to user frustration with completing interaction tasks. Arousal responses aligned with expectations for high- and low-stimulation games, indicating either high or low arousal, albeit with some outliers. These outliers may result from individual differences in game perception or task completion ability.
For the statistical analysis, we applied the Shapiro–Wilk test for normality and the Levene test for homogeneity of variance to our dataset. The results indicated a failure to assume normal distributions and homogeneity of variance across our datasets. So we selected the Wilcoxon rank-sum test, a non-parametric equivalent to the independent samples t-test, to conduct pairwise comparisons between the gaming platforms (PlayStation 5 vs. Nintendo Switch, PlayStation 5 vs. Meta Quest, and Nintendo Switch vs. Meta Quest). In total, nine attributes were examined: three from SAM (hldominance, valence, arousal) and six from NASA TLX (mental workload, physical workload, temporal workload, performance, effort, and frustration). Statistically significant differences were observed for dominance and valence when comparing PlayStation 5 vs. Meta Quest and Nintendo Switch vs. Meta Quest, indicating variations in how players perceived their control, emotional state, and performance across these platforms (see Table 1).

Table 1.
The table shows the p-values for pair-wise comparison of low- and high-stimulation games for the three game platforms for reported player experience, where PS5, NS, and MQ are PlayStation 5, Nintendo Switch, and Meta Quest, respectively. * = p < 0.05; † = p < 0.001.
4.2. Discussion on Affective Experience Analysis
4.2.1. Dominance across Platforms
The observed significant differences in dominance across the Meta Quest, PlayStation 5, and Nintendo Switch show the impact of each platform’s design on player control. The Meta Quest’s VR immersion and spatial interaction afford the sense of control and presence, highlighting the direct influence of immersive and physical gaming environments on player dominance. In contrast, the PlayStation 5’s use of advanced haptic feedback and adaptive triggers offers a tactile, responsive gaming experience that enhances player agency and control, albeit in a less spatially immersive context than VR. The Nintendo Switch distinguishes itself through portability and versatility, providing a unique form of control adaptability.
4.2.2. Valence and Emotional Engagement
The Meta Quest’s capacity for immersion into three-dimensional worlds significantly broadens the emotional aspects players experienced, from exhilaration to tension, suggesting that VR’s immersive qualities and the level of game stimulation influence valence. Conversely, the PlayStation 5’s graphics may enhance the gaming experience by eliciting stronger emotional reactions. The detailed environments contribute to a rich emotional landscape, highlighting the role of visual immersion in shaping responses to games with different levels of stimulation, such as Spider-Man 2018 versus Minecraft. The Nintendo Switch offers a contrast in valence through games like Mario Kart and Minecraft, accommodating a broad range of emotional experiences. This versatility underlines how the platform’s design and the selected games’ stimulation levels contribute to diverse emotional engagements.
The statistical findings from SAM (valence, arousal, and dominance) address RQ1 by showing that valence differences stem not only from platform design but also from the stimulation levels of the chosen games. This illustrates the interplay between game design, platform features, and emotional responses, which is essential for understanding how different games elicit emotional experiences across various platforms.
4.3. Workload Analysis Using NASA Task Load Index (Low- and High-Stimulation Games)
To address our second research question (RQ2), we analyzed workloads using the post-test NASA TLX questionnaire, which measures six properties across low- and high-stimulation games on three platforms. We observed the temporal workload in NASA TLX responses, indicating users’ feelings of being overwhelmed by task timing within the games, as shown on Figure 4’s vertical axis. High-stimulation games demanded more temporal workload across all consoles, whereas low-stimulation games required less. Mental workload describes the cognitive demand users experienced during gameplay (illustrated by Figure 4’s horizontal axis). Users of the Nintendo Switch and PlayStation 5 reported lower mental demand for low-stimulation games, while Meta Quest 2 users reported higher mental demand, possibly due to The Room VR’s complexity involved in interactions. For high-stimulation games, Nintendo Switch and Meta Quest 2 users reported varied mental demand, whereas PlayStation 5 users reported high mental demand.
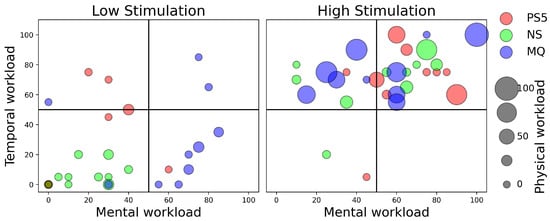
Figure 4.
NASA Taskload Index scores of all the players for low- and high-stimulation games across three game consoles: namely, PS5—PlayStation 5, NS—Nintendo Switch, and MQ—Meta Quest 2. Plot axis labels are Mental Workload (x-axis), Temporal Workload (y-axis), and Physical Workload (size of circles, ranging from 0–100).
Physical workload measured by NASA TLX reflects the physical demands felt during gameplay and is shown by the point size in Figure 4. Users reported minimal physical demand for low-stimulation games across all platforms. Participants for the Meta Quest 2 section in this study reported high physical demand for high-stimulation games, and this could be due to the need for arm movement and standing in Beat Saber in contrast to the seated finger movements required by the other consoles. The effort required, as depicted by Figure 5’s vertical axis, was relatively low for low-stimulation games on all consoles, with some Meta Quest 2 and PlayStation 5 outliers indicating higher effort. These outliers could be a reflection of unfamiliarity with the console controls or the Meta Quest 2’s movement requirements. High-stimulation games uniformly demanded high effort across all platforms.

Figure 5.
NASA Taskload Index scores of all the players for low- and high-stimulation games across three game consoles: namely, PS5—PlayStation 5, NS—Nintendo Switch, and MQ—Meta Quest 2. Plot axis labels are Frustration (x-axis), Effort (y-axis), and Performance (size of circles, ranging from 0–100).
Frustration levels, shown by Figure 5’s horizontal axis remained low for low-stimulation games except for the Meta Quest 2 participants. The aspect of frustration for high-stimulation game varied across all consoles except for Meta Quest 2, which remained low, likely due to Beat Saber’s straightforward mechanics compared to the more dexterous requirements of the other consoles’ games. Lastly, the performance in NASA TLX, illustrated by the point size in Figure 5, shows that the Nintendo Switch players felt relatively unsuccessful at navigating low-stimulation gameplay, whereas PlayStation 5 players’ success varied and Meta Quest 2 players felt highly successful. For high-stimulation games, Nintendo Switch and Meta Quest 2 players felt relatively unsuccessful: attributed to the fast-paced gameplay of Beat Saber and Mario Kart.
4.4. Discussion on Workload Analysis
4.4.1. Performance Efficiency Differences
Statistical analysis shows a statistically significant difference in performance across the Meta Quest 2, PlayStation 5, and Nintendo Switch, attributed to each platform’s unique features (see Table 1). The Meta Quest’s VR environment enhances the tangibility of achievements in high-stimulation games like Beat Saber, impacting performance perception. In contrast, the PlayStation 5’s graphics and narrative depth exemplified by Spider-Man 2018 elevate engagement and satisfaction with performance outcomes (see Table 1).
4.4.2. Physical Workload and Frustration
The Meta Quest, especially with VR games requiring detailed physical interaction like The Room VR, increases cognitive load and potential frustration. This contrasts with the less-demanding nature of interactions on the PlayStation 5 and Nintendo Switch. The impact of game stimulation level on cognitive load and emotional response is significant, with high-stimulation games generally increasing perceived workload and frustration.
These results highlight the diverse cognitive and physical demands VR gaming introduces, particularly on platforms like the Meta Quest 2. Understanding these demands is vital for designing games that balance immersive engagement with cognitive demands and enhancing player satisfaction across different platforms and stimulation levels (see Figure 6).
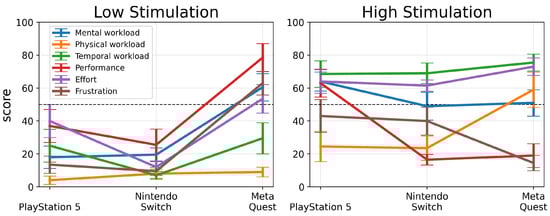
Figure 6.
Average scores along with standard errors for NASA Taskload Index for game consoles for low- and high-stimulation games.
4.5. Brain Activity of Players for Low- and High-Stimulation Games across Different Game Platforms
The topographic brain activity heatmaps illustrated in Figure 7 show a visual representation of the average brain activity (power in dB) across players obtained from the EEG. The power values in this context range from 0.5 to 3.5 dB and indicate the intensity of brain activity within frequency bands 0.5 to 47 Hz. The power values ranging from 0.5 to 3.5 dB within 0.5 to 47 Hz frequency bands reflect brain activity intensity and relate to various cognitive and emotional states. The Meta Quest’s topographic heatmaps consistently show intense activity in the prefrontal cortex for both low- and high-stimulation games, indicating significant cognitive and emotional engagement, especially in decision-making and problem-solving areas. This is consistent with NASA TLX responses, where low-stimulation games elicited higher effort and workload, highlighting VR’s immersive nature, which demands considerable cognitive effort and emotional investment across game types. For the Nintendo Switch, low-stimulation games like Minecraft show minimal brain activity, suggesting relaxation and creative engagement, while high-stimulation games like Mario Kart increase cognitive engagement due to their fast-paced nature. The PlayStation 5 heatmaps reveal moderate to high brain activity levels for low- and high-stimulation games, respectively, with the latter showing increased activity in visual processing areas, indicating the PS5’s capability to engage players with its graphics and gameplay dynamics. These findings address RQ3 and show the distinct cognitive and emotional demands of gaming across different platforms and stimulation levels, emphasizing the need for balanced sensory immersion in VR to prevent cognitive overload and enhance player satisfaction. Compared to VR’s consistent high engagement and the Nintendo Switch’s flexible activity levels, the PS5 serves as a middle ground that shows the ability to produce visually engaging experiences that command attention and stimulate cognitive processes.
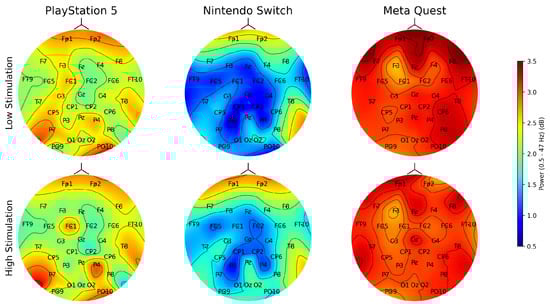
Figure 7.
Topographic heatmaps of average brain activity for low-stimulation and high-stimulation games on different game platforms. The heatmaps indicate the power across different brain regions, characterized by neural activity. The top notch of each heatmap indicates the nose, as in the front side of the brain.
4.6. Linear Model of Subjective Responses and Brain Activity
To address RQ4, we explored the association between players’ experiences (captured by responses) and corresponding brain activity using the EEG data. The associations between brain activity and players’ experiences are established using linear models [49]. We first pre-processed the EEG data using a fifth-order IIR high-pass filter with a cut-off frequency of 0.5 Hz. This was followed by the application of an artifact removal algorithm (ATAR) [53]. After cleaning the EEG signals, the power of each sensor was computed for six different frequency bands: namely, —Delta (0.5–4 Hz), —Theta (4–7.5 Hz), —Alpha (8–13 Hz), —Beta (14–30 Hz), —Gamma (32–47 Hz), and a full band (0.5–47 Hz). Finally, the average power of each sensor for the entire duration of gameplay was computed using the Welch method and was mapped to log scale as . Addition of 1 before applying log ensures the range of power being positive and also avoids large negative values.
To formulate the linear model, we denote players’ experiences as E (e.g., arousal, frustration, etc,) and to denote the score for experience E: for example, for arousal. We also denote the power of the k-th sensor in the band as . Thus, a linear model for a player experience (e.g., arousal), can be written as follows:
where is an estimated score for experience. Before applying the linear model as shown in (1), all the power values for each sensor for given frequency band were normalized to scale to zero-mean and one standard deviation. SAM scores range from −4 to 4, while NASA TLX scores are scaled from 0 to 1. For modeling one experience (e.g., arousal), EEG recordings of both low- and high-stimulation gameplay for each player were considered, which resulted in 60 data-points, including 32 average power values for each channel. The linear model was fitted to the average power of each sensor for a given frequency band using linear regression by minimizing the mean square error (MSE) of players’ experience scores and an estimated value . In total, we developed six linear models for each experience: one for each frequency band.
The goodness of fit (MSE) for each model is shown in Figure 8. From Figure 8 (left panel), it can be observed that the MSE for valence and dominance are much lower than that of arousal, which reflects that linear association of power with arousal is not as strong as valence and dominance. For the valence MSE, the alpha and beta bands are lower than 0.1, which reflects that, on average, estimation of valence using the average power in the alpha band makes ±0.1 error when estimating a score that ranges from −4 to 4. Table 2 shows the sensors that are strongly associated (p < 0.05 and p < 0.001) with nine experience factors for each frequency band under the linear model.
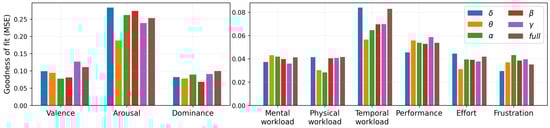
Figure 8.
Goodness of fit—MSE (mean square error) for all six models for each player experience. Six models for each experience are linear models obtained from six different frequency bands: namely, —Delta, —Theta, —Alpha, —Beta, —Gamma, and full frequency band. The range of score for SAM was -4 to 4, and for NASA TLX, it was from 0 to 1.
Table 2.
The table shows the list of sensors that are significantly (p < 0.05) associated with given player experiences in given frequency bands. These associations are obtained using the linear model explained in Section 4.6. Only sensors with p < 0.05 are shown; † = p < 0.001.
Similarly, it can be observed from Figure 8 (right panel) that the MSE values for almost all NASA TLX items are under 0.08 (except two bands in the temporal workload), where we estimated scores that ranged from 0 to 1. Looking into the mental workload, the best among six models is a model built on the band, with an MSE under 0.04. This indicates the average estimation error is 4%. Finally, it is interesting to note that the best model among six bands for each player experience factor is built on a different frequency band. For example, the best model for valence is built on ; for arousal, it is ; and for dominance, it is . Similarly, they are different for NASA TLX experiences. We have also included additional graphs displaying the variations of average power across three platforms for low- and high-stimulation games (see Figure 9 and Figure 10).
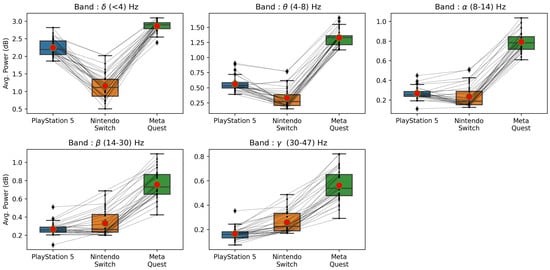
Figure 9.
Average power values across five frequency bands (—Delta, —Theta, —Alpha, —Beta, and —Gamma) for the low-stimulation games across three game platforms.
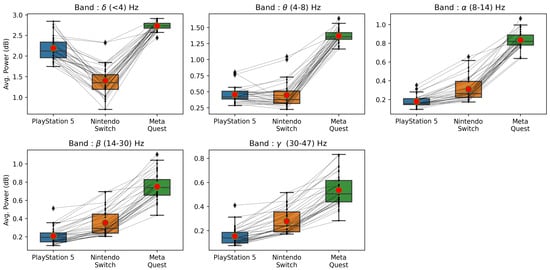
Figure 10.
Average power values across five frequency bands (—Delta, —Theta, —Alpha, —Beta, and —Gamma) for the high-stimulation games across three game platforms.
The estimated coefficient for each linear model reflects the relationship between the players’ experience level and the k-th sensor (region of the brain). To analyze the associations between brain region and player experience, we plotted topographic maps of the best-fit models for all nine player experience factors in Figure 11, where the significant associations are shown by white stars (p < 0.05) or white crosses (p < 0.001). Notably, the sensory–motor cortex (central part of the brain region) shows a strong correlation with physical workload, temporal workload, and effort, pointing to this region’s pivotal role in responding to gaming demands. This finding indicates a direct connection between the physical aspects of gaming and brain activity. Interestingly, frustration is associated with low-level activities.
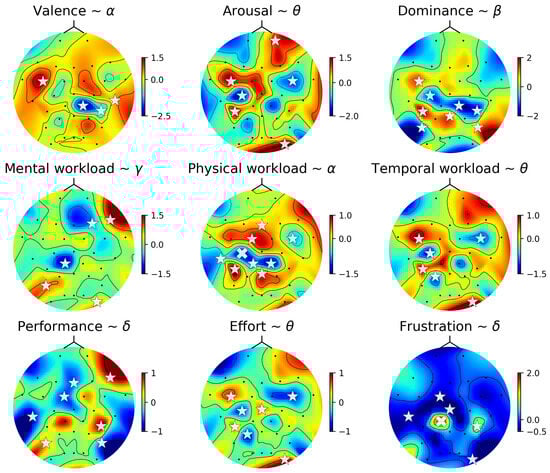
Figure 11.
Topographic heatmap for brain regions associated with players’ subjective responses (affective response and workload) using the linear model. This figure displays the best-fit model across various frequency bands, with sensors showing statistically significant associations highlighted by white stars (p < 0.05) or white crosses (p < 0.001).
By mapping EEG data to subjective experiences, these findings provide insights for future investigations in game research. The findings also suggest the importance of designing games that align with the players’ cognitive and emotional capacities, aiming for engagement without overwhelming aspects.
5. Conclusions
In this research, we investigated the player experience factors involved in two game types across three game platforms through subjective evaluations and EEG data. Our findings show that the game type (low- and high-stimulation) significantly affects players’ affective states and workloads across different platforms, with VR games notably requiring more cognitive and physical effort. We plotted topographic heatmaps for these platforms and game types, showcasing the relationship between play experience and brain activity. Additionally, our use of a linear model to correlate subjective responses with EEG data identified a direct connection between the physical demands of gaming and the activation of brain regions. One key aspect is that we explored the objective underpinnings of gaming enjoyment and immersion, discovering associations between physical workload, effort, and brain activity in the central motor cortex. However, our initial scope of study is limited by a small participant group and a narrow selection of games, and this highlights the necessity for expansive future work to include a wider demographic and more game genres. Another limitation of the study was the use of only a baseline artifact removal technique with ATAR for EEG data processing, which mainly addressed common artifacts from facial and muscle movements, such as eye blinks. Given the specific requirements of VR actions, a more dedicated artifact removal approach is necessary. Therefore, we plan to use the data from this study as a foundation to refine and enhance the artifact removal algorithm for future applications. Additionally, we encountered challenges in the study due to EEG connectivity and sensor felts, which required frequent hydration of the sensor felts or adjustments to the nodes on the EEG cap.
We believe these findings can be instrumental for future work in game design, immersive technologies, and game user research. Also, the findings highlight the potential of creating games that not only entertain but also serve as tools for education, therapy, and social connection, enriching the fields of video game and player experience research.
Author Contributions
Conceptualization, P.K.P. and N.B.; methodology, P.K.P. and N.B.; validation, N.B. and P.K.P.; formal analysis, N.B.; investigation, S.G.; resources, S.G., P.K.P. and N.B.; data curation, S.G.; data collection, S.G.; writing—original draft preparation, S.G., P.K.P. and N.B.; writing—review and editing, S.G., P.K.P. and N.B.; visualization, N.B.; supervision, P.K.P.; project administration, S.G., P.K.P. and N.B. All authors have read and agreed to the published version of the manuscript.
Funding
This research received no external funding.
Institutional Review Board Statement
The study was approved by the Institutional Review Board (or Ethics Committee) of Elon University (protocol ID 2742 and date of approval 1 May 2023) for studies involving humans.
Informed Consent Statement
Informed consent was obtained from all subjects involved in the study.
Data Availability Statement
Dataset are available on request from the authors.
Conflicts of Interest
The authors declare no conflicts of interest.
References
- Alakus, T.B.; Gonen, M.; Turkoglu, I. Database for an emotion recognition system based on EEG signals and various computer games—GAMEEMO. Biomed. Signal Process. Control 2020, 60, 101951. [Google Scholar] [CrossRef]
- Holman, M.; Adebesin, F. Taking the subjectivity out of UX evaluation with emotiv EPOC+. In Proceedings of the SAICSIT ’19: South African Institute of Computer Scientists and Information Technologists 2019, Skukuza, South Africa, 17–18 September 2019; Association for Computing Machinery: New York, NY, USA, 2019. [Google Scholar] [CrossRef]
- Muse. Muse Website. 2024. Available online: https://choosemuse.com/ (accessed on 15 May 2024).
- NeuroSky. NeuroSky Website. 2024. Available online: https://neurosky.com/ (accessed on 15 May 2024).
- Pireva, K.; Tahir, R.; Shariq Imran, A.; Chaudhary, N. Evaluating learners’ emotional states by monitoring brain waves for comparing game-based learning approach to pen-and-paper. In Proceedings of the 2019 IEEE Frontiers in Education Conference (FIE), Covington, KY, USA, 16–19 October 2019; pp. 1–8. [Google Scholar] [CrossRef]
- Kosiński, J.; Szklanny, K.; Wieczorkowska, A.; Wichrowski, M. An analysis of game-related emotions using EMOTIV EPOC. In Proceedings of the 2018 Federated Conference on Computer Science and Information Systems (FedCSIS), Poznan, Poland, 9–12 September 2018; pp. 913–917. [Google Scholar]
- Martínez-Tejada, L.A.; Puertas-González, A.; Yoshimura, N.; Koike, Y. Exploring EEG Characteristics to Identify Emotional Reactions under Videogame Scenarios. Brain Sci. 2021, 11, 378. [Google Scholar] [CrossRef] [PubMed]
- Ramirez, R.; Planas, J.; Escude, N.; Mercade, J.; Farriols, C. EEG-Based Analysis of the Emotional Effect of Music Therapy on Palliative Care Cancer Patients. Front. Psychol. 2018, 9, 254. [Google Scholar] [CrossRef] [PubMed]
- Dadebayev, D.; Goh, W.W.; Tan, E.X. EEG-based emotion recognition: Review of commercial EEG devices and machine learning techniques. J. King Saud Univ.-Comput. Inf. Sci. 2022, 34, 4385–4401. [Google Scholar] [CrossRef]
- Haider, A.; Wallner, G.; Gerling, K.; Vanden Abeele, V. Preliminary Study of the Performance of the miniPXI when Measuring Player Experience throughout Game Development. In Proceedings of the CHI PLAY Companion ’23: Companion Proceedings of the Annual Symposium on Computer-Human Interaction in Play, Stratford, ON, Canada, 10–13 October 2023; Association for Computing Machinery: New York, NY, USA, 2023; pp. 56–62. [Google Scholar] [CrossRef]
- Denisova, A.; Nordin, A.I.; Cairns, P. The convergence of player experience questionnaires. In Proceedings of the CHI PLAY ’16: 2016 Annual Symposium on Computer-Human Interaction in Play, Austin, TX, USA, 16–19 October 2016; Association for Computing Machinery: New York, NY, USA, 2016; pp. 33–37. [Google Scholar] [CrossRef]
- Cui, R.; Jiang, J.; Zeng, L.; Jiang, L.; Xia, Z.; Dong, L.; Gong, D.; Yan, G.; Ma, W.; Yao, D. Action Video Gaming Experience Related to Altered Resting-State EEG Temporal and Spatial Complexity. Front. Hum. Neurosci. 2021, 15, 640329. [Google Scholar] [CrossRef] [PubMed]
- Russell, J. A circumplex model of affect. J. Personal. Soc. Psychol. 1980, 39, 1161–1178. [Google Scholar] [CrossRef]
- Surangsrirat, D.; Intarapanich, A. Analysis of the meditation brainwave from consumer EEG device. In Proceedings of the SoutheastCon 2015, Fort Lauderdale, FL, USA, 9–12 April 2015; pp. 1–6. [Google Scholar] [CrossRef]
- Sabio, J.; Williams, N.S.; McArthur, G.M.; Badcock, N.A. A scoping review on the use of consumer-grade EEG devices for research. PLoS ONE 2024, 19, e0291186. [Google Scholar] [CrossRef] [PubMed]
- Sarhan, S.M.; Al-Faiz, M.Z.; Takhakh, A.M. A review on EMG/EEG based control scheme of upper limb rehabilitation robots for stroke patients. Heliyon 2023, 9, e18308. [Google Scholar] [CrossRef] [PubMed]
- Patil, A.U.; Lin, C.; Lee, S.H.; Huang, H.W.; Wu, S.C.; Madathil, D.; Huang, C.M. Review of EEG-based neurofeedback as a therapeutic intervention to treat depression. Psychiatry Res. Neuroimaging 2023, 329, 111591. [Google Scholar] [CrossRef]
- Chen, J.; Xia, Y.; Zhou, X.; Vidal Rosas, E.; Thomas, A.; Loureiro, R.; Cooper, R.J.; Carlson, T.; Zhao, H. fNIRS-EEG BCIs for Motor Rehabilitation: A Review. Bioengineering 2023, 10, 1393. [Google Scholar] [CrossRef]
- OpenBCI. OpenBCI. 2024. Available online: https://openbci.com/ (accessed on 13 May 2024).
- LaRocco, J.; Le, M.D.; Paeng, D.G. A Systemic Review of Available Low-Cost EEG Headsets Used for Drowsiness Detection. Front. Neuroinform. 2020, 14, 553352. [Google Scholar] [CrossRef] [PubMed]
- Chen, J.; Lin, X.; Ma, W.; Wang, Y.; Tang, W. EEG-based emotion recognition for road accidents in a simulated driving environment. Biomed. Signal Process. Control 2024, 87, 105411. [Google Scholar] [CrossRef]
- Bai, L.; Guo, J.; Xu, T.; Yang, M. Emotional Monitoring of Learners Based on EEG Signal Recognition. In Procedia Computer Science, Proceedings of the 2019 International Conference on Identification, Information and Knowledge in the Internet of Things, Jinan, China, 25–27 October 2019; Elsevier: Amsterdam, The Netherlands, 2020; Volume 174, pp. 364–368. [Google Scholar] [CrossRef]
- Liu, L.; Ji, Y.; Gao, Y.; Li, T.; Xu, W. A Data-Driven Adaptive Emotion Recognition Model for College Students Using an Improved Multifeature Deep Neural Network Technology. Comput. Intell. Neurosci. 2022, 2022, 1343358. [Google Scholar] [CrossRef] [PubMed]
- Avola, D.; Cinque, L.; Mambro, A.D.; Fagioli, A.; Marini, M.R.; Pannone, D.; Fanini, B.; Foresti, G.L. Spatio-Temporal Image-Based Encoded Atlases for EEG Emotion Recognition. Int. J. Neural Syst. 2024, 34, 2450024. [Google Scholar] [CrossRef] [PubMed]
- Sánchez-Reolid, R.; Martínez-Sáez, M.C.; García-Martínez, B.; Fernández-Aguilar, L.; Ros, L.; Latorre, J.M.; Fernández-Caballero, A. Emotion Classification from EEG with a Low-Cost BCI Versus a High-End Equipment. Int. J. Neural Syst. 2022, 32, 2250041. [Google Scholar] [CrossRef] [PubMed]
- Suhaimi, N.S.; Mountstephens, J.; Teo, J. A Dataset for Emotion Recognition Using Virtual Reality and EEG (DER-VREEG): Emotional State Classification Using Low-Cost Wearable VR-EEG Headsets. Big Data Cogn. Comput. 2022, 6, 16. [Google Scholar] [CrossRef]
- Sakib, N.; Faruk, T.; Islam, M.K. Wireless EEG based anxiety screening among young adults using machine learning model. In Proceedings of the ICBSP ’23: 2023 8th International Conference on Biomedical Imaging, Signal Processing, Singapore, 20–22 October 2023; Association for Computing Machinery: New York, NY, USA, 2024; pp. 97–103. [Google Scholar] [CrossRef]
- Trigka, M.; Dritsas, E.; Fidas, C. A survey on signal processing methods for EEG-based brain computer interface systems. In Proceedings of the PCI ’22: 26th Pan-Hellenic Conference on Informatics, Athens, Greece, 25–27 November 2022; Association for Computing Machinery: New York, NY, USA, 2023; pp. 213–218. [Google Scholar] [CrossRef]
- Liu, Y.; Sourina, O.; Nguyen, M.K. Real-time EEG-based human emotion recognition and visualization. In Proceedings of the 2010 International Conference on Cyberworlds, Singapore, 20–22 October 2010; pp. 262–269. [Google Scholar] [CrossRef]
- Cano, S.; Araujo, N.; Guzman, C.; Rusu, C.; Albiol-Pérez, S. Low-Cost Assessment of User eXperience Through EEG Signals. IEEE Access 2020, 8, 158475–158487. [Google Scholar] [CrossRef]
- Ahonen, V.; Leino, M.; Lipping, T. Electroencephalography in evaluating mental workload of gaming. In Proceedings of the 2021 43rd Annual International Conference of the IEEE Engineering in Medicine & Biology Society (EMBC), Virtual, 1–5 November 2021; pp. 845–848. [Google Scholar] [CrossRef]
- Marucci, M.; Di Flumeri, G.; Borghini, G.; Sciaraffa, N.; Scandola, M.; Pavone, E.; Babiloni, F.; Betti, V.; Aricò, P. The impact of multisensory integration and perceptual load in virtual reality settings on performance, workload and presence. Sci. Rep. 2021, 11, 4831. [Google Scholar] [CrossRef]
- Zyma, I.; Tukaev, S.; Seleznov, I.; Kiyono, K.; Popov, A.; Chernykh, M.; Shpenkov, O. Electroencephalograms during Mental Arithmetic Task Performance. Data 2019, 4, 14. [Google Scholar] [CrossRef]
- Babusiak, B.; Hostovecky, M.; Smondrk, M.; Huraj, L. Spectral Analysis of Electroencephalographic Data in Serious Games. Appl. Sci. 2021, 11, 2480. [Google Scholar] [CrossRef]
- Pellouchoud, E.; Smith, M.E.; McEvoy, L.; Gevins, A. Mental Effort-Related EEG Modulation During Video-Game Play: Comparison Between Juvenile Subjects with Epilepsy and Normal Control Subjects. Epilepsia 1999, 40, 38–43. [Google Scholar] [CrossRef] [PubMed]
- Malik, A.S.; Osman, D.A.; Pauzi, A.A.; Khairuddin, R.N.H.R. Investigating brain activation with respect to playing video games on large screens. In Proceedings of the 2012 4th International Conference on Intelligent and Advanced Systems (ICIAS2012), Kuala Lumpur, Malaysia, 12–14 June 2012; Volume 1, pp. 86–90. [Google Scholar] [CrossRef]
- Mondéjar, T.; Hervás, R.; Johnson, E.; Gutierrez, C.; Latorre, J.M. Correlation between videogame mechanics and executive functions through EEG analysis. J. Biomed. Inform. 2016, 63, 131–140. [Google Scholar] [CrossRef]
- Khairuddin, H.R.; Malik, A.S.; Mumtaz, W.; Kamel, N.; Xia, L. Analysis of EEG signals regularity in adults during video game play in 2D and 3D. In Proceedings of the 2013 35th Annual International Conference of the IEEE Engineering in Medicine and Biology Society (EMBC), Osaka, Japan, 3–7 July 2013; pp. 2064–2067. [Google Scholar] [CrossRef]
- Cabañero-Gómez, L.; Hervas, R.; Bravo, J.; Rodriguez-Benitez, L. Computational EEG Analysis Techniques When Playing Video Games: A Systematic Review. Proceedings 2018, 2, 483. [Google Scholar] [CrossRef]
- GomezRomero-Borquez, J.; Del Puerto-Flores, J.A.; Del-Valle-Soto, C. Mapping EEG Alpha Activity: Assessing Concentration Levels during Player Experience in Virtual Reality Video Games. Future Internet 2023, 15, 264. [Google Scholar] [CrossRef]
- Naumann, L.; Schultze-Kraft, M.; Dähne, S.; Blankertz, B. Prediction of difficulty levels in video games from ongoing EEG. In Proceedings of the Symbiotic Interaction, Padua, Italy, 29–30 September 2016; Gamberini, L., Spagnolli, A., Jacucci, G., Blankertz, B., Freeman, J., Eds.; Springer: Cham, Switzerland, 2017; pp. 125–136. [Google Scholar]
- McMahan, T.; Parberry, I.; Parsons, T.D. Evaluating electroencephalography engagement indices during video game play. In Proceedings of the International Conference on Foundations of Digital Games, Pacific Grove, CA, USA, 22–25 June 2015. [Google Scholar]
- Oliveira, S.M.S.d.; Medeiros, C.S.P.d.; Pacheco, T.B.F.; Bessa, N.P.O.S.; Silva, F.G.M.; Tavares, N.S.A.; Rego, I.A.O.; Campos, T.F.; Cavalcanti, F.A.d.C. Electroencephalographic changes using virtual reality program. Neurol. Res. 2018, 40, 160–165. [Google Scholar] [CrossRef] [PubMed]
- Paranthaman, P.K.; Vallabhajosula, S.; Giordano, A.; Walton, S.; Tuisa, O.; Bajaj, N. User experience analysis in obstacle clearance tasks in virtual and mixed reality environments. In Intelligent Sustainable Systems, Selected Papers of WorldS4 2022; Nagar, A.K., Singh Jat, D., Mishra, D.K., Joshi, A., Eds.; Springer: Singapore, 2023; pp. 675–686. [Google Scholar]
- Beyer, J.; Varbelow, R.; Antons, J.N.; Möller, S. Using electroencephalography and subjective self-assessment to measure the influence of quality variations in cloud gaming. In Proceedings of the 2015 Seventh International Workshop on Quality of Multimedia Experience (QoMEX), Pilos, Greece, 26–29 May 2015; pp. 1–6. [Google Scholar] [CrossRef]
- Pangistu, L.; Azhari, A. Deep Learning on Game Addiction Detection Based on Electroencephalogram. J. Media Inform. Budidarma 2021, 5, 963. [Google Scholar] [CrossRef]
- Hossain, E.; Kulshreshth, A.K. Exploring the effects of stereoscopic 3D on gaming experience using physiological sensors. In Proceedings of the SUI ’19: Symposium on Spatial User Interaction, New Orleans, LA, USA, 19–20 October 2019; Association for Computing Machinery: New York, NY, USA, 2019. [Google Scholar] [CrossRef]
- Amjad, I.; Toor, H.; Niazi, I.K.; Pervaiz, S.; Jochumsen, M.; Shafique, M.; Haavik, H.; Ahmed, T. Xbox 360 Kinect Cognitive Games Improve Slowness, Complexity of EEG, and Cognitive Functions in Subjects with Mild Cognitive Impairment: A Randomized Control Trial. Games Health J. 2019, 8, 144–152. [Google Scholar] [CrossRef] [PubMed]
- Paranthaman, P.K.; Bajaj, N.; Solovey, N.; Jennings, D. Comparative evaluation of the EEG performance metrics and player ratings on the virtual reality games. In Proceedings of the 2021 IEEE Conference on Games (CoG), Copenhagen, Denmark, 17–20 August 2021; pp. 1–8. [Google Scholar] [CrossRef]
- EMOTIV. EPOC Flex. 2024. Available online: https://www.emotiv.com/pages/epoc-flex (accessed on 12 May 2024).
- Bradley, M.M.; Lang, P.J. Measuring emotion: The self-assessment manikin and the semantic differential. J. Behav. Ther. Exp. Psychiatry 1994, 25, 49–59. [Google Scholar] [CrossRef]
- Hart, S.G.; Staveland, L.E. Development of NASA-TLX (task load index): Results of empirical and theoretical research. In Human Mental Workload; Advances in Psychology; Hancock, P.A., Meshkati, N., Eds.; North-Holland: Amsterdam, The Netherlands, 1988; Volume 52, pp. 139–183. [Google Scholar] [CrossRef]
- Bajaj, N.; Requena Carrión, J.; Bellotti, F.; Berta, R.; De Gloria, A. Automatic and tunable algorithm for EEG artifact removal using wavelet decomposition with applications in predictive modeling during auditory tasks. Biomed. Signal Process. Control 2020, 55, 101624. [Google Scholar] [CrossRef]
Disclaimer/Publisher’s Note: The statements, opinions and data contained in all publications are solely those of the individual author(s) and contributor(s) and not of MDPI and/or the editor(s). MDPI and/or the editor(s) disclaim responsibility for any injury to people or property resulting from any ideas, methods, instructions or products referred to in the content. |
© 2024 by the authors. Licensee MDPI, Basel, Switzerland. This article is an open access article distributed under the terms and conditions of the Creative Commons Attribution (CC BY) license (https://creativecommons.org/licenses/by/4.0/).