Abstract
In shaft mining, monitoring the deformation of the roadway due to mining pressure is of great significance to the safe production of coal mines. For this reason, a distributed high-density anchor (cable) support force monitoring system was designed by developing a low-cost anchor (cable) stress monitoring device, which consists of an anchor (cable) stress sensor and a data acquisition device. The whole system consists of an anchor bar (cable) stress monitoring device and a mine roadway deformation monitoring substation. The signals collected by the anchor force sensors are processed by the data acquisition device and sent to the self-developed mine roadway deformation monitoring substation through Long Range Radio (LoRa) wireless communication. All data from the monitoring substation are transmitted to the ground control center in real time via the Message Queuing Telemetry Transport (MQTT) network transmission protocol. The distributed high-density arrangement of monitoring nodes reflects the deformation trend of the whole section of the roadway by monitoring the anchor bar (cable) support force data of multiple sections, which effectively ensures the safety of the roadway.
1. Introduction
With the continuous expansion and deepening of the mining scale, roadway support becomes particularly important in coal mining. Roadway deformation is the deformation and displacement of the surrounding rock caused by mining pressure, which may lead to safety problems such as surrounding rock instability, roofing sheet, coal and gas protrusion, and so on [1,2,3]. Therefore, the monitoring and early warning of roadway deformation are essential to ensuring mine mining safety [4,5]. The stability and smoothness of coal mine roadways are essential to ensuring the safety and efficient production of coal mines.
Coal mining can lead to stability problems on underground roadways. As coal is mined, the rock around the roadway may be damaged or deformed, increasing the risk of roadway collapse, slippage, or fracture [6,7,8]. The rock layers around the roadway may also be damaged, causing groundwater to pour into the roadway and making drainage more difficult [9,10]. In addition, mining activities may have an impact on the surrounding environment by altering groundwater levels and water quality. What is particularly worrying is that some perimeter rock instability and protrusion occur without obvious changes in the roadway perimeter rock visible to the naked eye [11,12]. Therefore, monitoring the quality of anchor support is particularly important to ensure safe production in coal mines. With the continuous development of sensors and terminal instrumentation, a variety of effective technologies and means have emerged in the field of anchor (cable) support force monitoring [13,14,15]. These include a force measuring anchor, a vibrating string anchor force meter, a piezoelectric anchor tension meter, a hydraulic force meter, and so on [16,17,18].
Conventional anchor force sensor detectors are large, costly, and difficult to install at high density. Therefore, it is necessary to develop a low-cost and convenient bolt force measuring device that adopts a separate design to achieve the high-density installation of roadway bolts (cables) [19,20]. The traditional bolt (cable) sensor needs to transmit data by wire, so the mine personnel cannot monitor and analyze the deformation of the mine roadway and the quality of bolt (cable) support in real time [21,22]. Well personnel are able to construct the deformation of an entire section of the roadway from anchor (cable) pressure data from multiple sections.
Aiming to solve the above problem, based on field practice, the authors studied distributed anchor bar (cable) support force monitoring and roadway deformation. By monitoring the large-density distributed stress changes in the roadway anchor rods (cables), the changes in multiple points in multiple sections are obtained to reflect the deformation of the roadway. A low-cost anchor bar (cable) stress monitoring device and a mine roadway deformation monitoring and control substation were designed [23,24]. The data preprocessing of the sensor data was performed with Romano’s rule stress [23,24]. The sensor coefficients were adjusted in combination with a Kalman Filter [25,26]. The anchor stress monitoring device is installed in a wide range of distributions, and the monitoring data are transmitted to the monitoring substation through wireless mode for unified processing [27]. Through the analysis of dynamic pressure under the influence of the whole section of the roadway, the anchor stress distribution rule of change was characterized, and then we studied the deformation of the roadway in the mining process. Nodes need to have wireless self-organizing network function because the monitoring node uses battery power supply. In the case of the high-density installation of underground anchors, the battery of the monitoring node is almost impossible to replace, so it is necessary to design low-power energy management algorithms and develop energy-saving programs for the node. The deformation of the whole section of the roadway is presented through the monitoring substation, and the data can also be transmitted to the ground control center in real-time through the monitoring substation for analysis and prediction. This is of great practical significance for the state assurance of roadway anchor support, the optimization of support design, and the prevention and control of roofing accidents.
The paper will start with a description of the studied anchor (cable) stress monitoring device. The error of the sensor data is analyzed, and the stress data are processed and analyzed. The proportional relationship between the stress data and the voltage value is finally obtained. Then, the research mine roadway deformation monitoring substation is introduced. Finally, we deploy several monitoring nodes to experiment with the whole system.
2. Anchor (Cable) Stress Monitoring Device
2.1. Data Acquisition Device
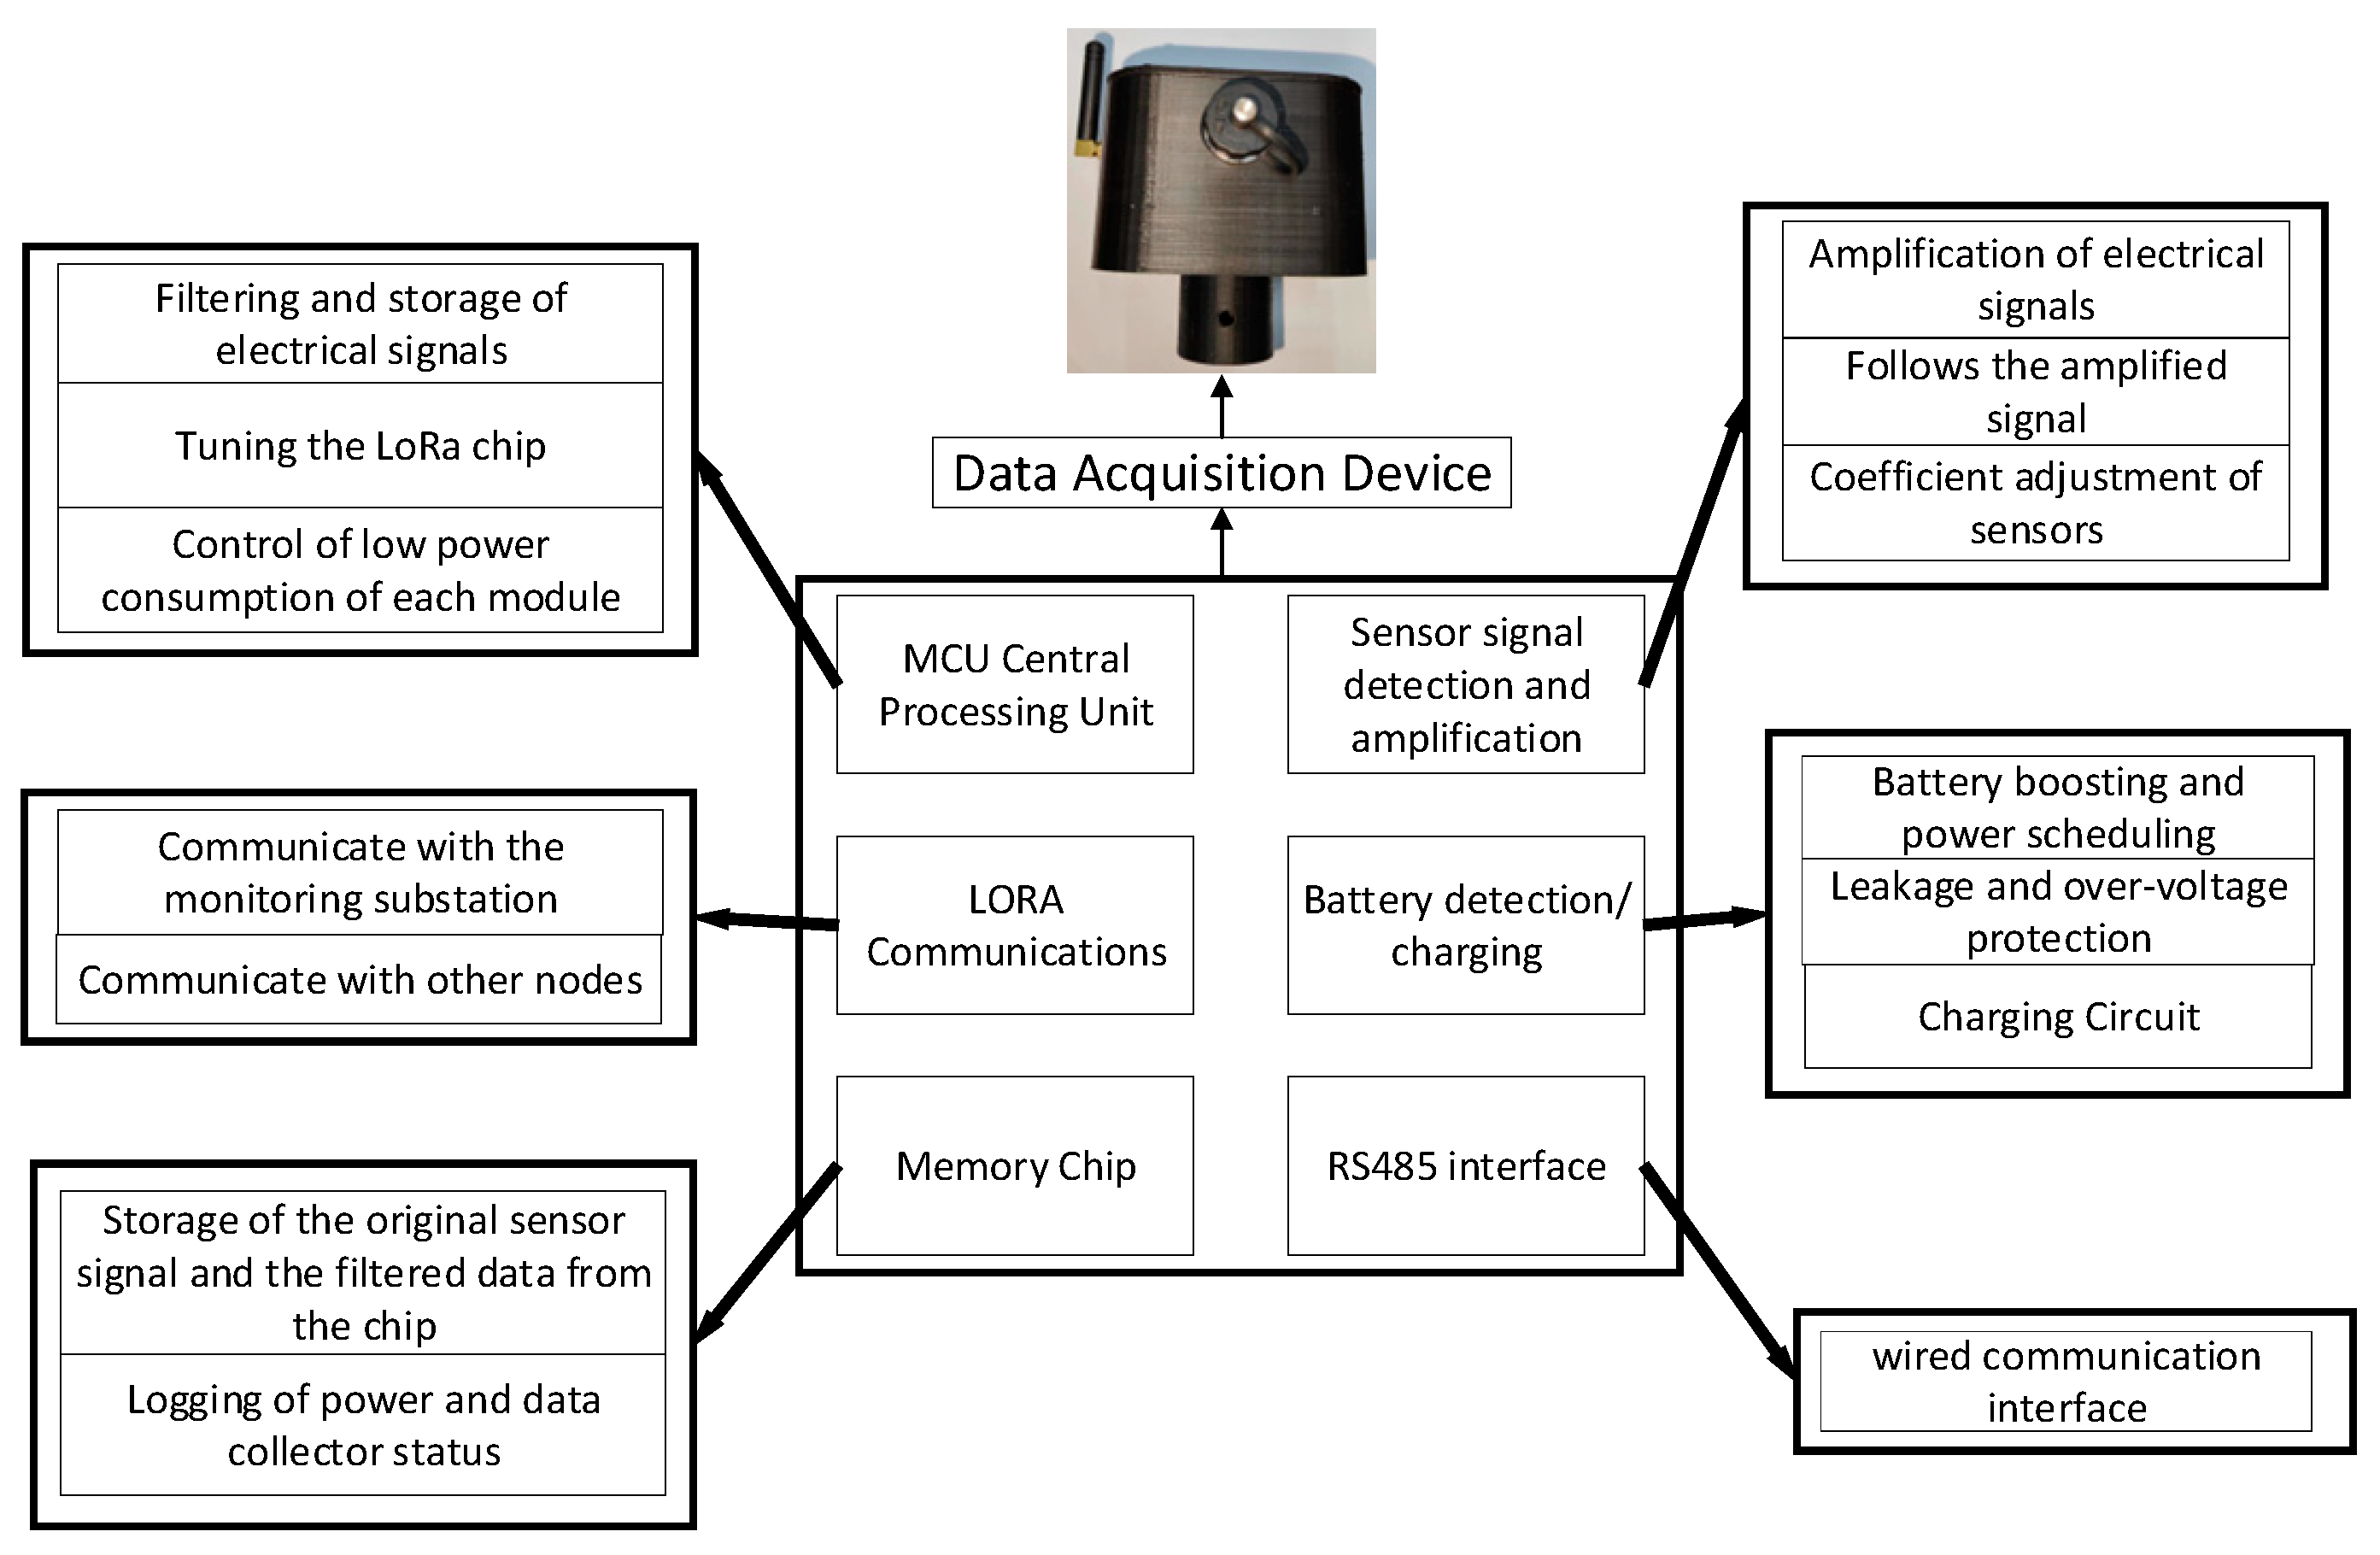
According to the principles and requirements of the early warning of roadway roofing hazards, an anchor bar (cable) stress monitoring device is developed. The apparatus adopts a separate design and consists of an anchor (cable) stress sensor and a data acquisition device. The data acquisition device collects the differential electrical signals from the stress sensors and performs processing such as conversion, filtering, wireless transmission, and storage. The data acquisition device is equipped with various functional modules such as a central processor, power supply module, LoRa (Long Range) transmission module, clock chip, storage chip, etc., as shown in Figure 1. LoRa (Long Range) is a wireless communication technology designed for low-power wide-area network (LPWAN) applications.

Figure 1.
Circuit structure of data acquisition device.
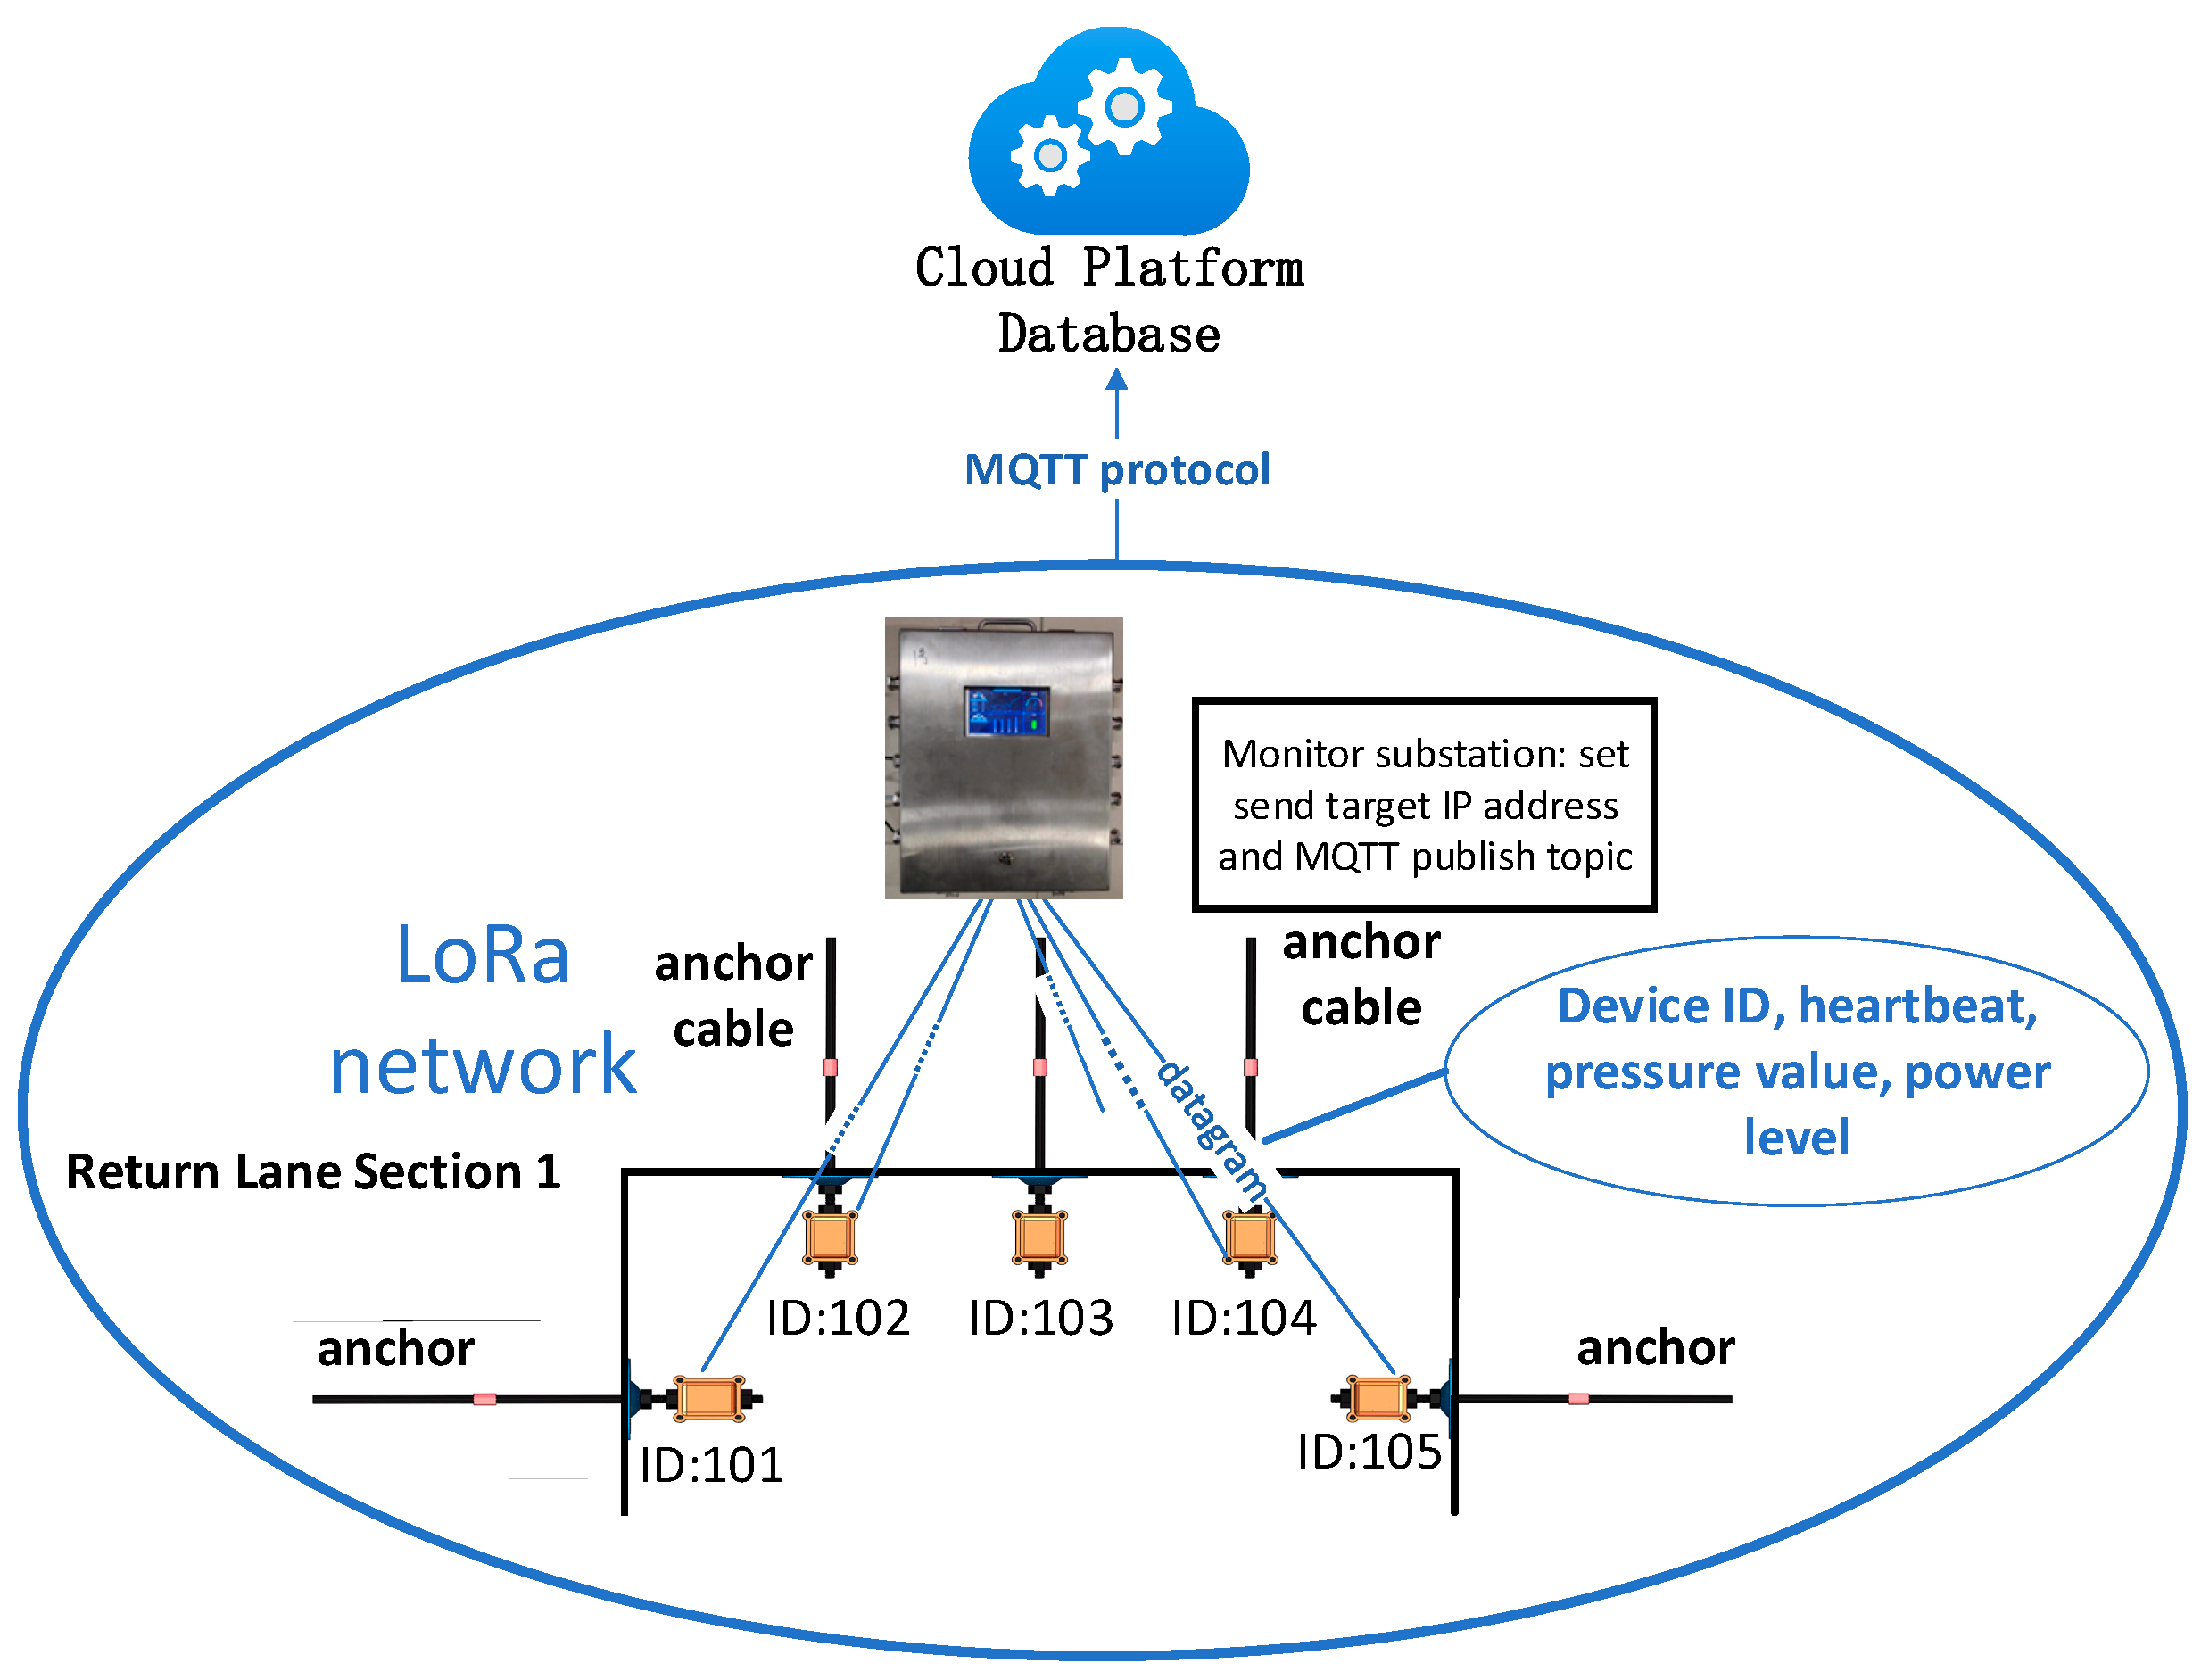
The data acquisition device requires distributed monitoring and wireless transmission. The LoRa network adopts a star topology in which one or more base stations (also known as gateways) act as a central node that communicates with multiple end devices (also known as nodes or terminals). The base station is responsible for receiving data from the end devices and forwarding it to the network server for processing. According to the actual situation of different mines, 5 to 10 sets of anchor (cable) stress monitoring devices are installed in each section, and the nodes can communicate with each other. In the LoRa module of the data acquisition device, the network number, device ID, and transmitting address of this device are configured in advance, and the network number of all nodes is the same on the same roadway. Each data acquisition device sets a unique ID number, and the transmitting address of all data acquisition devices in the same lane is the ID number of the LoRa gateway in the monitoring substation. The data from all data acquisition devices is uniformly sent to the mine roadway deformation monitoring supervisor, and the monitoring substation uniformly processes and transmits the data to the ground control center. Taking one section installing five sets of monitoring devices as an example, the distributed connection relationship of anchor bar (cable) stress monitoring devices is shown in Figure 2.
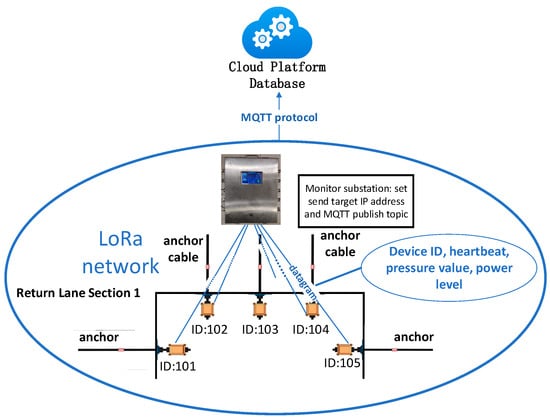
Figure 2.
Distributed connection relationship of anchor rod (cable) stress monitoring device.
2.2. Anchor Stress Sensor
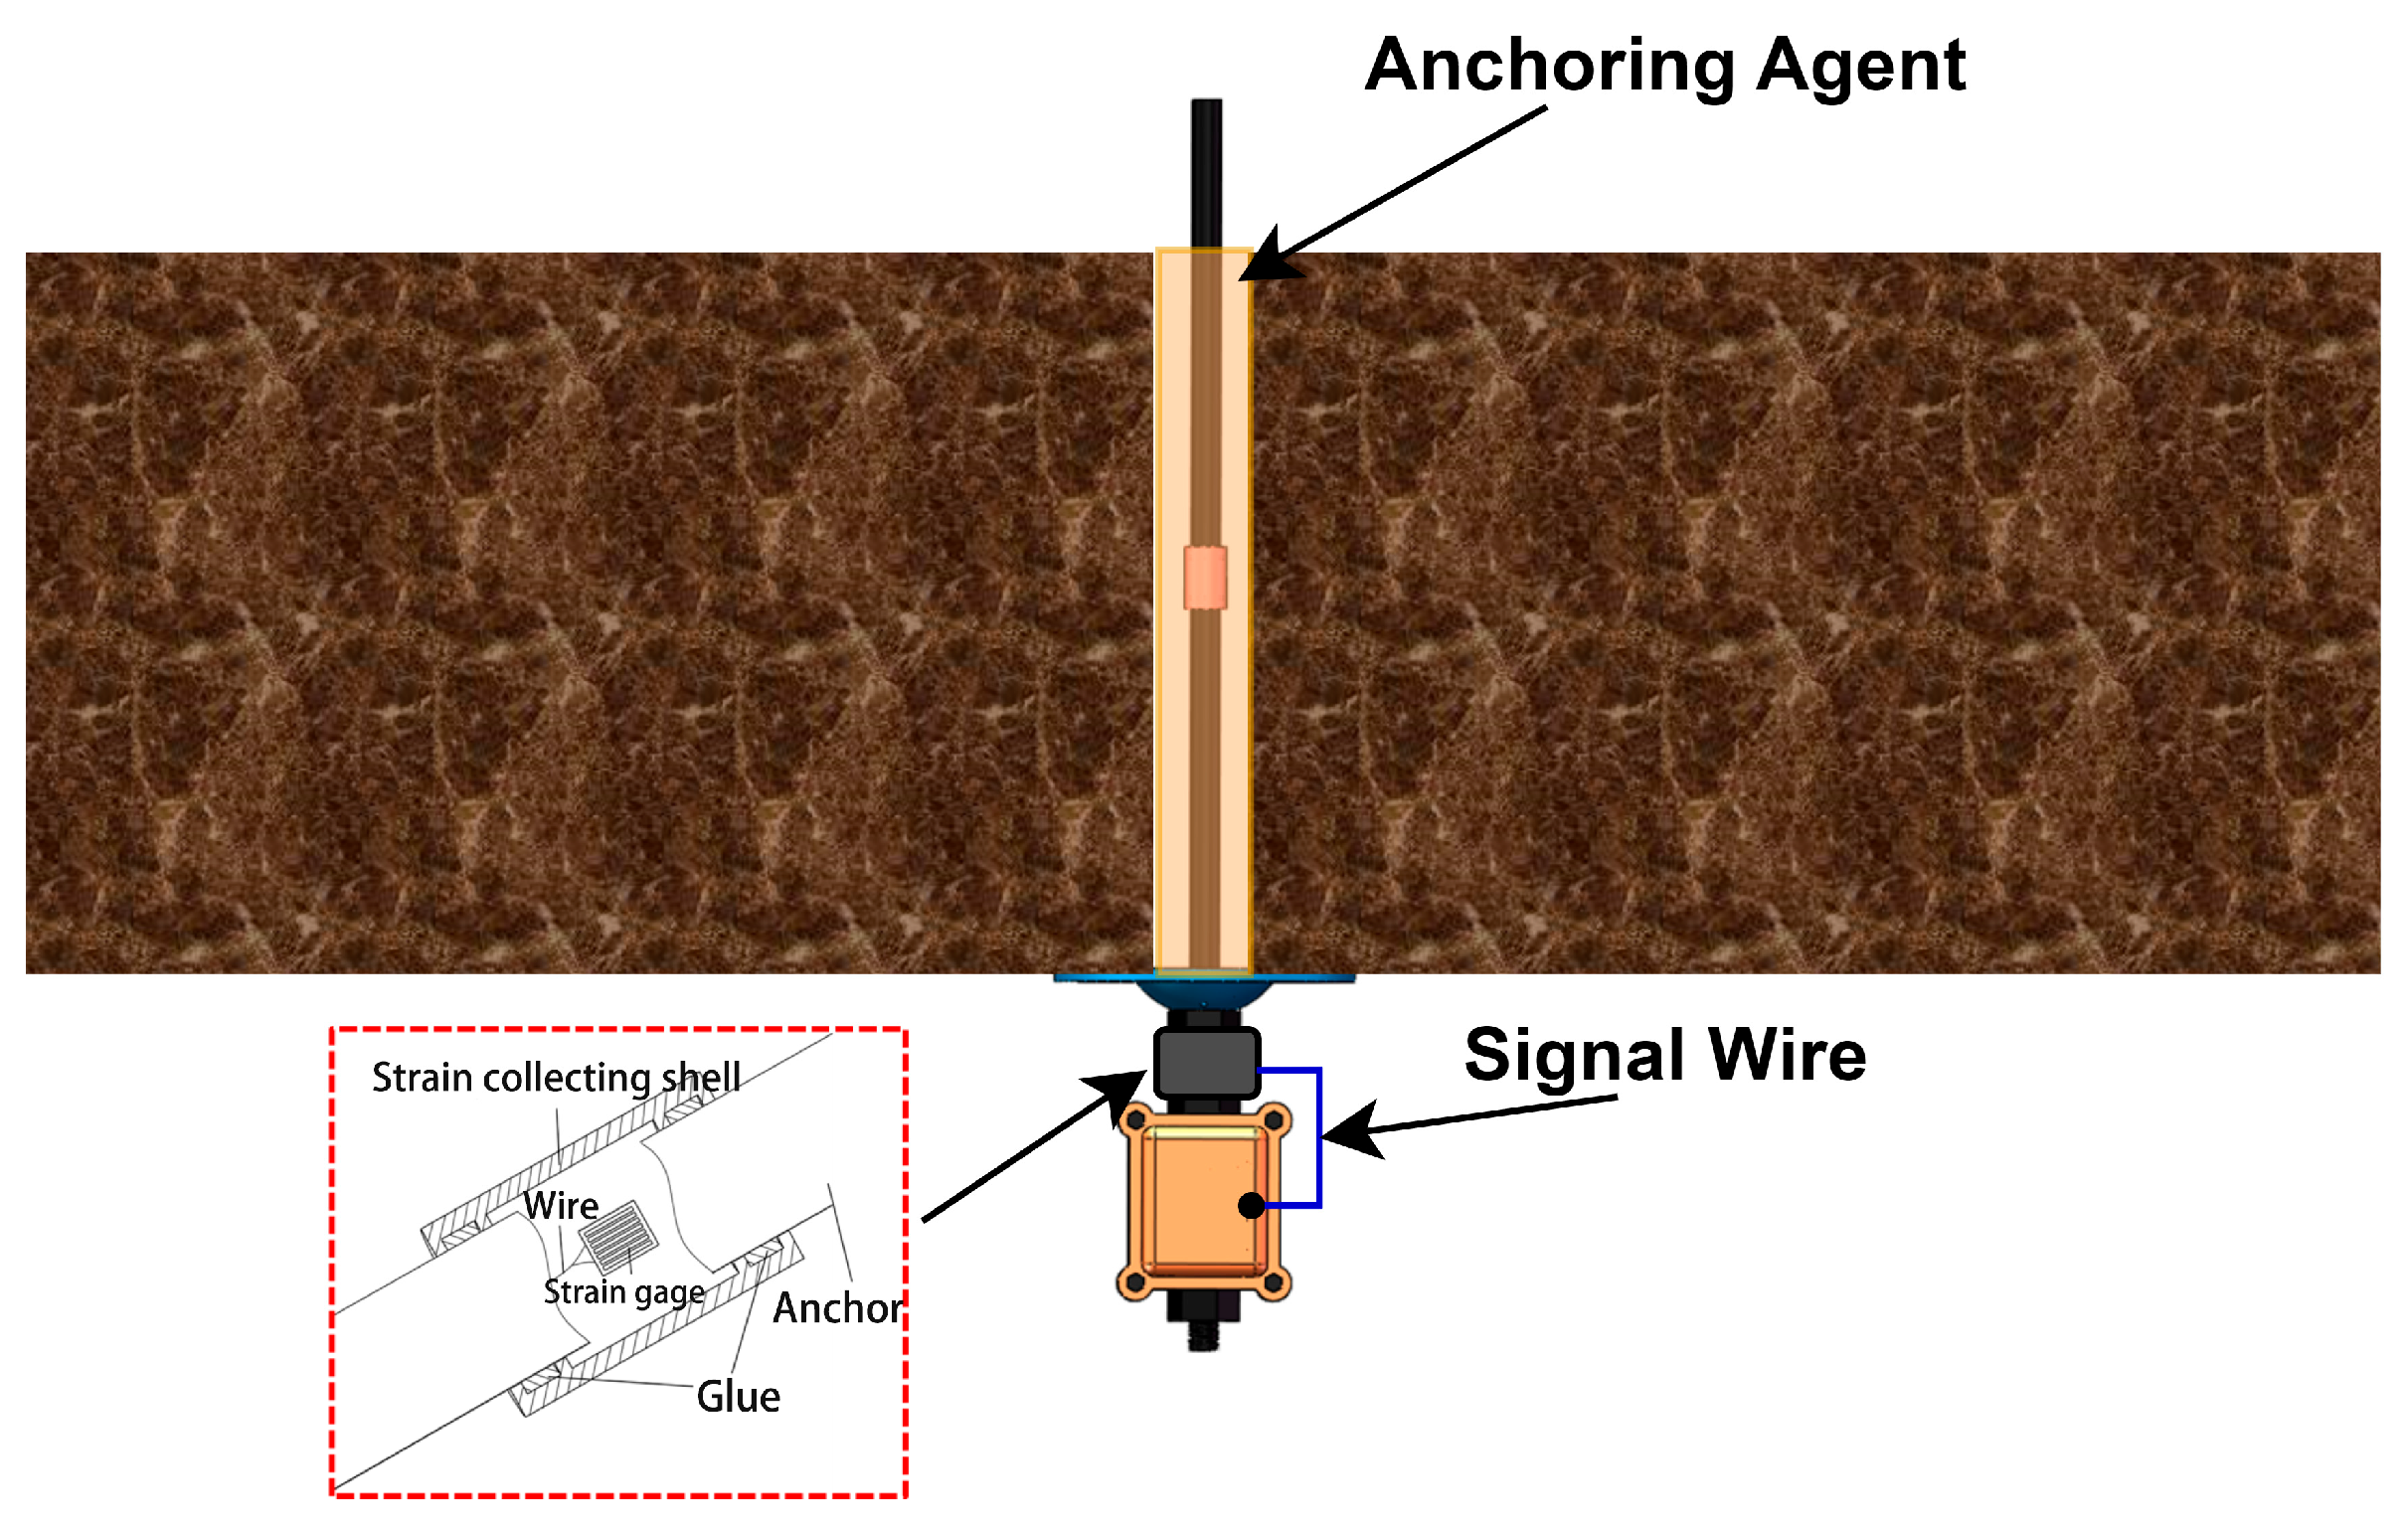
Anchor (cable) stress sensors are installed between the anchor nut or anchor cable anchorage and the pallet to monitor the working resistance of the support material and to reflect the state of pressure or tension applied to the anchor cable. The sensor transmits the force changes to the data acquisition device via a data line. The signal acquisition module of the data acquisition device further amplifies and filters the sensor electrical signals to obtain the required sensitivity and accuracy. The amplifier circuit amplifies the signals monitored by the sensor, while the data acquisition device filter circuit removes high-frequency noise and other interferences. The processed data are sent to the monitoring substation via LoRa wireless transmission. The installation schematic of the anchor (cable) stress monitoring device is shown in Figure 3.
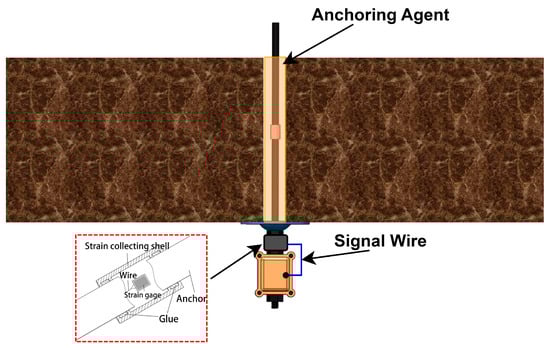
Figure 3.
Installation diagram of anchor (cable) stress monitoring device.
The internal circuitry of the sensor uses a bridge differential signal for output. A bridge differential signal typically consists of a bridge circuit consisting of four resistors, two of which are varied by the physical quantity to be measured. By measuring the differential signal of the bridge circuit, information about the physical quantity to be measured can be extracted. The differential signal is obtained by measuring the voltage difference between the two output terminals of the bridge circuit as a signal. In this way, the effect of the supply voltage and the effect of other resistors can be eliminated, so that signals directly related to the physical quantity to be measured can be extracted.
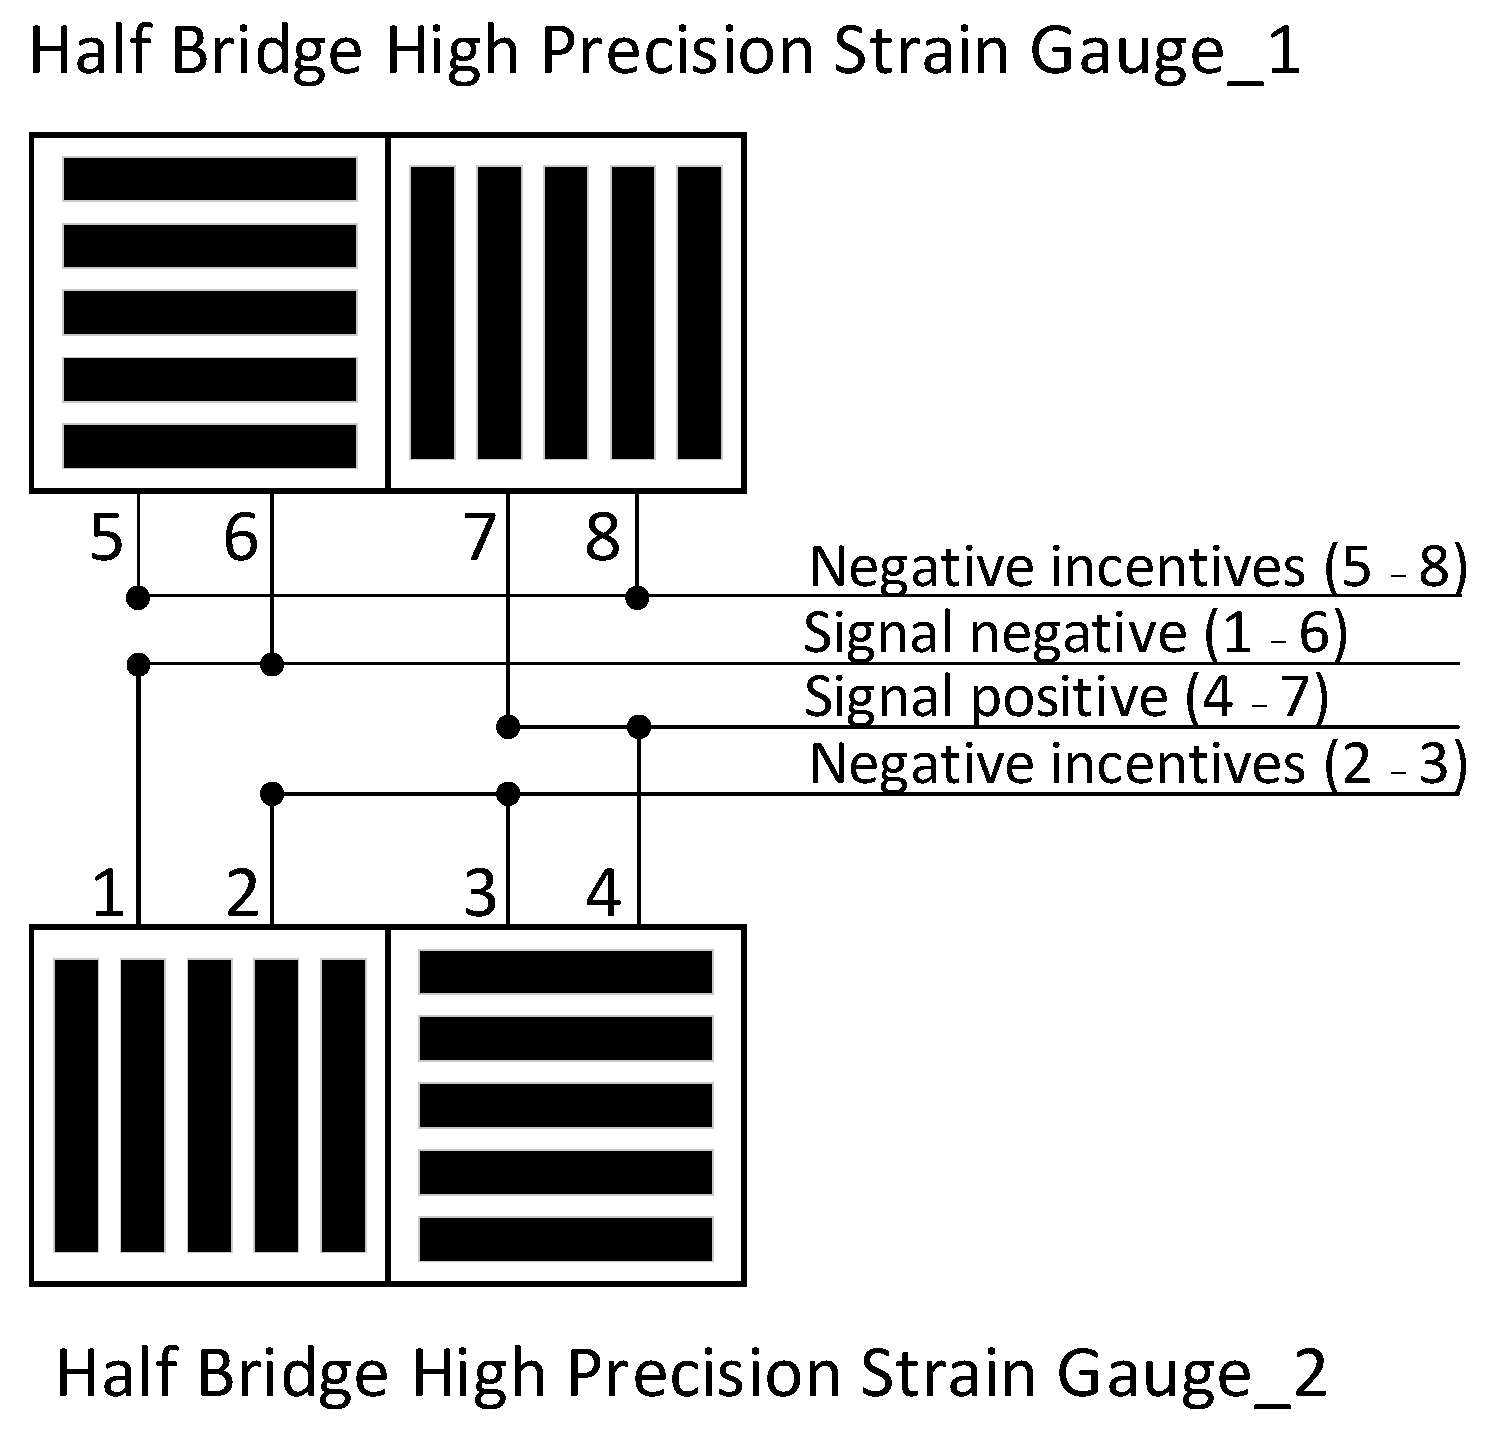
The reliability of anchor (cable) stress sensors in harsh conditions, such as underground tunnels, is critical for anchor (cable) support force monitoring. In order to ensure the accuracy of the sensor, as well as environmental adaptability and stability, the main components of the anchor (cable) stress sensor are high-strain elastomer and adhesive strain gauges, and the housing is fully sealed and explosion-proof. Traditional pressure sensors are designed with only a single strain gauge with a small deformation; this design will lead to errors in the measurement data when the sensor is not uniformly stressed or when the force is applied at a single angle. Two half-bridge high-precision strain gauges are used, and the strain gauges themselves are self-compensated for temperature. The use of self-developed elastomers, which are low cost, can be installed over a wide range of applications. Two half-bridge, high-precision strain gauges are symmetrically pasted at both ends of the elastomer in opposite directions to form differential signals. When deformation occurs, one signal increases, and one heel signal decreases, as shown in Figure 4.

Figure 4.
Schematic diagram of strain gauges for anchor rod (cable) stress sensors.
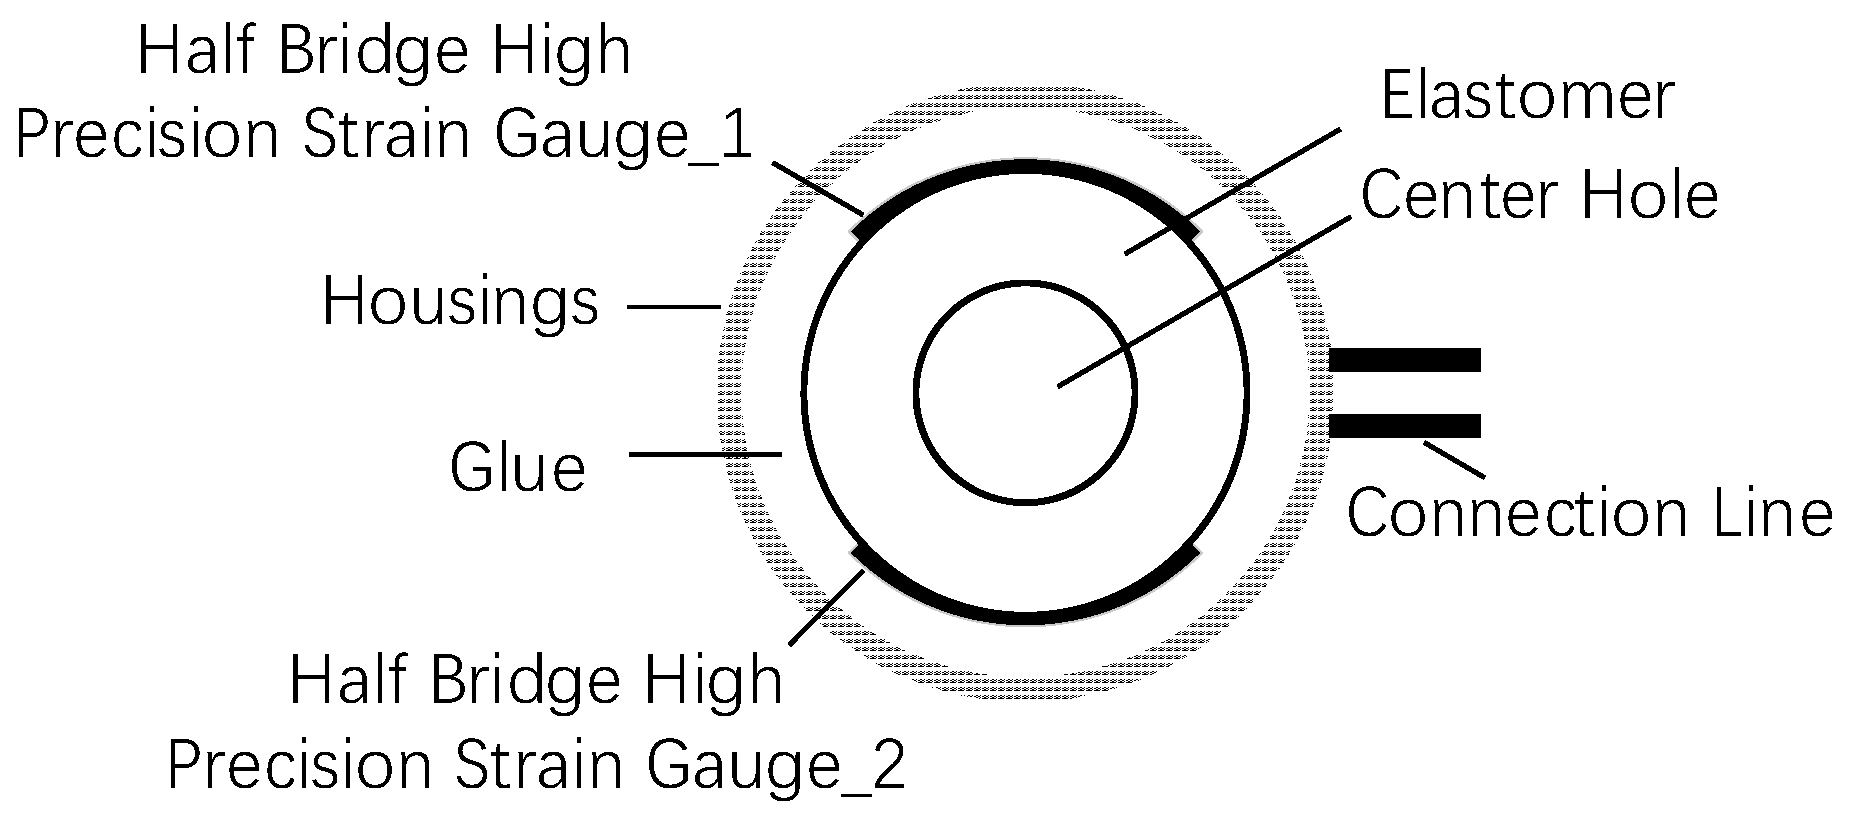
Two sets of strain gauges are fixed to the elastomer, thus accurately obtaining the strain variation in the elastomer structure while effectively isolating it from the effects of the complex external environment. The outer shell is designed to meet the requirements of explosion-proof standards, as shown in Figure 5.

Figure 5.
Structure of anchor rod (cable) stress sensor.
2.3. Monitoring and Amplification of Bridge Differential Signals during Low-Voltage Excitation
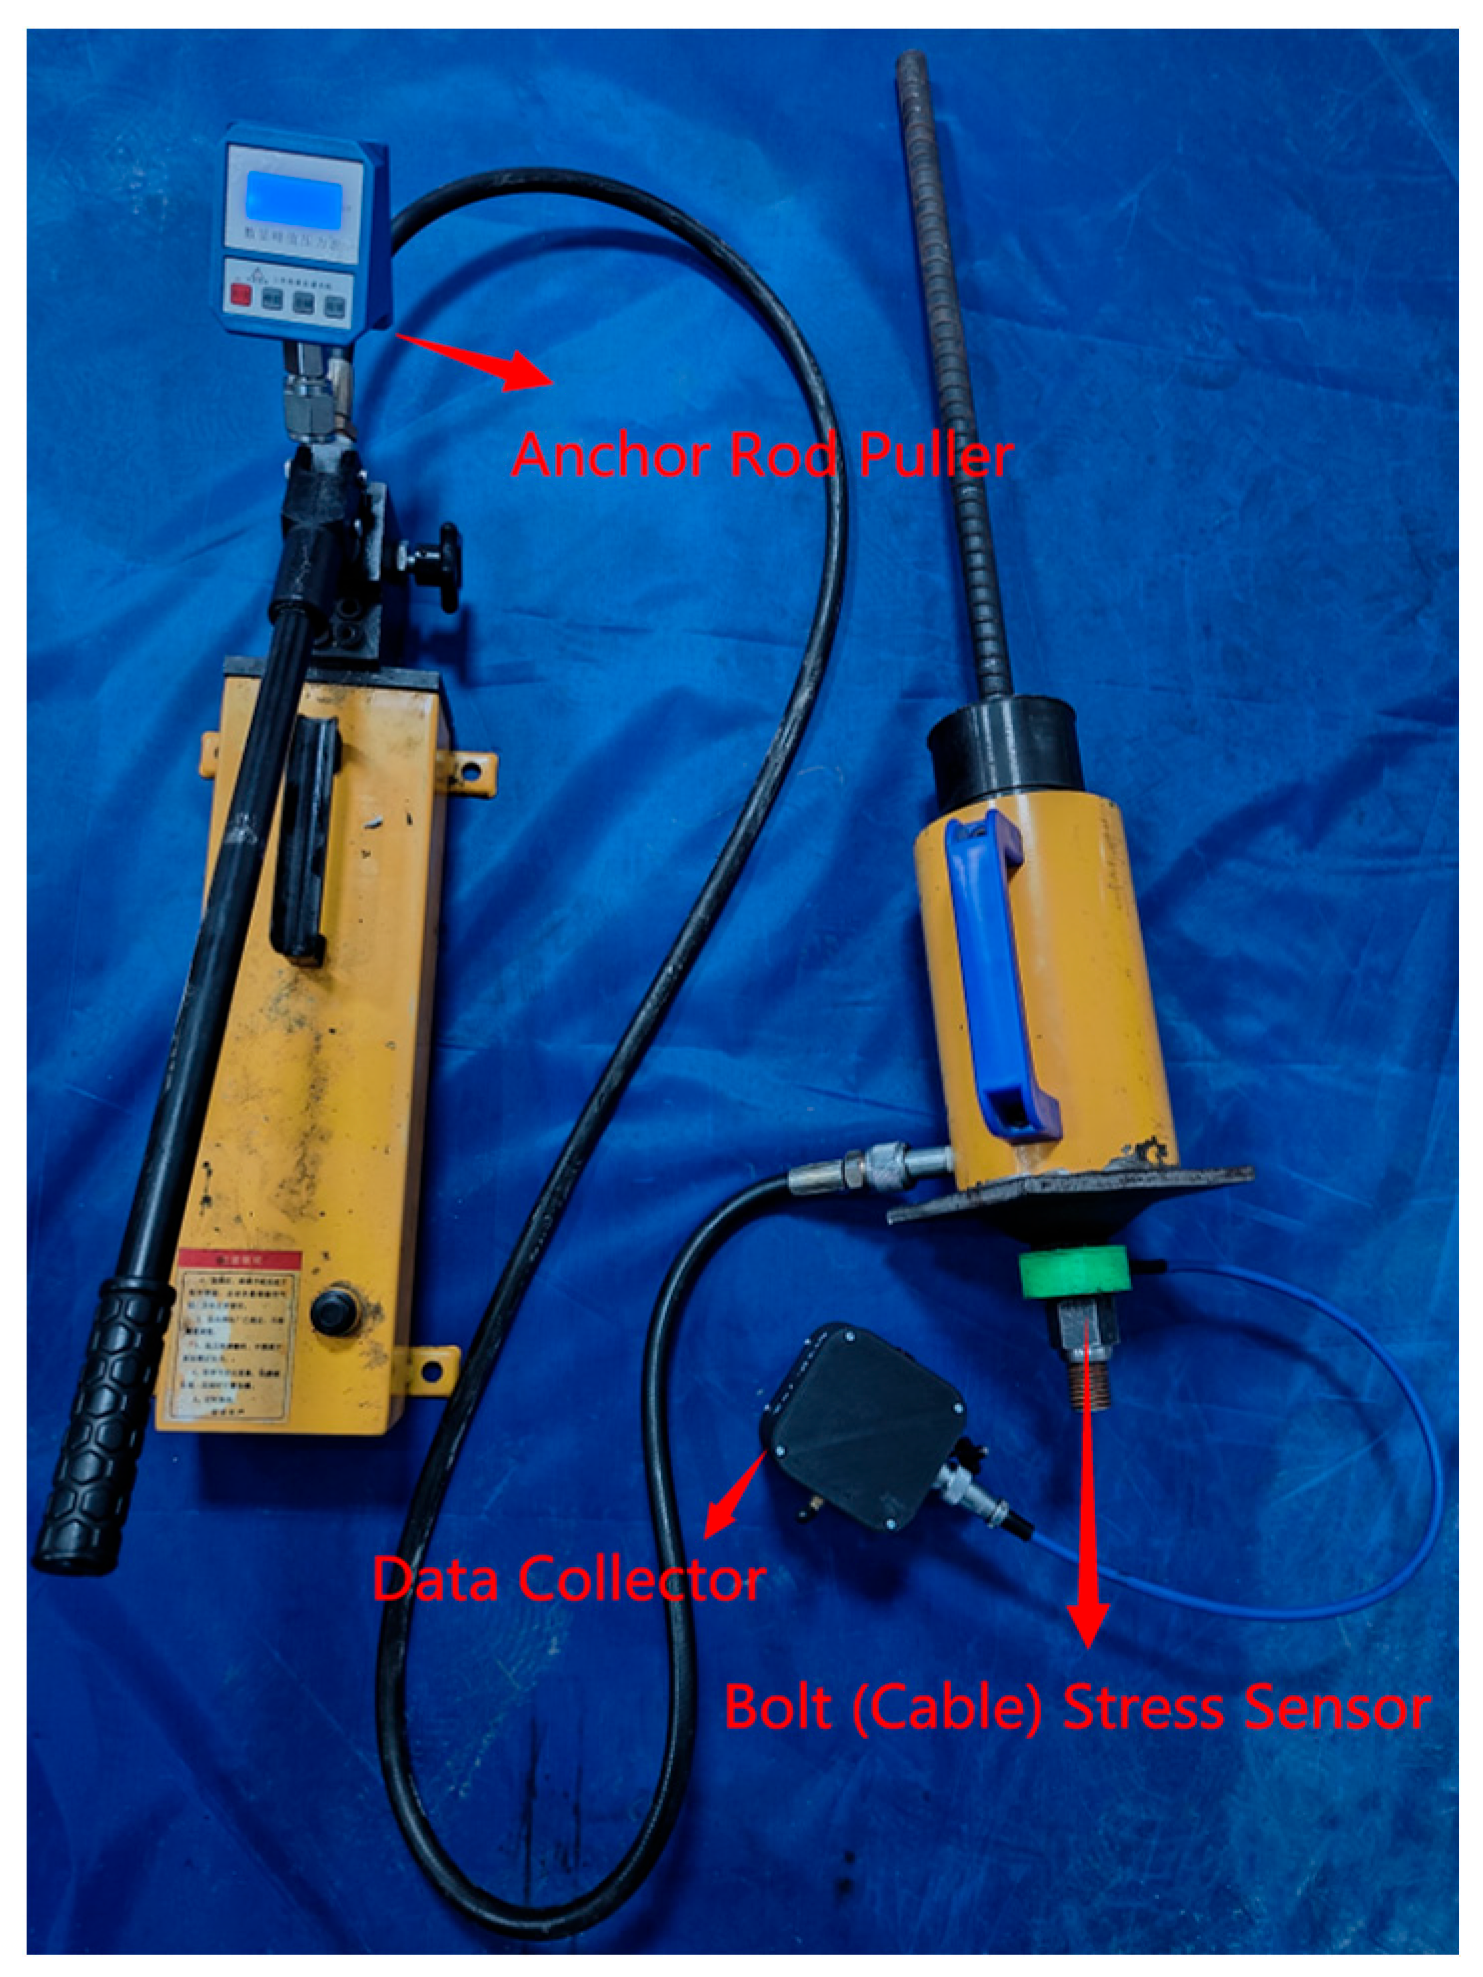
When the anchor rod or anchor cable is subjected to the pressure or tension of the surrounding rock, the Halfbridge high precision strain gauges will undergo elastic deformation, resulting in a change in the resistance value of the pasted strain gauges. Two sets of strain gauges are pasted at the two ends of the elastomer and in opposite directions, generating differential signals, with one increasing and one decreasing in the two sets of signal lines. By monitoring the voltage difference between the two electrical signals to reflect the changes in the elastomer, we can obtain accurate information about the stress state of the anchor or anchor cable. Changes in roof pressure generally do not occur suddenly, and elastomer deformation with the change in roof pressure is very small, using the anchor pulling instrument on the anchor (cable) stress sensor for on-site pressure testing, as shown in Figure 6.
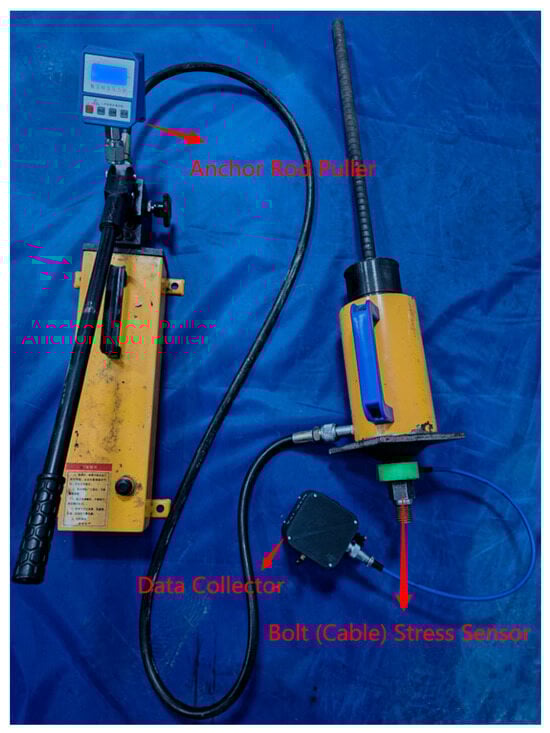
Figure 6.
Sensor on-site testing diagram.
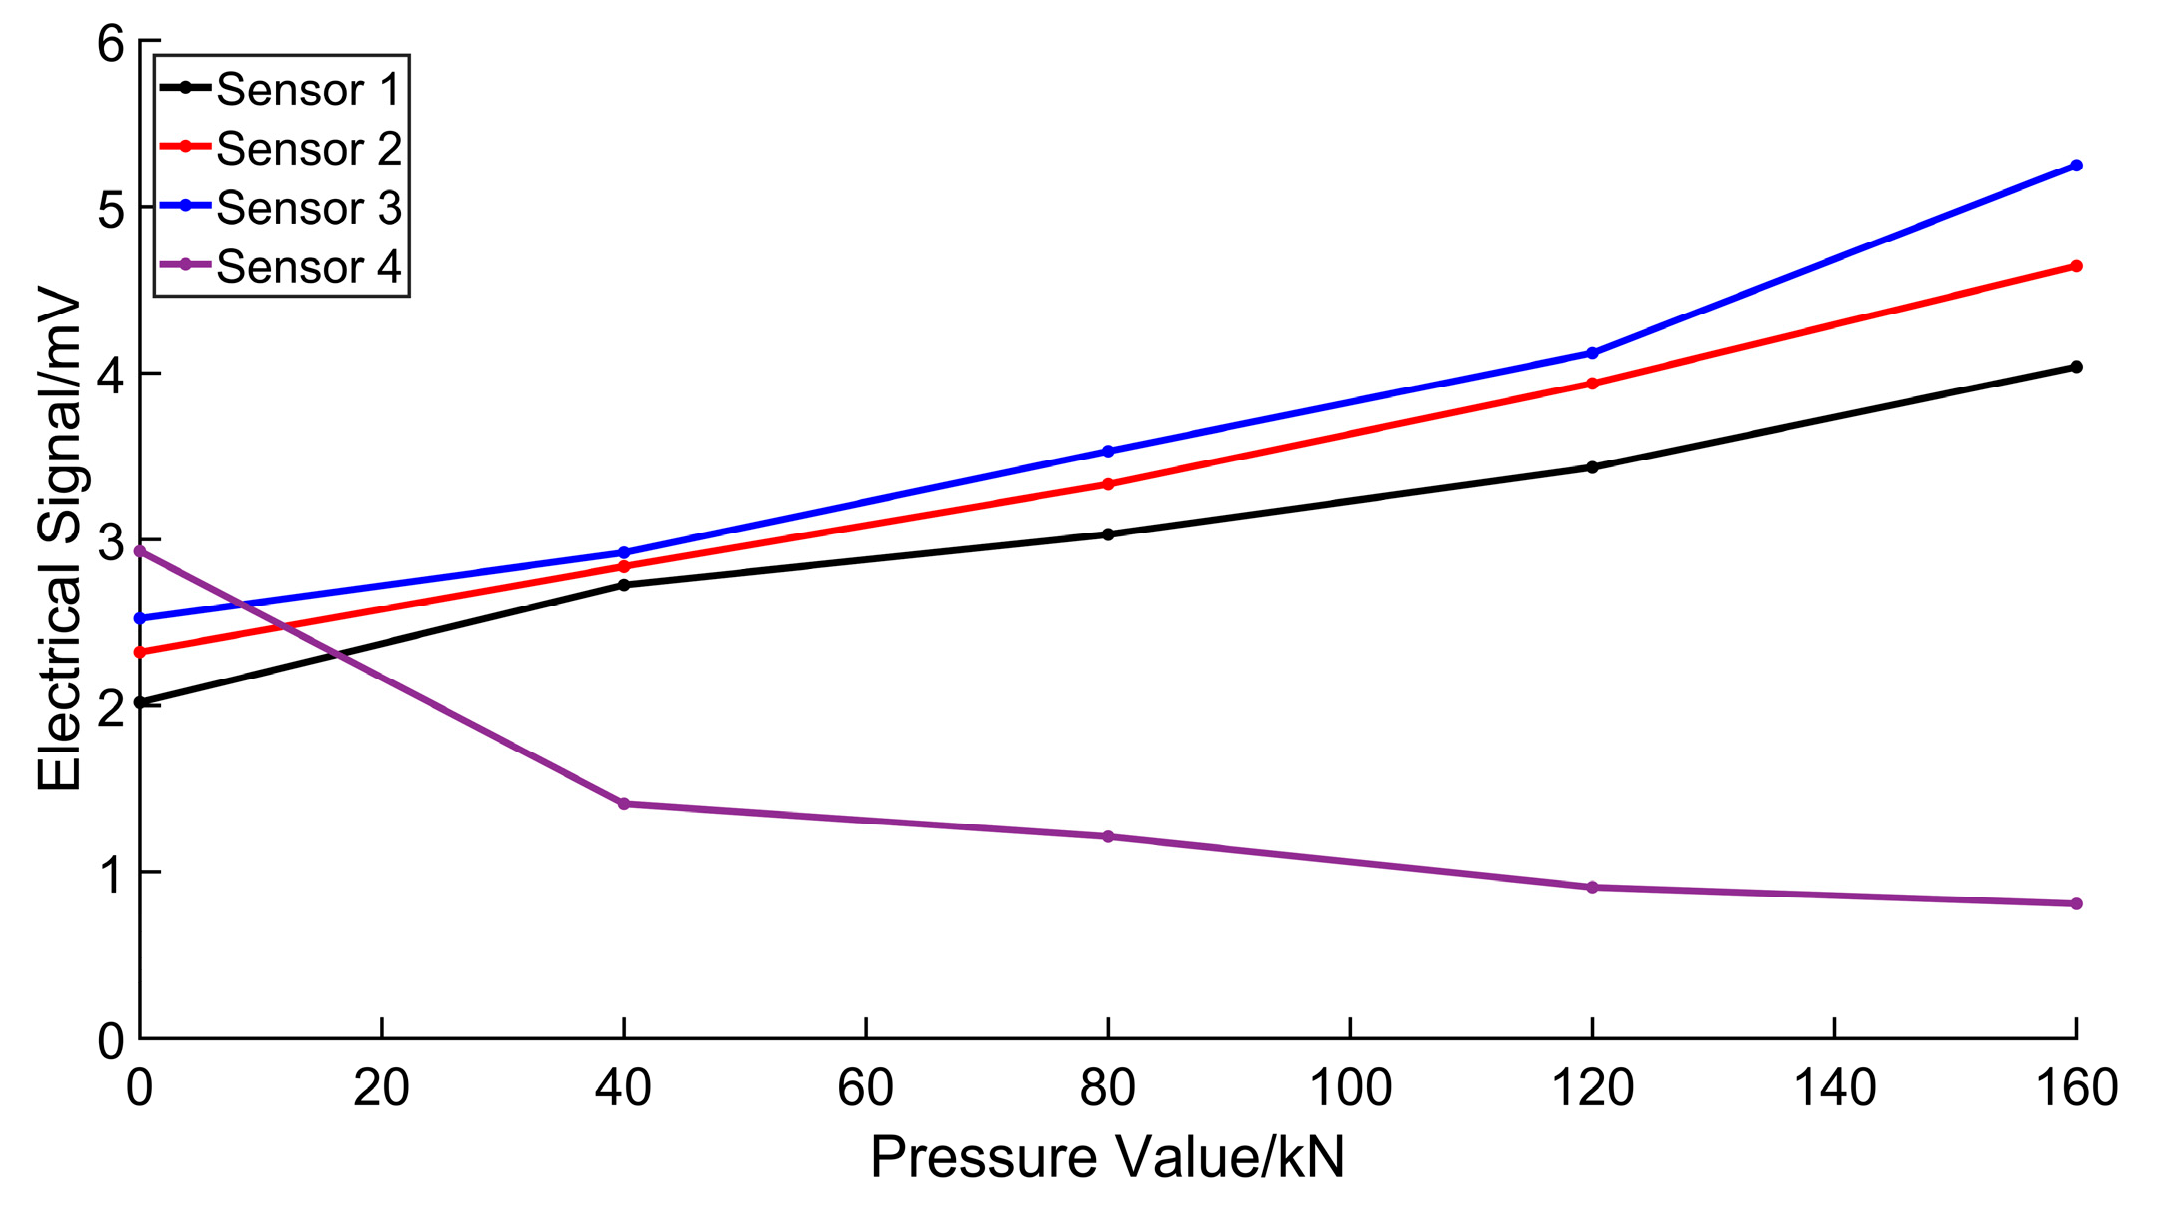
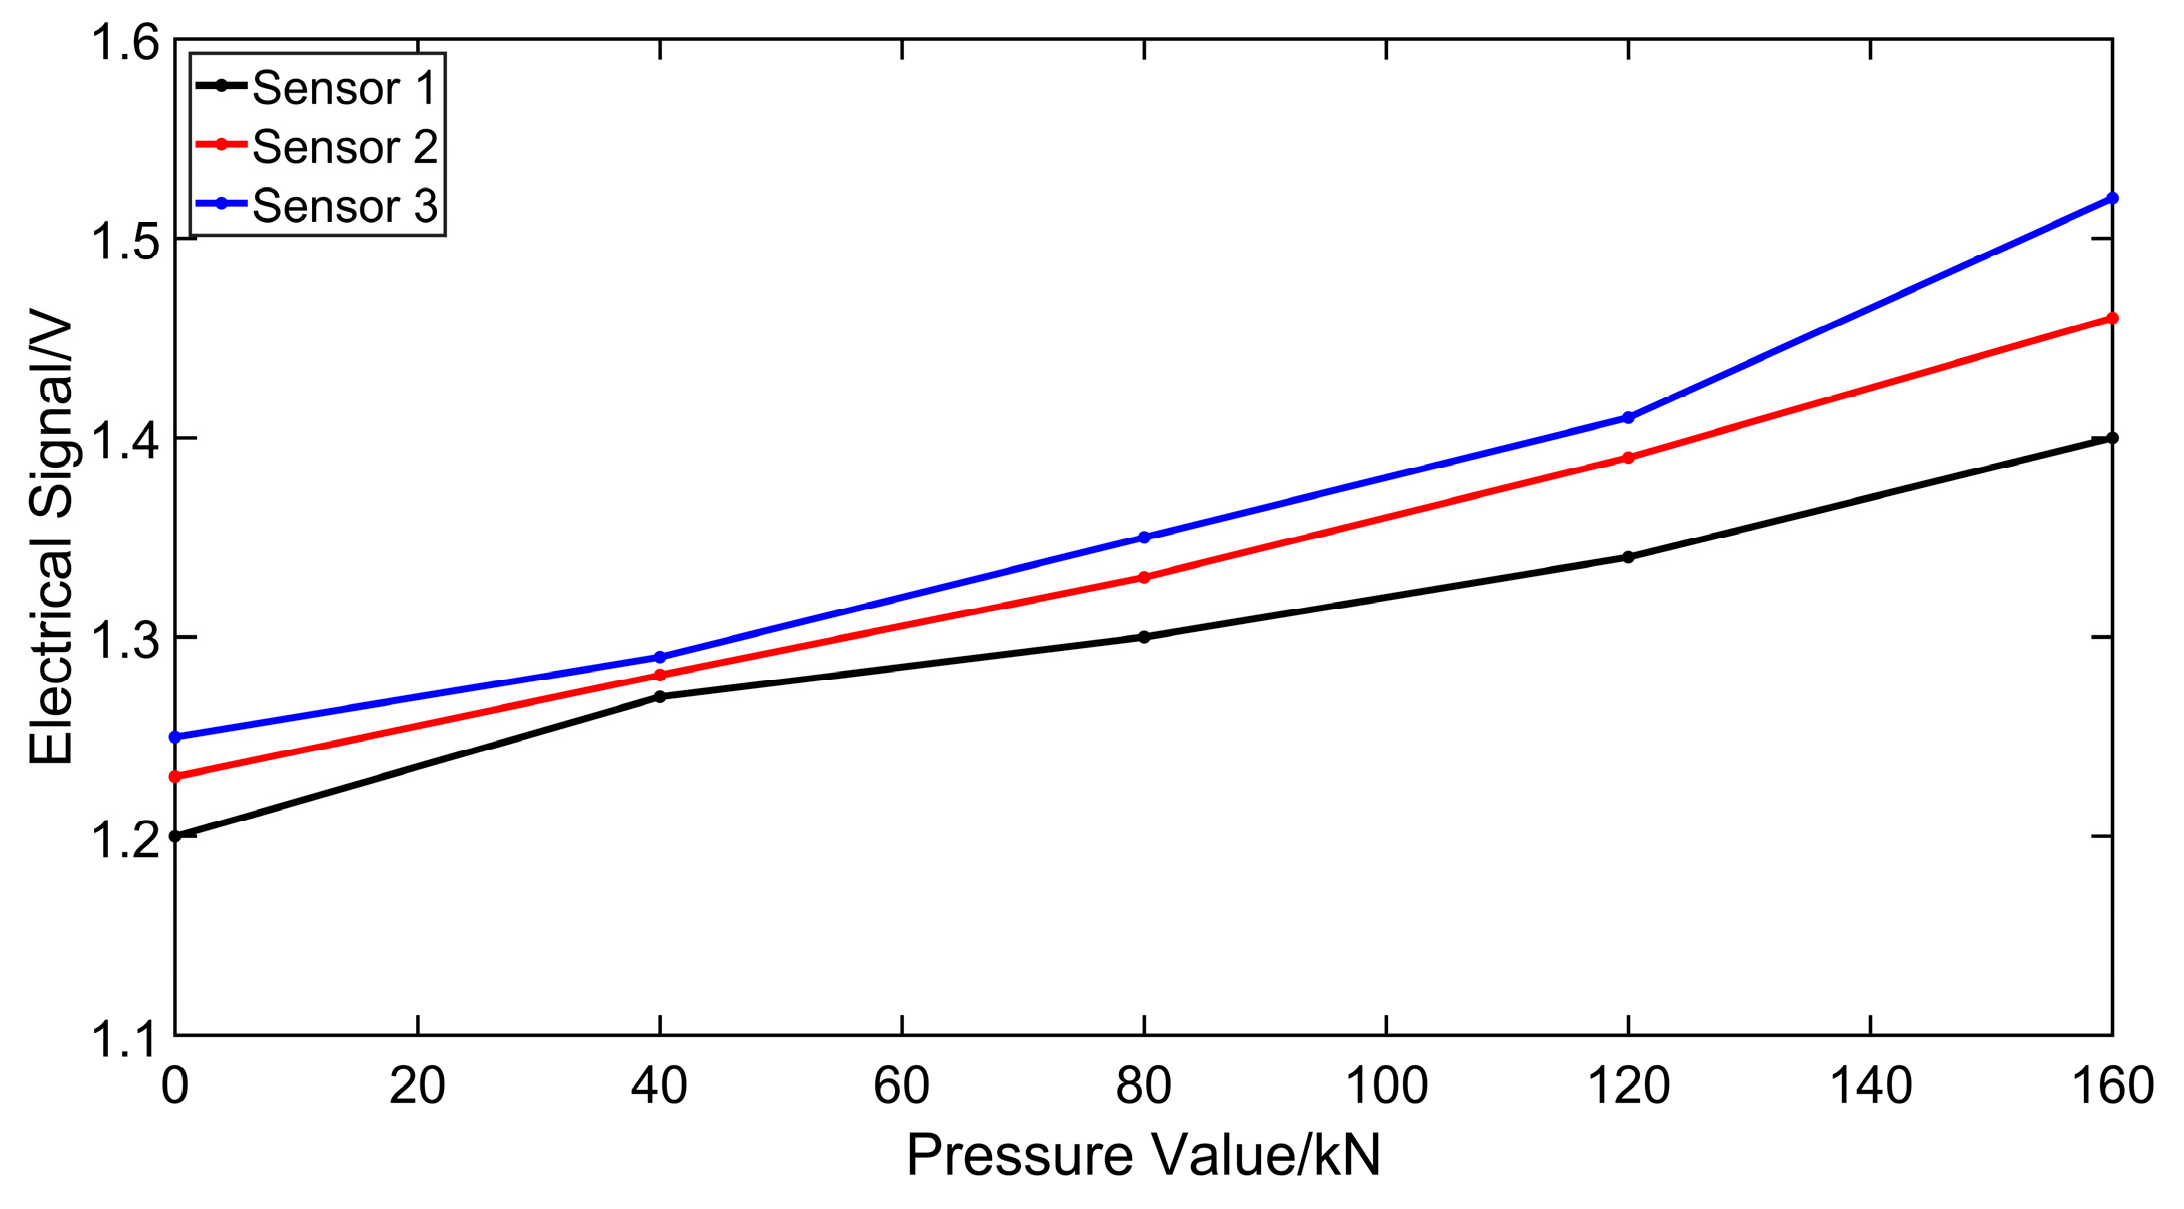
The electrical signal reflected by the anchor (cable) stress sensor (the difference between the two signal lines, that is, the difference between the signal positive and the signal negative) changes in millivolts. At present, four anchor (cable) stress sensors are randomly selected for pressure testing, as shown in Figure 7.
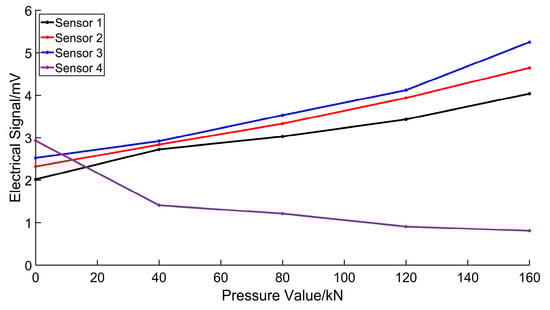
Figure 7.
Test values of anchor rod (cable) stress sensor.
In Figure 7, due to the production process, the signal of each sensor head has some fluctuation, and the anchor bar (cable) stress sensors 1~3 are positively correlated with the pressure. With the increase in the anchor puller force, the electrical signal will also increase, and with every increase of 40 kN, the electrical signal increase range is about 0.56 mV. Anchor (cable) stress sensor 4 and pressure are negatively correlated; if the pressure increases and the electrical signal increases instead of decreasing, then it can be shown that sensor production is not of high quality.
The data acquisition device voltage acquisition circuit uses the MCP3201 ADC acquisition chip to convert analog to digital; MCP3201 has 12-bit conversion accuracy. Take the 3 volts reference voltage as an example. The minimum voltage value that can be collected is 0.73 mV, which is larger than the sensor’s change signal. Therefore, a voltage amplifier circuit is designed to collect, amplify, and follow the differential signal.
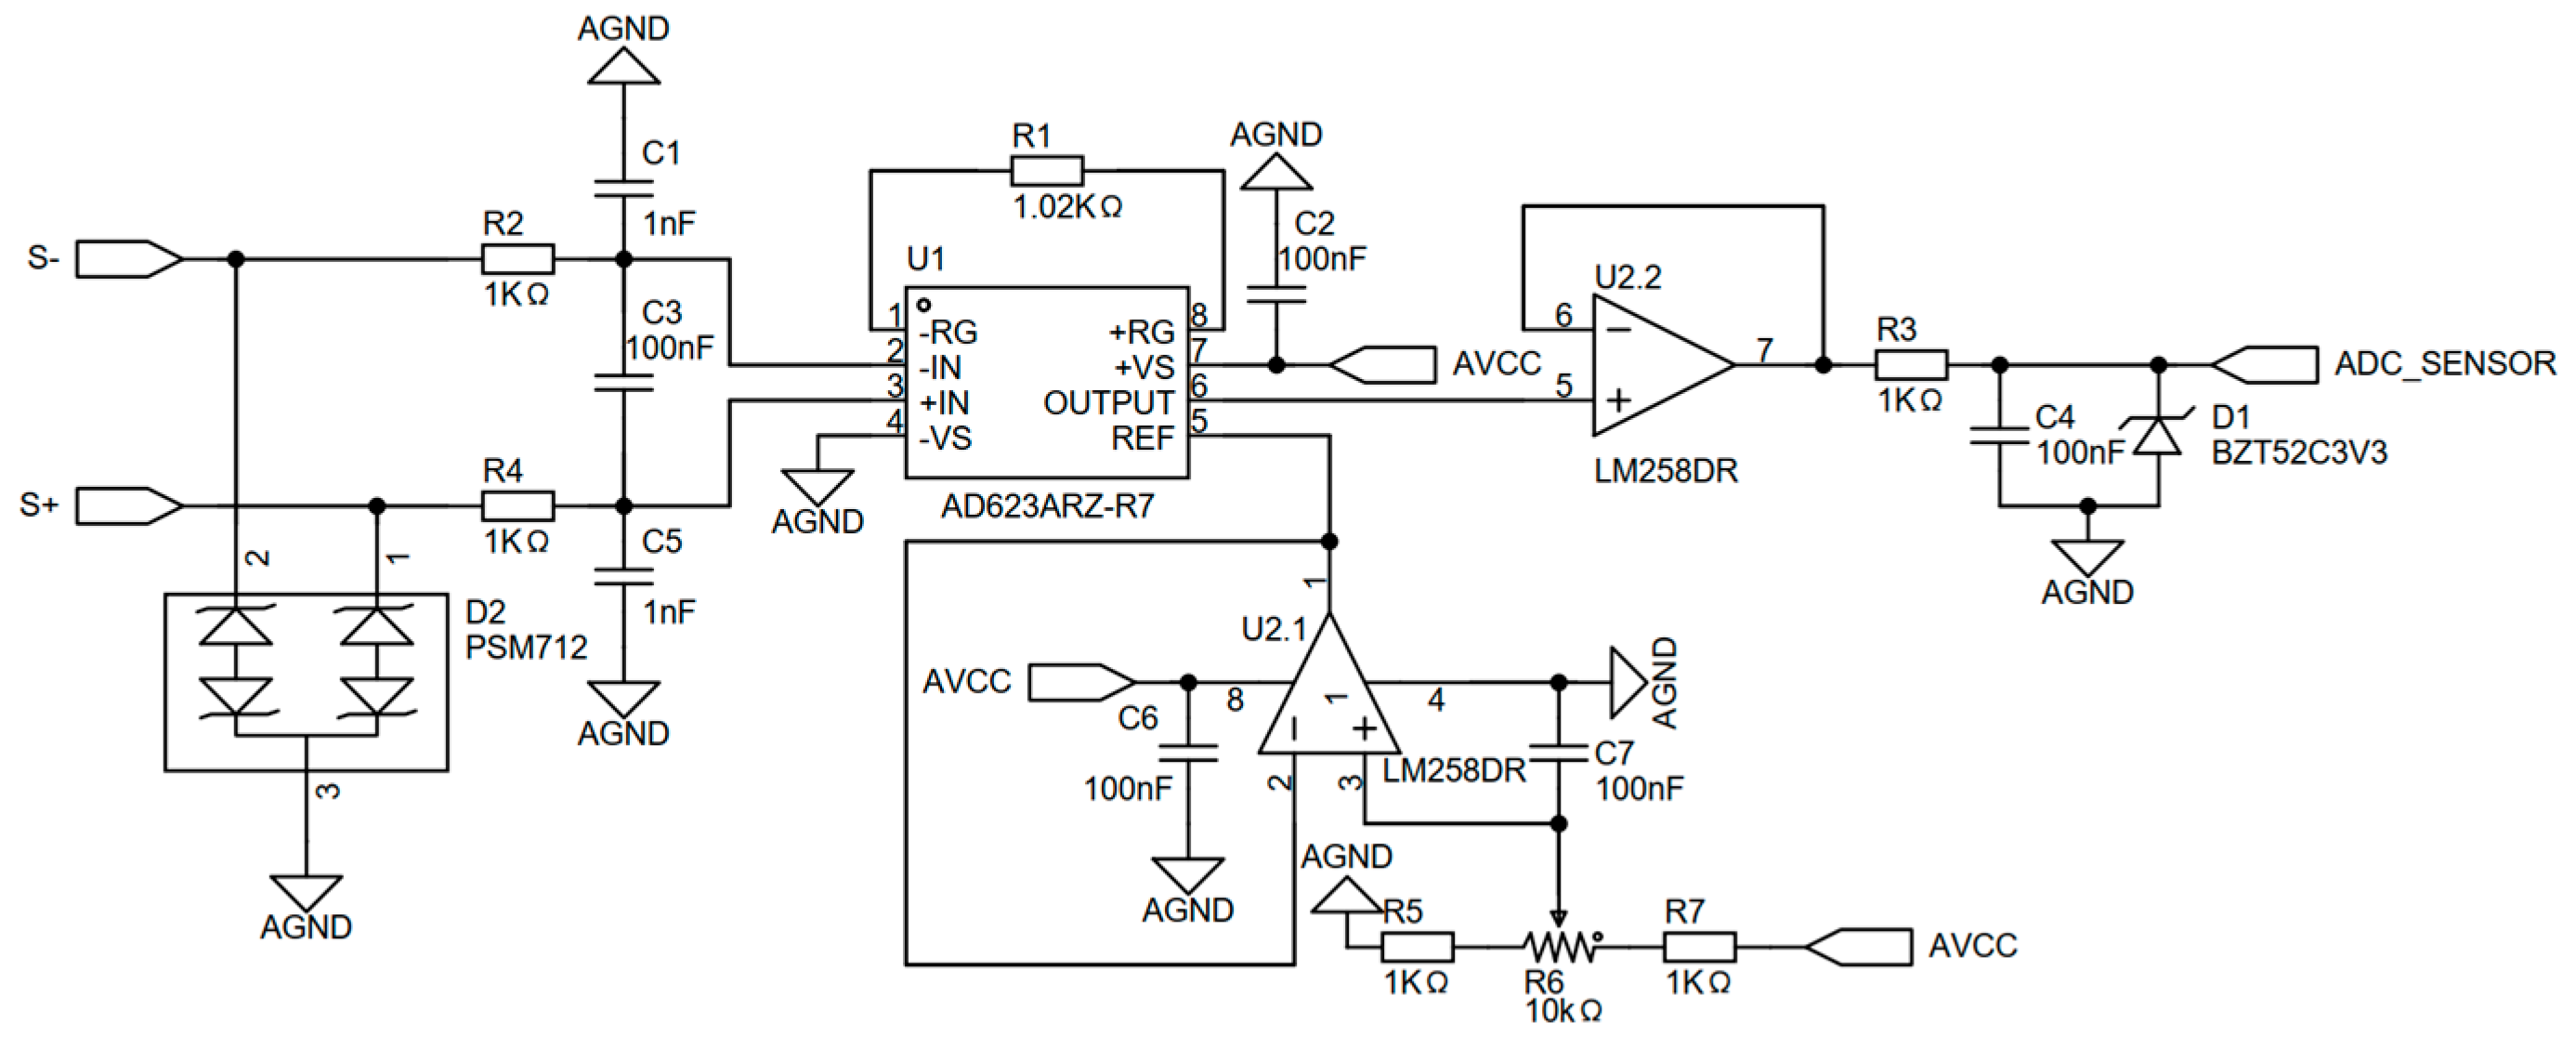
The schematic diagram of the amplifier circuit of the data collector design is shown in Figure 8. The AD623 chip is used to collect differential electrical signals, and the LM258 chip is used as the voltage following and adjusting reference voltage. Amplification is determined by the resistor R1 in Figure 8, and the resistance value of resistor R1 is 1.02 kΩ. Resistor R1 corresponds to RG in the formula. The amplification is 99.04 times higher after the formula is calculated, and the amplification formula is as follows:
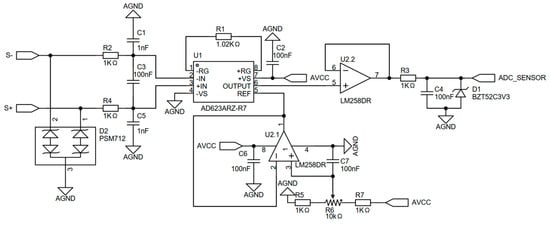
Figure 8.
Schematic diagram of signal amplification and filtering circuit for data acquisition device.
In the formula, VO represents the amplification, RG is the resistance value of resistor R1, VC is the differential signal collected, and the difference is S+ minus S−. After the amplification circuit, the electrical signal changes significantly, combined with the performance indicators of the chip ADC, by adjusting the pre-tuning potentiometer R6. Usually, the chip detects the lowest voltage and the highest voltage, and there is a large signal fluctuation. In order to more accurately detect the anchor (cable) stress sensor electrical signals, the reference voltage of the AD623 chip is set to 1 volt so that the subsequent converted electrical signals all start from a 1 volt base. The final signal is output from the ADC_SENSOR terminal, and the amplified data derived from the conversion of the MCP3201 ADC acquisition chip are shown in Figure 9.
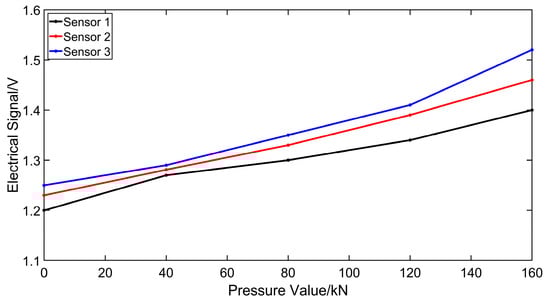
Figure 9.
Data after amplification circuit processing.
After amplification, for every 40 kN increase in force, the electrical signal increased by about 0.06 volts; thus, MCP3201 can be accurately collected. Due to the production process and workmanship errors, the initial value of different sensors at 0 pressure and the coefficient of variation of the sensor will be slightly different. Therefore, in the following section, the data coming from the anchor (cable) stress sensor algorithm will be filtered and optimized.
3. Data Processing
3.1. Data Preprocessing
Due to the deviation of the sensor manufacturing process and the complex environment of the mine tunnel, the failure of the anchor (cable) stress sensor may cause the measurement data of the data acquisition device to be abnormal and carry coarse errors, which will have a serious impact on the accuracy of the results of the monitoring of the support force of the anchor (cable). Therefore, it is necessary to preprocess the initial data to eliminate the coarse errors that affect the system.
Statistical discrimination methods for gross errors include Romano’s Rule (t-test criterion), Dixon Criterion, Grubbs Criterion, Lyddane-Shindo (3σ criterion), and so on. In this paper, Romano’s Rule is used to discriminate the gross error of the collected data, which is applicable to the number of samples n:
It is characterized by first removing a suspect measurement and then testing the excluded measurements for gross errors by a t-distribution. The Romano’s rule is as follows:
- (1)
- Let a quantity be measured several times independently with equal precision:
- (2)
- If is considered coarse, calculate the average of the remaining data:
- (3)
- Set the error of the ith measurement , and calculate the standard deviation of the data:
- (4)
- Select the appropriate significance and data processing length n. Find the coefficient K(n, ) in the t-distribution table, with often taken as 0.01 or 0.05. The test coefficient K takes the values shown in Table 1 below.
 Table 1. The coefficient K value of the t-test criterion.
 - (5)
- Let satisfy the following relation:
Then, the jth measurement result is considered to be an outlier containing gross error and should be rejected, and vice versa. Using the above guidelines, each measurement is examined until the pressure data tested by the anchor (cable) stress transducer does not contain gross error values, and the transducers whose measurement data errors are out of the allowable range are filtered out.
3.2. Kalman Filter
In order to realize a large-area distributed installation, self-developed elastomers are used to reduce the cost. This leads to a certain error in the trend between the elastomers, but the overall trend is linear, so the signals from multiple elastomers can be collected for filtering.
A Kalman Filter is a recursive filter used to estimate the state of a dynamic system. It is based on the mathematical model of the system and the measurement data and provides an optimal estimate of the state by fusing the a priori information with the measurement information. Thus, the Kalman Filter can help eliminate noise from sensor data and provide a more accurate estimate of the state. The collected data from a linear sensor can be considered the output of a linear system. If the dynamic characteristics of the system and the noise of the sensors satisfy the assumptions of the Kalman Filter, then the Kalman Filter can process these data efficiently. The filtering and estimation of linear sensor data can be achieved by modeling the system, including the state transfer and observation matrices, as well as estimating the covariance matrix of the measurement and process noise.
The Kalman Filter process consists of two steps: prediction and correction. The prediction step utilizes the state estimate of the previous moment to predict the state value at the current moment. Then, the correction step uses the estimated and observed states at the current moment to obtain the optimal state estimate at that moment through an optimization method. The process of a Kalman Filter can be described by the following state equation.
Prediction process:
Equation (7) is the state prediction process and Equation (8) is the error matrix prediction, where and are the a posteriori state estimates denoting k − 1 and k moments, respectively, and are one of the results of the filtering, i.e., the updated result, also called the optimal estimate. A is the state transfer matrix, which is actually a conjectural model of the target state transition. B is the matrix that transforms inputs into states, and is the external action on the system at time k − 1. and denote the a posteriori estimated covariance at k − 1 and k moments, respectively, which is one of the results of the filtering, and Q is the prediction noise covariance matrix. Since the anchor (cable) stress sensor is continuously and individually varied without interference from other control systems, = = 1 is taken in constructing the equations; is the matrix of state parameters at k moments, and = 0 is taken.
The calibration process:
Equation (9) is the Kalman gain calculation, Equation (10) is the system state correction, and Equation (11) is the error matrix update, where is the Kalman gain at time k, an intermediate filter computation. H is the transition matrix from state variables to measurements (observations), denoting the relationship that connects the state to the observation, which is linear in the Kalman filter. R is the measurement noise covariance matrix. is the observation of the system at time K. q is the residual of the actual observation and the predicted observation. is the residual of the actual and predicted observations, which, together with the Kalman gain, corrects the prior (prediction) to obtain the posterior. is the final output of the Kalman filter.
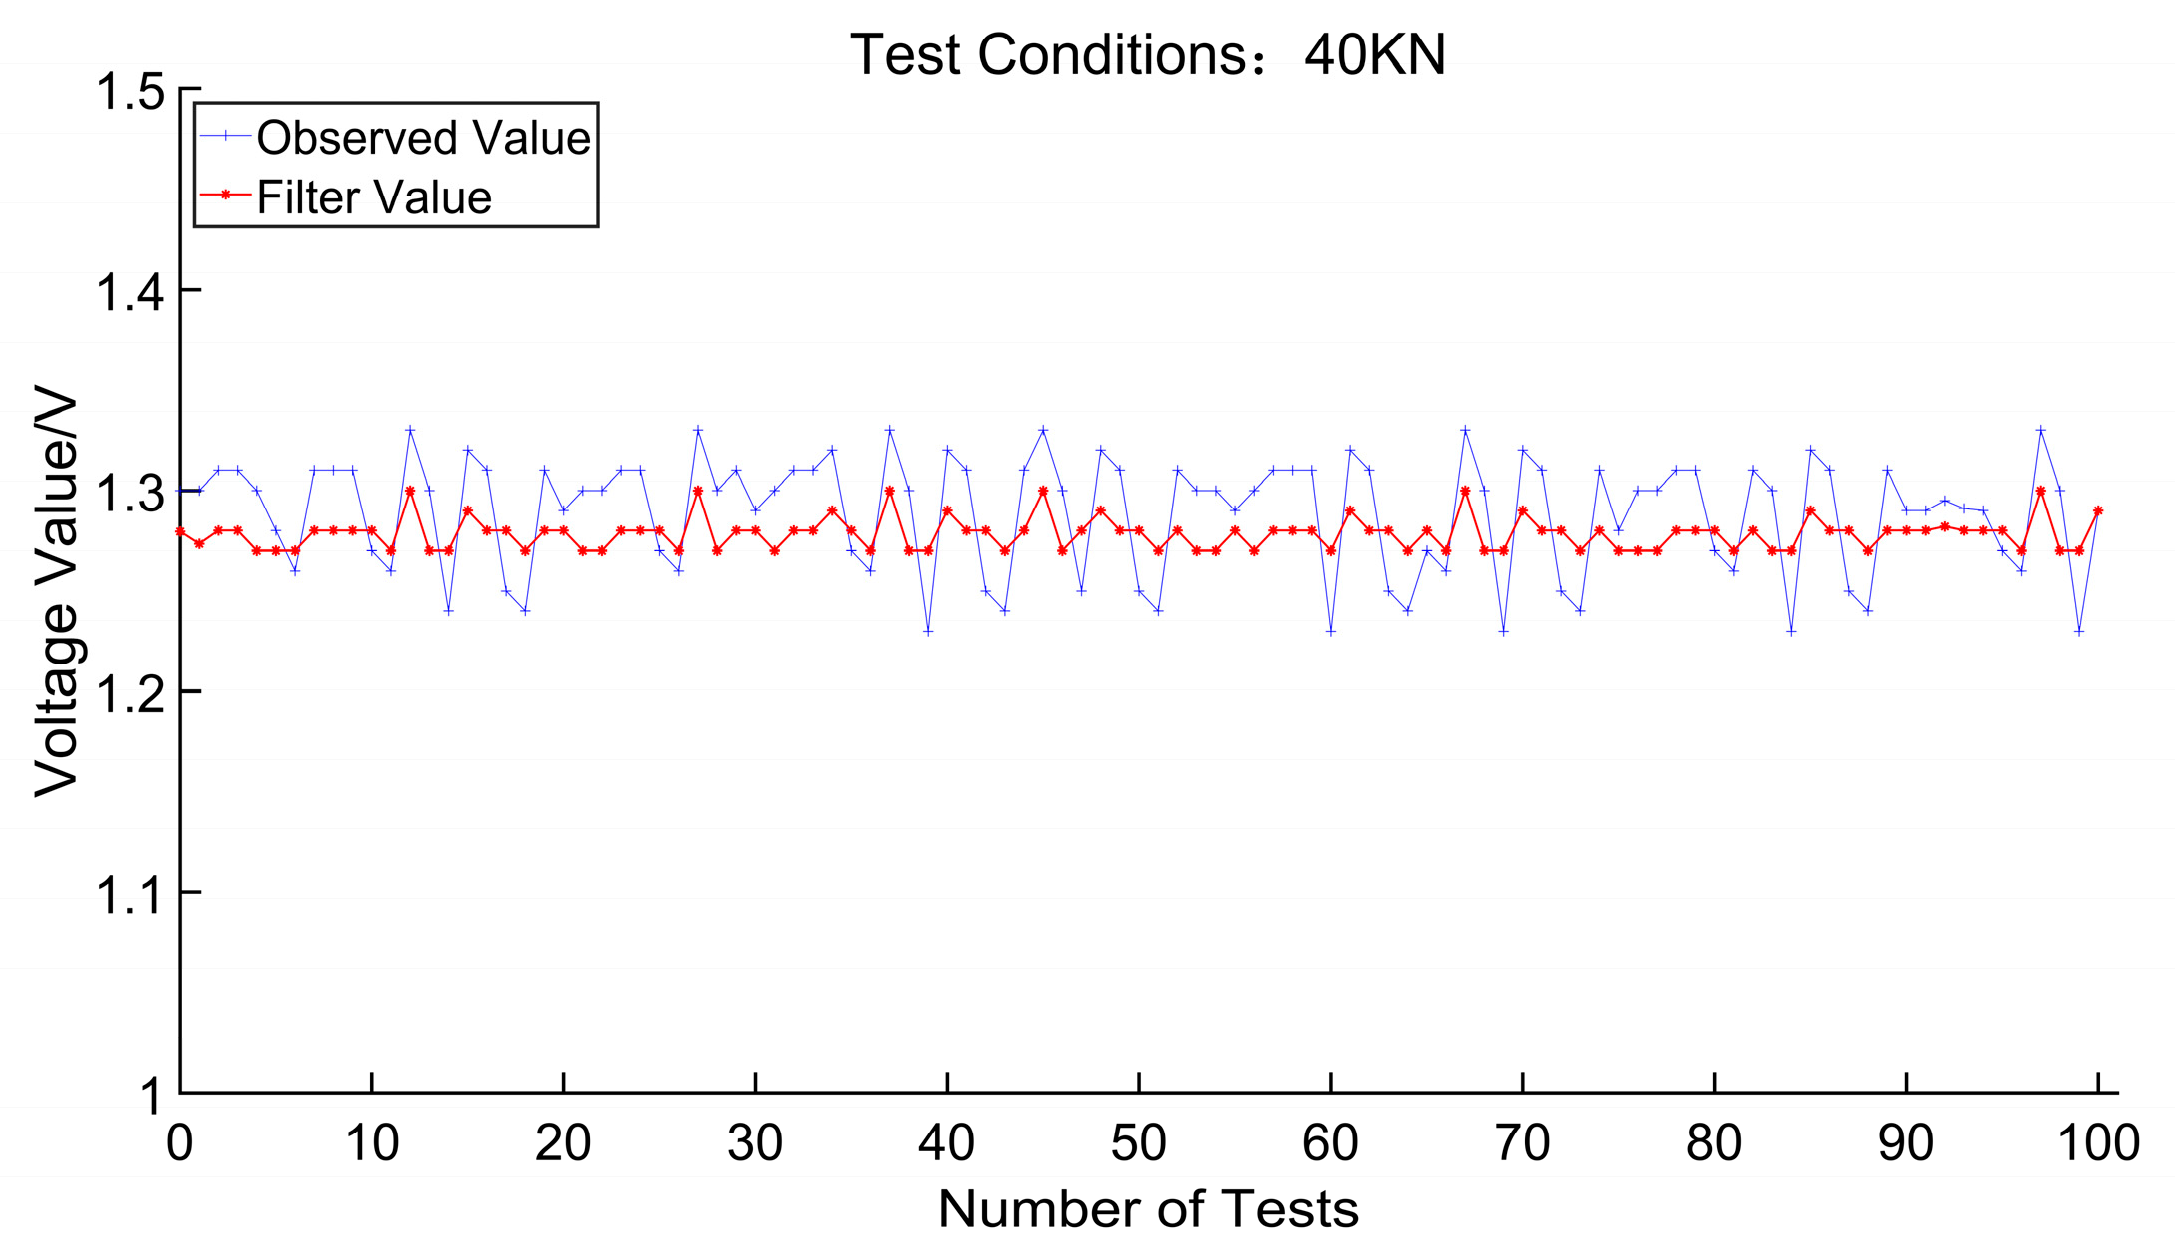
After data pre-processing, the large errors and coefficient deviations of the large sensors were eliminated, and the remaining sensors and anchor puller pressure were positively correlated. As can be seen from Figure 9, there is also a certain fluctuation between different sensors. Now, filter the two groups of sensor data, with each group composed of 50 anchor (cable) stress sensors, under the same pressure test conditions. Each sensor is tested 100 times, and the test data are used to take the average value. Two groups of data are used to calculate the observed value, and another group is used to calculate the estimated value. The final filtered value is processed by the Romanovs basis rule, eliminating the great error value, and the remaining data are averaged to obtain the corresponding voltage value of the sensor under this pressure. The initial data and the data after Kalman filtering are shown in Figure 10.
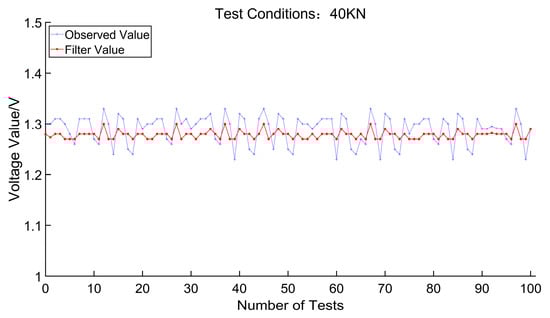
Figure 10.
Comparison chart before and after Kalman filtering.
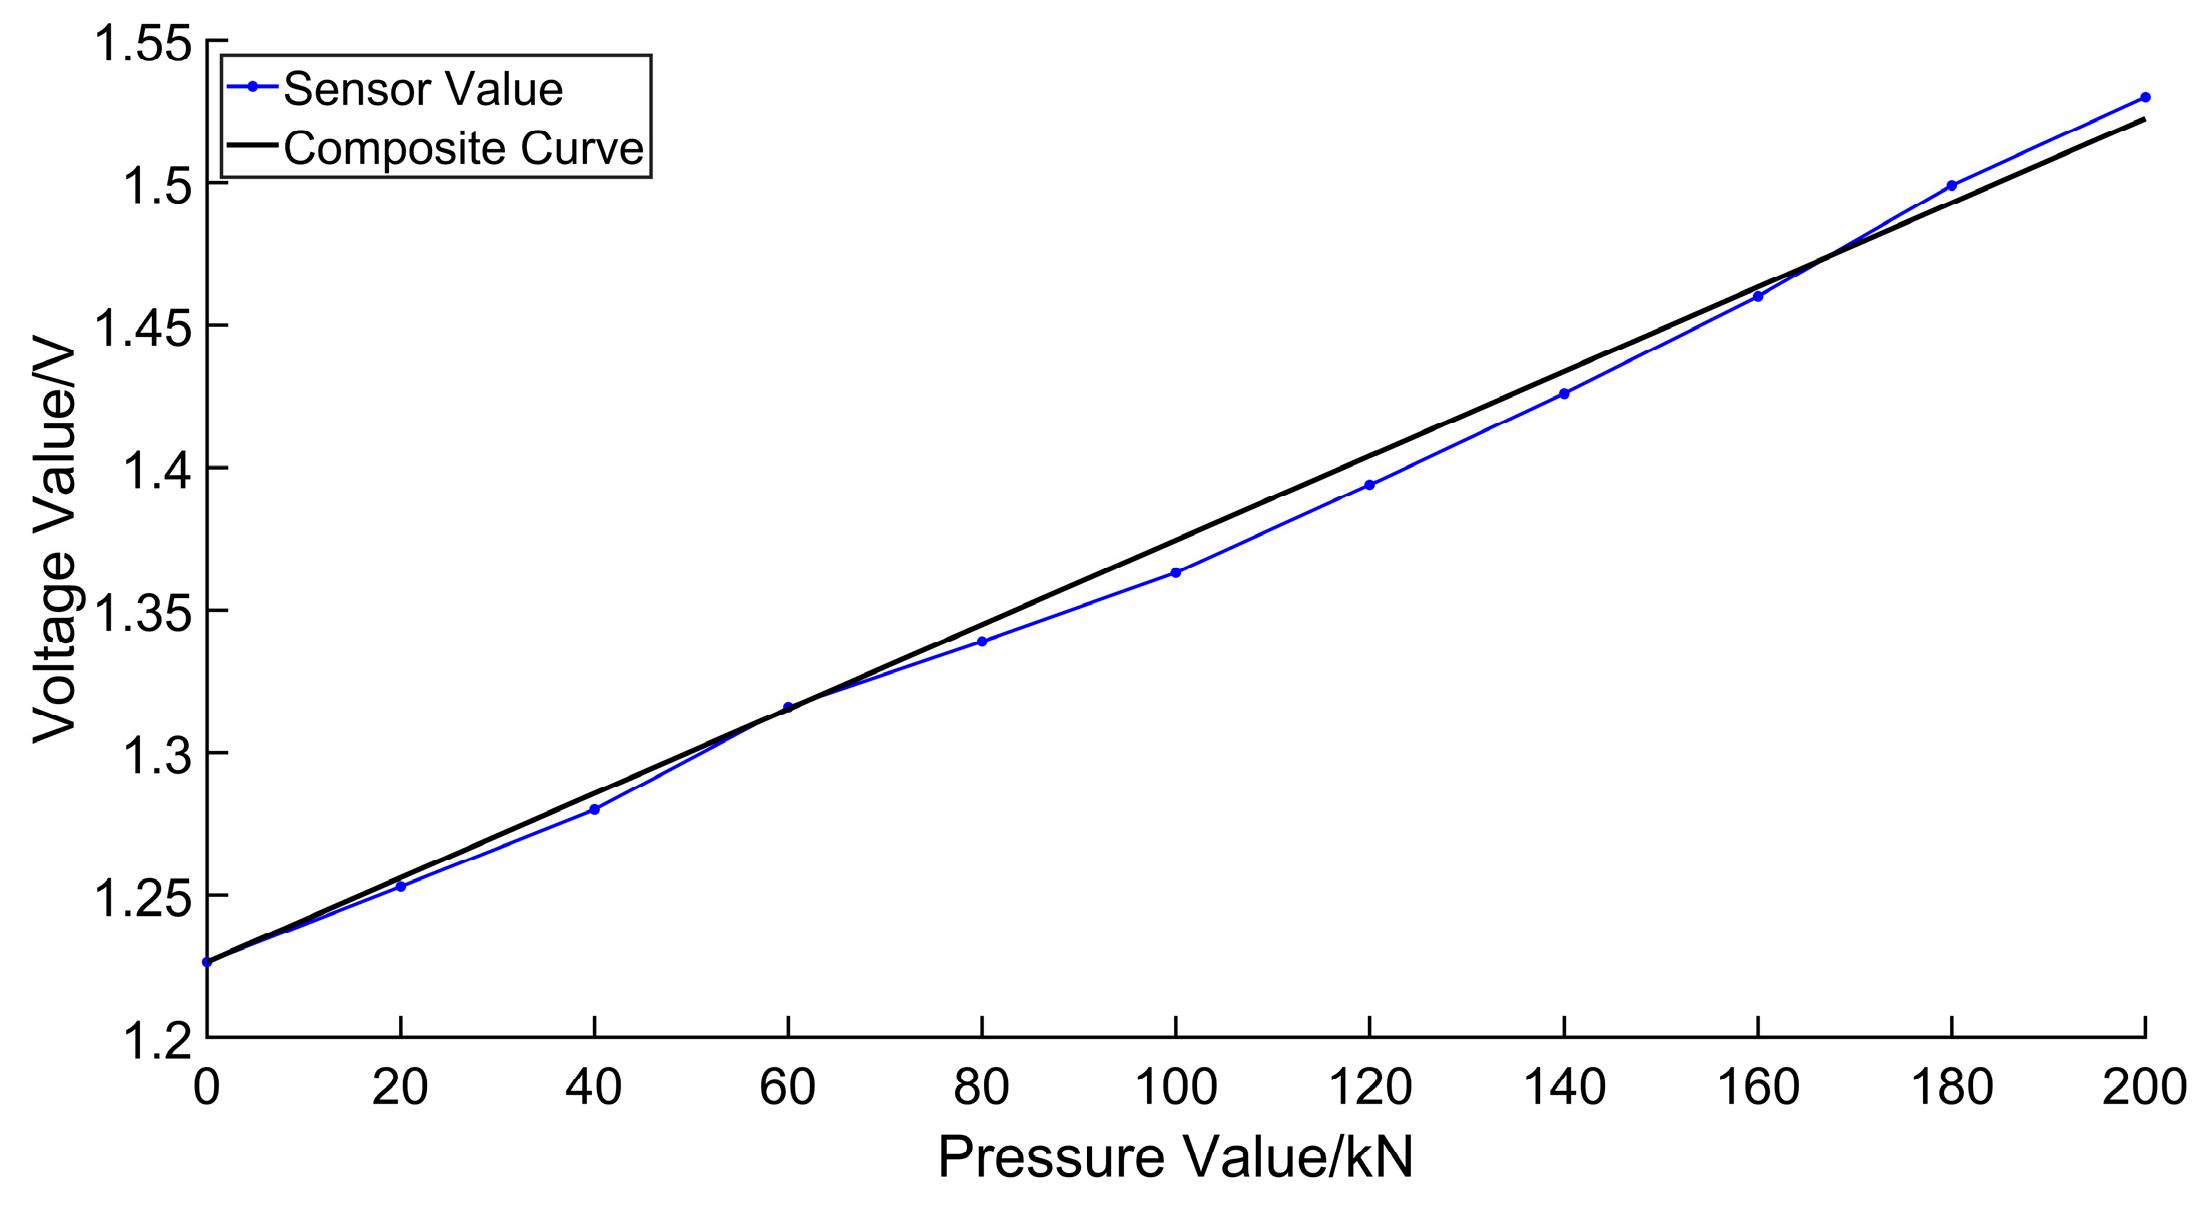
Figure 10 shows a test of the sensor head at a pressure of 40 kN, with a peak value of 1.33 V before filtering and a minimum value of 1.23 V, with data fluctuating in the 0.1 V interval. After Kalman filtering to obtain smoother data, the peak value before filtering is 1.27 V, the minimum value is 1.3 V, and the data fluctuations are in the interval of 0.03 V. By removing the large error values, using the remaining data for the average, and retaining two decimal places, we obtain the anchor (cable) stress sensor at a 40 kN pressure corresponding to the value of the electrical signal, which is 1.28 V. Other pressure values were tested, and the data after the test were filtered and finally synthesized into a one-time function curve. We obtained the conversion relationship between the pressure and voltage, as shown in Figure 11.

Figure 11.
The conversion relationship between pressure and voltage.
4. Mine Tunnel Deformation Monitoring Substation
4.1. Hardware Design of Mine Tunnel Deformation Monitoring Substation
Figure 12 shows the hardware framework of the monitoring substation, which is mainly composed of the control board, display, switch LoRa gateway modules, etc. The WAN port of the LoRa gateway is connected to the switch through a network cable, and the switch is connected to the underground base station through a network cable or fiber optic to enter the internal loop network of the coal mine and transmit the data back to the ground control center. The LoRa gateway is paired with a LoRa directional antenna with a frequency range of 433 MHz and a gain of 6 dBi (dBi is relative to the gain of the point source antenna). With a specific frequency transmission rate and a directional antenna, the LoRa transmission distance is tested to be up to 3 km under one network. The theoretical maximum number of devices received by the LoRa gateway is 65,535, and the number of devices is 1000 under the condition of stable reception and no loss of data.
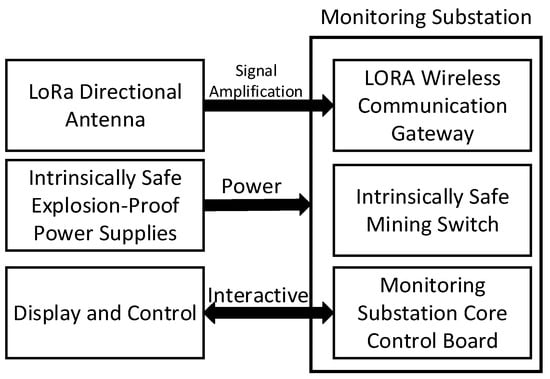
Figure 12.
Mine roadway deformation monitoring substation structure.
The control board is also connected through Ethernet cables and switches, and the data received by the LoRa gateway are read and displayed in a loop on the display screen according to the cross-section. The LoRa gateway ultimately transmits data to the ground control center through the MQTT protocol. The MQTT (Message Queuing Telemetry Transport) is a lightweight publish/subscribe-based messaging protocol. The control center can construct a deformation model for the entire roadway based on the pressure data for each section, improving the monitoring quality and early warning efficiency of roadway deformation during the mining process.
4.2. Substation Display and Control for Monitoring Deformation in Mine Roadways
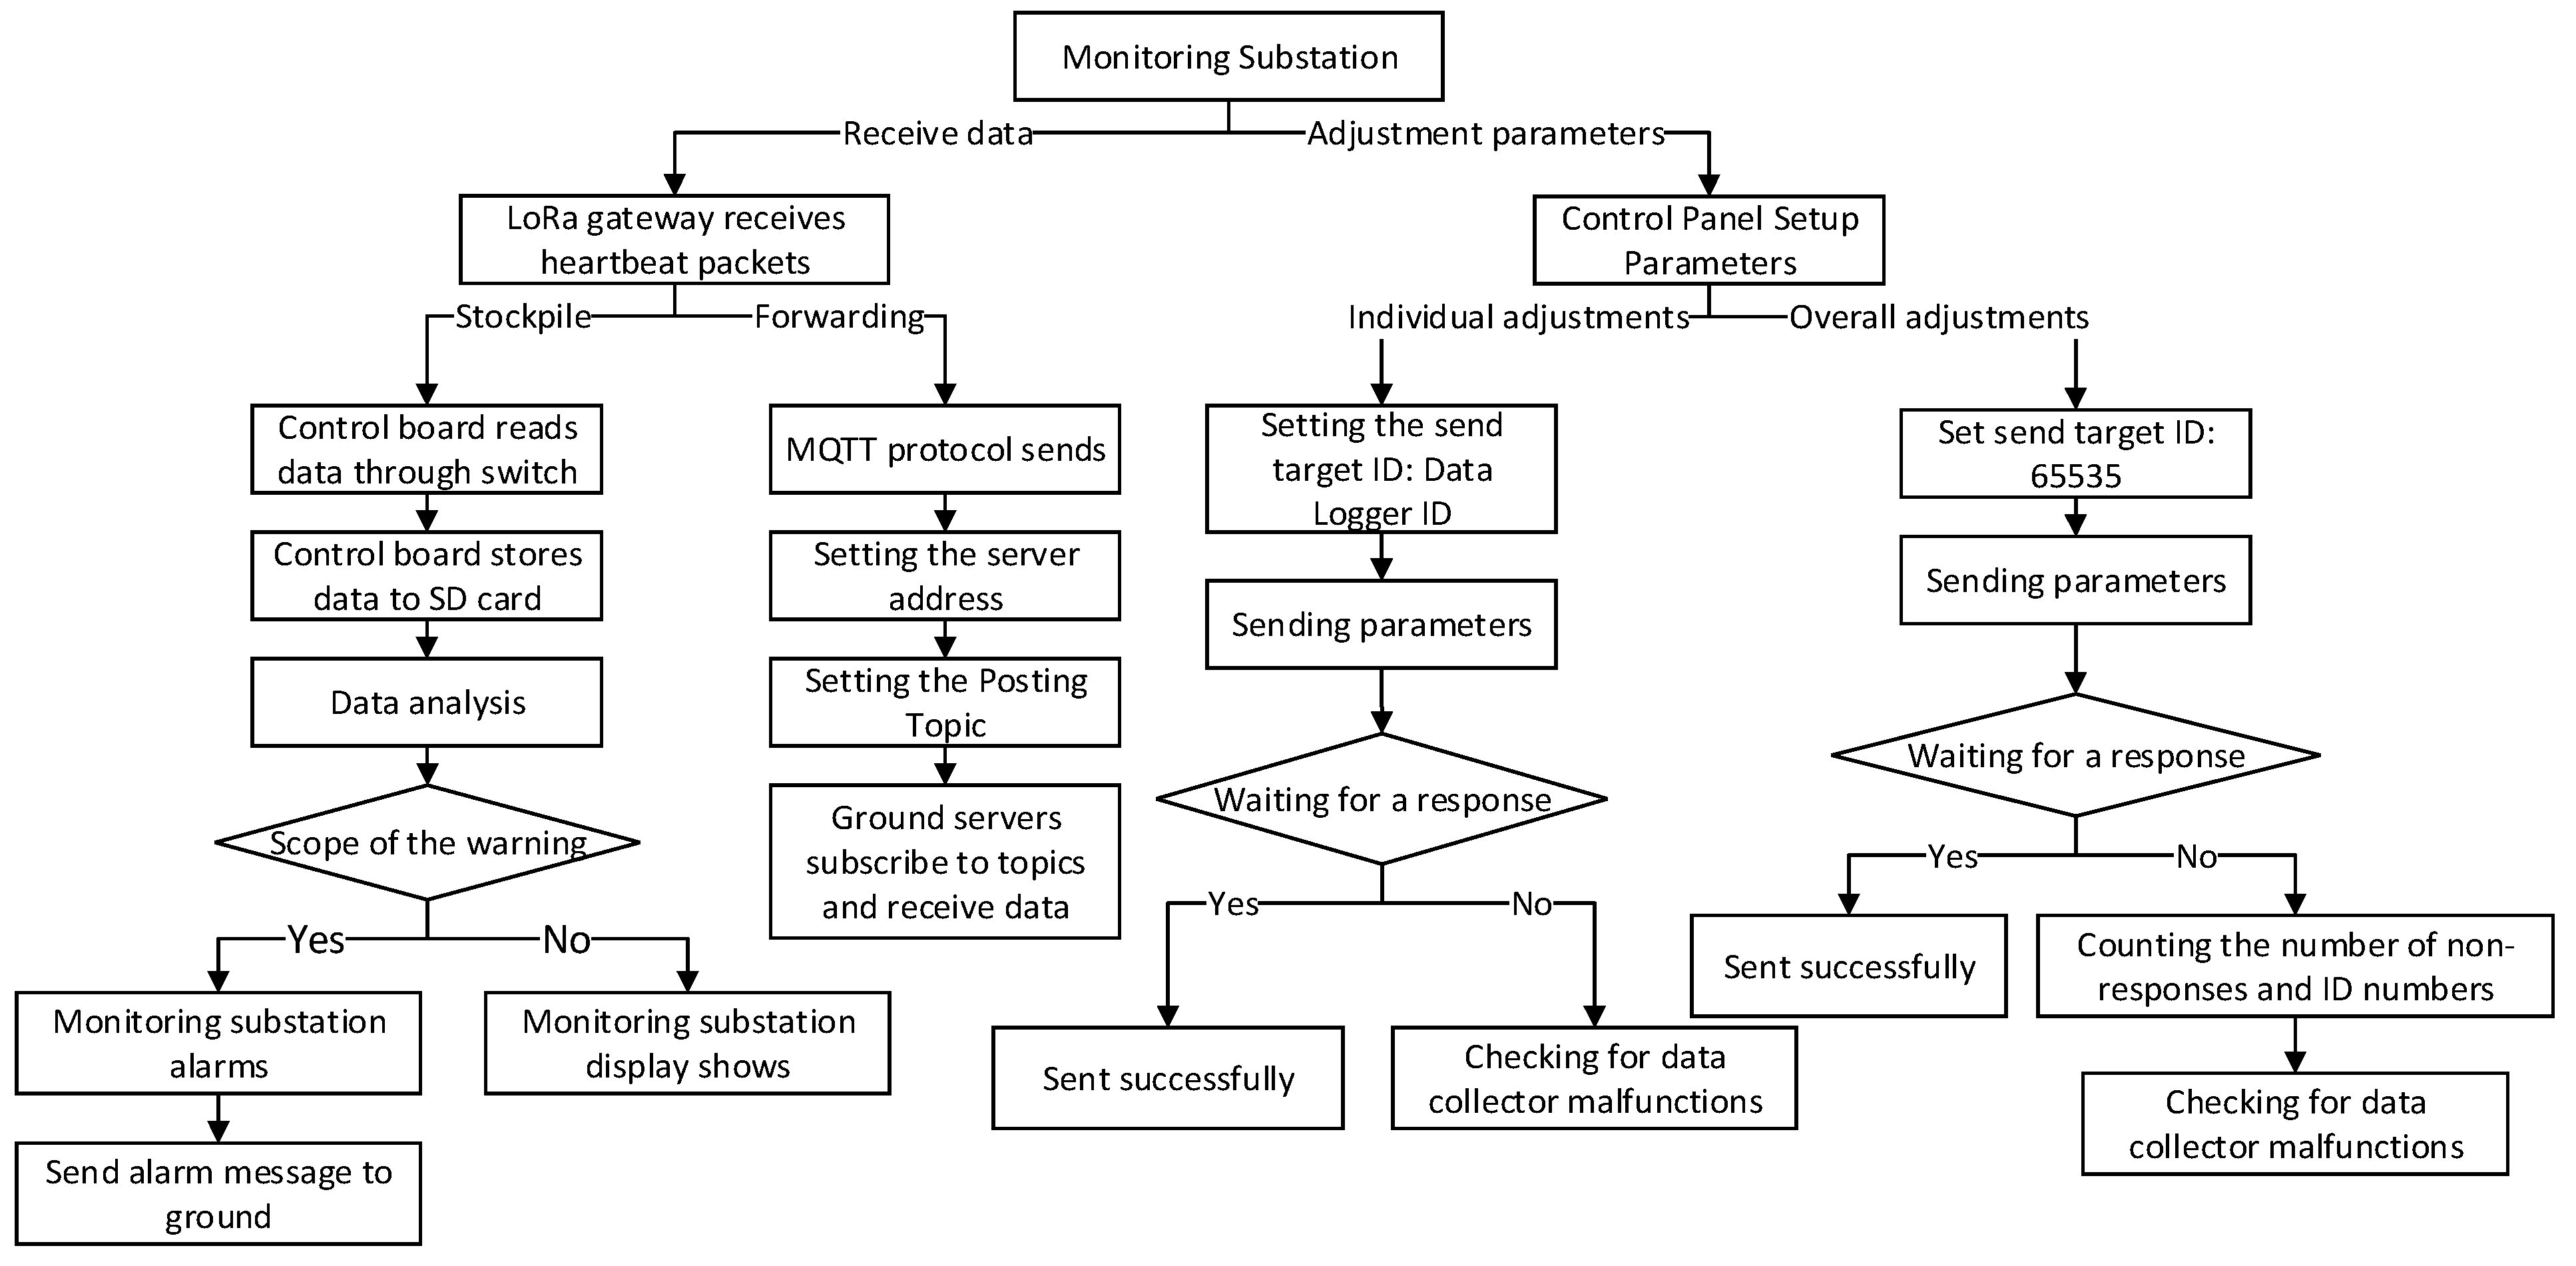
The display screen of the monitoring sub-station can show the stress of anchor rods (cables) in multiple sections, and the display interface can show 3~8 monitoring sections at a time. The monitoring substation can adjust the collection frequency according to the advancing speed of the synthesized mining face and the change in the surrounding rock of the mine tunnel. The underground roadway is mostly in complicated and harsh conditions such as drenching, humidity, and high temperatures, and the construction workers will make certain errors during installation, which will affect the accuracy of the anchor bar (cable) stress sensor. Therefore, the monitoring substation can adjust the coefficient of the pressure and voltage relationship of each data acquisition device. By setting the transmission address of the monitoring substation to the LoRa device ID of the data acquisition device, the coefficient can be set for the data acquisition device in a point-to-point manner. If it is necessary to set coefficients for all data acquisition devices in the whole section of the roadway uniformly and set the transmitting address of the monitoring substation to 65535, then one-to-many communication can be realized. The workflow diagram of the monitoring substation is shown in Figure 13.

Figure 13.
Monitoring substation workflow diagram.
5. Experiments
5.1. Field Test Installation
Based on the above research, the distributed high-density anchor (cable) support force monitoring system is arranged in a coal mine in Hujirt Mining District, and the anchor (cable) stress sensors, data acquisition devices, and monitoring substations are applied in the field. There are two workers in a coal mine in Hujirt Mining District. The working face of 21,407 has a depth of about 650 m, and the thickness of the coal seam is from 2.95 m to 5.27 m, with an average thickness of about 4.0 m. The return tunnel of the working face of 21,407 belongs to a tunnel along the air excavation, and the right side of the return tunnel is an open area, with a width of a small pillar of coal of 6 m. The width of the small pillar of coal of 21,407 is 6 m, and the thickness of the coal seam in 21,407 is 5.27 m.
Now, the roadway deformation of the return airway is monitored and warned. An anchor (cable) stress sensor and data acquisition device form a complete set of anchor (cable) stress monitoring devices. Seven sets are installed in each row, one monitoring device is arranged in the middle of the mining side, and three sets are installed in the roof anchor ropes. The non-return side is the small coal pillar side, and the coal pillar near the hollow side has a large amount of deformation from previous mining processes, so one set of monitoring devices is installed at the top corner, bottom corner, and middle of the roadway. The installation diagram of the section of the return roadway is shown in Figure 14, and the anchor rods (cables) that need to be installed with stress monitoring devices are circled with red boxes.
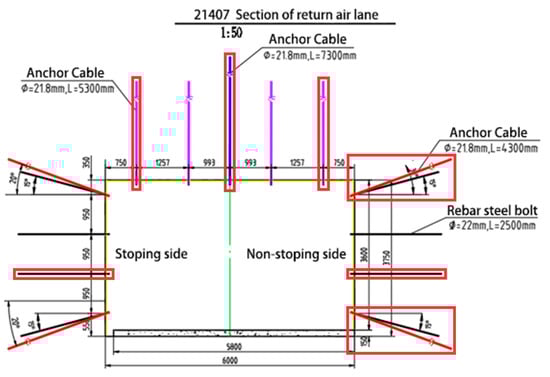
Figure 14.
Schematic diagram for the installation of the cross-section of the return airway.
On the return air lane, each section is spaced about 1.2 m apart, and one row is installed at every interval of 5 rows. The interval between the monitoring sections is about 7.2 m, and the section monitoring interval diagram is shown in Figure 15.
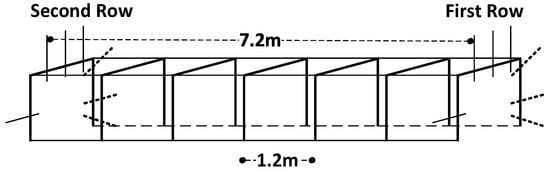
Figure 15.
Section monitoring interval diagram.
The seven sets of anchor rod (cable) stress monitoring devices in the first row of monitoring sections are numbered 101, 102, 103, 104, 105, 106, and 107, respectively. Among them, 101 represents the first anchor in the first row, where the tail number of 101 is 1, which is the anchor rod for the mining face; 102–103 are the top anchor cables of the first row; 106 tail number is 6, which is the middle anchor rod on the small coal pillar on the non-mining side; and 105 and 107 tail numbers 5 and 7 are the anchor cables at the top and bottom corners of the small coal pillar on the non-mining side, respectively. The first monitoring section is located 1500 m away from the return airway, and similarly, the second row is numbered 201, 202, 203, 204, 205, 206, and 207. The last row of monitoring sections is located 2200 m away from the return airway, with section numbers 9801, 9802, 9803, 9804, 9805, 9806, and 9807. The length of the monitoring tunnel is 700 m, with a total of 98 sections monitored and 686 sets of anchor rod (cable) monitoring devices installed. A monitoring substation is installed at a distance of 400 m from the first monitoring section, which is 1100 m from the return air lane.
A prestressing force of 200 kN will be applied during the installation of the anchor cable. The initial tightening torque of the anchor is 200 N.M. The diameter of the anchor is 21.8 mm, and the equation for the relationship between the preload torque and the preload force of the anchor is as follows:
where P is the anchor preload force in kN; M is the torque applied by the anchor in N.M; D is the diameter of the anchor in m; and K is the coefficient related to the form of the anchor thread, the contact surface, the material, and the rod diameter. After conversion, the anchor preload is 47.6 kN.
The anchor (cable) stress monitoring device collects data every half hour. At a distance of 200 m from the comprehensive mining face, the deformation of the surrounding rock and the stress on the anchor rods (cables) change quickly, and the collection frequency will be increased to once every 15 min. The acquisition frequency of the monitoring device can also be adjusted by a monitoring substation according to the actual conditions of the mine tunnel.
5.2. Cross-Sectional Monitoring and Analysis
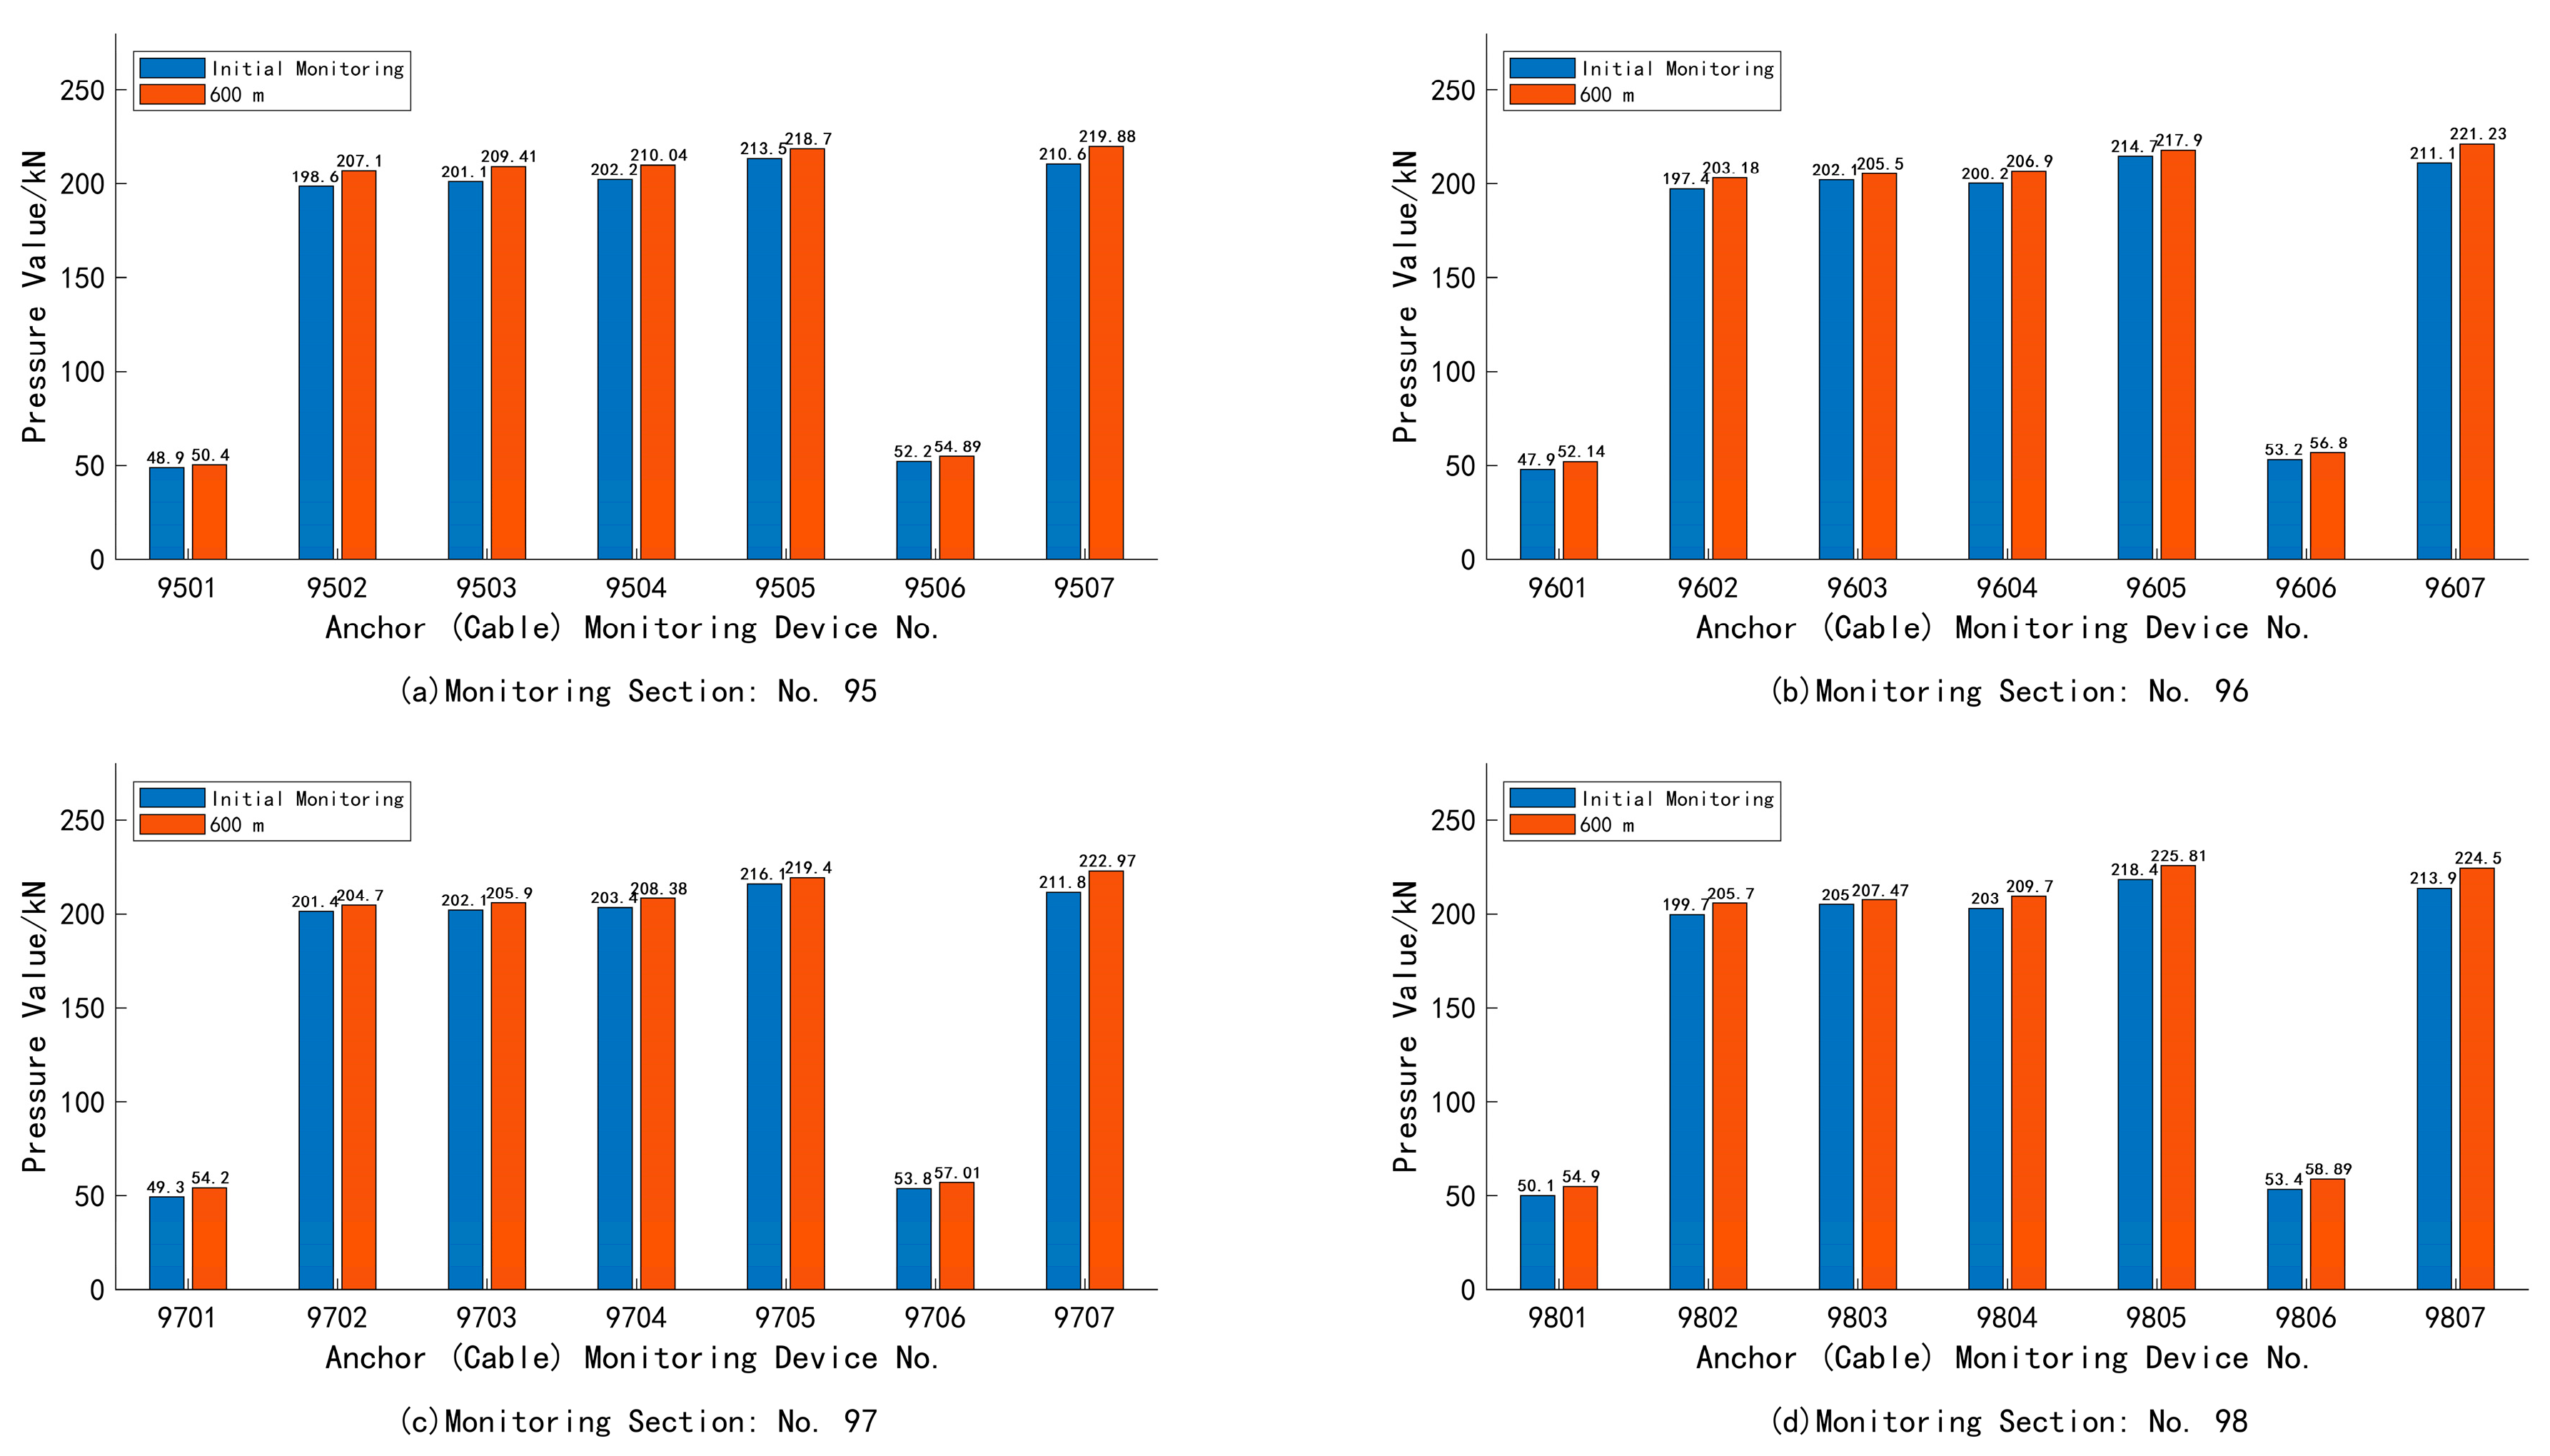
The monitoring started when the comprehensive mining face was at 2900 m in the return airway. When the comprehensive mining face advances to 2800 m, the monitoring section is 600 m away from the comprehensive mining face at this time, and the overall deformation of the roadway from 2200 m to 1500 m does not change much, as shown in Figure 16. It shows the stress changes in section 98, section 97, section 96, and section 95 at 600 m away from the comprehensive mining face. Compared with the initial monitoring data of the hewing face at 2900 m, the average increase in the roof anchor cable is 6.4 kN, and the average increase in the two gang anchors is 3.8 kN.
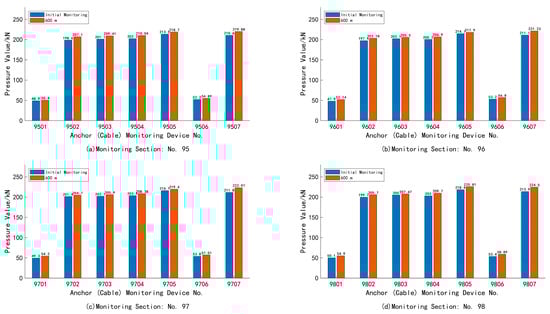
Figure 16.
Stress monitoring of anchor rods (cables) 600 m away from the working face.
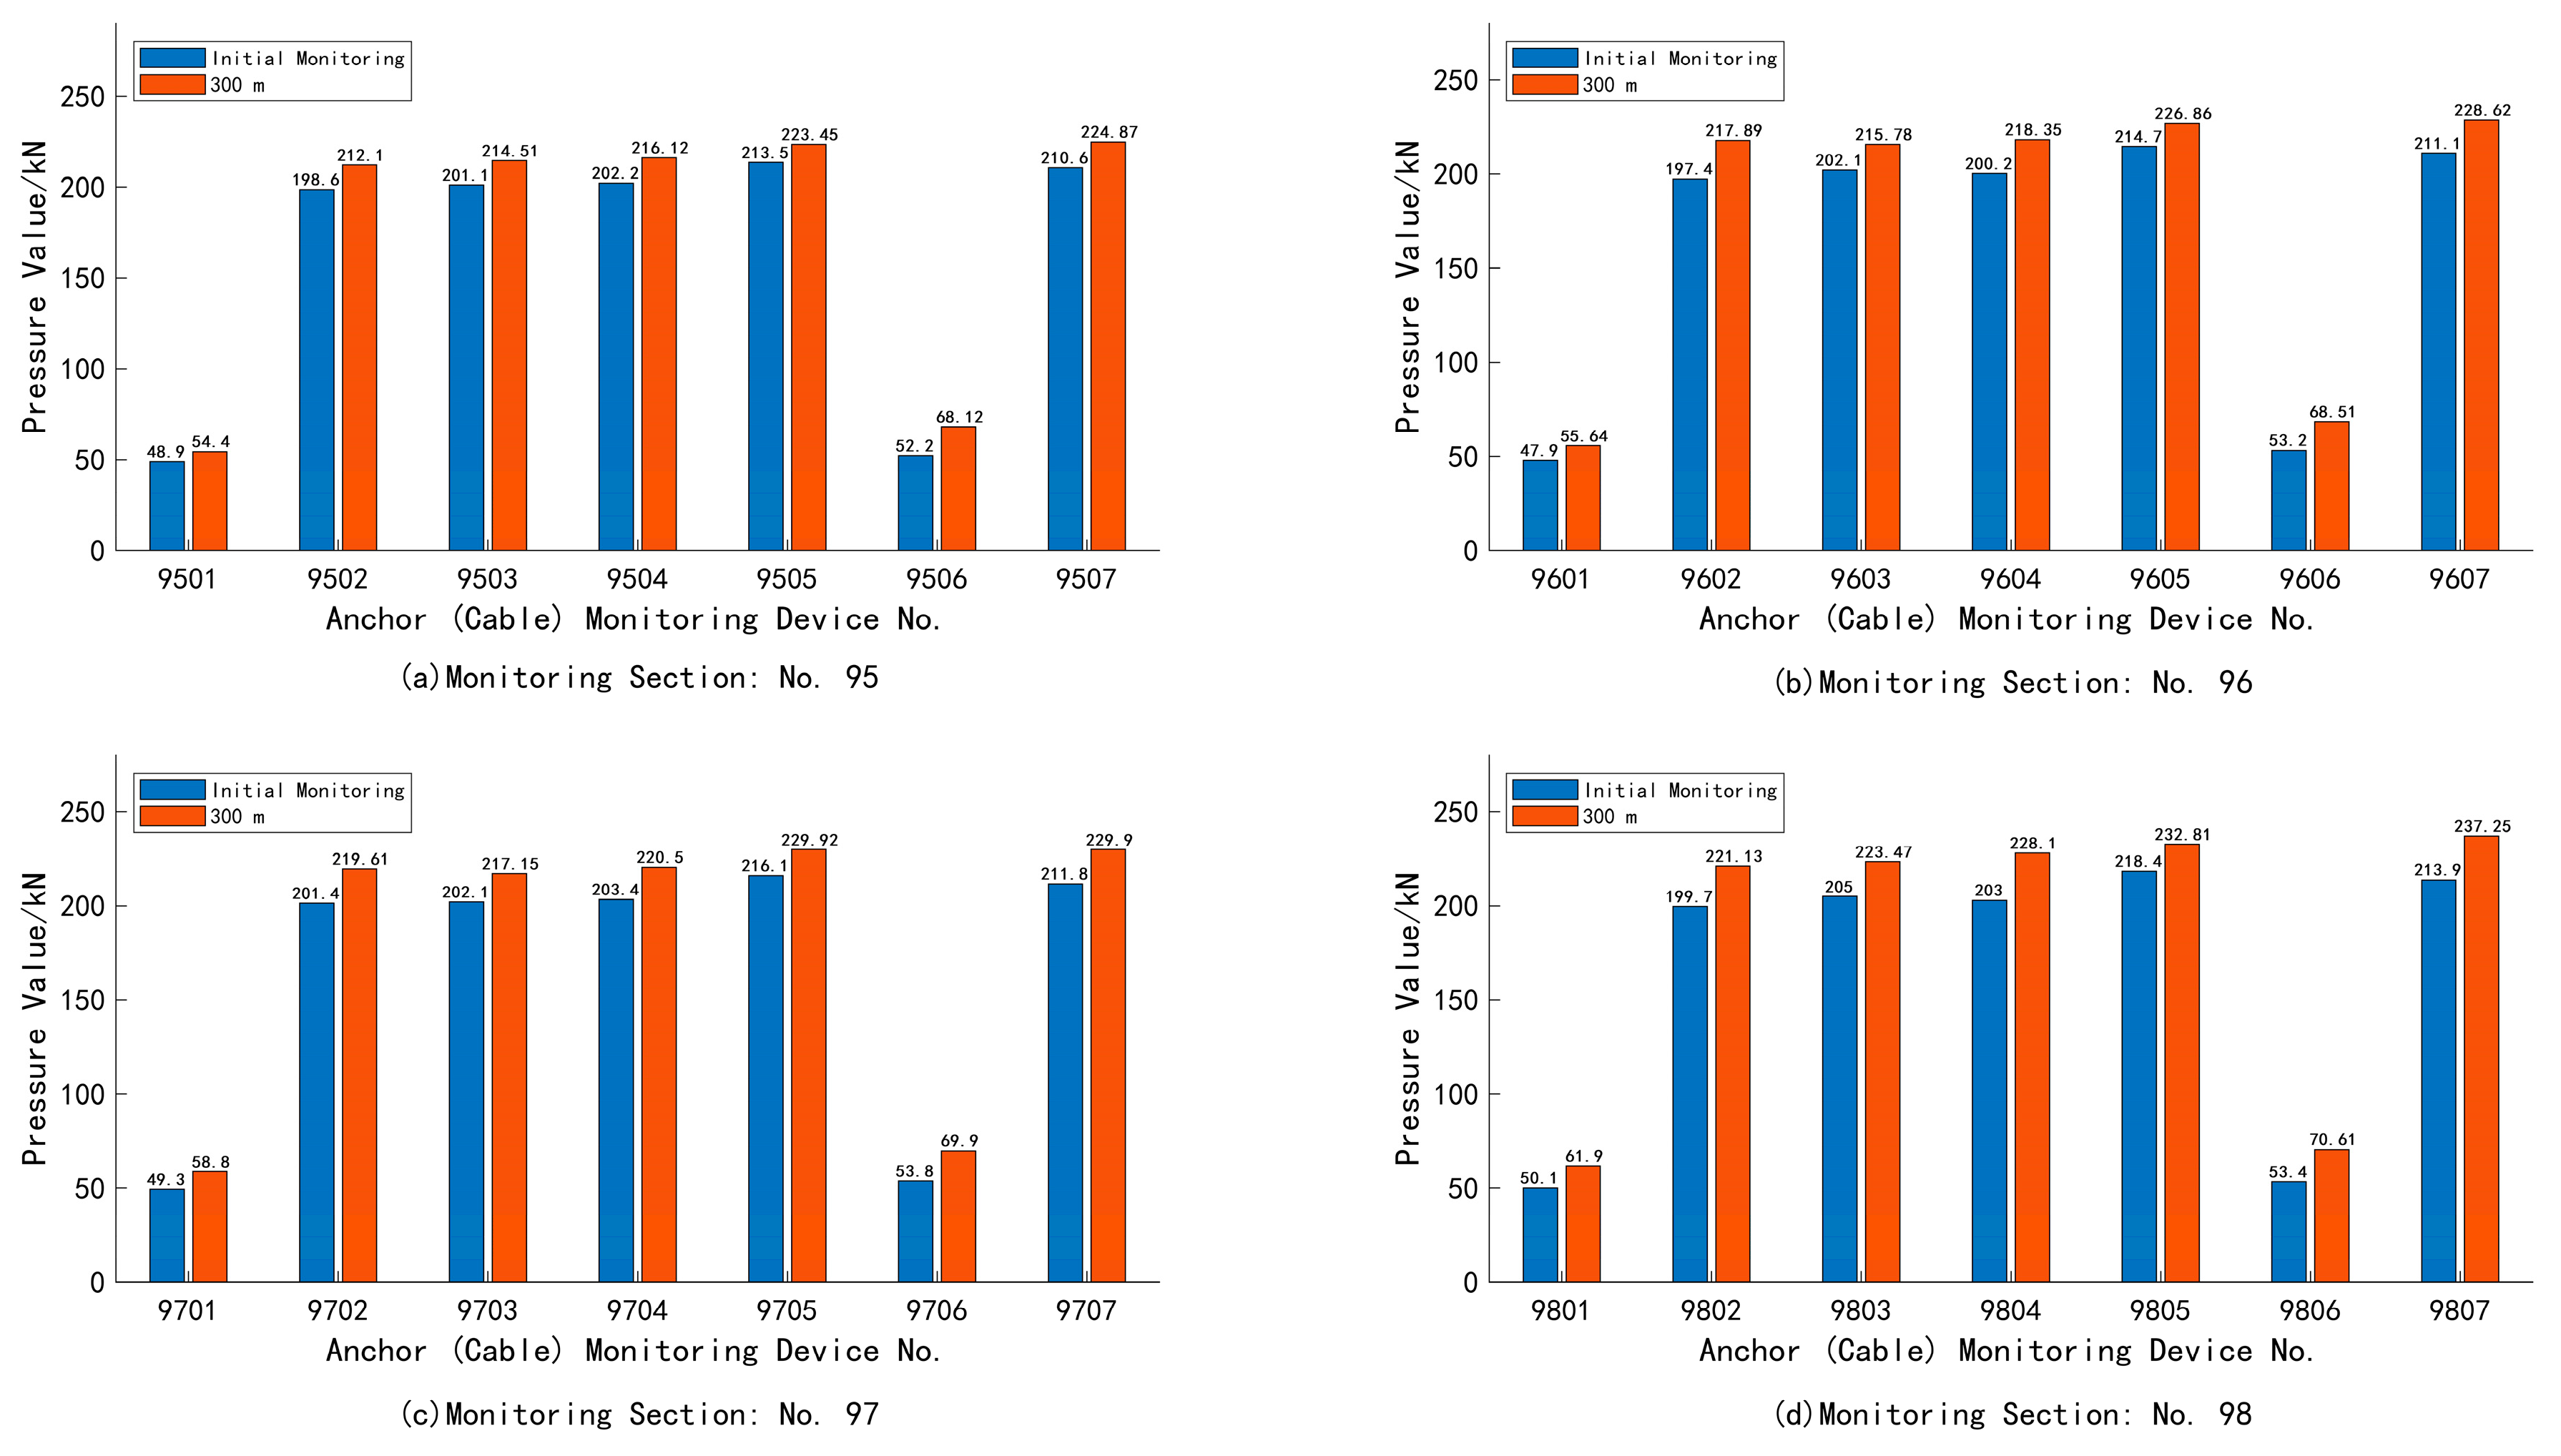
When the fully mechanized working face is advanced to 2500 m, the roadway roof anchor pressure and two-side anchor pressure increase more than when the fully mechanized working face is at 2900 m. At this time, the monitoring section is 300 m away from the fully mechanized working face, and the anchor cable pressure at the bottom corner of the 9807 small coal pillar side of section 98 increases the most, with an increase of 23.35 kN, with an average increase of about 16.6 kN. The anchor pressure at the small coal pillar side of the two side bolts increased significantly, and the anchor pressure at the 9806 small coal pillar side of section 98 increased the most, with an increase of 17.21 kN and an average increase of about 12.38 kN, as shown in Figure 17. The graph shows the increase in pressure at each monitoring node of sections 95–98 at a distance of 300 m from the working face.
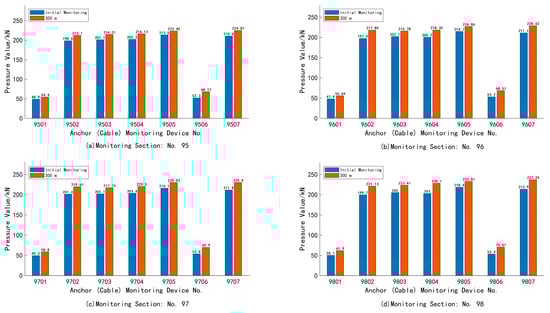
Figure 17.
Stress monitoring of anchor rods (cables) 300 m away from the working face.
5.3. Small Coal Pillar Side Monitoring Analysis
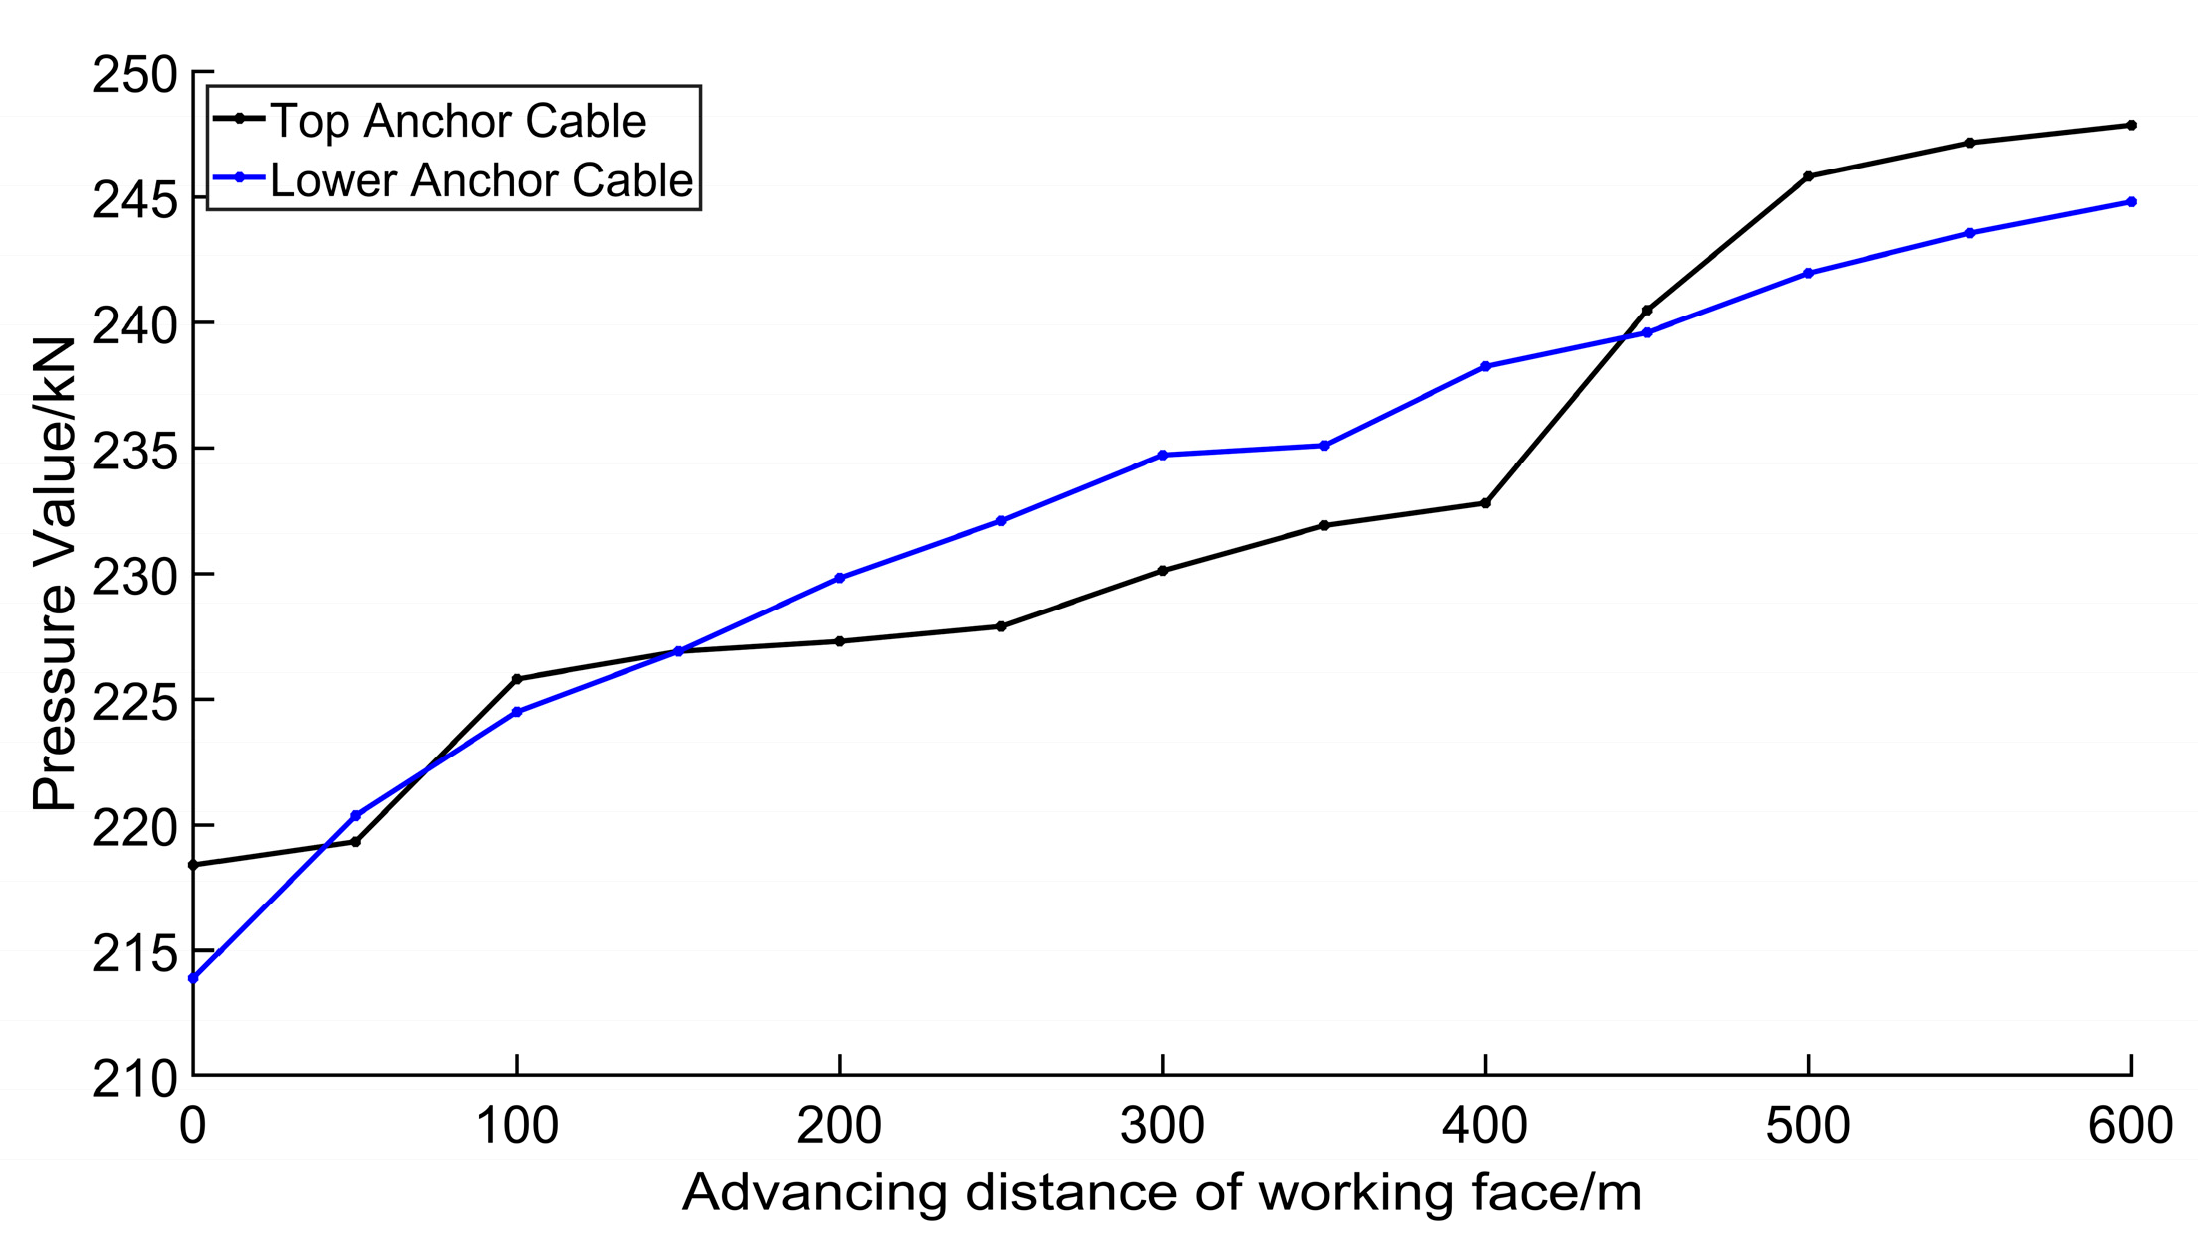
The side pressure of the small coal pillar obviously increased during the process of working face advancement, and now, the anchor rods (cables) on the side of the small coal pillar are monitored. When the working face advances to 600 m, the no. 98 monitoring section is 100 m away from the working face; the pressure of the top anchor cable of the small coal pillar increases by 29.47 kN compared with the initial stress. and the pressure is 247.87 kN at most. The pressure of the anchor cable at the low part of the small coal pillar increases by 30.91 kN compared with the initial stress, and the pressure is 244.81 kN at most. The pressure of the anchor cable at the bottom increases gently along with the advancement in the mining distance, and the pressure of the top anchor cable has a gentle increase when the working face advances to 100 m and 400 m, and the pressure has an increase at the top. Anchor ropes have a significant increase in pressure when the working face advances to 100 m and 400 m. In general, the pressure at the top of the small coal pillar increases by 30.91 kN compared with the initial stress. Overall, the pressure of the top anchor cable of the small coal pillar is greater than that of the bottom anchor cable, as shown in Figure 18. The blue curve represents the value of anchor cable pressure change at the bottom of the small coal pillar, and the black curve represents the value of anchor cable pressure change at the top of the small coal pillar.
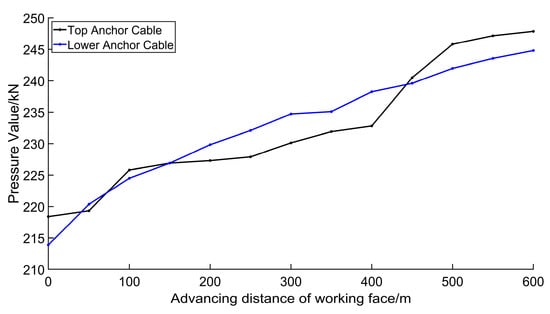
Figure 18.
Stress variation in anchor cables at the top and bottom of small coal pillars.
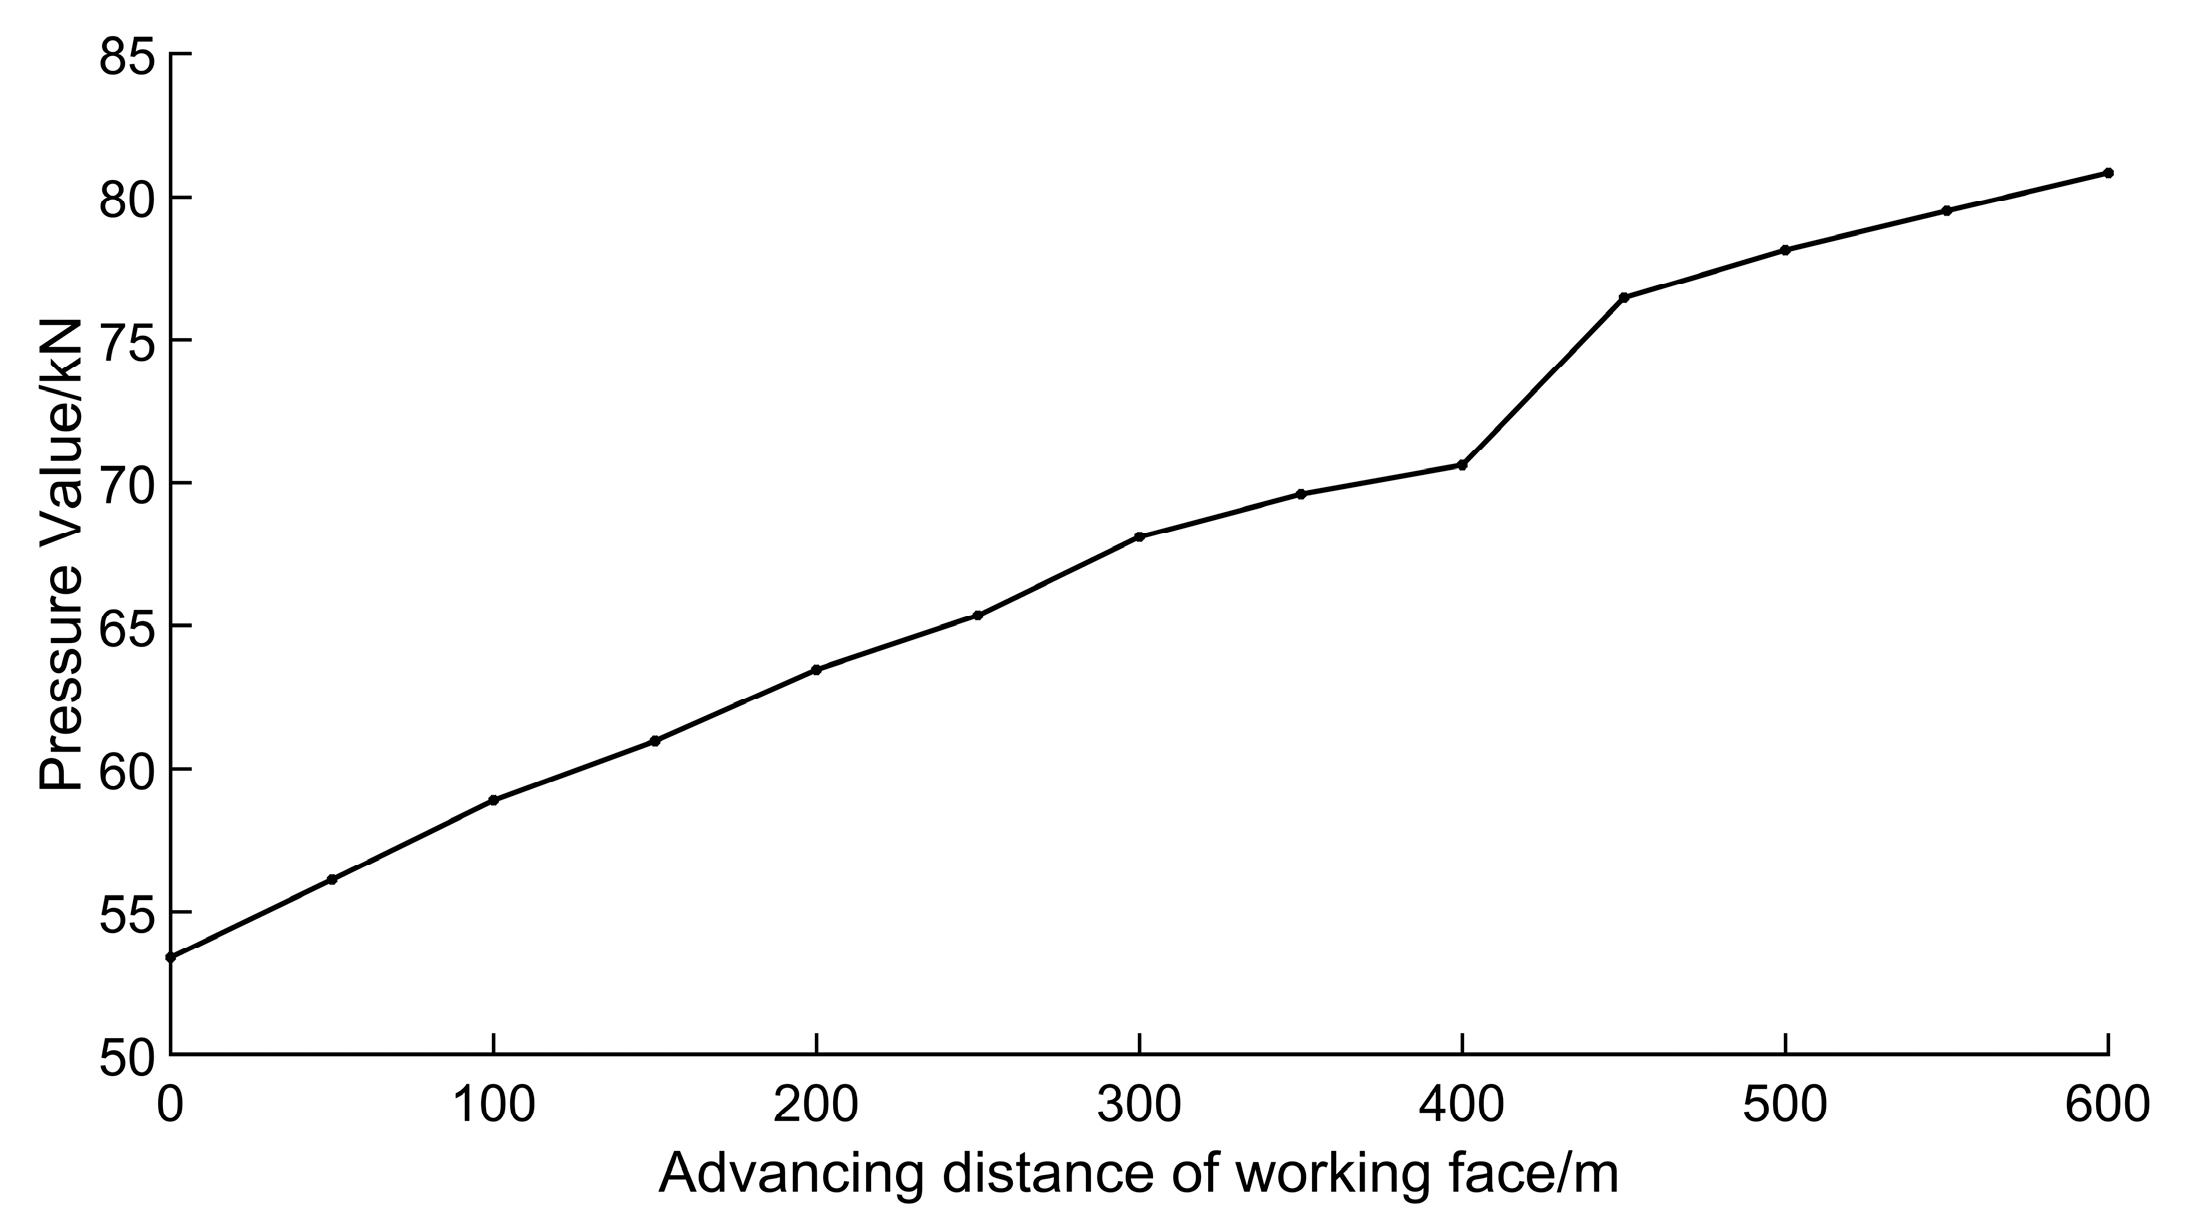
The monitoring of the anchor rod in the middle of the side of the small coal pillar can conclude that the maximum stress of the anchor rod is 80.84 kN, increasing by 27.44 kN compared with the initial stress. When the working face advances to 400 m, there is a significant increase in the stress of the anchor rod, as shown in Figure 19.

Figure 19.
Stress variation in the middle anchor rod on the side of the small coal pillar.
Through the monitoring data of the support force of the roadway anchor rods (ropes), it can be concluded that the side pressure of the small coal pillar increases obviously during the mining process, and the reinforcement support should be carried out in advance during the overrun support. The change in roof pressure on the side of a small coal pillar is larger than that on the side of back-mining, so the support strength of unit-type over-head support and end-head support should be improved during over-support. In the process of mining, the stress of the small coal pillar at the top anchor cable and the stress of the middle anchor bar increased significantly when the working face advanced 400 m. About 300 m from the working face, the top anchor cable pressure and two-gang anchor bar pressure of the roadway will increase sharply. In the process of coal mining, the quality of the anchor rod (cable) support on the roadway 300 m away from the working face is detected in advance and combined with the monitoring data to set the support force of the end bracket and the portal overrun bracket to ensure the safety of the roadway.
6. Conclusions
Through the design and development of wireless transmission anchor (cable) monitoring nodes, the high-density and wide-range monitoring of anchor (cable) support strength is realized. Combined with the pressure data of multiple sections, it can analyze the change in pressure of the whole section of the roadway. A distributed self-organizing network is realized by means of LoRa wireless communication, and the data transmission is stable and complete. Combined with the MQTT protocol to transmit data to the ground control center in real time, the well can also monitor the deformation of the roadway in real time and analyze and predict the data. Embedded technology is adopted to introduce the working principle of anchor bar (cable) stress monitoring devices and mine roadway deformation monitoring and control substations from the aspects of hardware design and software design. The sensor signal is amplified by the design of the hardware circuit. The Romanovs base rule is used to eliminate the large error values of the sensor, and combined with a Kalman Filter, the optimal estimation is obtained to determine the proportional relationship between the sensor pressure and the electrical signal and to solve the defect that the coefficients of the low-cost sensors are not uniform.
Author Contributions
Conceptualization, K.S. and L.W.; methodology, K.S.; program, K.S.; validation, K.S., L.W. and J.Q.; formal analysis, K.S.; investigation, K.S.; resources, K.S.; data curation, K.S.; writing—original draft preparation, K.S.; writing—review and editing, K.S., L.W. and J.Q.; visualization, K.S.; supervision, L.W. and J.Q.; project administration, R.Y.; funding acquisition, L.W. All authors have read and agreed to the published version of the manuscript.
Funding
This work is supported by Program for Innovative Research Team (in Science and Technology) at the University of Henan Province (22IRTSTHN005) and the “Double first class” discipline creation project of Henan Polytechnic University (AQ202300403).
Data Availability Statement
Data sets cannot be made public for copyright reasons.
Conflicts of Interest
The authors declare no conflicts of interest.
References
- Si, L.; Xi, Y.; Wei, J.; Li, B.; Wang, H.; Yao, B.; Liu, Y. Dissolution characteristics of gas in mine water and its application on gas pressure measurement of water-intrusion coal seam. Fuel 2022, 313, 123004. [Google Scholar] [CrossRef]
- Zhao, W.; Wang, K.; Ju, Y.; Dong, H.; Lou, Z.; An, F.; Feng, B. Influence of the roadway exposure time on the accuracy of gas content measurements in reconstructed and extended mines. Process Saf. Environ. Prot. 2020, 142, 109–117. [Google Scholar] [CrossRef]
- Yu, J.; Li, Z.; Liu, Y.; Dong, Z.; Sun, Y. Regularity of Mine Gas Flow Disaster Induced by Gas Natural Ventilation Pressure after Coal and Gas Outbursts. ACS Omega 2021, 6, 19867–19875. [Google Scholar] [CrossRef]
- Chen, Y.; Liu, J.; Zhou, Q.; Liu, L.; Wang, D. A study on rapid simulation of mine roadway fires for emergency decision-making. Sci. Rep. 2024, 14, 1674. [Google Scholar] [CrossRef] [PubMed]
- Wang, J.; Li, D.; Long, Q.; Zhao, Z.; Gao, X.; Chen, J.; Yang, K. Real-time semantic segmentation for underground mine tunnel. Eng. Appl. Artif. Intell. 2024, 133, 108269. [Google Scholar] [CrossRef]
- Jinpeng, Z.; Limin, L.; Futao, Z.; Junzhi, C. Development and application of new composite grouting material for sealing groundwater inflow and reinforcing wall rock in deep mine. Sci. Rep. 2018, 8, 5642. [Google Scholar] [CrossRef] [PubMed]
- Xie, S.; Li, H.; Chen, D.; Feng, S.; Yang, J.; Ma, X.; Jiang, Z.; Xing, S. Research on the Control Technology and Key Parameters of External Anchor-Internal Unloading of Surrounding Rock During Gob-Side Entry Driving Under Severe Mining of 1000-m-Deep Mine. Rock Mech. Rock Eng. 2024, 57, 2913–2932. [Google Scholar] [CrossRef]
- Bai, Q.; Tibbo, M.; Nasseri, M.H.B.; Young, R.P. True Triaxial Experimental Investigation of Rock Response Around the Mine-By Tunnel Under an In Situ 3D Stress Path. Rock Mech. Rock Eng. 2019, 52, 3971–3986. [Google Scholar] [CrossRef]
- Desbarats, A.J. A lumped-parameter model of groundwater influx to a mine adit in mountainous terrain. Water Resour. Res. 2002, 38, 1–11. [Google Scholar] [CrossRef]
- Bai, J.; Zhu, Z.; Liu, R.; Wang, M.; Zhang, Q.; Ma, H. Groundwater runoff pattern and keyhole grouting method in deep mines. Bull. Eng. Geol. Environ. 2021, 80, 5743–5755. [Google Scholar] [CrossRef]
- Xie, M.; Li, Y.; Zhang, H.; Yang, Z.; Ren, Z.; Nie, R. Analysis of drilling vibration characteristics of anchoring system in coal mine. Sci. Rep. 2023, 13, 19236. [Google Scholar] [CrossRef] [PubMed]
- Gao, J.; Li, S.; Wu, F.; Ma, L. Heat Transfer Model and Thermal Insulation Characteristics of Surrounding Rock of Thermal Insulation Roadway in a High-Temperature Mine. Sustainability 2023, 15, 12555. [Google Scholar] [CrossRef]
- Moridi, M.A.; Sharifzadeh, M.; Kawamura, Y.; Jang, H.D. Development of wireless sensor networks for underground communication and monitoring systems (the cases of underground mine environments). Tunn. Undergr. Space Technol. 2018, 73, 127–138. [Google Scholar] [CrossRef]
- Wu, Q.; Du, Z.; Zhao, Y.; Xu, H.; Zhang, X. Optimal location of water level sensors for monitoring mine water inrush based on the set covering model. Sci. Rep. 2021, 11, 2621. [Google Scholar] [CrossRef] [PubMed]
- Muduli, L.; Jana, P.K.; Mishra, D.P. Wireless sensor network based fire monitoring in underground coal mines: A fuzzy logic approach. Process Saf. Environ. Prot. 2018, 113, 435–447. [Google Scholar] [CrossRef]
- Zhang, Y.; Jiang, Y.; Wang, Z.; Yin, Q.; Chen, M. Anchorage effect of bolt on en-echelon fractures: A comparison between energy-absorbing bolt and conventional rigid bolt. Eng. Fail. Anal. 2022, 137, 106256. [Google Scholar] [CrossRef]
- Thirumal, G.; Kumar, C. Multilevel sensor deployment approach in IIoT-based environmental monitoring system in underground coal mines. Comput. Commun. 2022, 195, 1–13. [Google Scholar] [CrossRef]
- Ding, S.; Jing, H.; Chen, K.; Xu, G.; Meng, B. Stress evolution and support mechanism of a bolt anchored in a rock mass with a weak interlayer. Int. J. Min. Sci. Technol. 2017, 27, 573–580. [Google Scholar] [CrossRef]
- Cheng, Q.; Huang, G.; Li, Z.; Zheng, J.; Liang, Q. Effect of Coal Particle Breakage on Gas Desorption Rate during Coal and Gas Outburst. Appl. Sci. 2024, 14, 469. [Google Scholar] [CrossRef]
- Hu, S.; Li, Y.; Zhu, C.; Lin, B.; Li, Q.; Li, B.; Huang, Z. Investigating the Influence of Flue Gas Induced by Coal Spontaneous Combustion on Methane Explosion Risk. Fire 2024, 7, 105. [Google Scholar] [CrossRef]
- Farjow, W.; Raahemifar, K.; Fernando, X. Novel wireless channels characterization model for underground mines. Appl. Math. Model. 2015, 39, 5997–6007. [Google Scholar] [CrossRef]
- Hancke, G.P.; Silva, B.J. Wireless Positioning in Underground Mines: Challenges and Recent Advances. IEEE Ind. Electron. Mag. 2021, 15, 39–48. [Google Scholar] [CrossRef]
- Mishra, P.; Biancolillo, A.; Roger, J.M.; Marini, F.; Rutledge, D.N. New data preprocessing trends based on ensemble of multiple preprocessing techniques. TrAC Trends Anal. Chem. 2020, 132, 116045. [Google Scholar] [CrossRef]
- Bilalli, B.; Abelló, A.; Aluja-Banet, T.; Wrembel, R. Intelligent assistance for data pre-processing. Comput. Stand. Interfaces 2018, 57, 101–109. [Google Scholar] [CrossRef]
- Rahimnejad, A.; Gadsden, S.A.; Al-Shabi, M. Lattice Kalman Filters. IEEE Signal Process. Lett. 2021, 28, 1355–1359. [Google Scholar] [CrossRef]
- Kong, N.J.; Payne, J.J.; Council, G.; Johnson, A.M. The Salted Kalman Filter: Kalman filtering on hybrid dynamical systems. Automatica 2021, 131, 109752. [Google Scholar] [CrossRef]
- Li, J.; Wang, C.; Zhao, Y. A Long-Term Monitoring Method of Corrosion Damage of Prestressed Anchor Cable. Micromachines 2023, 14, 799. [Google Scholar] [CrossRef]


Disclaimer/Publisher’s Note: The statements, opinions and data contained in all publications are solely those of the individual author(s) and contributor(s) and not of MDPI and/or the editor(s). MDPI and/or the editor(s) disclaim responsibility for any injury to people or property resulting from any ideas, methods, instructions or products referred to in the content. |
© 2024 by the authors. Licensee MDPI, Basel, Switzerland. This article is an open access article distributed under the terms and conditions of the Creative Commons Attribution (CC BY) license (https://creativecommons.org/licenses/by/4.0/).