Article

Assessment of the Winding Mechanical Condition Based on Transformer Vibration during Transient Processes

by
Yao Yuan
1,
Jiafeng Zhao
2,
Kaixing Hong
3,
Ning Wang
2 and
Jing Zheng
2,*
1
Electric Power Research Institute of China Southern Grid, Guangzhou 510663, China
2
Department of Instrument Science and Engineering, Zhejiang University, Hangzhou 310027, China
3
College of Mechanical and Electrical Engineering, China Jiliang University, Hangzhou 310018, China
*
Author to whom correspondence should be addressed.
Electronics 2024, 13(13), 2519; https://doi.org/10.3390/electronics13132519
Submission received: 24 April 2024 / Revised: 20 June 2024 / Accepted: 25 June 2024 / Published: 27 June 2024

Abstract

This paper proposes an operation modal analysis (OMA)-based approach to obtain a transformer’s mechanical condition from vibrations during the transformer’s transient processes, such as short-circuit and power-off conditions. Such processes generate a short transient vibration response, which yields a spectrum with poor frequency resolution. Vibration before the transient process could be included to increase the signal length; however, this would introduce a forced vibration component into the spectrum, making it challenging to distinguish the modal frequencies. To overcome these problems, a time–frequency analysis-based algorithm is proposed to extract the modal frequency spectrum from the vibration signal with the high-frequency resolution, providing clearer insight into the mechanical condition of the transformer. A faulty-state indicator is then proposed based on the similarity between the extracted modal spectrum and the initial modal spectrum obtained under a healthy state. To validate the proposed method, laboratory experiments were conducted under short-circuit and power-off conditions. Two mechanical faults—the looseness of the winding clamping and winding deformation—are introduced. The results show that both faults will cause variations in the modal frequency spectrum, leading to significant decreases in the indicator value. In summary, the proposed method can effectively evaluate a transformer’s mechanical condition in an OMA setting.

1. Introduction

Statistics show that the fault in transformer windings is one of the most common causes of transformer failure [1]. Furthermore, mechanical deformations induced by electrodynamic forces constitute 70% of all winding faults [2]. Even minor deformations in the windings, such as displacement or loss of insulation pads, can lead to deterioration of mechanical performance, decreased insulation strength, and reduced short-circuit resistance [3], posing significant safety hazards. Therefore, it is essential to assess the mechanical condition of the windings during transformer operation.
Changes in the mechanical properties of the windings will ultimately affect their vibration response [4,5,6,7]. In early studies, researchers applied impact forces, such as mechanical shocks, to induce transient vibrations in a winding and extract the intrinsic frequencies [8,9]. Although these extracted frequencies accurately represent the mechanical state of the winding, the major drawback is that the transformer must be offline, making online measurements impossible.
For convenience, scholars have explored online winding fault diagnosis methods [10,11] using the transient vibration signals generated during normal operation conditions, such as the short-circuit condition and the switch-on/off condition. In the early stage of research, scholars found that winding deformation caused changes in the dynamic characteristics of transient vibrations aroused by a short-circuit impulse. Shao [12] and Wang [13] detected the deformation of a winding by calculating changes in the envelope of vibration amplitudes during multiple short-circuit impact tests. Later, more advanced signal-processing techniques were introduced into this field. Zhang et al. analyzed the time–frequency characteristics of transformer vibration signals during short-circuit impacts using the Morlet wavelet transform, concluding that an increase in the power frequency component and total energy in the time–frequency diagram indicates structural defects in the winding [14]. Lv utilized the short-time Fourier transform (STFT) as a method for obtaining the feature vectors necessary for winding deformation identification. Gao constructed a time–frequency matrix based on the Wigner-Ville Distribution (WVD) time–frequency analysis and then extracted the singular values of the matrix as key features to evaluate the degree of a winding’s mechanical state. The aforementioned methods provide different ways to process a transformer’s vibration signature under the short-circuit condition and characterize the potential changes in these signatures caused by mechanical faults. However, the relationship between changes in the vibration signature and the mechanical faults is still unclear.
Operation modal analysis (OMA) was developed to identify structural modal parameters based on (i) output-only data and (ii) real operating conditions [15]. It can provide parameters that are related to the properties of mechanical structures and are sensitive to structural changes. And it does not affect the normal operation of transformers. Therefore, it can enhance monitoring accuracy and efficiency. Based on OMA, some researchers tried to obtain the intrinsic modal spectrum directly from the transient vibrations under the short-circuit condition. Zhang and Lin [16] characterized the mechanical features by acquiring the frequency response function (FRF) of the winding’s vibration under a short-circuit impulse, and they utilized correlation analysis to determine the changes in FRFs caused by the winding’s deformation. However, a short-circuit impulse introduces forced vibration components, which directly influence the FRFs of the transient vibration during the impulse, making it difficult to separate the modal frequency components from the FRFs.
In addition to the short-circuit impact condition, there is also the power-off condition, which is much safer and more controllable. During the power-off process, the transformer goes off directly from the no-load condition while the winding’s vibration transitions from forced vibration to free vibration. This avoids the risk of damage to the windings due to the presence of the inrush current, making it possible to detect even slight changes in the mechanical properties of windings. Wang et al. used a time domain decomposition algorithm to calculate the first four modal intrinsic frequencies from vibrations during the switching-off process of a single-phase experimental transformer, and then they used these frequencies for detecting winding compression force loosening [17]. However, assessments based solely on the analysis of individual intrinsic frequencies might miss relevant information. A comprehensive analysis of the modal frequency spectrum is required. Hu [18] analyzed switching-off transient vibrations based on the basic power spectrum estimation method mentioned by Zhang and Lin [16]. Since different states show quite different modal spectrums, Hu [18] found it difficult to identify each mode and make comparisons for the purpose of loosening force detection. This happened mainly due to the short duration of the transient signal, which limited the frequency resolution of their algorithm for estimation. A supervised dimensionality reduction algorithm was used in this thesis for condition assessment. Although good results were obtained, the underlying physical mechanism cannot be clearly interpreted, and the whole detection algorithm lacks generalization capability. Considering the challenge of extracting modal frequencies, some researchers have also focused on extracting the damping ratio to characterize the state of the transformer. This parameter is derived from the vibration decay curves at the natural frequencies [19]. However, this parameter cannot be reliably extracted when the amplitudes of these frequency components are very small, indicating the need for improved robustness.
Consequently, several problems still need to be addressed before practical application of the vibration-based OMA technique:
(1)
Resolution Problem. The free vibration period is generally less than 0.1 s. The traditional OMA approach uses only the free vibration, which yields a spectrum with poor frequency resolution, making it challenging to identify the modal frequencies and evaluate the mechanical condition of the transformer.
(2)
Separation Problem. To overcome the resolution problem, some researchers have used the whole vibration signal instead. However, this vibration signal includes forced and modal vibration components, making it challenging to separate the modal frequencies from the other frequencies [15].
(3)
Generalization Capability Problem. An in-service power transformer is generally subjected to various transient operation conditions. An OMA approach that could be used under different operation conditions would be highly valuable since it could serve different maintenance purposes, including condition evaluation after strong short-circuit impacts and daily maintenance that could be conducted during the power-off condition. Therefore, the generalization capability of the OMA method is important. Unfortunately, all methods proposed in published works have been designed for a particular operation condition, and their generalization capabilities have been tested very rarely.
To solve these problems, the present paper investigates the transient vibration mechanism of transformers and proposes an OMA-based winding mechanical condition assessment approach, which can be used to detect both the looseness and deformation of the winding. First, in Section 2, a transient vibration model of the winding is established. In Section 3, instead of the short-duration free vibration response, the vibration before and during a transient process is used for analysis to improve the frequency resolution. Additionally, the time–frequency domain characteristics of the vibration signature are studied. A time-frequency analysis-based algorithm is proposed to separate the free vibration component. The algorithm is used to separate the modal frequency spectrum from the transient vibration and identify the condition of the transformer by comparing estimated modal spectrums. Finally, to validate the efficiency and generalization capability of the proposed method, experiments under different mechanical and operating conditions are conducted in Section 4. In summary, this paper presents a method for quickly assessing the mechanical condition of a transformer during daily operation.

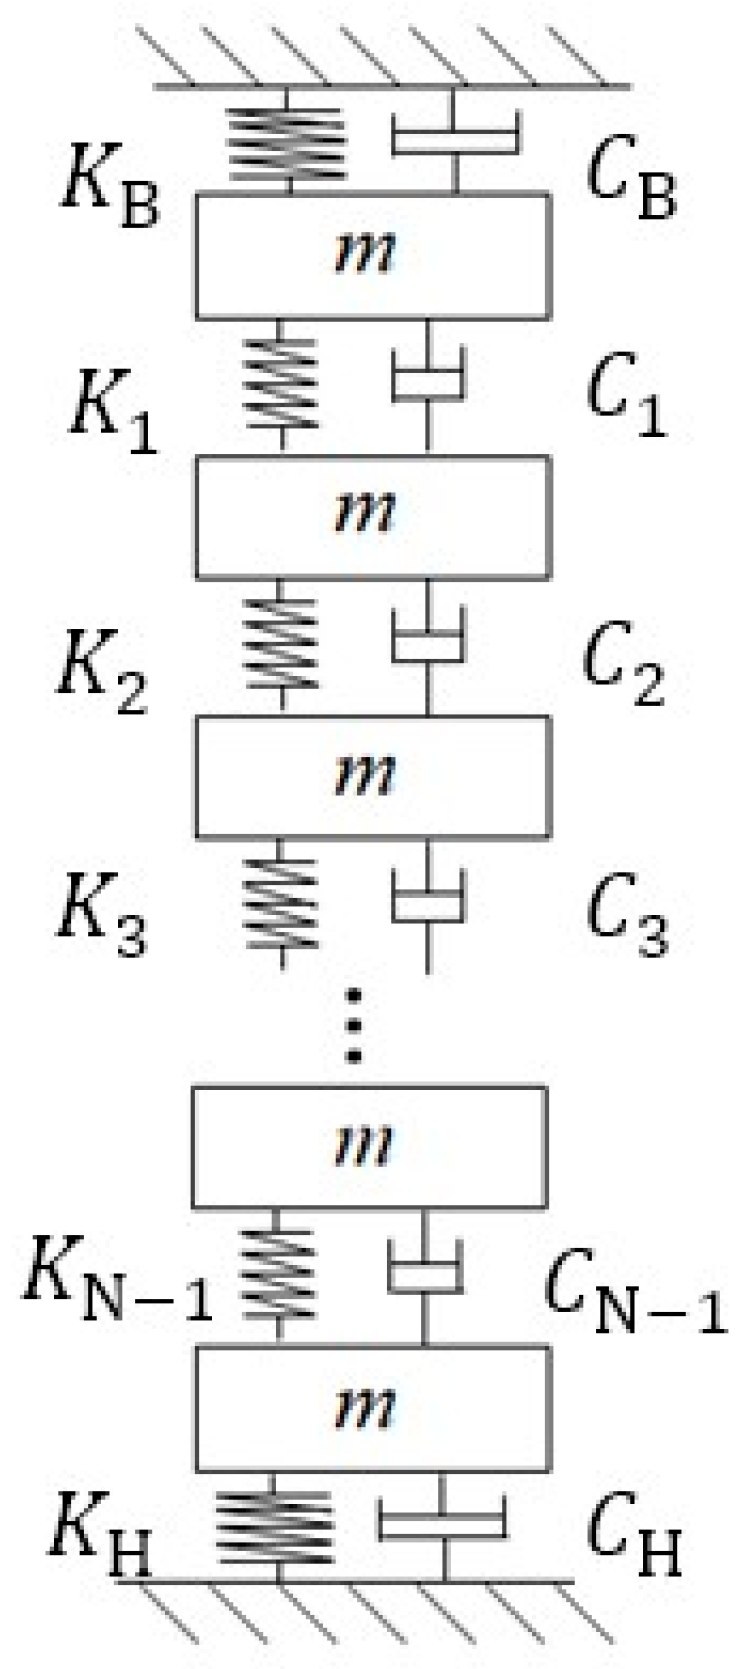
2. Vibration Model during Transient Process

It is common to use a “spring-mass-damper” model to describe the axial dynamic properties of a winding. As illustrated in Figure 1, the mass block corresponds to the mass matrix of the entire winding, while the spring stiffness K and damping C , respectively, represent the equivalent stiffness matrix and damping matrix between the winding insulation paper and insulation spacers. K B and K H are the equivalent stiffnesses of the insulating material of the top and bottom clamps of the winding, respectively, while C B and C H are the corresponding equivalent damping.
The vibration equation before the cut-off of the applied electromagnetic force f ( t ) can be written as follows [20]:
M d 2 z ( t ) d t 2 + C d z ( t ) d t + K z ( t ) = f ( t ) + m g
where z , f , and m g represent the displacement column vector, applied electromagnetic force column vector, and gravity column vector respectively. The electromagnetic force on the i-th coil can be represented as:
f i t = A i I 2 ( 1 c o s ( 2 ω 0 t + 2 γ ) )
where I , ω 0 , and γ represent the effective value, frequency, and phase angle of the current, respectively, and A i is the scaling coefficient corresponding to the i-th coil [21]. Therefore, the force vibration is dominated by the 2 ω 0 component.
After the force is withdrawn, the vibration equation can be rewritten as:
M d 2 z ( t ) d t 2 + C d z ( t ) d t + K z ( t ) = 0
The free vibration response of the mechanical system can be represented as a superposition of modal vibrations. In this paper, the Rayleigh damping type is used to obtain a simplified mathematical model, and the damping matrix is a linear combination of the mass and stiffness matrices [19]:
C = α M + β K
where α and β are the mass and stiffness proportional damping coefficients. This allows the decoupling of the differential equations. Assuming the particular solution of the free response as:
z = φ e j ω t
where φ is the amplitude column vector of free response, and ω is the natural frequency of the system. Therefore, the free vibration equation can be represented as:
( ω 2 M + ω α M + β K + K ) φ = 0
And the free vibration equation can be solved as an eigenvalue problem [22]. Define y i ( i = 1,2 , , N ) as the modal coordinate of z in the modal coordinate system. Therefore, the relationship between the physical coordinate system and the modal coordinate system can be represented as:
z = i = 1 N φ i y i = Φ y
where Φ is the modal matrix composed of φ i i = 1,2 , , N , and y is modal coordinate column vector composed of y i i = 1,2 , , N .
The free response in the modal coordinate system can be represented as:
y i ( t ) = Y i sin ( ω i t + θ i )
where ω i is the i-th order natural frequency of the system, and Y i represents the amplitude of the i-th order vibration mode. Additionally:
Y i = y 0 i 2 + y ˙ 0 i ω i 2 θ i = arctan ω i y 0 i y ˙ 0 i
where y ˙ 0 i and y 0 i represent the initial velocity and displacement. Thus, the free vibration response can be expressed as:
z f r e e ( t ) = i = 1 N φ i Y i sin ( ω i t + θ i )
Assuming that the mass, stiffness, and damping of each layer of windings and spacers are approximately equal, the following can be derived:
ω i k m , i = 1,2 , , N
From the above equations, changes in stiffness k due to defects in the winding will directly affect each natural frequency ω i . This indicates that the absolute shifts of frequency at higher modes will be much more significant. When mechanical defects are introduced, the stiffness k changes, leading to the shift of modal frequencies in the transient vibrations during the winding power-off process. Hence, it can be concluded that the modal information of the vibration system can theoretically reflect the mechanical condition of the winding.

3. Transient Vibration Modal Spectrum Recognition Method for Transformers

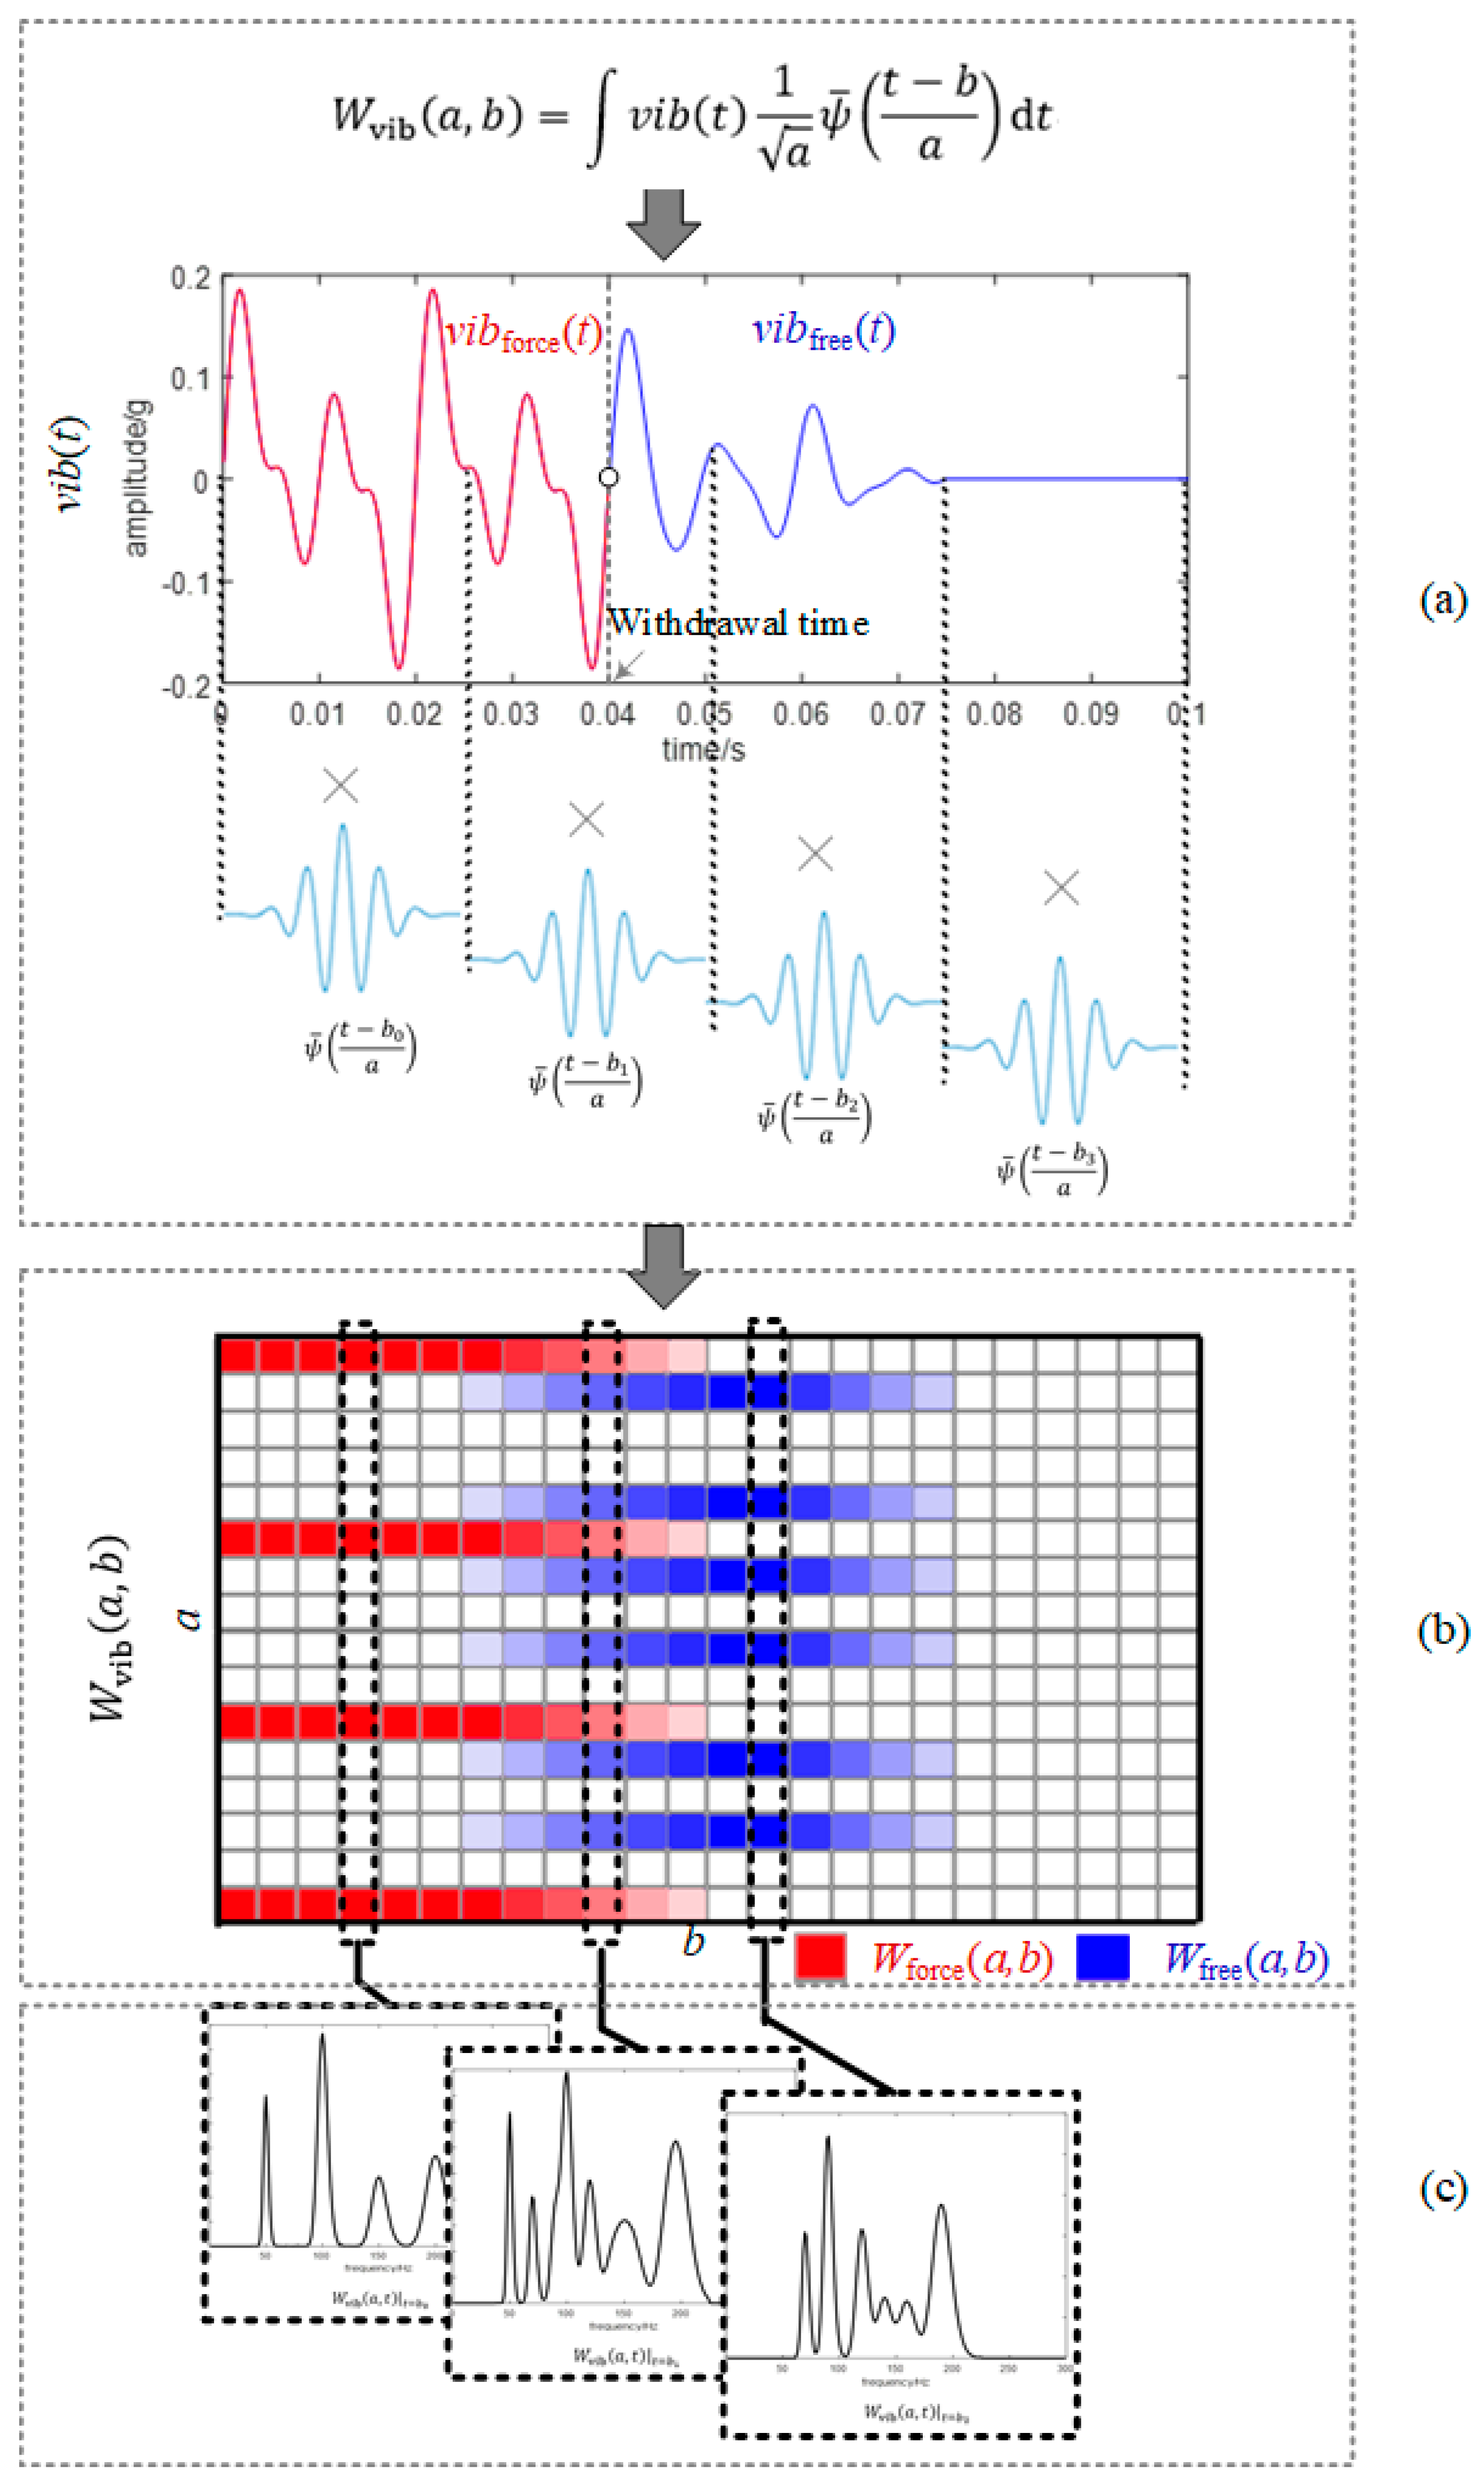
3.1. Time–Frequency Domain Characteristics of Vibration Signature

To solve the problem of insufficient time resolution, the vibration v i b t before and during a transient process is used for analysis instead of the short-duration free vibration response. The vibration v i b t can be expressed as:
v i b t = v i b f o r c e t , 0 t t o f f v i b f r e e t , t o f f < t t e n d
where t o f f represents the instant in time when the applied force is withdrawn, t e n d represents the cut-off time of the vibration response, and v i b f o r c e t and v i b f r e e t are the forced vibration response and the free vibration response, respectively, as shown in Figure 2a.
The frequency spectrum can obtain various frequency components and their contents contained in the signal while ignoring the time information. However, for non-stationary signals, frequency content often varies with time. Wavelet analysis has the advantage of providing the time localization of the various frequency components. The continuous wavelet transform (CWT) [23]   W v i b a , b of the vibration signal v i b t , which is made on the basis mother wavelet ψ ( t ) , is established in accordance with the following equation:
W v i b a , b = v i b t 1 a ψ ¯ t b a d t
where ψ ( t ) is a basis complex Morlet wavelet, and a and b are the scale factor and translation factor of the wavelet function, respectively. The scale factor a decides the time–frequency local resolution of the CWT, which is separately determined by the bandwidth Δ ω ψ and duration Δ t ψ of the basic wavelet: Δ t = a Δ t ψ , Δ ω = Δ ω ψ / a .
In other words, wavelet analysis of a signal is performed by scaling and shifting the basis of the mother wavelet function along with time to produce coefficients that are assigned to different frequency components [24], as shown in Figure 2a,b. Additionally, W v i b a , b b = t can be regarded as the frequency spectrum at the moment of time t , as shown in Figure 2c.

3.2. Identification of Modal Frequencies Based on the Time–Frequency Domain Characteristics

The key problem in an OMA method is identifying modal frequencies from the output-only data. Obviously, the instantaneous frequency spectrum W v i b a , b b = t changes with time. In the beginning, the instantaneous frequency spectrum is identical to that of v i b f o r c e t . At the second stage, due to the duration of the basic wavelet, both v i b f o r c e t and v i b f r e e t contribute to the wavelet coefficients around the withdrawal time (see Figure 2b). The wavelet coefficients W v i b a , b within that range can be regarded as combinations of W f o r c e a , b and W f r e e a , b , where W f o r c e a , b = v i b f o r c e t 1 a ψ ¯ t b a d t and W f r e e a , b = v i b f r e e t 1 a ψ ¯ t b a d t . As a result, in those sections where both components are present, the instantaneous spectrum is composed of the frequency components from both v i b f o r c e t and v i b f r e e t . At the last stage, the instantaneous frequency spectrum is only contributed by v i b f r e e t , and a quick attenuation of the frequency components occurs at this stage.
We consider the instantaneous frequency spectrum W v i b a , b b = 0 at the beginning of time as the forced vibration spectrum. To identify different stages, we take the normalized inner product between W v i b a , b b = 0 and W v i b a , b b = t ,   t [ 0 , t e n d ] to produce a similarity coefficient in accordance with the equation:
s i m ( t ) = W f o r c e a , b b = 0 W v i b a , b b = t W f o r c e a , b b = 0 W v i b a , b b = t , t [ 0 , t e n d ]
At the first stage, the instantaneous frequency spectrum is only contributed by the forced vibration, and the similarity coefficient equals one. In the second stage, since the forced vibration and the free vibration can be considered as two signals with different frequencies and orthogonal to each other, the similarity coefficient decreases. When the forced vibration component is zero, this coefficient drops to zero as well. As a result, a turning point at time point t m i n can be detected as the moment when the forced vibration components have disappeared, with the modal frequency components having the highest proportion. Then, the normalized instantaneous frequency spectrum at this time point can be considered as the normalized modal spectrum m f ω :
m f ω = W v i b ω , t t = t m i n m f
where t = k Δ t = a Δ t ψ , ω = l Δ ω = Δ ω ψ / a , k , l N , and m f is the L1-norm of the modal spectrum.
To evaluate the health condition of the transformer, a measure of similarity between the estimated modal spectrum m f ω and the initial modal spectrum m f 0 ω obtained under a healthy state is defined as:
δ = c o v m f ω , m f 0 ω σ m σ m 0
where σ m and σ m 0 denote the standard deviations of m f ω and m f 0 ω , respectively. A threshold exists that induces a structural defect when the value of the similarity coefficient is smaller than the given threshold.

3.3. A Vibration-Based OMA Approach for Transformer Condition Assessment

A new algorithm is proposed to obtain more accurate solutions in an OMA setting. The process of the algorithm is shown in Figure 3, and the detailed steps are described as follows:
  • Step 1: Collect transformer vibration v i b ( t ) before and after a transient operation.
  • Step 2: Compute the CWT W v i b a , b of the transformer’s vibration signal v i b ( t ) .
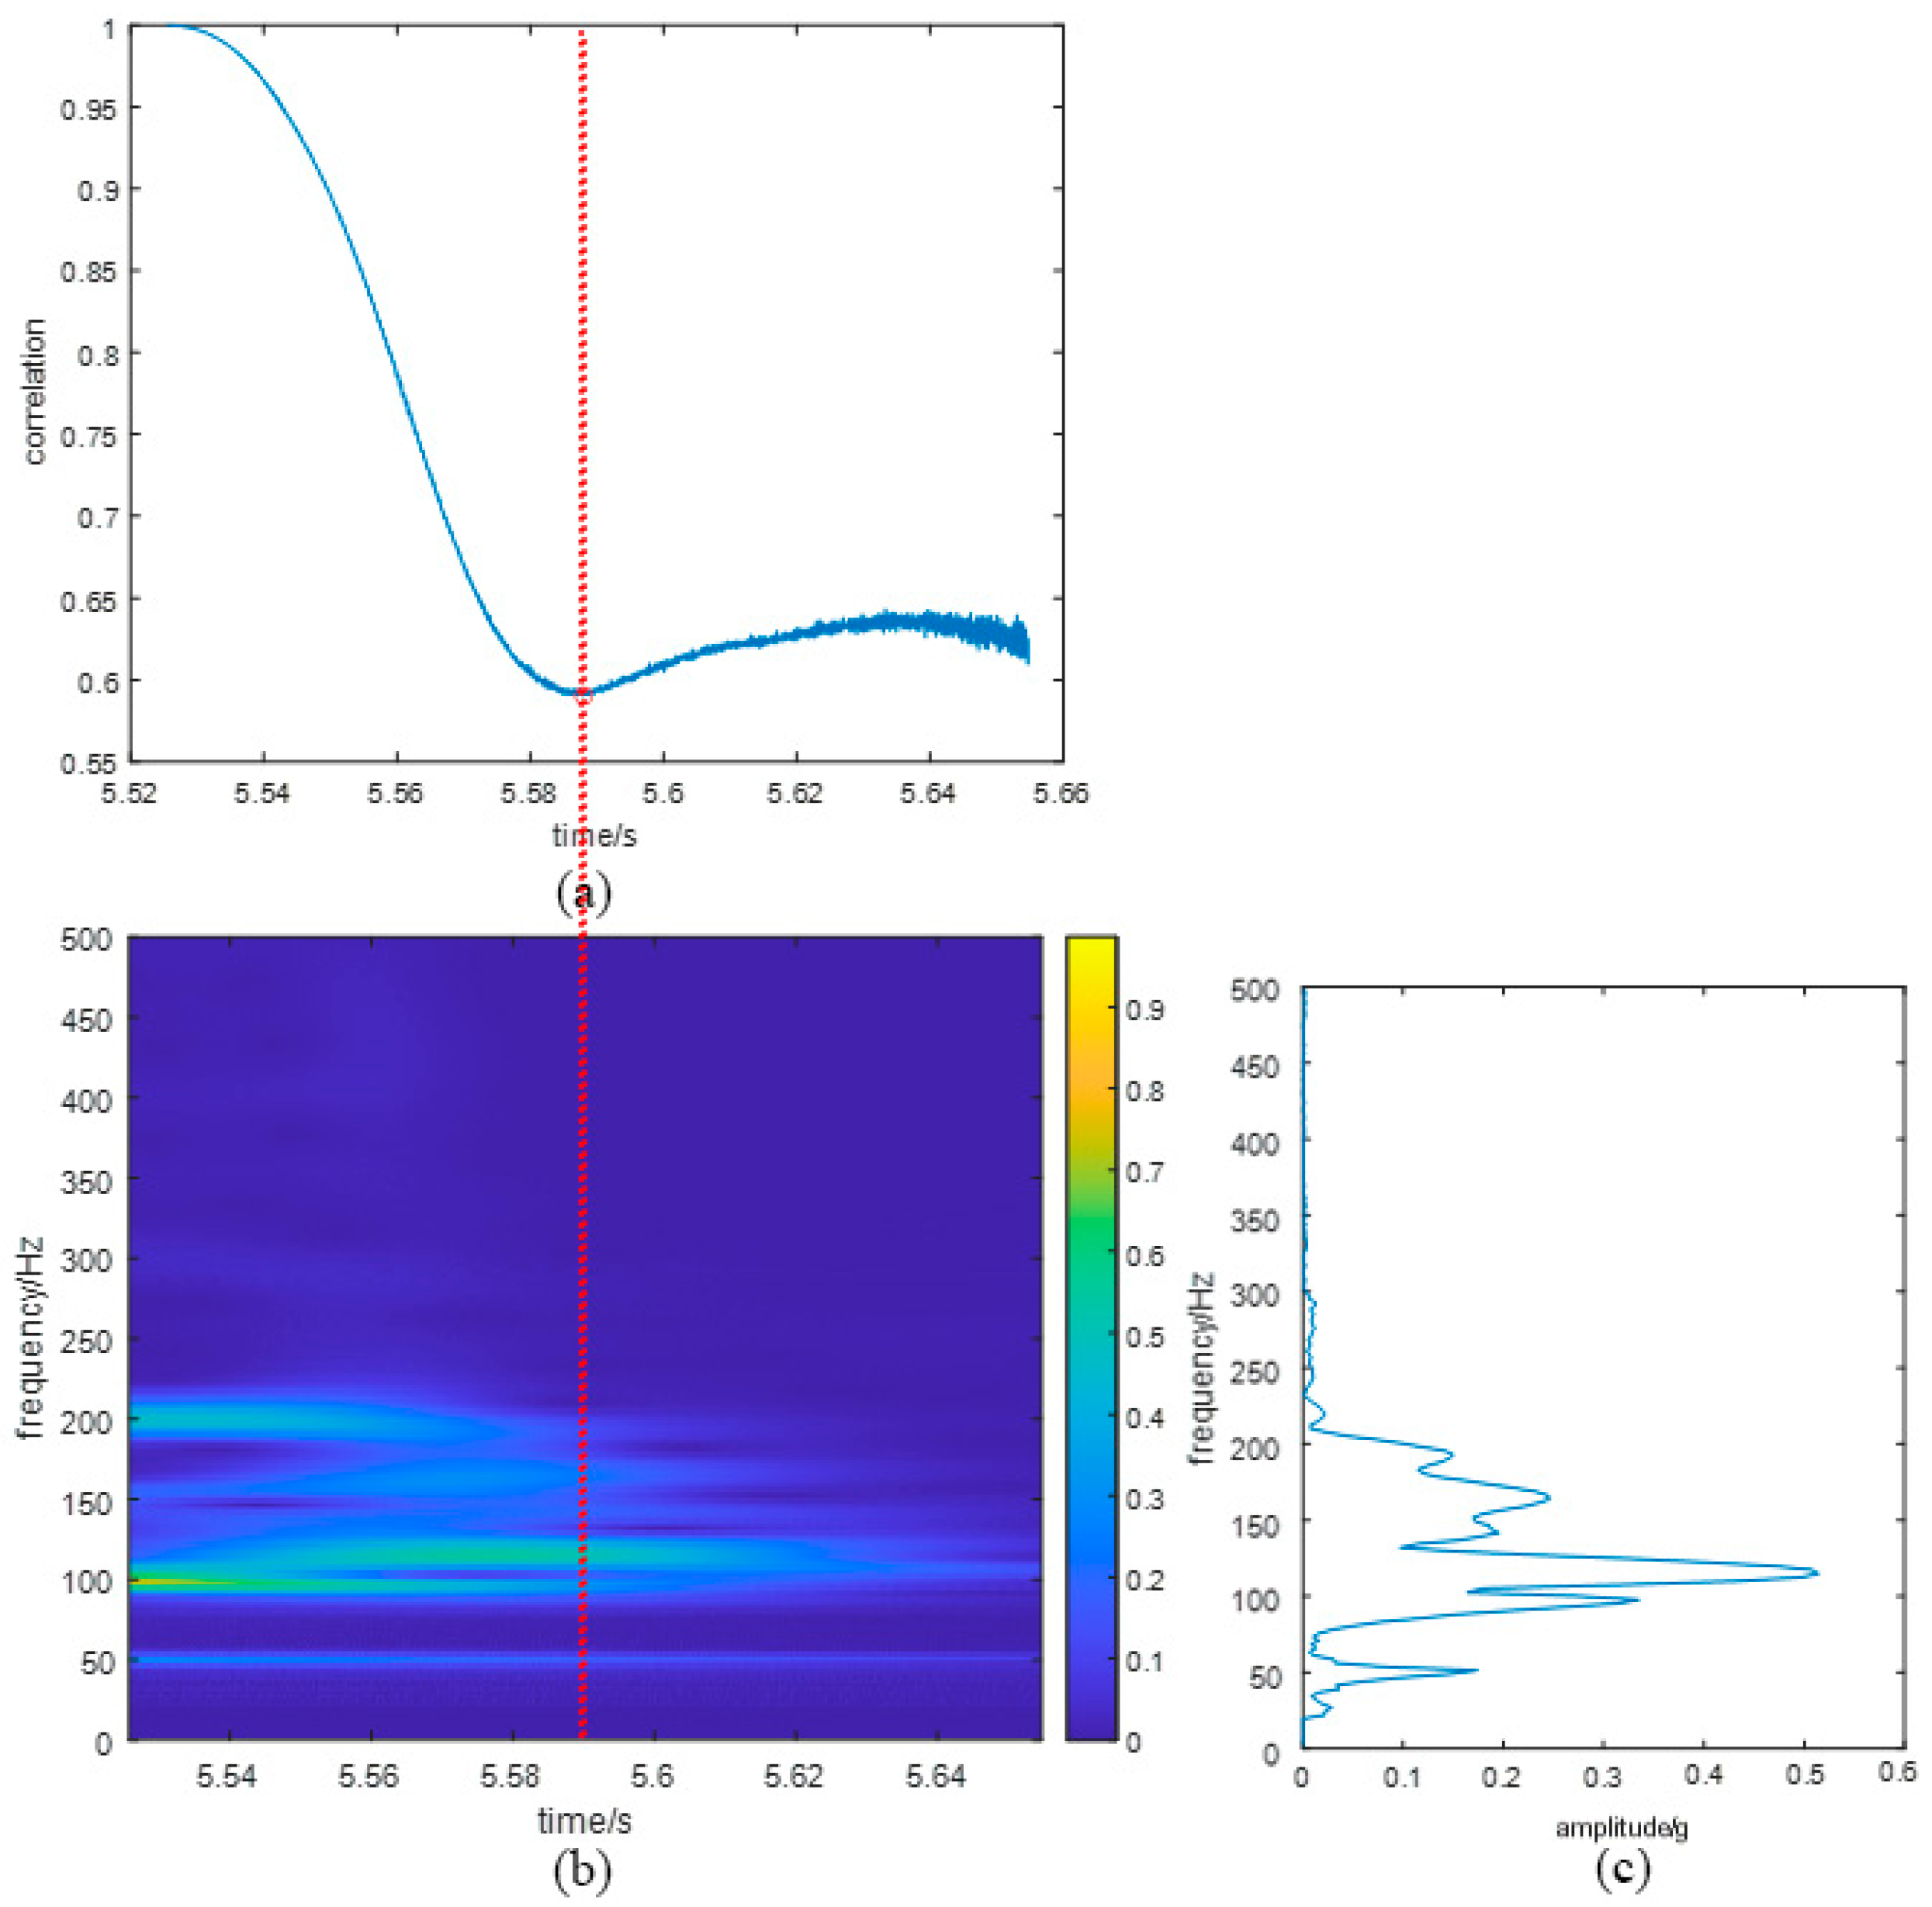
  • Step 3: Calculate the similarity coefficient as a function of time based on Equation (14).
  • Step 4: Determine the time point t m i n by selecting a minimum value at the turning point of s i m ( t ) . Regard t m i n as the moment when the modal frequency components have the highest proportion.
  • Step 5: Extract the instantaneous frequency spectrum at this time point as the modal spectrum.
  • Step 6: Calculate a measure of similarity between the estimated modal spectrum m f ω and the initial modal spectrum m f 0 ω obtained under a healthy state.
  • Step 7: Determine the condition of the transformer using that proposed indicator.

4. Case Study

4.1. Case 1: Winding Looseness Assessment under Power-Off Condition

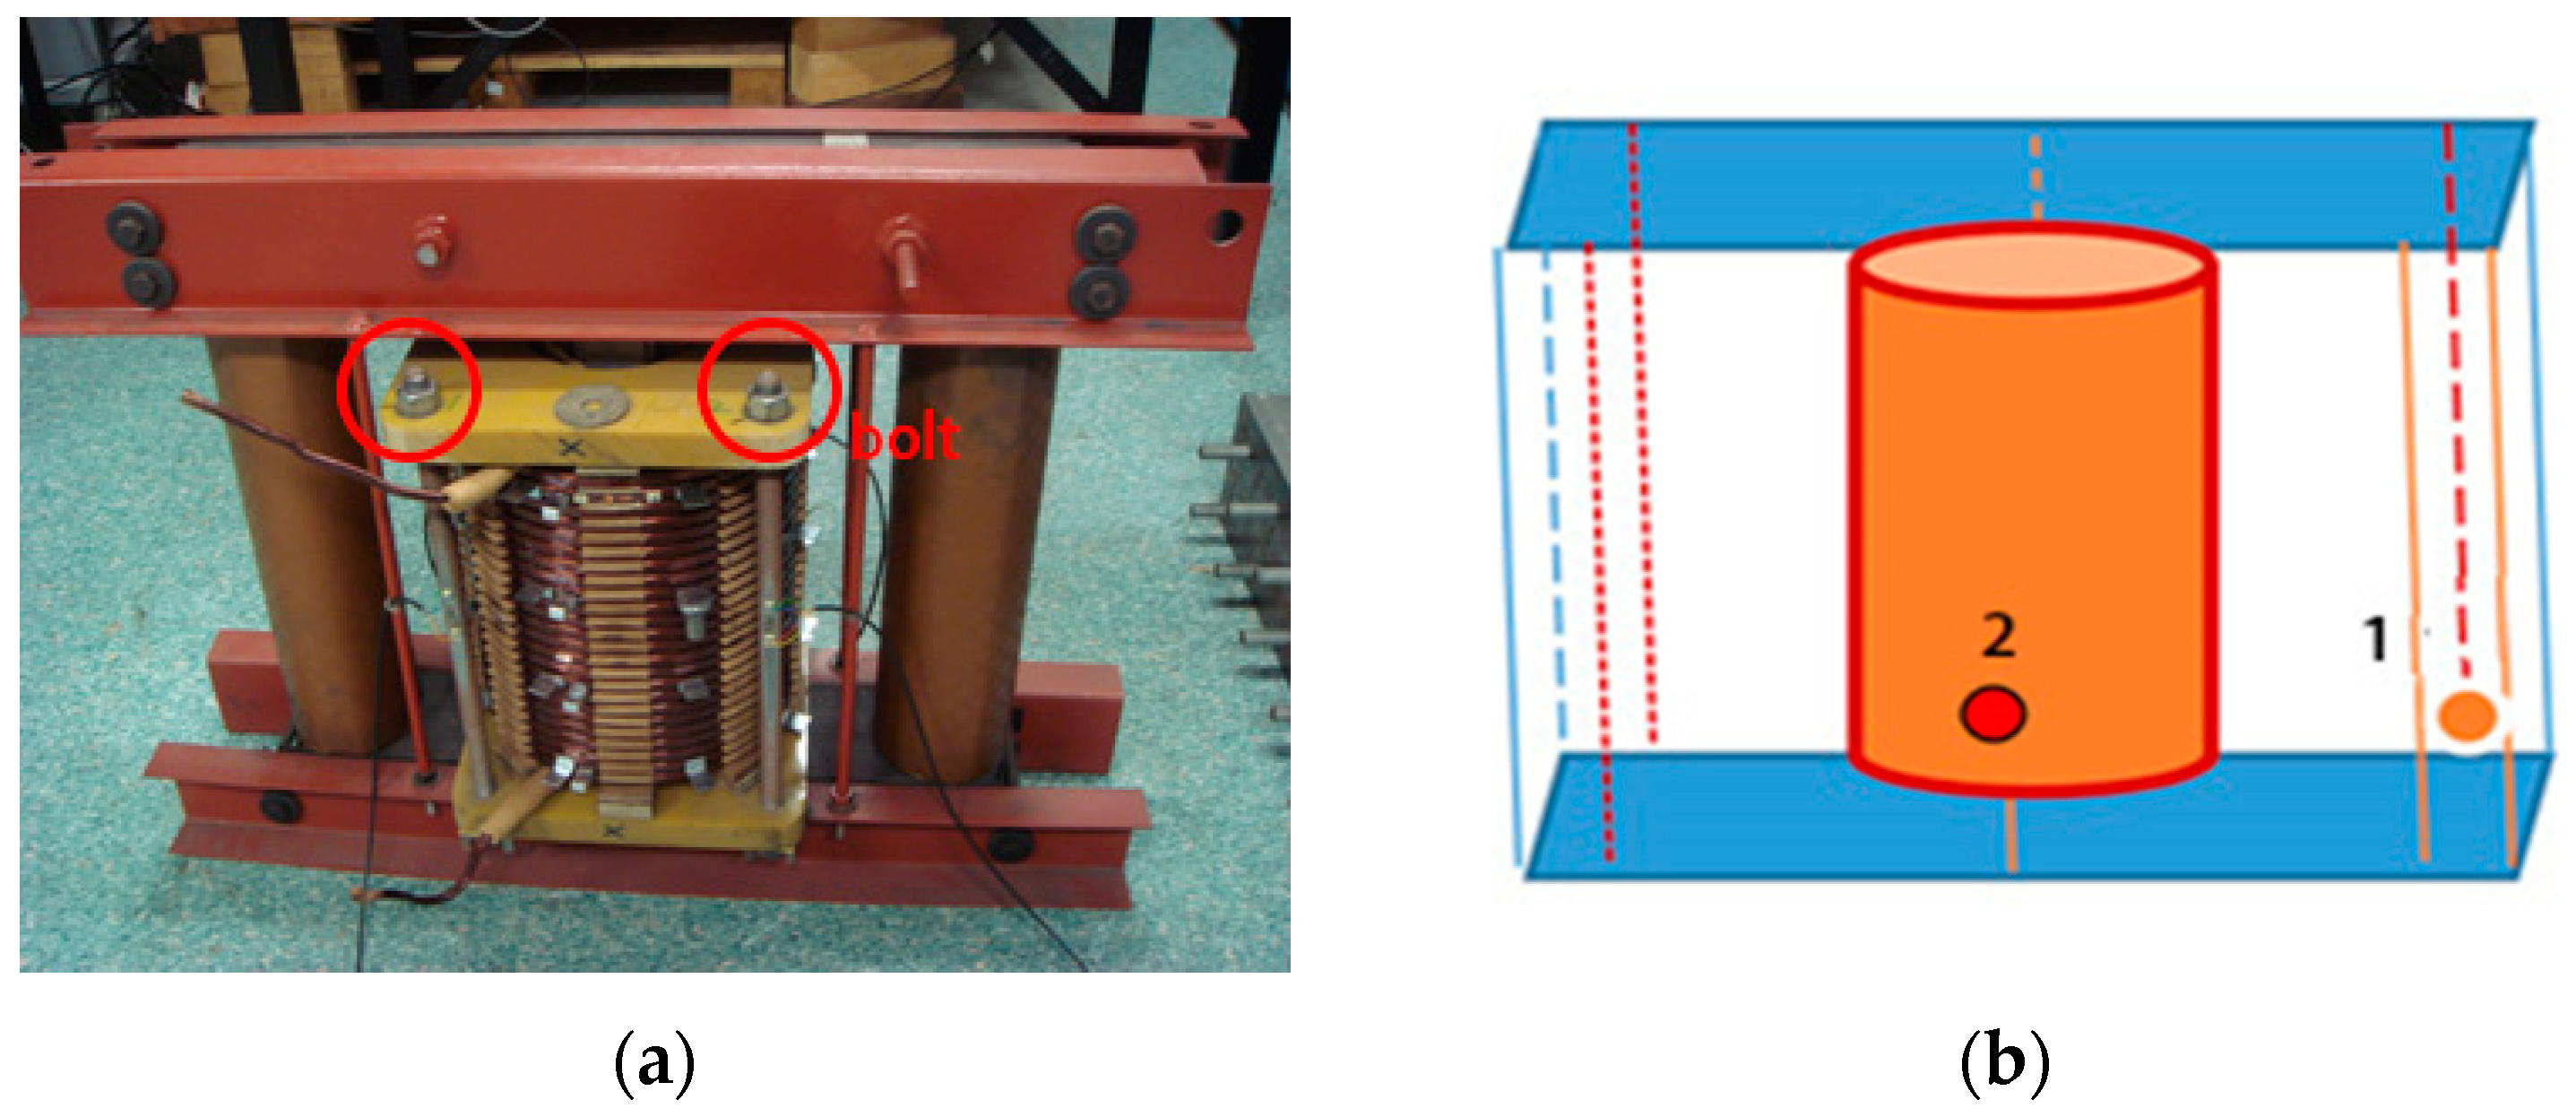
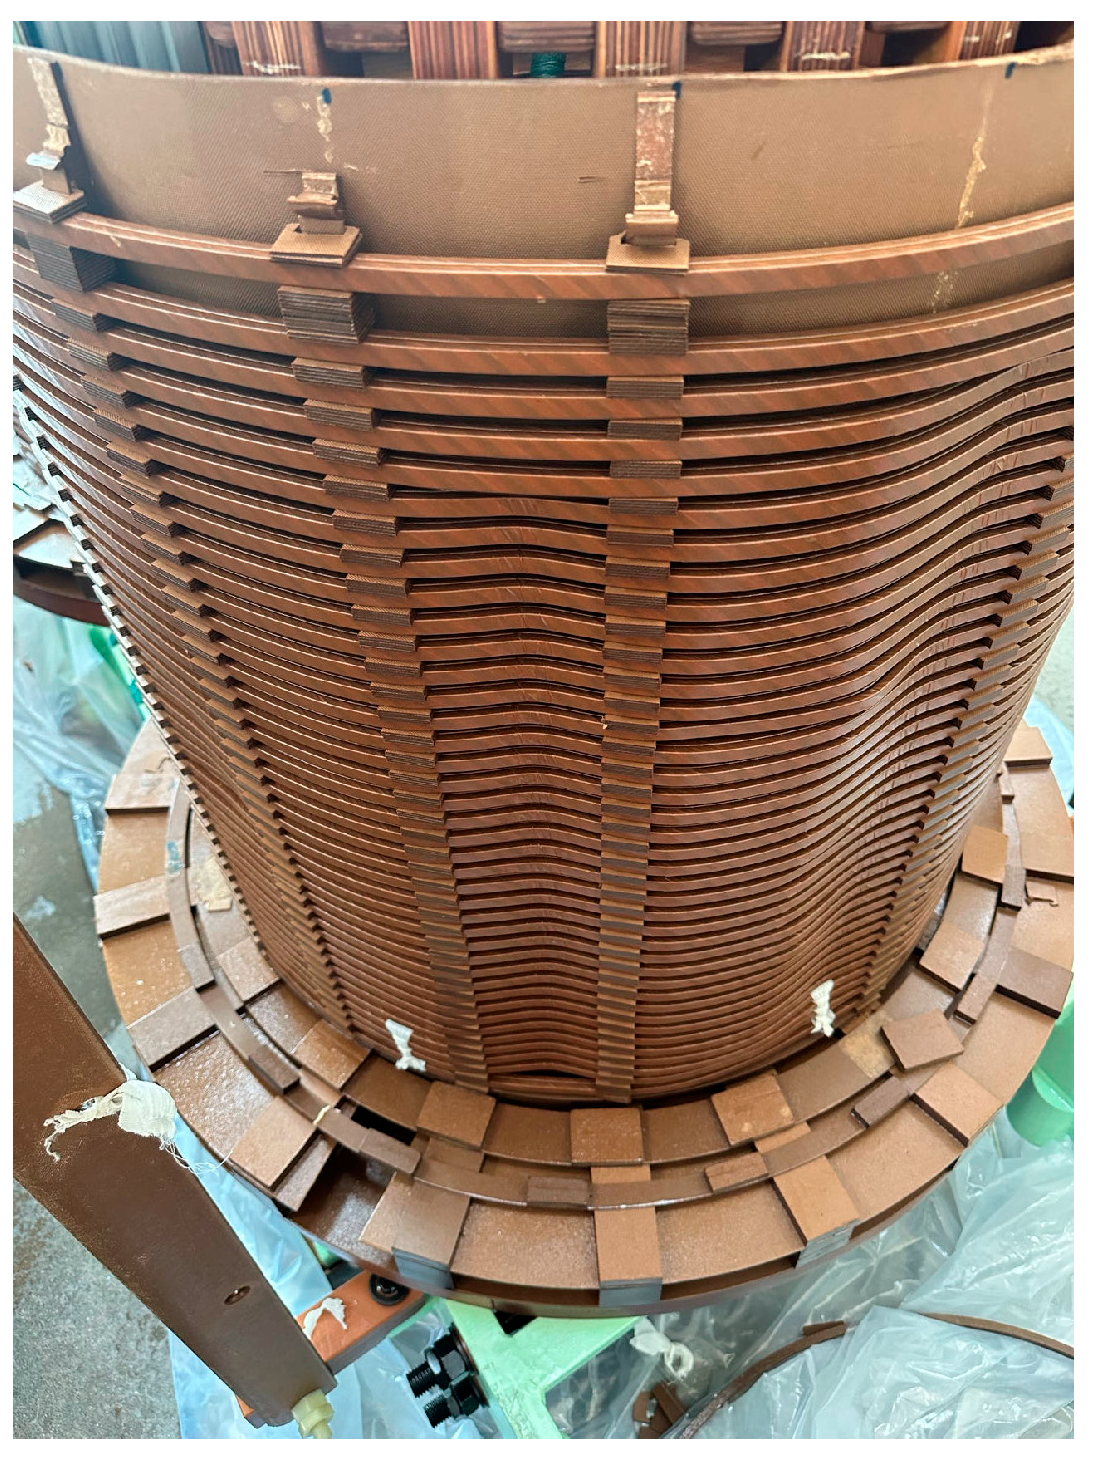
4.1.1. Experimental Setup

To verify the effectiveness of the proposed method in assessing the mechanical structural condition of transformers under the power-off condition, an experiment is conducted on a 10 kVA single-phase experimental transformer, as shown in Figure 4a. The experimental transformer consists of a winding and a single-phase three-limb core, with a voltage ratio of 415 V/240 V. The measurement system uses a sampling frequency of 20,000 Hz to ensure the validity of the measurements. Integrated-circuit piezoelectric accelerometers, each with a sensitivity of 500 mV/g, are used to measure the vibration signatures. Two accelerometers are used to collect the vibration signatures on the core and winding, as shown in Figure 4b. Zheng [25] concluded that the measurement points at the bottom of the transformer are more sensitive to the loosening of the winding clamping force. Therefore, we located the accelerometers on the bottom of the transformer. Accelerometer #1 is located on the limb of the core, and accelerometer #2 is located on the winding.
The winding clamping pressure is created by tightening the four winding clamping bolts, as shown in Figure 4a. Loosening the bolted joints on the winding decreases the clamping force under the bolt heads and, correspondingly, introduces potential mechanical defects into the winding. State 0 to State 6 correspond to the winding vibration with slackened clamping bolts on the winding. The clamping bolts are designed to be loosened (counter-clockwise/left) by the number of turns loosened for each state, as shown in Table 1.

4.1.2. Results

The transformer remains in the unload condition before power-off. The vibrations before and after the power-off operation are measured for a total duration of 7.5 s, and the switching-off operation occurs at 6 ± 0.5 s. The collected vibration signal at measurement point #1 under State 1 is shown in Figure 5. During the unload stage, the transformer vibration is steady and mainly contributed by the core vibration, whereas the vibration after the cut-off of voltage (occurred at 5.56 s) is characterized by a non-stationary and transient process.
Figure 6 shows the wavelet time–frequency spectrum of the collected vibration (measurement point #1, State 1) from the unload condition to after the power-off operation. From the spectrum in Figure 6a, it can be observed that during the unload stage, the transformer vibration is dominated by the 100 × n   ( n = 1,2 , ) Hz components, particularly the 100 Hz component. The 50 Hz component is generated by the interaction between the residual magnetic field that cannot be eliminated in the magnetic field and the current. The time–frequency spectrum of the transient vibration during the power-off stage is intercepted, as shown in Figure 6b. According to the figure, the steady-state vibration components ( 100 × n   ( n = 1,2 , ) Hz) gradually attenuate but remain dominant before 5.6 s, and the transient vibration components (around 115 Hz and 160 Hz) reach their peaks between 5.6 s and 5.63 s.
Figure 7a illustrates the similarity curve calculated based on Equation (14). Due to the duration of the basic wavelet, both steady-state vibration and the modal frequency components contribute to the wavelet coefficients around the switch-off time. This combination caused by the continuous wavelet transform algorithm led to the decrease of the similarity coefficient even before the withdrawal moment of 5.56 s. The local minimum of the similarity curve is then identified as a turning point where the steady-state vibration components have significantly attenuated, and the modal frequency components significantly increase. Therefore, the location of the turning point can be considered as the optimal time point for extracting the modal frequency spectrum. The instantaneous frequency spectrum m f ω at the optimal time point is then extracted from the time–frequency distribution (Figure 7b), as shown in Figure 7c.
The extracted modal frequency spectrum of the vibration signal at measurement point #1 under State 1 is shown in Figure 8a. The energy is primarily distributed between 50 Hz and 300 Hz. All peaks in the spectrum are marked by red circles. Peaks around 50 × n   ( n = 1,2 , ) Hz components, such as those at 51 Hz, are considered to be the leftovers of the steady vibration components. The other marked frequencies are considered to be the modal frequencies, which will be utilized in further analysis. Figure 8b shows the modal frequency spectrum of measurement point #1 under State 1 obtained using the traditional spectral analysis method. Compared with the spectrum in Figure 8a, details in the spectrum in Figure 8b are lost because of the limited frequency resolution, making it difficult to detect changes in the spectrum varying with clamping force. Consequently, it is challenging to assess the looseness of the winding based on the traditional method [16].
Figure 9a illustrates the modal frequency spectrums of measurement point #1 under different clamping states. It is obvious that the peak locations in the extracted spectrums vary with the clamping force states, especially in the frequency range of 140–200 Hz (bounded by dotted lines). Figure 9b replots the frequency responses within the frequency range of 140–200 Hz and offsets the responses by 0.1 to ensure clarity in comparison. As shown, modal frequencies are observed at 166 Hz and 195 Hz in the initial state. As the clamping force loosens, these frequencies gradually shift toward lower frequencies, reaching approximately 146 Hz and 172 Hz, respectively.
To investigate the influence of clamping force on the modal frequencies, the main modal frequencies are identified and extracted from the modal spectrum, as plotted in Figure 9c for different clamping states. The frequencies mentioned above are connected in Figure 9c to clearly show the decrease of the frequencies. Besides these frequencies, the modal frequency around 140 Hz, present in States 1 and 2, disappears after State 3. Additionally, frequencies around 95 Hz and 120 Hz are relatively close in States 1 and 2, compared with those in subsequent tests. This observation clearly supports the idea that the entire spectrum distribution should be included in condition assessment instead of calculating the decrease of individual modal frequencies.
A comparison of the similarity coefficients between the estimated modal spectrums at measurement point #1 under different clamping forces and the initial modal spectrum is plotted in Figure 9d. The similarity coefficient decreases as the clamping force decreases. Thus, this is a good approach for detecting and identifying clamping force looseness in the windings.
Figure 10a illustrates the modal frequency spectrums of measurement point #2 under different clamping states. The energy is primarily distributed between 20 Hz and 150 Hz. Significant changes in the peak locations around 120 Hz (bounded by dotted lines) can be observed as the clamping force varies. The offset frequency responses around 120 Hz are replotted in Figure 10b. As illustrated, a modal frequency is observed at 127 Hz in the initial state. As the clamping force decreases, this modal frequency gradually shifts toward lower frequencies, reaching around 115 Hz. The main modal frequencies are identified and extracted from the modal spectrum, as plotted in Figure 10c for different clamping states. Besides the decrease of the frequency mentioned above, the other modal frequencies undergo a slight variation with changes of clamping force. It seems that higher modal frequencies are much more sensitive to the looseness of the winding clamping force. A comparison of the similarity coefficients between the estimated modal spectrums at measurement point #2 under different clamping forces and the initial modal spectrum is plotted in Figure 10d. For the early stages (States 0 to 3), the similarity coefficient significantly drops with the decrease in clamping force. However, in the following stages, with the four clamping bolts loosened by more than 1/2 turn, the similarity coefficient fluctuates.
To compare the proposed indicator with other related diagnostic indicators, the similarity coefficients and the damping ratios proposed by Hong [19] at measurement points #1 (a) and #2 (b) under different clamping forces are plotted in Figure 11. Although the damping ratio at measurement point #1 gradually increases as the clamping force decreases, the change in the damping ratio at measurement point #2 does not reflect the change in clamping force. Furthermore, the damping ratio of state 4 cannot be extracted due to robustness problems. Therefore, compared with the damping ratio, the proposed indicator demonstrates better sensitivity, accuracy, and robustness in detecting looseness in winding clamping force.

4.1.3. Discussion

In Case 1, the proposed method is used to detect the winding clamping force looseness of a transformer under the power-off condition. The findings are as follows:
(1)
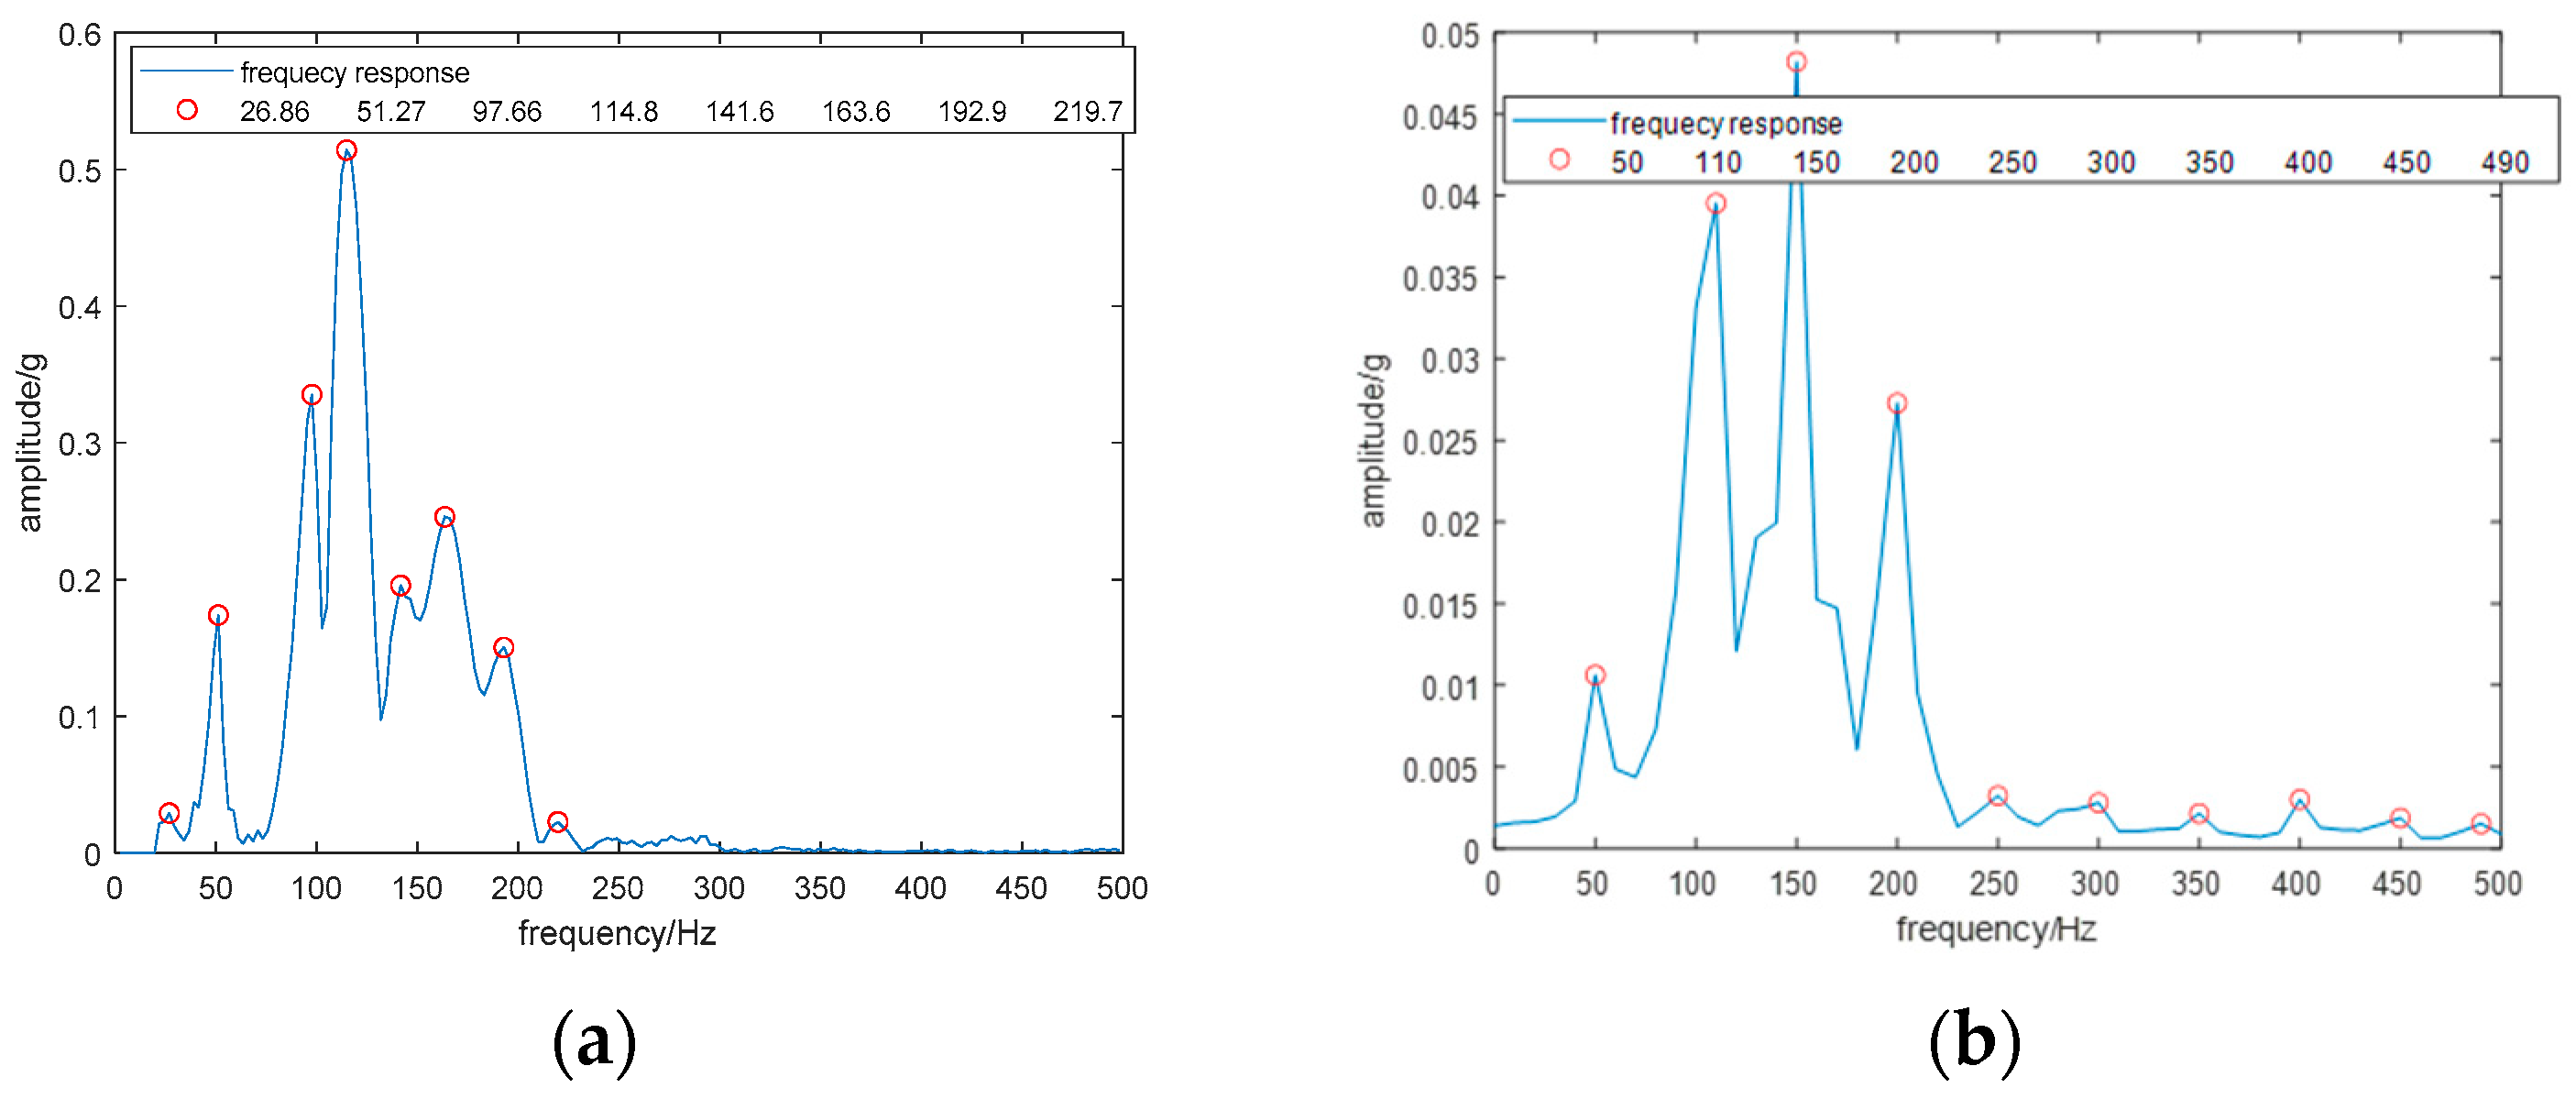
The proposed algorithm is proven to be able to extract the modal frequency spectrum from the vibration signal with high-frequency resolution.
(2)
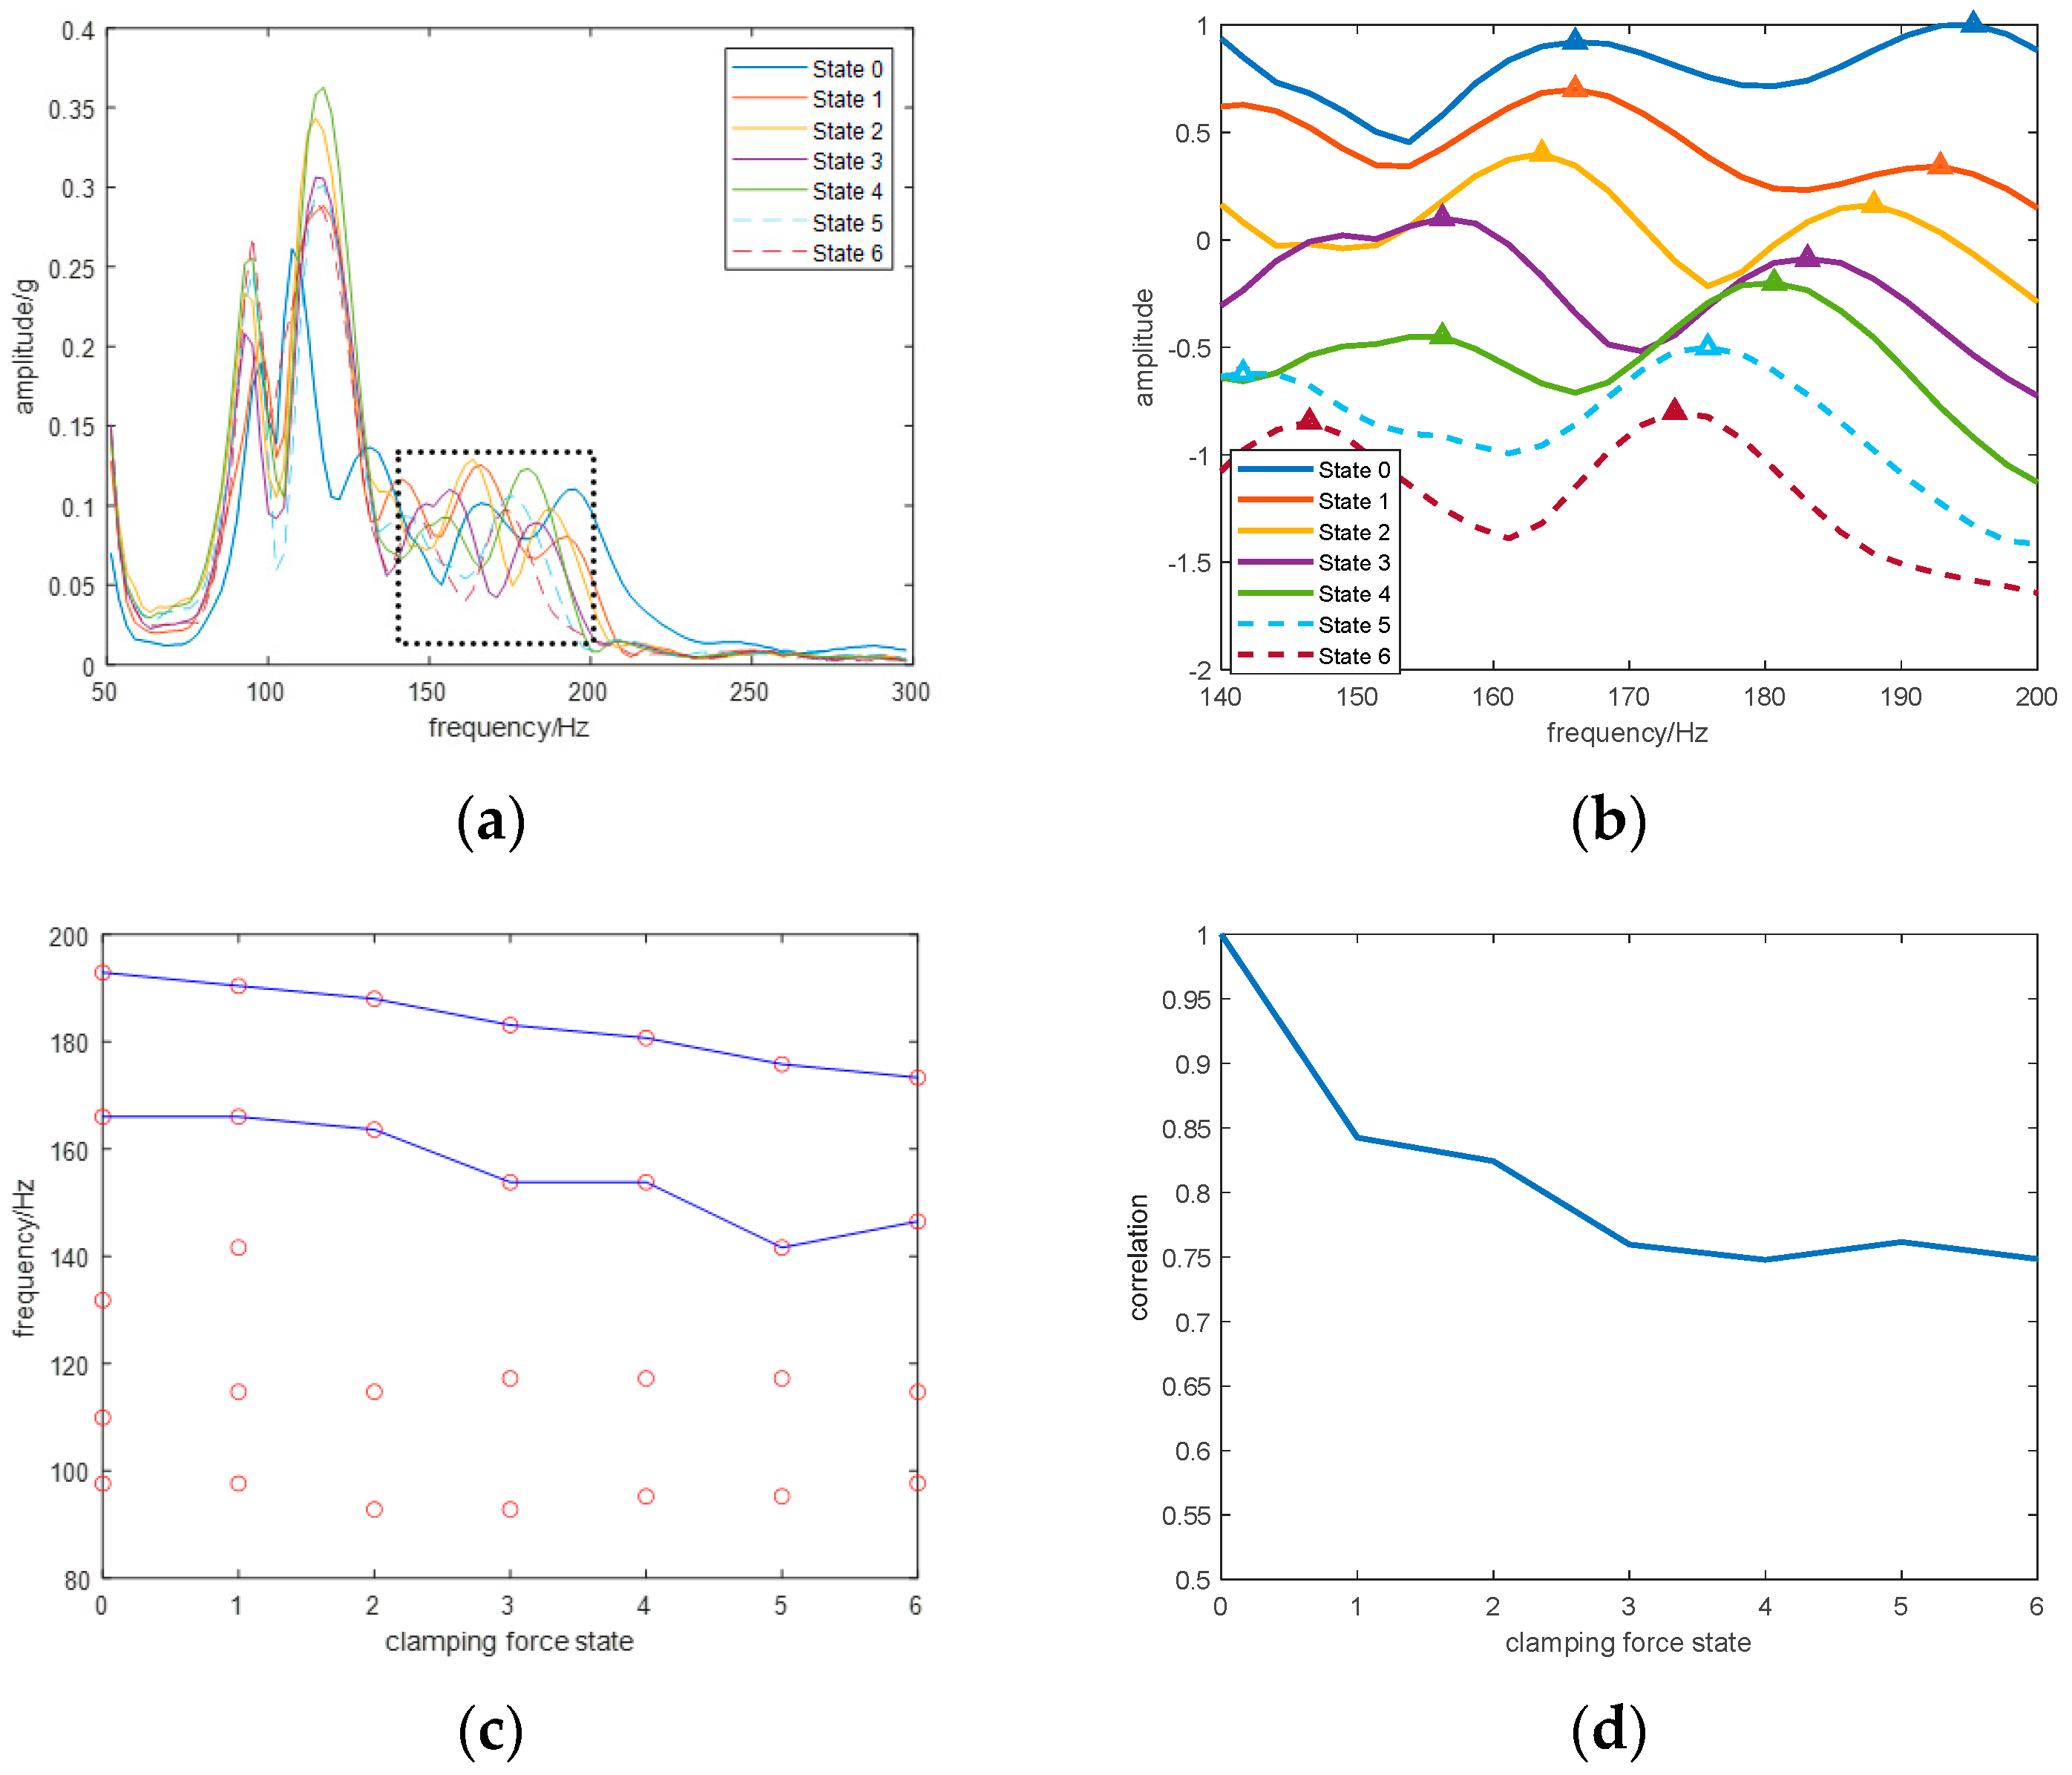
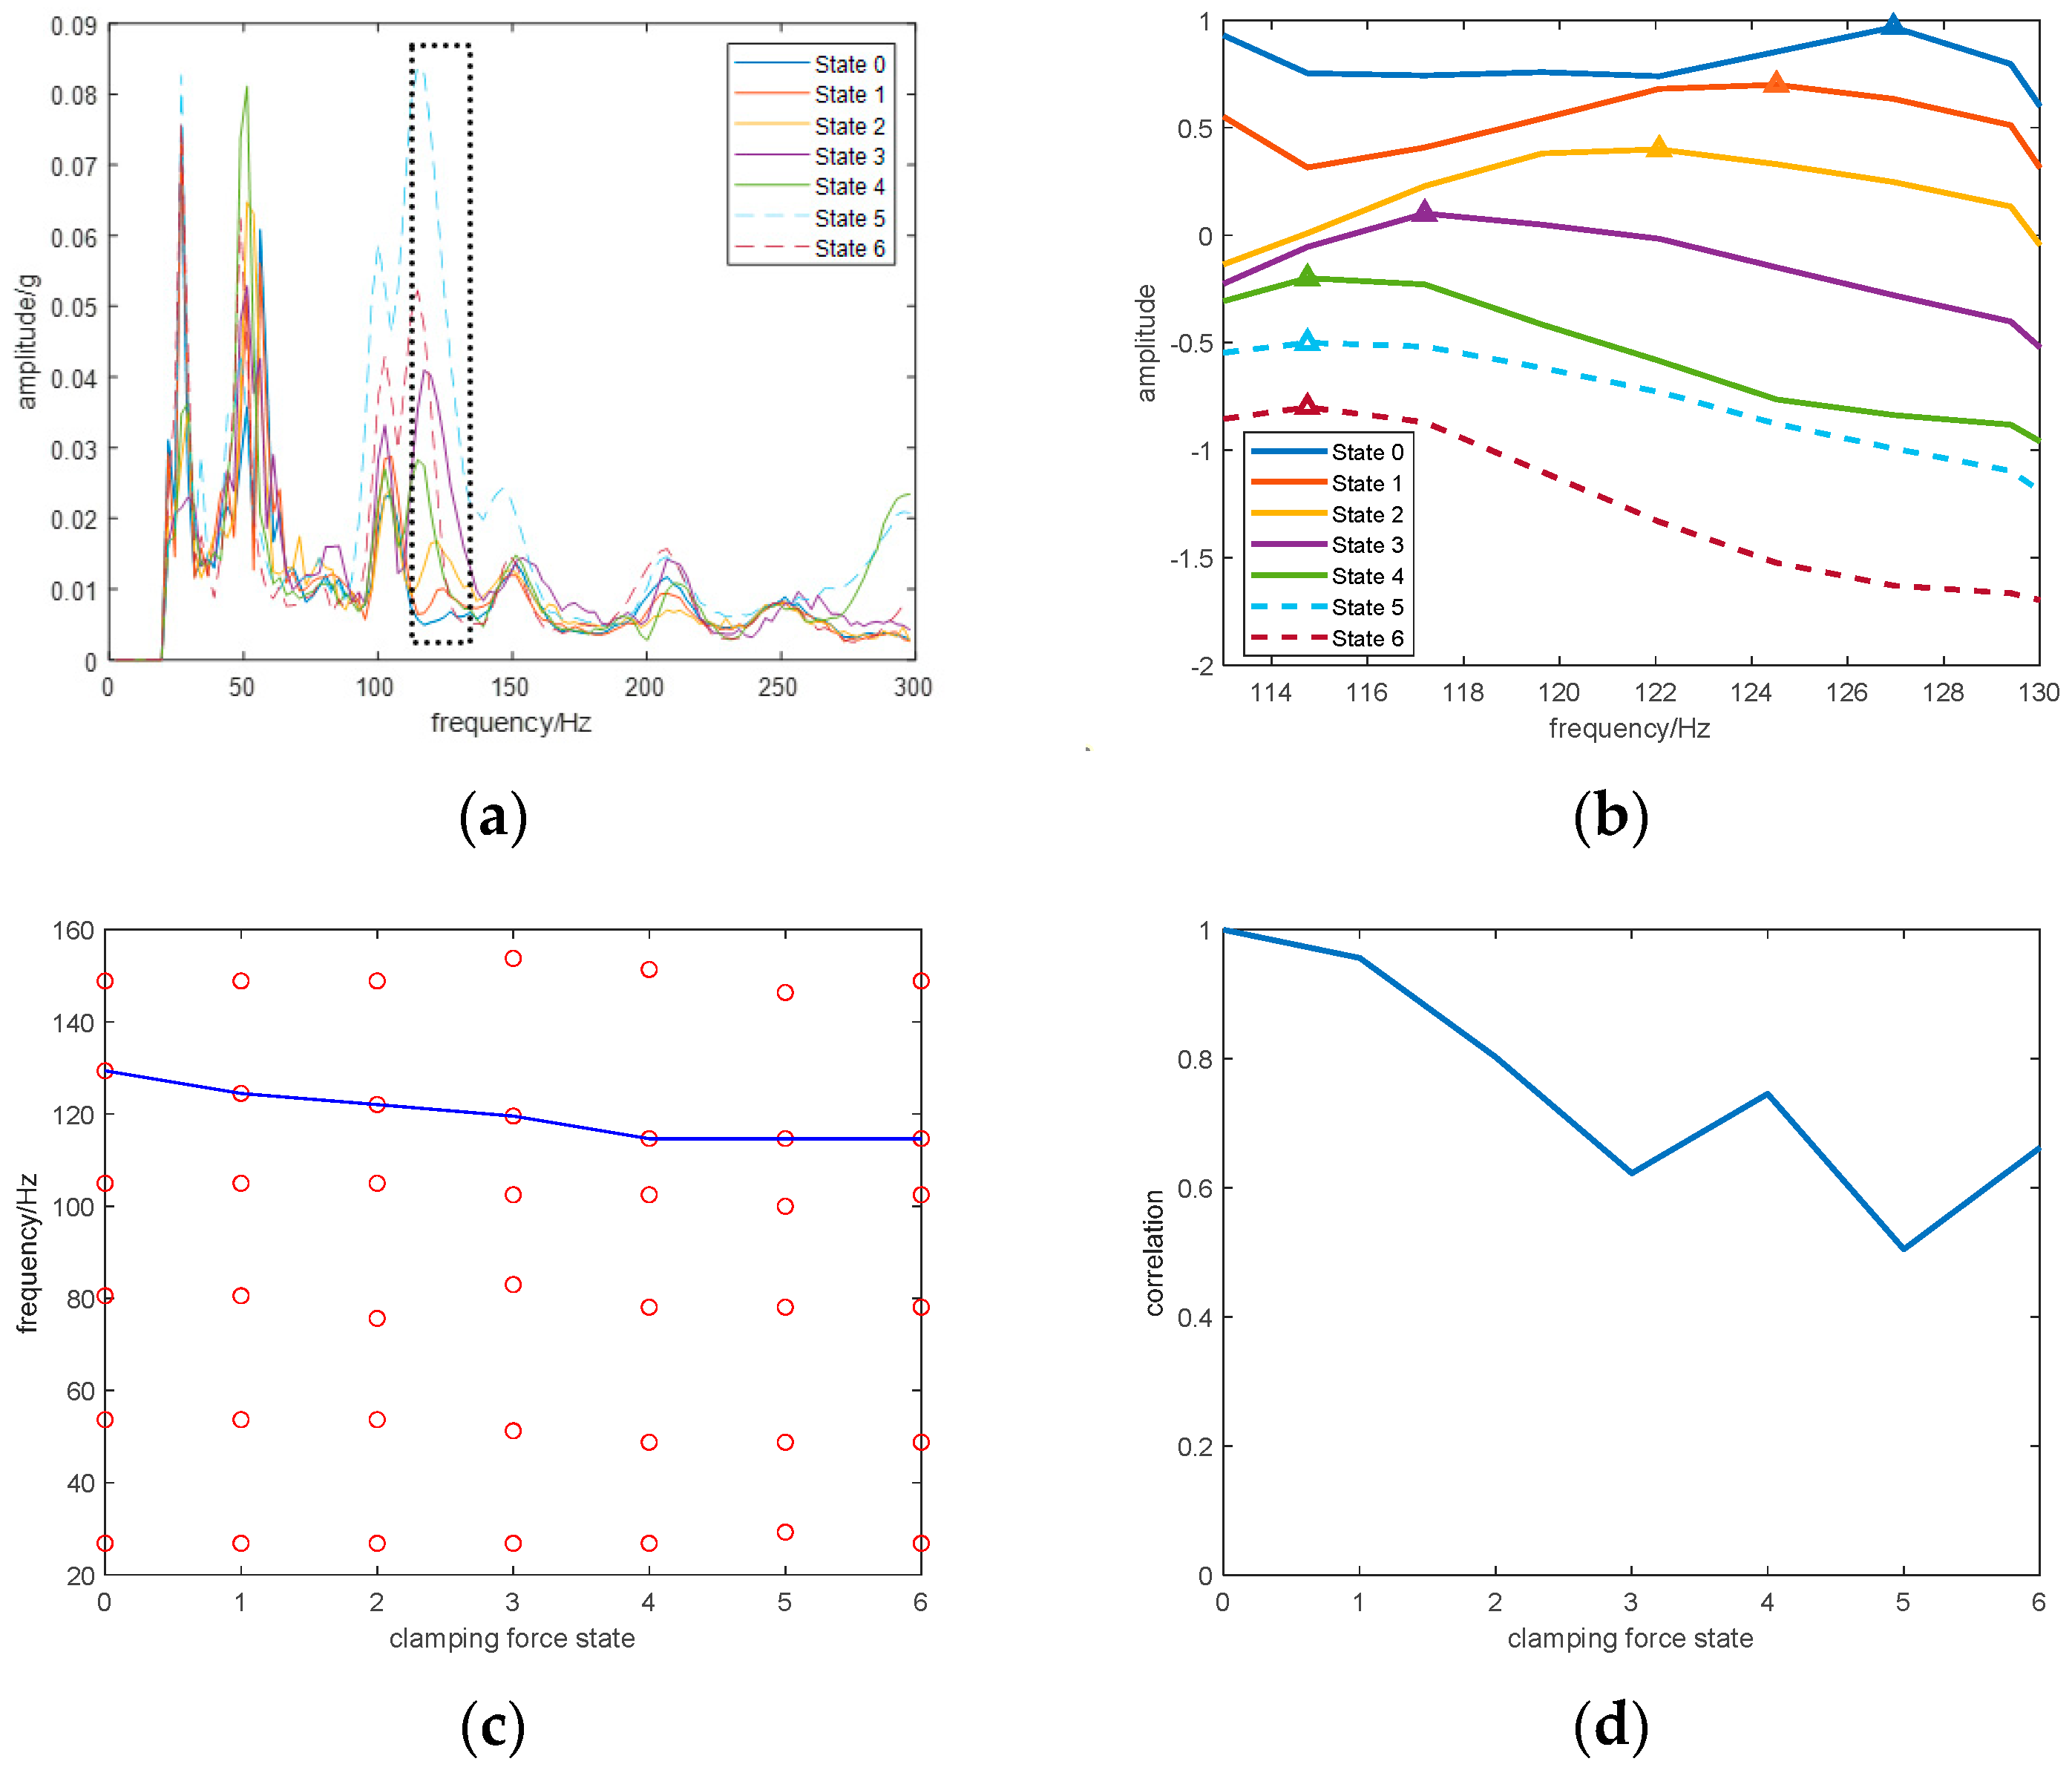
According to Equation (11), a decrease in stiffness due to the loosening of the winding clamping force will cause the natural frequencies of the winding to decrease. As a result, the extracted modal frequency spectrum changes as the looseness of the winding clamping force changes. Some frequencies, especially higher modal frequencies, gradually shift toward lower frequencies as the clamping force loosens.
(3)
Changes in the clamping force looseness cause changes in the results at both measurement points. This is because changes in the mechanical properties of the winding are included in the vibration transmission path of the core as a consequence of the coupling between the core and the winding. The results at the measurement point on the winding show a higher sensitivity to changes in mechanical properties than the results at the measurement point on the core.
(4)
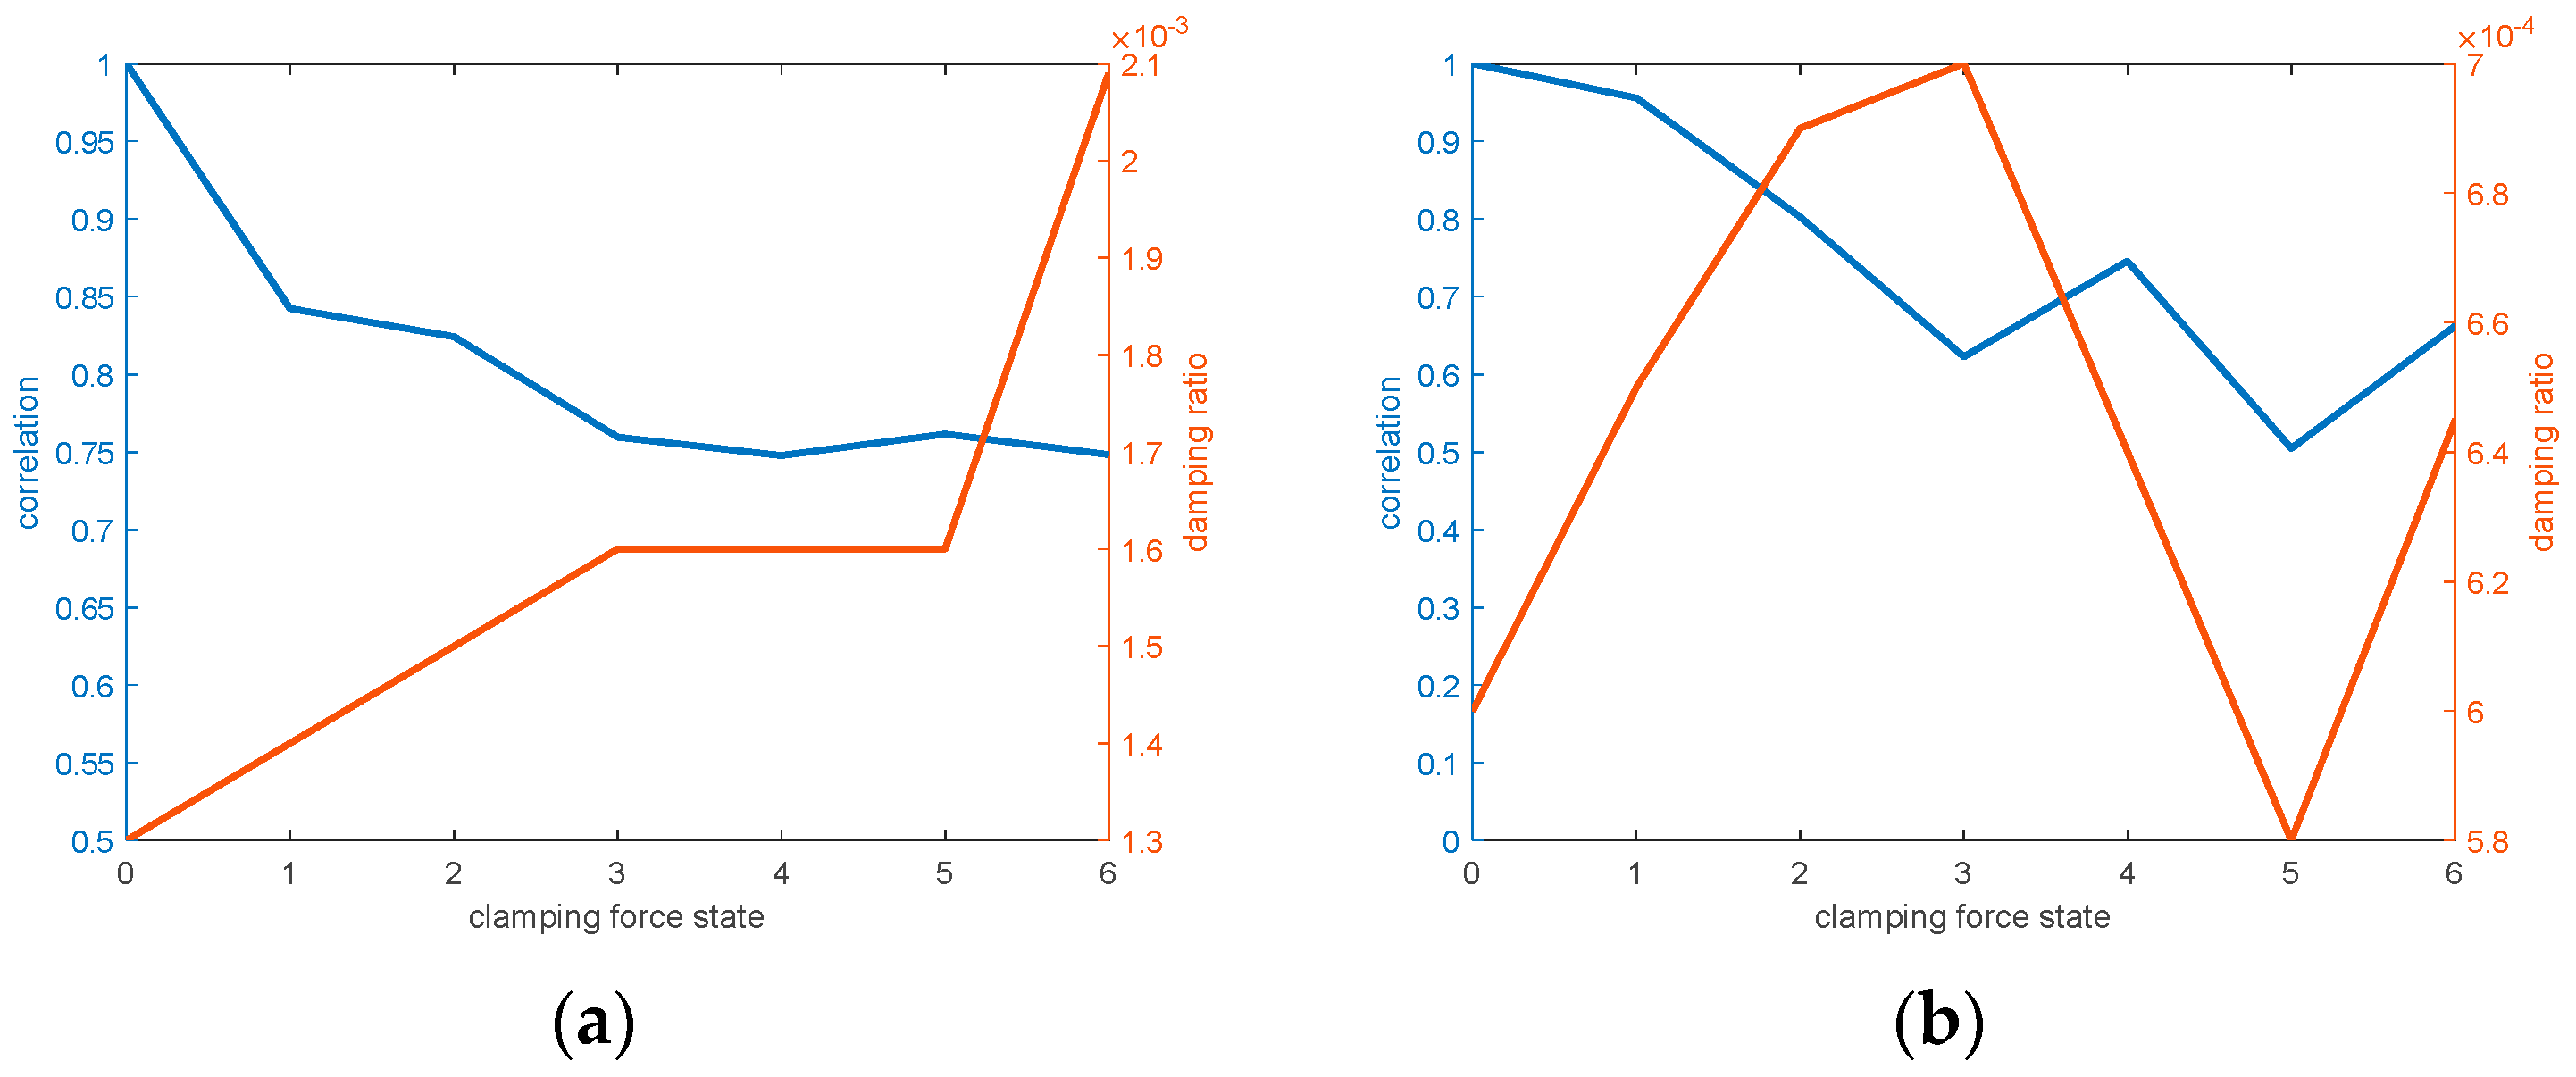
Compared with the damping ratio, the proposed indicator demonstrates better sensitivity, accuracy, and robustness in detecting looseness in winding clamping force.

4.2. Case 2: Winding Deformation Detection under Multiple Short-Circuit Conditions

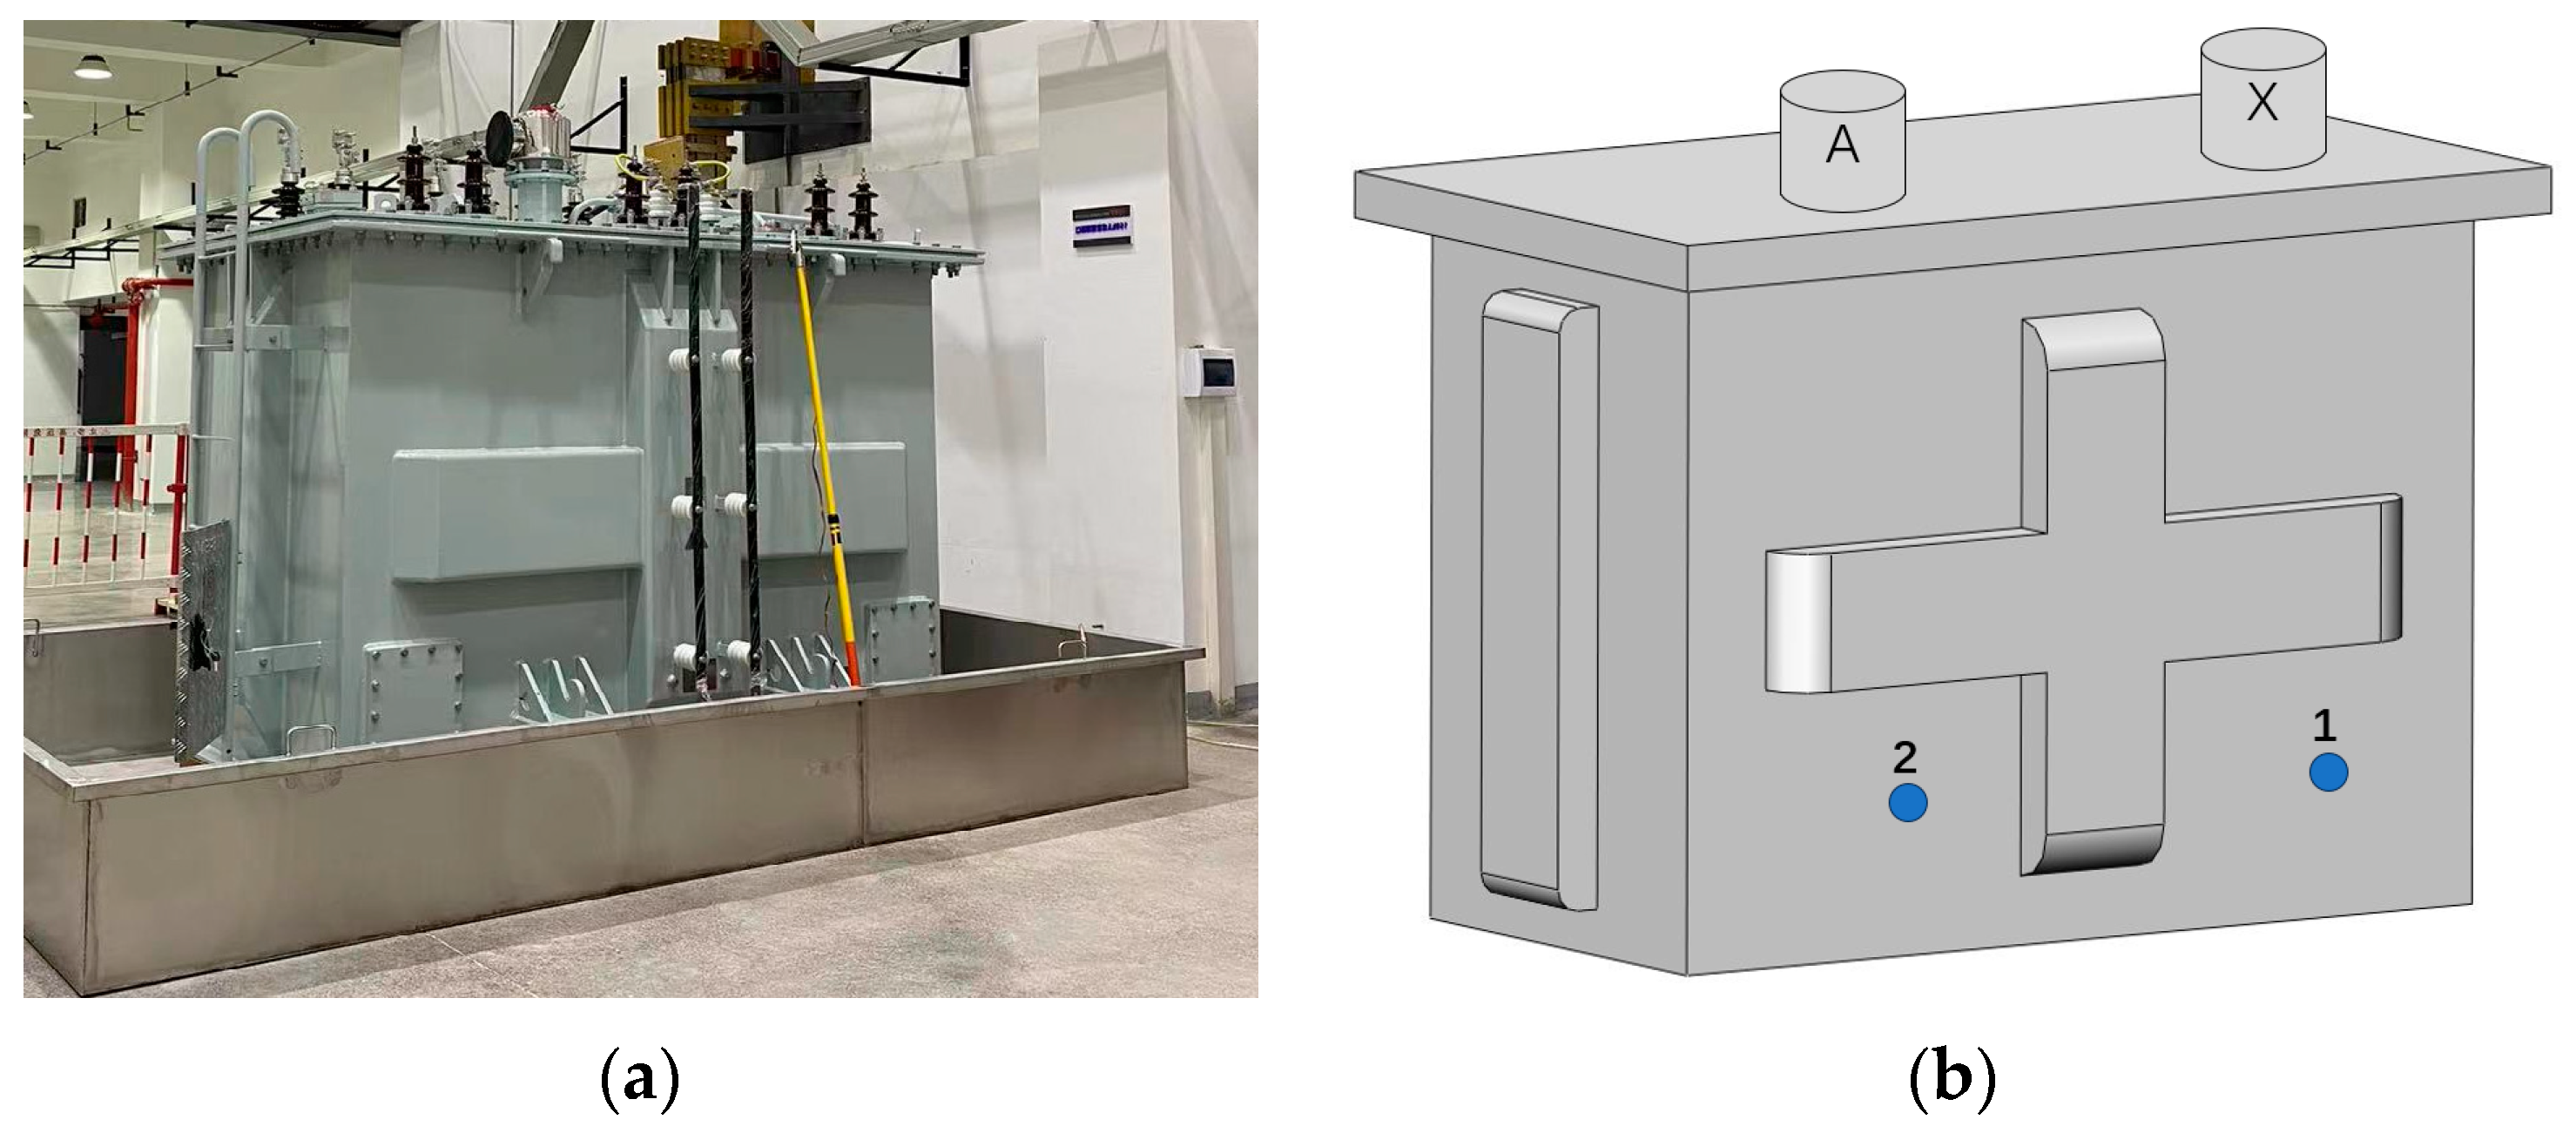
4.2.1. Experimental Setup
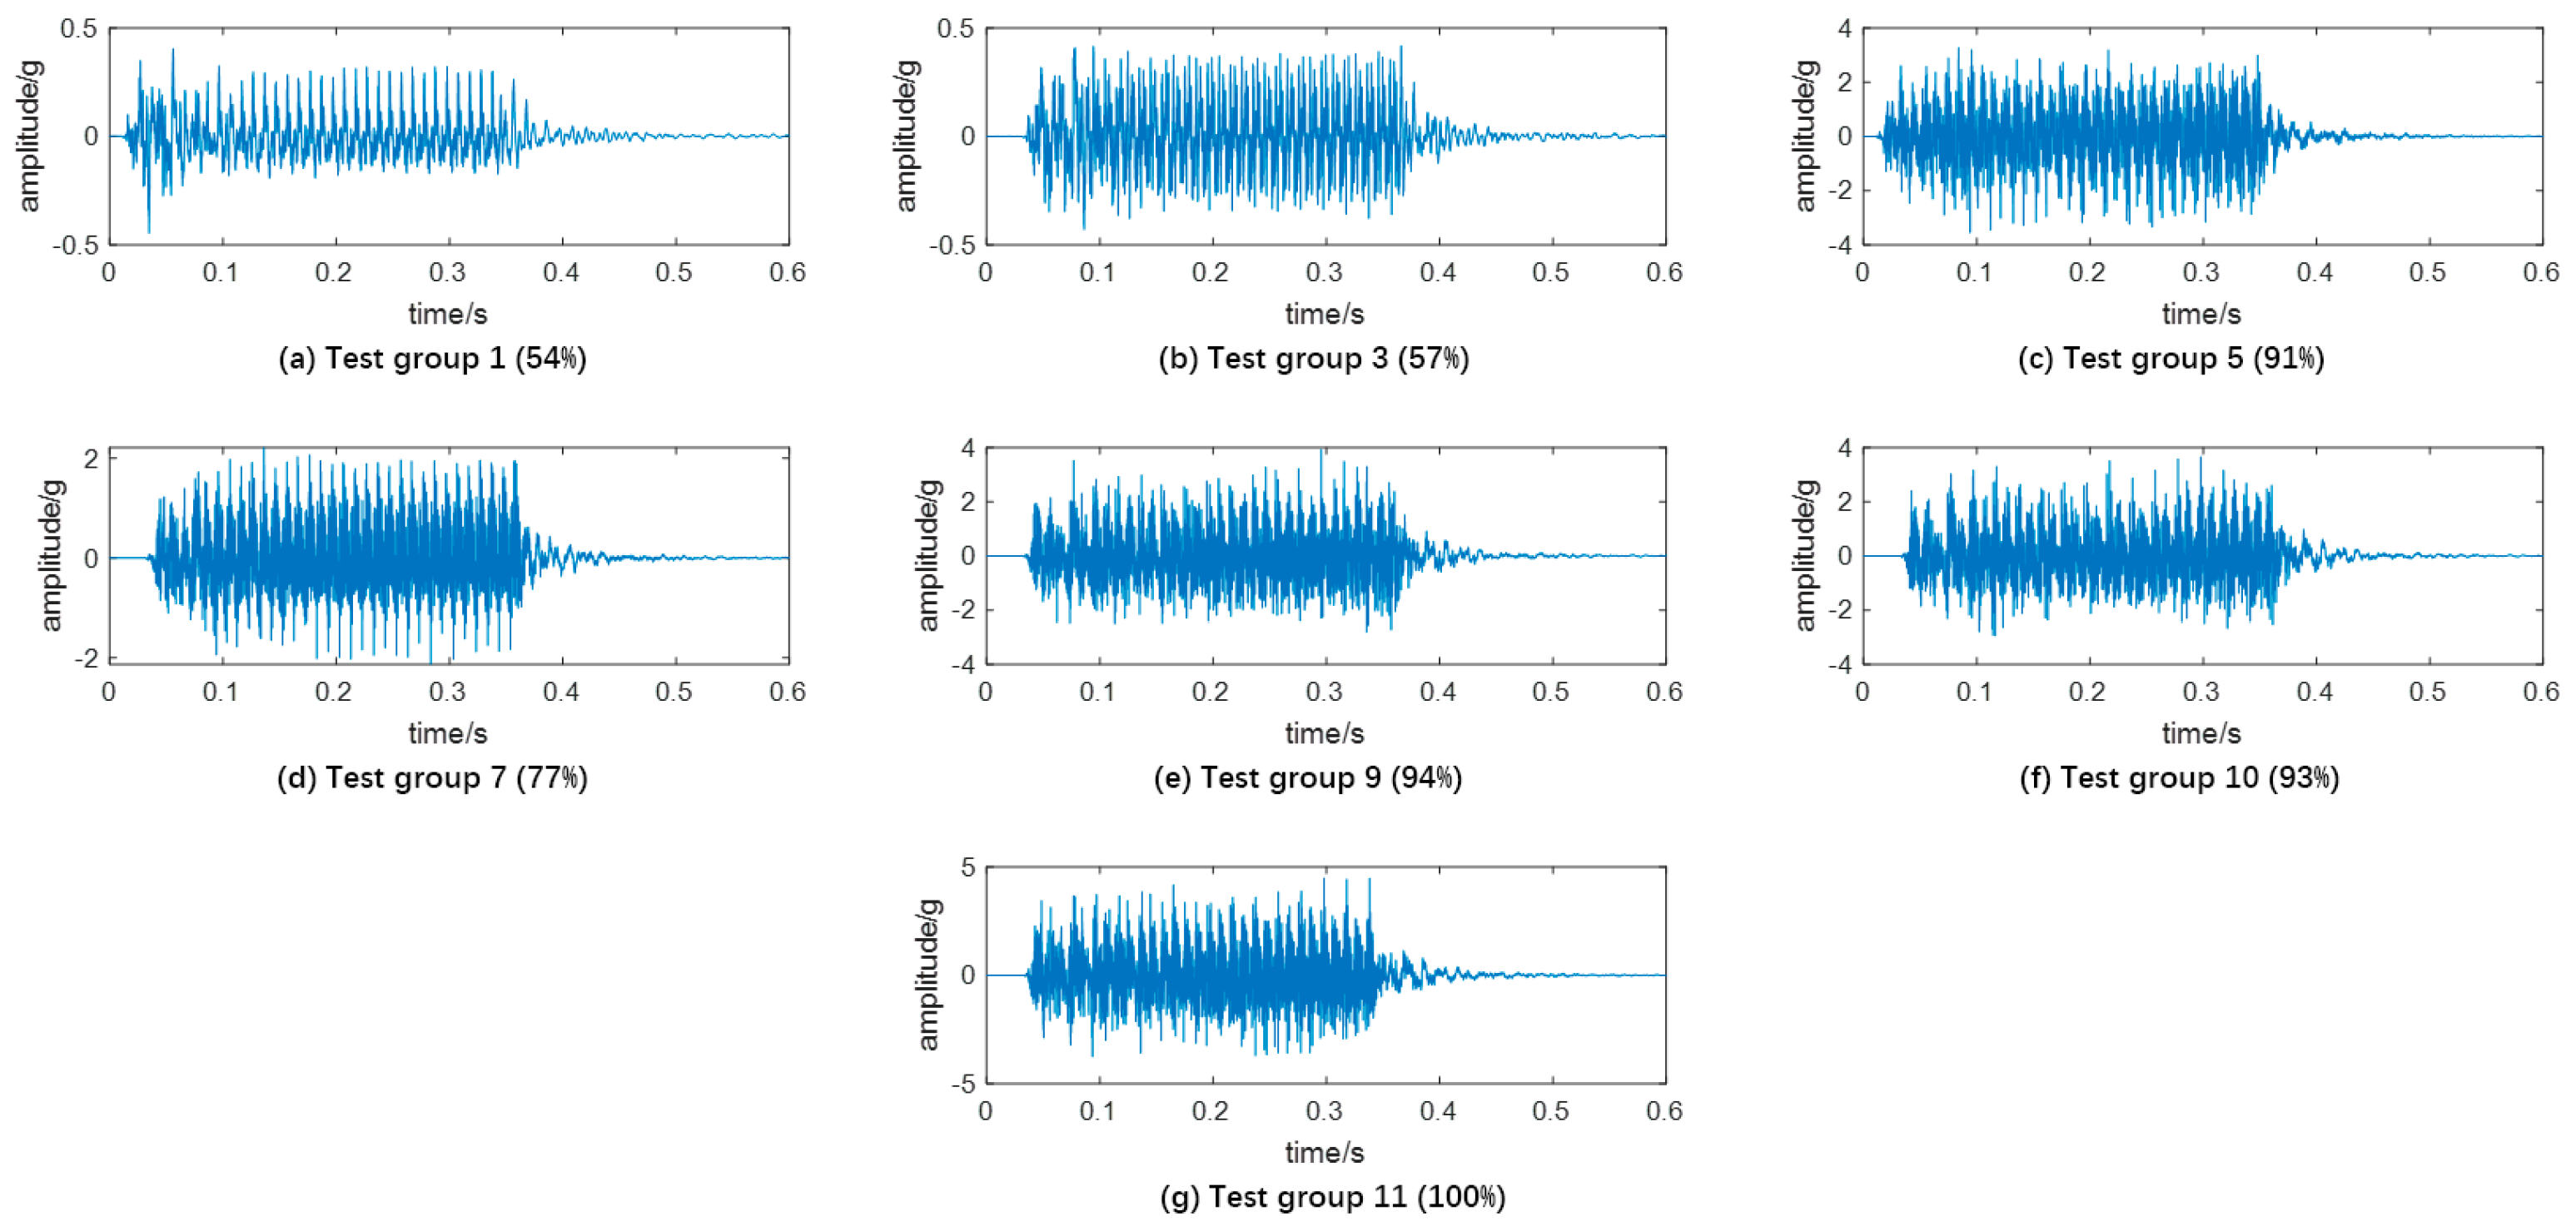
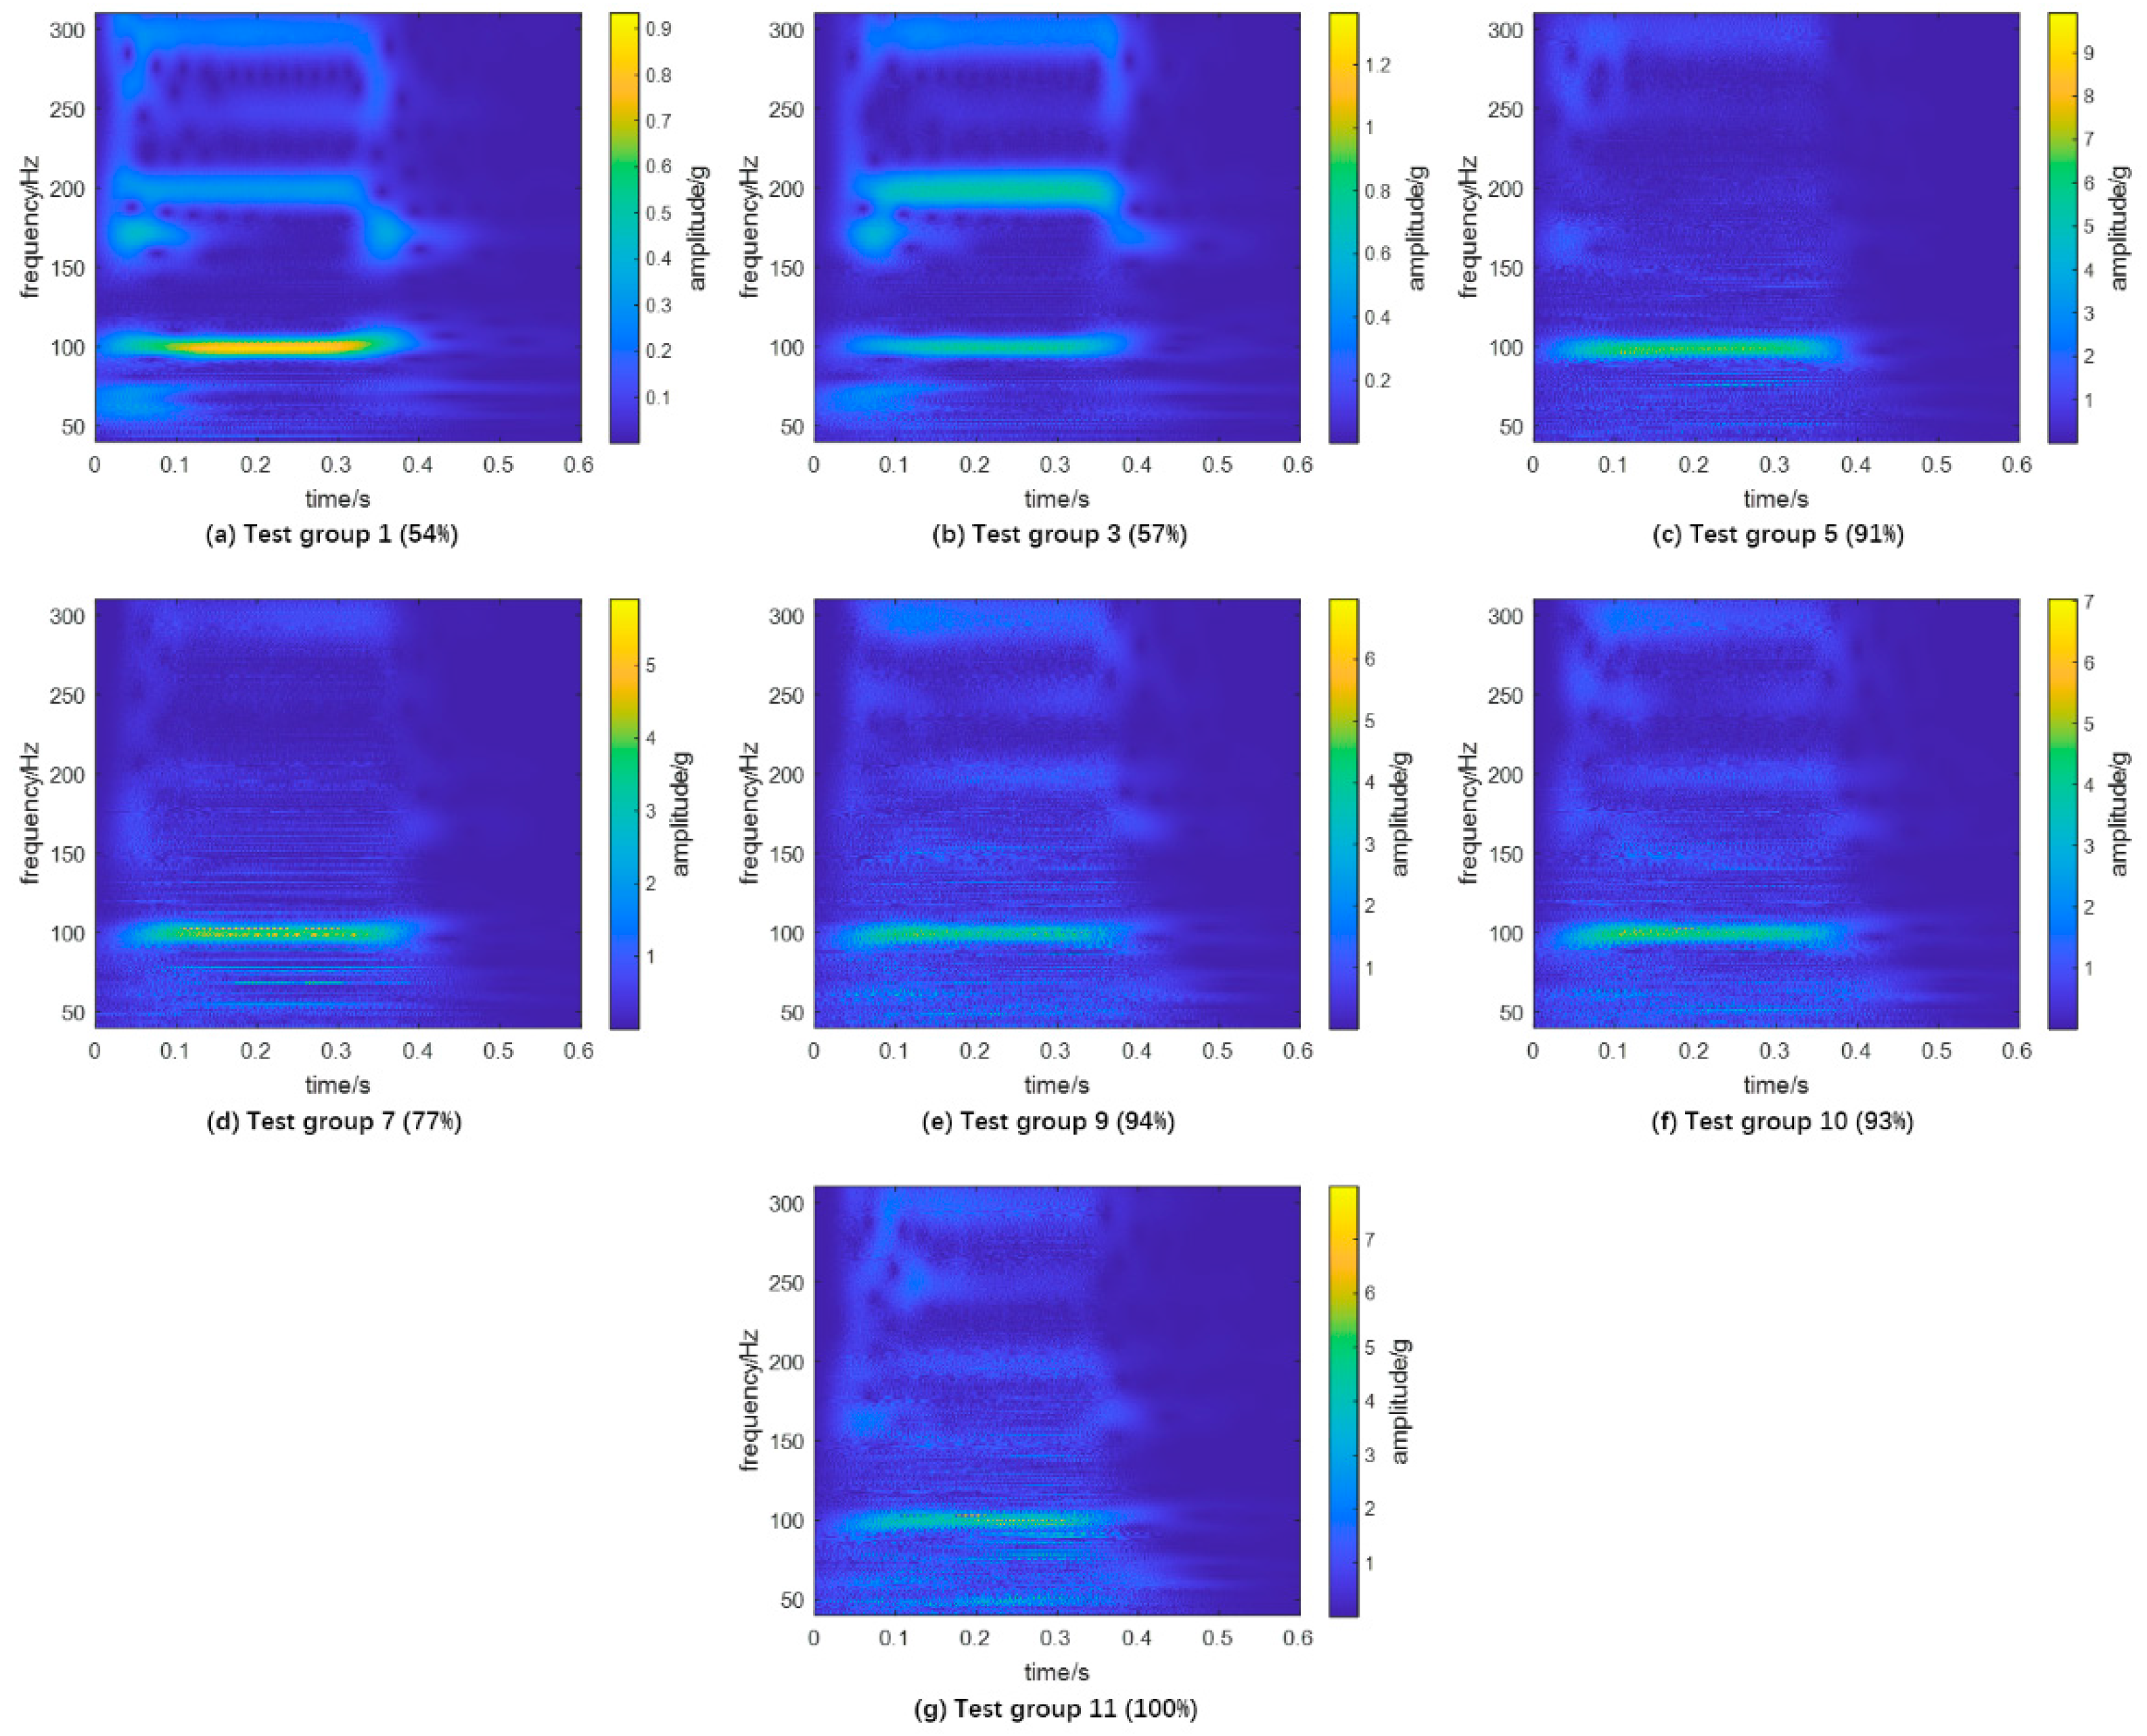
When a short circuit occurs, the winding will bear high amplitude and wide frequency electrical force. Under the repeated action of the short circuit electrical force, the winding will be deformed, and the axial compression force will be reduced. Therefore, it is necessary to use the above-mentioned modal analysis idea to extract the transformer modal information from the short-circuit impact and further determine the possibility of transformer structure abnormality by observing the change of modal characteristics during the short-circuit impact.
To verify the effectiveness of the proposed method in identifying transformer winding deformation during short-circuit impacts, tests are conducted on a 5 MVA single-phase experimental transformer, with two independent single-phase windings sitting on a two-limb core. The winding on the left is denoted as phase A, and the other one is denoted as phase X, as shown in Figure 12a. Two accelerometers, each with a sensitivity of 100 mV/g, are used to collect the vibration signatures on the tank surface, as shown in Figure 12b. Xu [26] used the method of linear deviation analysis to study the measurement points and concluded that the bottom of the transformer and the side of the box near the bottom are more suitable for sensor arrangement. Therefore, we located the accelerometers on the bottom of the transformer. Accelerometer #1 is located on the right side of the tank surface, near phase X, and accelerometer #2 is located on the left side, near phase A. A sampling frequency of 10,000 Hz is used.
In this paper, 11 short-circuit impact tests at phase X are performed under different short-circuit currents. The duration of each short-circuit impact is 300 ± 25 ms. Table 2 shows the current flowing through the short-circuit phase and the corresponding impendence variation ratio after the test. According to IEC 60076-5:2006 [27], the impedance variation ratio is a reliable index to evaluate whether a winding is severely deformed. For the last impact test, since the impedance variation ratio increases to 2.15%, it is inferred that the winding is severely deformed, which is proved by the disassembly results of the transformer, as shown in Figure 13.

4.2.2. Results

The collected vibration signals at measurement point #1 under different short-circuit currents are shown in Figure 14a–g. Figure 15a–g shows the corresponding time–frequency spectrums of the vibration signals, indicating that the transformer vibration is dominated by the 50 Hz harmonics, particularly the 100 Hz component. The proportion of each frequency component varies with the circuit.
By applying the proposed method, the modal frequency spectrum is extracted. Figure 16a illustrates the modal frequency spectrums of measurement point #1 under different short-circuit currents. The peak locations in the extracted spectrums vary with the repetition of the short-circuit test, especially in the frequency ranges of 50–80 Hz, 90–115 Hz, and 120–180 Hz (bounded by dotted lines). Figure 16b–d replots the frequency responses within the frequency ranges of 50–80 Hz, 90–115 Hz, and 120–180 Hz. Offsets are introduced into each sub-plot to ensure clarity in comparison. As shown in Figure 16b, a modal frequency at 56 Hz is observed in the initial state, and it gradually shifts toward higher frequencies, reaching approximately 60 Hz after multiple short-circuit tests. In Figure 16c, the frequency initially at 97 Hz decreases and then increases during tests, while the change of frequency at 108 Hz is reversed. In Figure 16d, modal frequencies are observed at 144 Hz and 168 Hz in the initial state. In the subsequent short-circuit test, the modal frequency at 168 Hz splits into two frequencies near 158 Hz and 170 Hz. The modal frequency at 144 Hz gradually shifts toward lower frequencies, reaching approximately 123 Hz after multiple short-circuit tests.
These main modal frequencies are identified and extracted from the modal spectrum, as plotted in Figure 16e, for different short-circuit currents. The changes in modal frequencies mentioned above can be clearly observed. Figure 16f plots a comparison of the similarity coefficients between the estimated modal spectrums at measurement point #1 under different short-circuit currents and the initial modal spectrum, as well as the impedance change ratio. In general, the similarity coefficient decreases with the number of impacts, indicating the accumulated deviation between the current mechanical state and the healthy state, while the impedance change ratio increases. Despite the opposite direction of change, they show a very similar trend, which means that the similarity coefficient could also evaluate the winding condition effectively. Furthermore, before the 5th impact, the similarity coefficient decreases greatly with the increasing number of impacts, while the impedance change ratio remains almost unchanged. It seems that the similarity coefficient can reflect even slight changes in the winding’s mechanical condition.
Figure 17a illustrates the modal frequency spectrums of measurement point #2 under different short-circuit currents. Significant changes in the peak locations around 95 Hz and 110 Hz (bounded by dotted lines) can be observed with the repetition of the short-circuit test. Figure 17b replots the frequency responses within the frequency range of 90–120 Hz, and it offsets the responses to ensure clarity in comparison. As shown, modal frequencies are observed at 98 Hz in the initial state. With the repetition of the short-circuit test, this frequency gradually shifts toward lower frequencies, reaching approximately 95 Hz. Similarly, the frequency at 113 Hz, which can be observed in the third impact, gradually shifts toward lower frequencies, reaching approximately 110 Hz.
The main modal frequencies are identified and extracted from the modal spectrum, as plotted in Figure 17c for different short-circuit currents. Besides the decrease in the frequency mentioned above, the other modal frequencies exhibit a slight variation with the repetition of the short-circuit test. Figure 17d plots a comparison of the similarity coefficients between the estimated modal spectrums at measurement point #2 under different short-circuit currents and the initial modal spectrum, as well as the impedance change ratio. It can be observed that the similarity coefficient decreases sharply before the 5th impact, but it fluctuates in subsequent tests. It is found that the location of measurement point #2 is far away from the deformed winding, resulting in a smaller change in the modal spectrums compared to the change in the modal spectrums of measurement point #1.
The damping ratios and impedance change ratios under different short-circuit currents are plotted in Figure 18. Although the damping ratio initially increases before the 5th impact, it subsequently decreases. Consequently, the proposed indicator demonstrates greater accuracy than the damping ratio in detecting winding deformation.

4.2.3. Discussion

In Case 2, the proposed method is used to detect the winding deformation of a transformer under multiple short-circuit conditions. The findings are as follows:
(1)
The proposed algorithm has been proven to be able to extract the modal frequency spectrum from the vibration signal under short-circuit conditions.
(2)
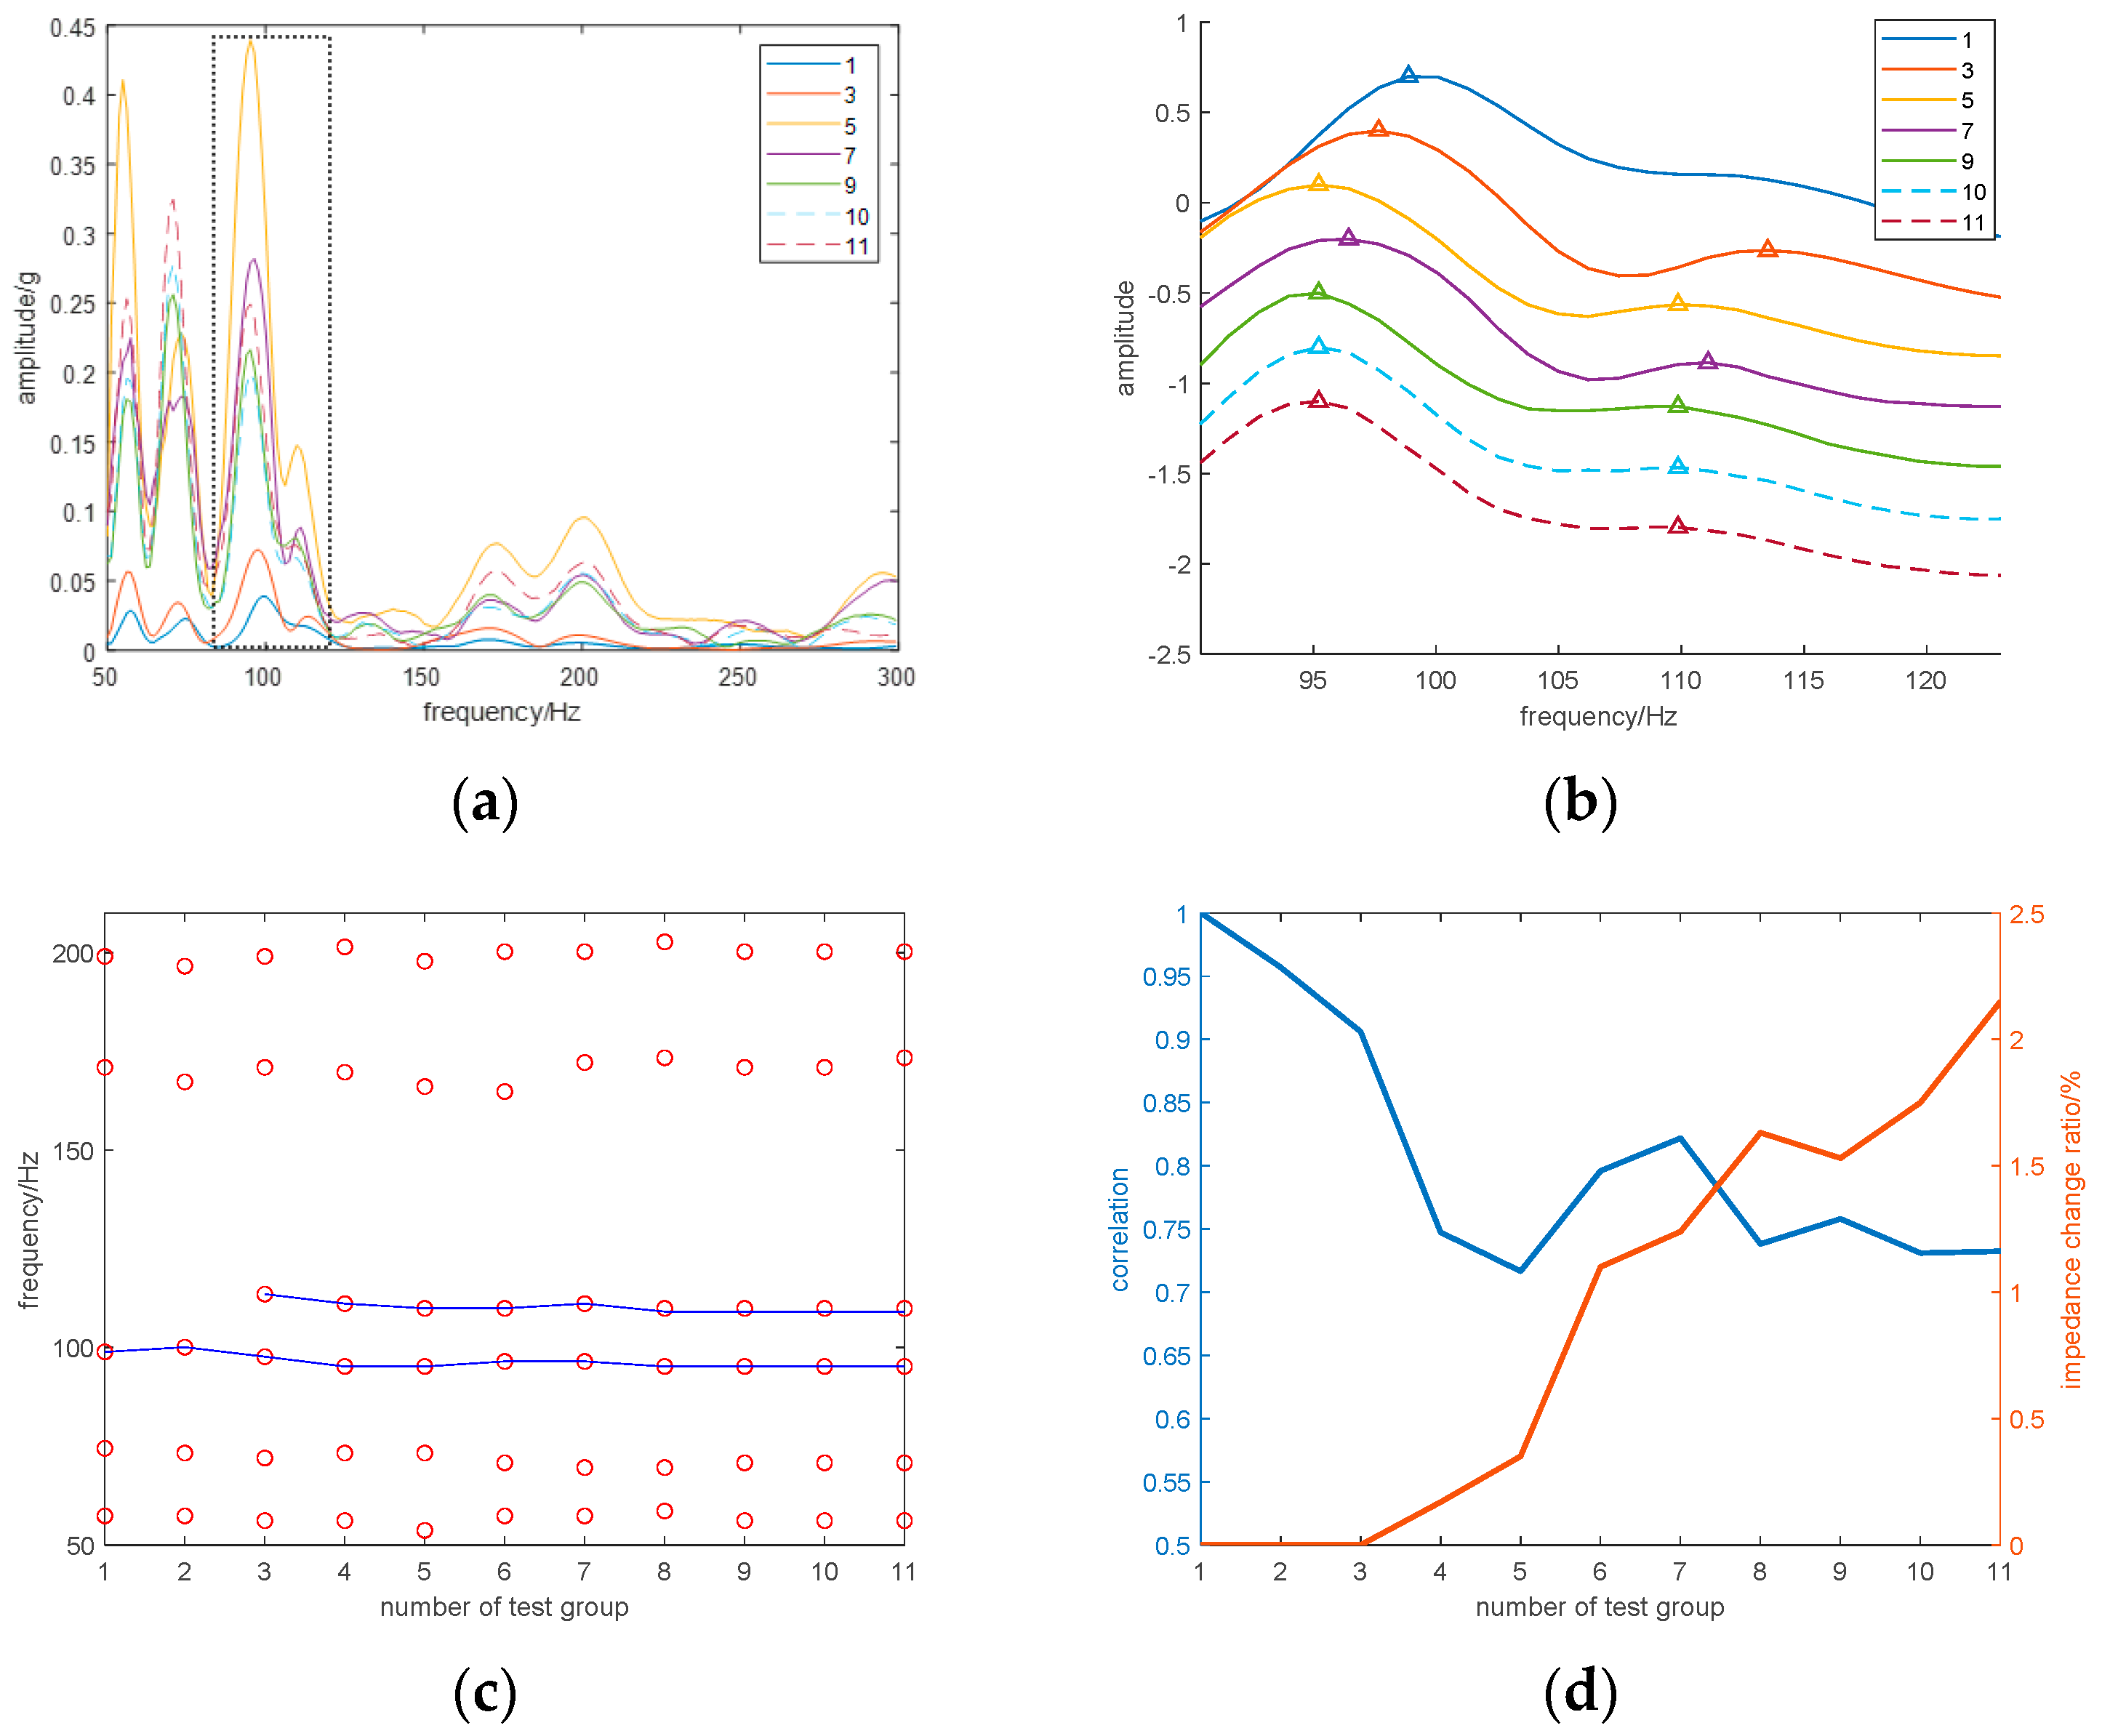
Although the measurement points are located on the tank surface, the estimated modal frequency spectrums of vibration vary with the repetition of the short-circuit test. Compared with the decrease of modal frequency caused by the clamping force looseness, the change in modal frequency caused by the short-circuit impacts exhibits diverse characteristics, including an increase, decrease, and splitting of modal frequencies.
(3)
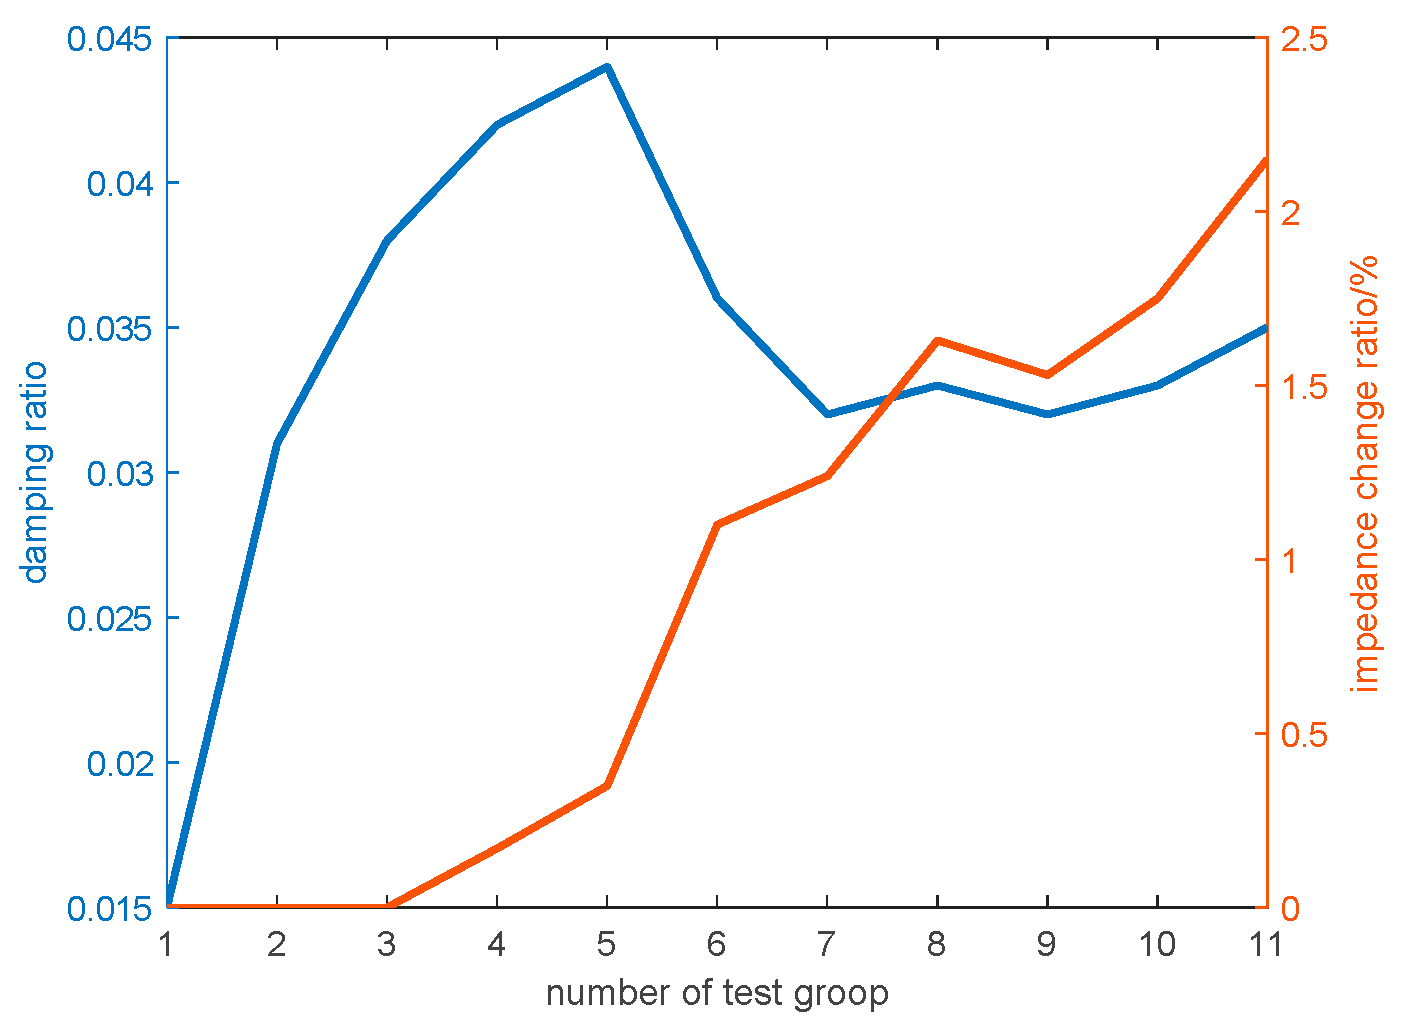
The change of the similarity coefficient is opposite to the change of the impedance change ratio, which means the similarity coefficient is also a reliable index to evaluate the winding condition.
(4)
As the short-circuit impact test is repeated, some modal frequencies undergo significant changes while others change slightly. Therefore, it is necessary to consider the entire modal spectrum in condition assessment rather than solely based on changes in individual modal frequencies.
(5)
The winding deformation causes changes in the results at both measurement points. This is because the changes in the mechanical properties of the winding are also included in the vibration transmission paths to the tank surface. However, the results at the measurement point near the deformed winding show higher sensitivity to changes in the mechanical properties than the results at the other measurement point.
(6)
The proposed indicator demonstrates greater accuracy than the damping ratio in detecting winding deformation.

5. Conclusions

This paper proposes an OMA-based mechanical condition assessment approach for winding. The proposed method can be used to extract the modal spectrum under power-off and short-circuit conditions to detect the looseness and deformation of winding. A measure of similarity between the extracted modal spectrum and the initial modal spectrum obtained under a healthy state is proposed as an indicator of the winding’s mechanical condition. The performance of the proposed method is investigated through power-off tests and short-circuit tests. The outcomes are summarized as follows:
  • In order to obtain a higher frequency resolution, the vibration before and during a transient process is used, which includes both force vibration and modal vibration components. A time–frequency analysis-based algorithm is proposed to separate the modal vibration and forced vibration components. The proposed algorithm is proven to be able to extract the modal frequency spectrum during transient processes.
  • When the winding is loosened, changes are observed in the extracted modal frequency spectrum. Some frequencies, especially higher modal frequencies, gradually shift toward lower frequencies as the clamping force loosens. It seems that higher modal frequencies are much more sensitive to the looseness of the winding clamping force. Besides the decrease of the frequencies, disappearances of frequencies are also observed in the modal frequency spectrum. This observation clearly supports the idea that the entire spectrum distribution should be considered in condition assessment. Furthermore, the proposed indicator is used to describe the difference between the modal frequency spectrums and the initial spectrum. The indicator decreases as the clamping force decreases, offering a sensitive and accurate measure of the winding’s mechanical condition.
  • A cumulative effect is generated when the transformer suffers multiple short circuit impacts, which will lead to changes in the mechanical condition of the windings. With repetition of the short-circuit test, the extracted modal frequency spectrum undergoes significant changes. Compared with the decrease of modal frequency caused by the clamping force looseness, the change in modal frequencies caused by the short-circuit impacts exhibits diverse patterns. This once again illustrates the importance of analyzing the entire spectrum distribution. In addition, the proposed indicator, which is used to describe changes in the modal frequency spectrum, decreases with the repetition of the short-circuit test. The results are consistent with the change of the impedance change ratio, enabling the analysis of the cumulative effect of the transformer.
In conclusions, the modal spectrum extracted from time-frequency analysis of the transformers’ transient vibration under power-off and short-circuit conditions has provided useful insight into the mechanical properties of the transformer vibration system, which are closely related to the mechanical condition of the winding. An indicator of mechanical condition is presented and found to be highly effective. It has been proven that the proposed method can detect winding defects when the transformer is running in an OMA setting. Compared with the damping ratio, the method provides a more sensitive and accurate diagnosis of loose and deformed transformer windings under daily operating conditions. This paper provides a more convenient and accurate method for transformer fault diagnosis.

Author Contributions

Conceptualization, Y.Y. and J.Z. (Jing Zheng); Formal analysis, Y.Y., K.H., N.W. and J.Z. (Jing Zheng); Methodology, Y.Y., J.Z. (Jiafeng Zhao), N.W. and J.Z. (Jing Zheng); Software, J.Z. (Jiafeng Zhao) and K.H.; Validation, J.Z. (Jiafeng Zhao) and K.H.; Writing—original draft, Y.Y., J.Z. (Jiafeng Zhao) and J.Z. (Jing Zheng); Writing—review and editing, Y.Y., N.W. and J.Z. (Jing Zheng). All authors have read and agreed to the published version of the manuscript.

Funding

This research was funded by the China Southern Power Grid Research Project (1500002022030101SJ00020) and the Key Area Research and Development Program of Guangdong Province (2021B0101190003).

Data Availability Statement

The raw data supporting the conclusions of this article will be made available by the authors on request.

Acknowledgments

This work was supported by the China Southern Power Grid Research Project (1500002022030101SJ00020) and the Key Area Research and Development Program of Guangdong Province (2021B0101190003). We thank LetPub (www.letpub.com) for its linguistic assistance during the preparation of this manuscript.

Conflicts of Interest

The authors declare no conflict of interest.

References

  1. Usha, K.; Joseph, J.; Usa, S. Location of Faults in Transformer Winding using SFRA. In Proceedings of the IEEE 1st International Conference on Condition Assessment Techniques in Electrical Systems (IEEE CATCON), Kolkata, India, 6–8 December 2013. [Google Scholar]
  2. Wang, Y.; Xu, D.; Li, Y.; Zhang, C. A Study on Instrumentation Techniques in LVI Method for Detecting Transformer Winding Deformation. High Volt. Eng. 1998, 03, 24–34. (In Chinese) [Google Scholar]
  3. Li, Z.; He, Y.; Xing, Z.; Chen, M. Minor Fault Diagnosis of Transformer Winding using Polar Plot based on Frequency Response Analysis. Int. J. Electr. Power Energy Syst. 2023, 152, 109173. [Google Scholar] [CrossRef]
  4. Li, C.; Chen, J.; Yang, C.; Yang, J.; Liu, Z.; Davari, P. Convolutional Neural Network-Based Transformer Fault Diagnosis Using Vibration Signals. Sensors 2023, 23, 4781. [Google Scholar] [CrossRef] [PubMed]
  5. Han, S.; Wang, B.; Liao, S.; Gao, F.; Chen, M. Defect Identification Method for Transformer End Pad Falling Based on Acoustic Stability Feature Analysis. Sensors 2023, 23, 3258. [Google Scholar] [CrossRef] [PubMed]
  6. Wang, Y.; Zhou, G.; Zeng, C.; Zhang, W.; Ren, Y.; Ke, Y.; Chu, H.; Suo, C. Research on On-Line Detection Method of Transformer Winding Deformation Based on VFTO. Sensors 2021, 21, 7386. [Google Scholar] [CrossRef] [PubMed]
  7. Huerta-Rosales, J.R.; Granados-Lieberman, D.; Garcia-Perez, A.; Camarena-Martinez, D.; Amezquita-Sanchez, J.P.; Valtierra-Rodriguez, M. Short-Circuited Turn Fault Diagnosis in Transformers by Using Vibration Signals, Statistical Time Features, and Support Vector Machines on FPGA. Sensors 2021, 21, 3598. [Google Scholar] [CrossRef] [PubMed]
  8. Hong, K.; Wang, L.; Xu, S. A Variational Mode Decomposition Approach for Degradation Assessment of Power Transformer Windings. IEEE Trans. Instrum. Meas. 2019, 68, 1221–1229. [Google Scholar] [CrossRef]
  9. Wang, Y.; Pan, J. Comparison of Mechanically and Electrically Excited Vibration Frequency Responses of a Small Distribution Transformer. IEEE Trans. Power Deliv. 2017, 32, 1173–1180. [Google Scholar] [CrossRef]
  10. Zhang, F.; Ji, S.; Ma, H.; Saha, T.K. Operational Modal Analysis of Transformer Windings. IEEE Trans. Power Deliv. 2020, 35, 1285–1298. [Google Scholar] [CrossRef]
  11. Li, X.; Yue, X.; Huang, W.; Dong, X.; Peng, Z. Vibration Response Transmissibility and Operational Modal Analysis Methods: A Review and Comparative Study. J. Vib. Shock. 2019, 38, 24–34+45. [Google Scholar]
  12. Shao, Y.; Xu, J.; Rao, Z.; Jin, Z.; Jiang, Y.; Fu, J. On-line diagnosis for a transformer winding’s state under short-circuit shock. J. Vib. Shock. 2011, 30, 173–176. [Google Scholar]
  13. Wang, F.; Li, Q.; Jin, Z. On-line Monitoring the Winding Condition of Power Transformer Under Sudden Short-circuit Based on the Vibration Analysis Method. Control Eng. China 2011, 18, 596–599. [Google Scholar]
  14. Zhang, K.; Wang, F.; Liao, T.; Jin, Z. Detection of Transformer Winding Deformation under Sudden Short-Circuit Impact Based on Complex Wavelet Algorithm. Diangong Jishu Xuebao/Trans. China Electrotech. Soc. 2014, 29, 327–332. [Google Scholar]
  15. Soria, L.; Peeters, B.; Auweraer, H.V.D. Automatic in-Operation Modal Analysis for the continuous monitoring of high-speed railway bridges. In Proceedings of the 8th International Conference on Structural Dynamics (EURODYN 2011), Leuven, Belgium, 4–6 July 2011. [Google Scholar]
  16. Lin, C.; Ou, X.; Yang, X.; Sun, W.; Rao, Z.; He, H.; Zhan, C. Vibration Characteristics and Detection of Inter-turn Short-circuit Fault Under Transformer Suffering Short-circuit Impact. High Volt. Eng. 2018, 44, 3569–3576. [Google Scholar]
  17. Wang, Y.; Pan, J. Applications of Operational Modal Analysis to a Single-Phase Distribution Transformer. IEEE Trans. Power Deliv. 2015, 30, 2061–2063. [Google Scholar] [CrossRef]
  18. Hu, Y. Research on Fault Diagnosis Method of Transformer Windings Based on Spatial Vibration Distribution and Operational Modal Analysis. Ph.D. Thesis, Zhejiang University, Hangzhou, China, 2020. (In Chinese). [Google Scholar] [CrossRef]
  19. Hong, K.; Huang, X.; Xu, S. A Study of Nonlinear Behavior of Transformer Windings in Structural Degradation Detection. J. Vib. Acoust. 2020, 142, 011020. [Google Scholar] [CrossRef]
  20. Zhou, H.; Hong, K.; Huang, H.; Zhou, J. Transformer Winding Fault Detection by Vibration Analysis Methods. Appl. Acoust. 2016, 114, 136–146. [Google Scholar] [CrossRef]
  21. Hong, K. Research on the On-Line Detection Method of Mechanical Stability of Power Transformer Windings Based on Vibration Analysis. Ph.D. Thesis, Zhejiang University, Hangzhou, China, 2016. (In Chinese). [Google Scholar]
  22. Cao, S.; Zhang, W.; Xiao, L. Modal Analysis of Vibrating Structures: Theory, Experiment, and Application; Tianjin University Press: Tianjin, China, 2001. [Google Scholar]
  23. Qian, G. IEEE In Detecting Transformer Winding Deformation Fault Types Based on Continuous Wavelet Transform. In Proceedings of the IEEE International Conference on Mechatronics and Automation, Harbin, China, 7–10 August 2016; pp. 1886–1891. [Google Scholar]
  24. Blackburn, G.A. Wavelet decomposition of hyperspectral data: A novel approach to quantifying pigment concentrations in vegetation. Int. J. Remote Sens. 2007, 11–12, 2831–2855. [Google Scholar] [CrossRef]
  25. Zheng, J.; Pan, J.; Huang, H. An experimental study of winding vibration of a single-phase power transformer using a laser Doppler vibrometer. Appl. Acoust. 2015, 87, 30–37. [Google Scholar] [CrossRef]
  26. Xu, F.; Shao, Y.; Jin, Z.; Guan, H. Experimental Study of Measuring Point Selection for Transformer Vibration Detection. East China Electr. Power 2012, 40, 274–277. [Google Scholar]
  27. IEC 60076-5; Power Transformers—Part 5: Ability to Withstand Short Circuit. IEC (International Electrotechnical Commission): Geneva, Switzerland, 2006.
Figure 1. An equivalent mechanical model for power transformer windings.
Electronics 13 02519 g001
Figure 2. (a) Using wavelet basis to process the vibration signal v i b t before and during a transient process. (b) The continuous wavelet transform W v i b a , b of the vibration signal. (c) The estimated frequency spectrums at different moments of time based on W v i b a , b .
Electronics 13 02519 g002
Figure 3. The procedure of the algorithm.
Electronics 13 02519 g003
Figure 4. (a) Experimental transformer and (b) measurement point arrangement in case 1.
Electronics 13 02519 g004
Figure 5. Vibration signal at measurement point #1 under State 1, where (a) is the original signal and (b) is the signal around the voltage cut−off time.
Electronics 13 02519 g005
Figure 6. Time–frequency analysis of (a) the entire vibration signal and (b) the signal after the voltage is cut off (measurement point #1, State 1).
Electronics 13 02519 g006
Figure 7. Extraction of the modal frequency from the time–frequency spectrum of the vibration signal, (a) is the similarity curve, (b) is the time–frequency distribution, the red line is the location of the turning point, and (c) is the extracted modal spectrum (measurement point #1, State 1).
Electronics 13 02519 g007
Figure 8. The extracted modal spectrum (measurement point #1, State 1) using (a) the proposed method and (b) the traditional method.
Electronics 13 02519 g008
Figure 9. Estimated modal frequency spectrums of vibration from measurement point #1 under different clamping forces: (a) amplitude responses, (b) amplitude responses within the range of 140−200 Hz with each clamping force from tightest to loosest, offset by 0.1 for clarity, (c) the main modal frequencies under different clamping forces, and (d) the similarity coefficients between the estimated modal spectrums under different clamping forces and the initial modal spectrum.
Electronics 13 02519 g009
Figure 10. (a) Estimated modal frequency spectrums of vibration from measurement point #2 under different clamping forces: amplitude responses, (b) amplitude responses within the range of 140−200 Hz with each clamping force from tightest to loosest, offset by 0.1 for clarity, (c) the main modal frequencies under different clamping forces, and (d) the similarity coefficients between the estimated modal spectrums under different clamping forces and the initial modal spectrum.
Electronics 13 02519 g010
Figure 11. The similarity coefficients and damping ratios at measurement points #1 (a) and #2 (b) under different clamping forces.
Electronics 13 02519 g011
Figure 12. (a) Experimental transformer and (b) measurement point arrangement in case 2.
Electronics 13 02519 g012
Figure 13. The deformed winding.
Electronics 13 02519 g013
Figure 14. Vibration signal at measurement point #1 (the value in parenthesis is the short−circuit current).
Electronics 13 02519 g014
Figure 15. Time–frequency analysis of vibration signal at measurement point #1 (the value in parenthesis is the short-circuit current).
Electronics 13 02519 g015
Figure 16. Estimated modal frequency spectrums of vibration from measurement point #1 under different short−circuit currents: (a) amplitude responses, amplitude responses within the ranges of (b) 50−80 Hz, (c) 90−115 Hz, and (d) 120−180 Hz with each short−circuit impact, offset by 0.3 for clarity, (e) the main modal frequencies under different short−circuit currents, and (f) the similarity coefficients between the estimated modal spectrums under different short−circuit currents and the initial modal spectrum.
Electronics 13 02519 g016
Figure 17. Estimated modal frequency spectrums of vibration from measurement point #2 under different short−circuit currents: (a) amplitude responses, (b) amplitude responses within the range of 90−120 Hz, with each short−circuit impact offset by 0.3 for clarity, (c) the main modal frequencies under different short−circuit currents, and (d) the similarity coefficients between the estimated modal spectrums under different short−circuit currents and the initial modal spectrum.
Electronics 13 02519 g017
Figure 18. The damping ratios and impedance change ratios under different short-circuit currents.
Electronics 13 02519 g018
Table 1. Number of turns loosened for each state.
Clamping Force StateNumber of Turns Loosened
State 00
State 11/4
State 21/2
State 33/4
State 41
State 55/4
State 63/2
Table 2. Test group number and impedance change ratio.
Test Group Number
(Short-Circuit Current Percentage)
Impedance Change Ratio (%)
1 (54%)0.00
2 (75%)0.00
3 (57%)0.00
4 (83%)0.17
5 (91%)0.35
6 (77%)1.10
7 (77%)1.24
8 (94%)1.63
9 (94%)1.53
10 (93%)1.75
11 (100%)2.15
Disclaimer/Publisher’s Note: The statements, opinions and data contained in all publications are solely those of the individual author(s) and contributor(s) and not of MDPI and/or the editor(s). MDPI and/or the editor(s) disclaim responsibility for any injury to people or property resulting from any ideas, methods, instructions or products referred to in the content.

