
PGE-YOLO: A Multi-Fault-Detection Method for Transmission Lines Based on Cross-Scale Feature Fusion


Abstract
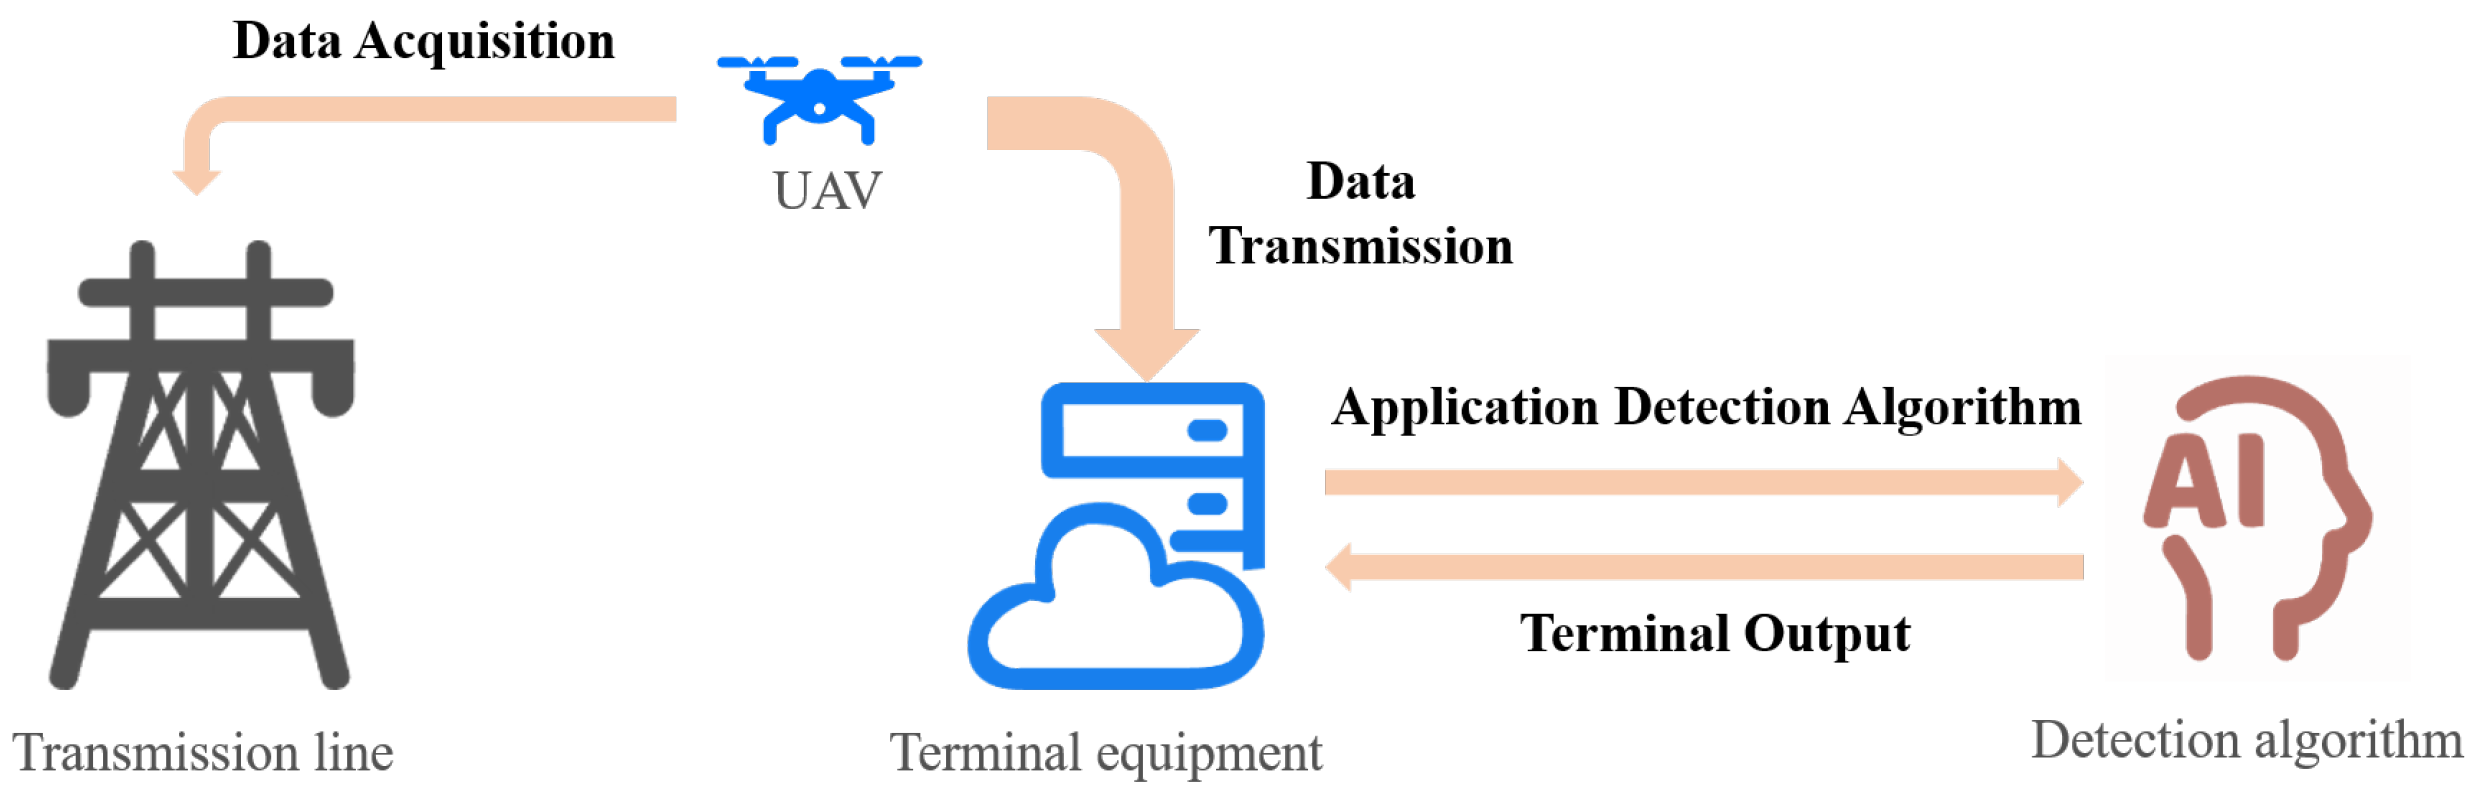
:1. Introduction
- We designed an improved backbone, ParNet, which forms a parallel branch structure through convolutions of different sizes. We leveraged the advantages of the ParNet design to enhance the weak representation of the original YOLOv8 backbone. This module was added to the residual sub-module DarknetBottle of C2f, creating a new backbone network module called Par_C2f. Specifically, by utilizing this structure without additional depth, we can extract features and increase the receptive field, resulting in significant improvements in model performance.
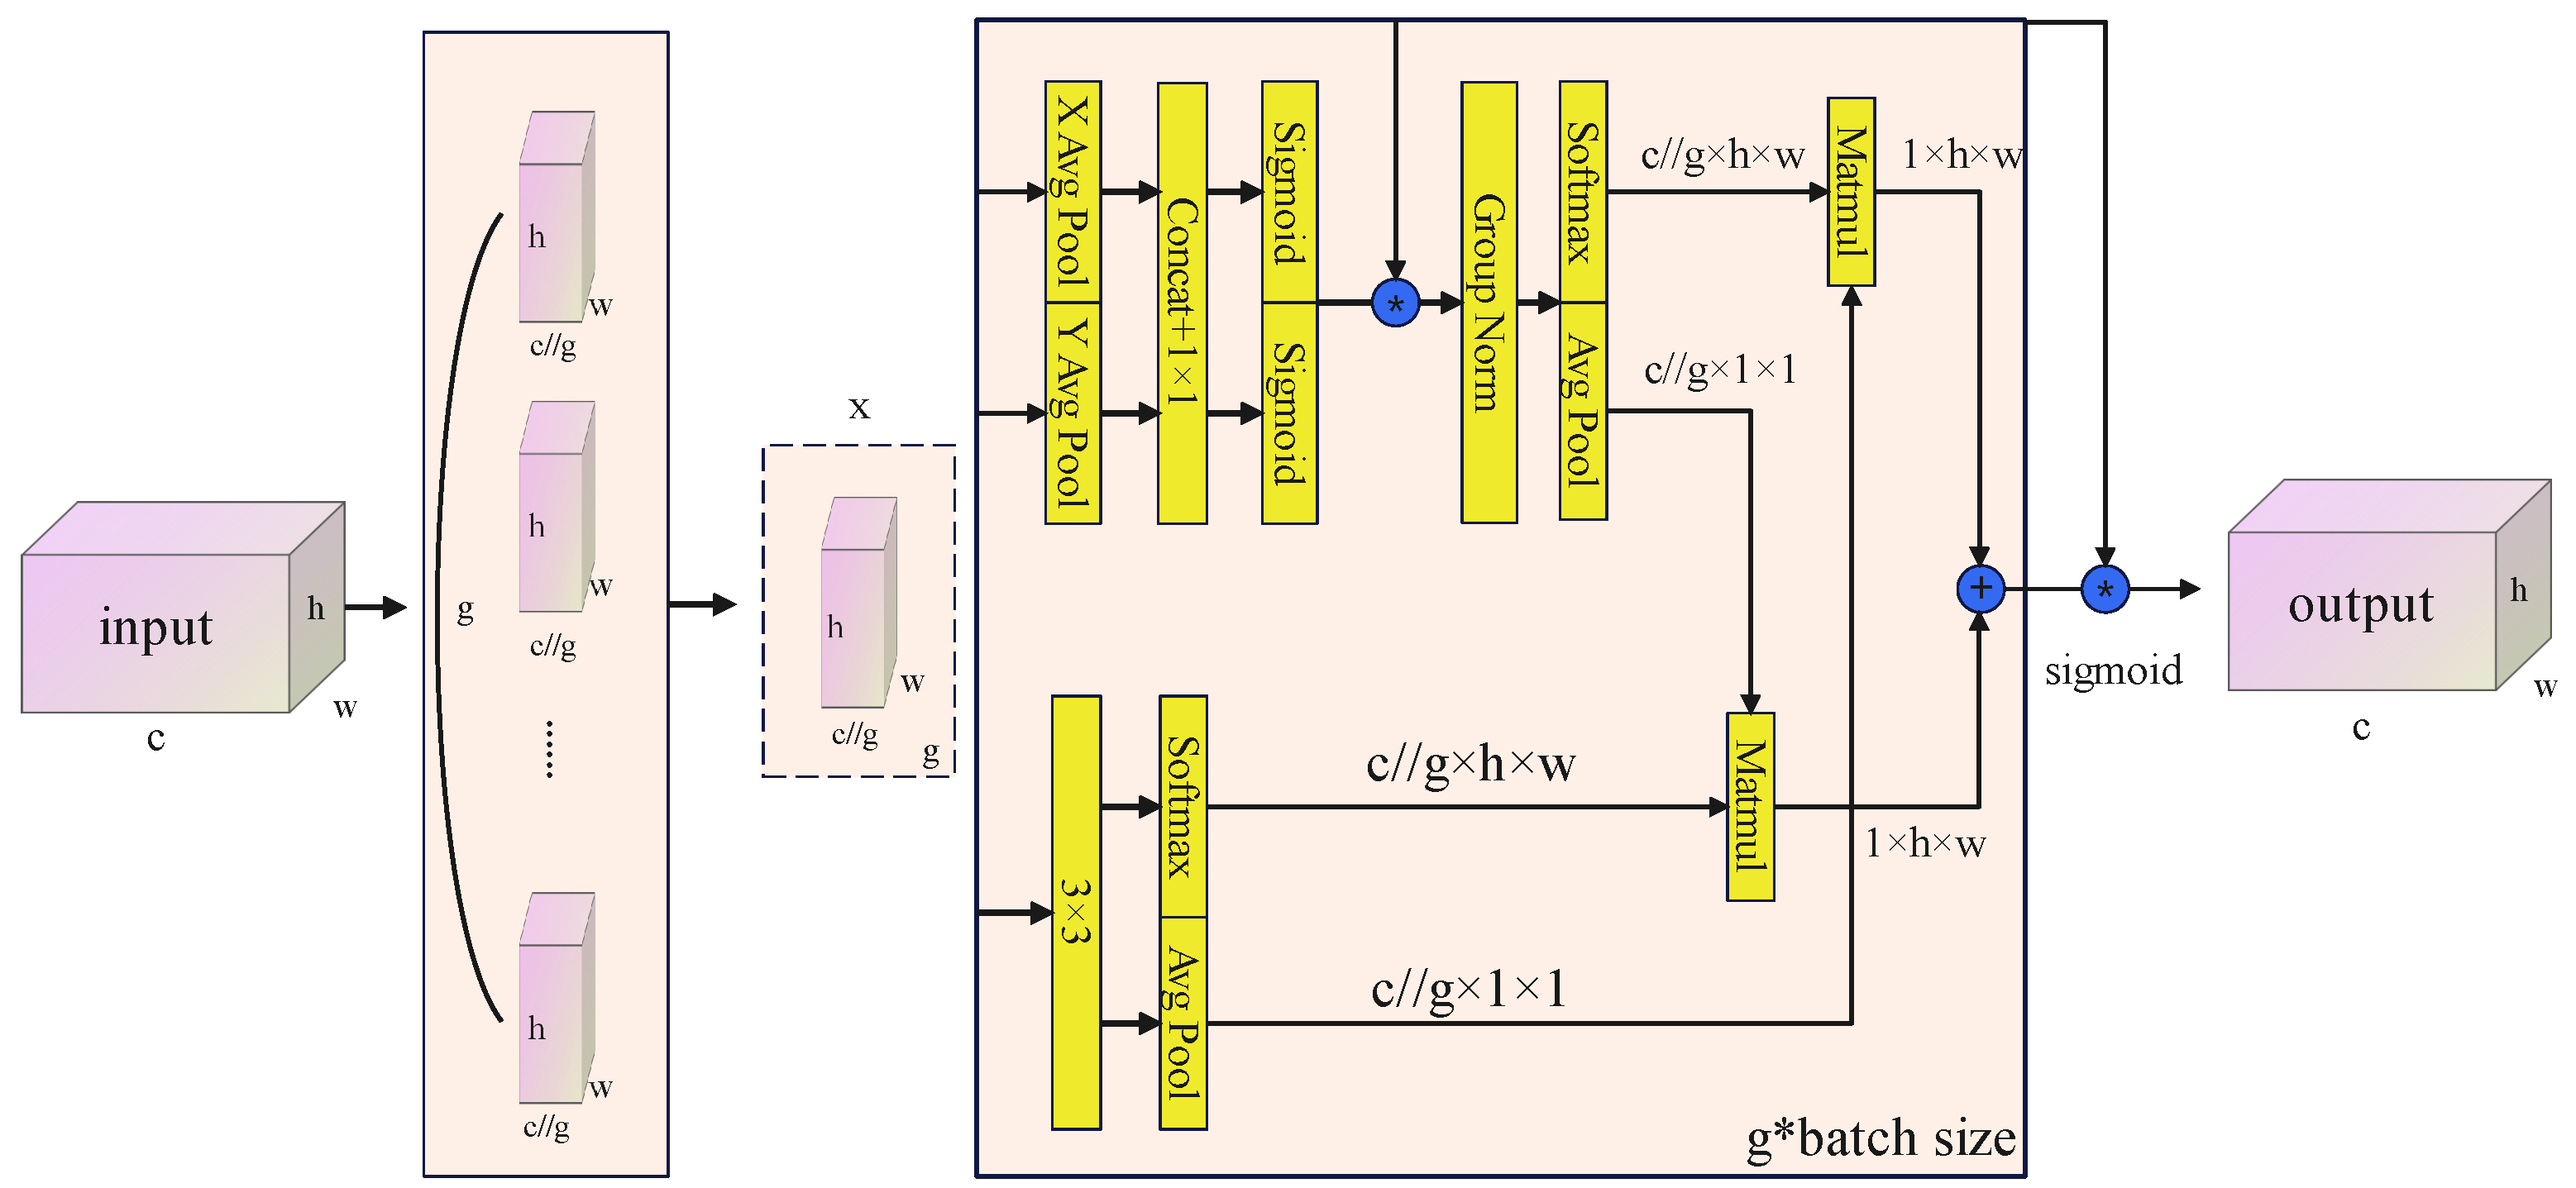
- A four-layer architecture multi-scale attention module was strategically designed at the network’s neck. This involves reshaping a portion of the channels to the batch dimension and grouping the channel dimensions within each feature group. The aim is to achieve a uniform distribution of spatial semantic features in each feature group while also mitigating the potential side effects of channel dimension reduction during deep feature representation extraction. Furthermore, the internal network design of the EMA’s three branches enables cross-space feature fusion. Additionally, the four-layer architecture is designed so that three of the layers directly output to the detection head, allowing the model to focus on key target information.
- The neck feature fusion approach was reconfigured, replacing the original feature pyramid structure PAN with the generalized feature fusion paradigm (GFPN). In this study, we replaced the original ordinary connection mode with a dense link. Furthermore, C2f and the EMA were integrated into the generalized feature fusion paradigm to create a new internal fusion block. Ultimately, the design of cross-scale feature fusion enables better preservation of feature information in the shallow network.
2. Materials and Methods
2.1. Improved Backbone
2.2. Four-Layer Architecture Multi-Scale Attention Module
2.3. CE-GFPN
3. Experiments and Results
3.1. Dataset
3.2. Experiment Settings and Parameter Settings
3.3. Evaluation Metrics
3.4. Ablation Experiments
3.5. Comparative Experiment
3.6. Generalization Experiments
3.6.1. CPLID
3.6.2. Enhanced TLMDD
3.7. Visualization
4. Conclusions
Author Contributions
Funding
Data Availability Statement
Conflicts of Interest
References
- Li, Z.; Zhang, Y.; Wu, H.; Suzuki, S.; Namiki, A.; Wang, W. Design and application of a UAV autonomous inspection system for high-voltage power transmission lines. Remote Sens. 2023, 15, 865. [Google Scholar] [CrossRef]
- Liu, X.; Miao, X.; Jiang, H.; Chen, J. Data analysis in visual power line inspection: An in-depth review of deep learning for component detection and fault diagnosis. Annu. Rev. Control 2020, 50, 253–277. [Google Scholar] [CrossRef]
- Zhao, W.; Xu, M.; Cheng, X.; Zhao, Z. An insulator in transmission lines recognition and fault detection model based on improved faster RCNN. IEEE Trans. Instrum. Meas. 2021, 70, 5016408. [Google Scholar] [CrossRef]
- Ren, S.; He, K.; Girshick, R.; Sun, J. Faster R-CNN: Towards real-time object detection with region proposal networks. IEEE Trans. Pattern Anal. Mach. Intell. 2016, 39, 1137–1149. [Google Scholar] [CrossRef] [PubMed]
- Lin, T.Y.; Dollár, P.; Girshick, R.; He, K.; Hariharan, B.; Belongie, S. Feature pyramid networks for object detection. In Proceedings of the IEEE Conference on Computer Vision and Pattern Recognition, Honolulu, HI, USA, 21–26 July 2017; pp. 2117–2125. [Google Scholar]
- Liu, Y.; Huo, H.; Fang, J.; Mai, J.; Zhang, S. UAV transmission line inspection object recognition based on mask R-CNN. In Journal of Physics: Conference Series; IOP Publishing: Bristol, UK, 2019; Volume 1345, p. 062043. [Google Scholar]
- He, K.; Gkioxari, G.; Dollár, P.; Girshick, R. Mask r-cnn. In Proceedings of the IEEE International Conference on Computer Vision, Venice, Italy, 22–29 October 2017; pp. 2961–2969. [Google Scholar]
- Dong, C.; Zhang, K.; Xie, Z.; Shi, C. An improved cascade RCNN detection method for key components and defects of transmission lines. IET Gener. Transm. Distrib. 2023, 17, 4277–4292. [Google Scholar] [CrossRef]
- Cai, Z.; Vasconcelos, N. Cascade r-cnn: Delving into high quality object detection. In Proceedings of the IEEE Conference on Computer Vision and Pattern Recognition, Salt Lake City, UT, USA, 18–23 June 2018; pp. 6154–6162. [Google Scholar]
- Liu, Z.; Hu, H.; Lin, Y.; Yao, Z.; Xie, Z.; Wei, Y.; Ning, J.; Cao, Y.; Zhang, Z.; Dong, L.; et al. Swin transformer v2: Scaling up capacity and resolution. In Proceedings of the IEEE/CVF Conference on Computer Vision and Pattern Recognition, New Orleans, LA, USA, 18–24 June 2022; pp. 12009–12019. [Google Scholar]
- Pang, J.; Chen, K.; Shi, J.; Feng, H.; Ouyang, W.; Lin, D. Libra r-cnn: Towards balanced learning for object detection. In Proceedings of the IEEE/CVF Conference on Computer Vision and Pattern Recognition, Long Beach, CA, USA, 15–20 June 2019; pp. 821–830. [Google Scholar]
- Terven, J.; Cordova-Esparza, D. A comprehensive review of YOLO: From YOLOv1 to YOLOv8 and beyond. arXiv 2023, arXiv:2304.00501. [Google Scholar]
- Liu, Z.; Wu, G.; He, W.; Fan, F.; Ye, X. Key target and defect detection of high-voltage power transmission lines with deep learning. Int. J. Electr. Power Energy Syst. 2022, 142, 108277. [Google Scholar] [CrossRef]
- Bochkovskiy, A.; Wang, C.Y.; Liao, H.Y.M. YOLOv4: Optimal speed and accuracy of object detection. arXiv 2020, arXiv:2004.10934. [Google Scholar]
- Song, J.; Qin, X.; Lei, J.; Zhang, J.; Wang, Y.; Zeng, Y. A fault detection method for transmission line components based on synthetic dataset and improved YOLOv5. Int. J. Electr. Power Energy Syst. 2024, 157, 109852. [Google Scholar] [CrossRef]
- Woo, S.; Park, J.; Lee, J.Y.; Kweon, I.S. Cbam: Convolutional block attention module. In Proceedings of the European Conference on Computer Vision (ECCV), Munich, Germany, 8–14 September 2018; pp. 3–19. [Google Scholar]
- Zheng, J.; Wu, H.; Zhang, H.; Wang, Z.; Xu, W. Insulator-defect detection algorithm based on improved YOLOv7. Sensors 2022, 22, 8801. [Google Scholar] [CrossRef] [PubMed]
- Wang, C.Y.; Bochkovskiy, A.; Liao, H.Y.M. YOLOv7: Trainable bag-of-freebies sets new state-of-the-art for real-time object detectors. In Proceedings of the IEEE/CVF Conference on Computer Vision and Pattern Recognition, Vancouver, BC, Canada, 17–24 June 2023; pp. 7464–7475. [Google Scholar]
- Gevorgyan, Z. SIoU loss: More powerful learning for bounding box regression. arXiv 2022, arXiv:2205.12740. [Google Scholar]
- Wu, Y.; Liao, T.; Chen, F.; Zeng, H.; Ouyang, S.; Guan, J. Overhead Power Line Damage Detection: An Innovative Approach Using Enhanced YOLOv8. Electronics 2024, 13, 739. [Google Scholar] [CrossRef]
- Li, H.; Li, J.; Wei, H.; Liu, Z.; Zhan, Z.; Ren, Q. Slim-neck by GSConv: A better design paradigm of detector architectures for autonomous vehicles. arXiv 2022, arXiv:2206.02424. [Google Scholar]
- Wang, X.; Gao, H.; Jia, Z.; Li, Z. BL-YOLOv8: An improved road defect detection model based on YOLOv8. Sensors 2023, 23, 8361. [Google Scholar] [CrossRef]
- Cao, Y.; Pang, D.; Zhao, Q.; Yan, Y.; Jiang, Y.; Tian, C.; Wang, F.; Li, J. Improved YOLOv8-GD deep learning model for defect detection in electroluminescence images of solar photovoltaic modules. Eng. Appl. Artif. Intell. 2024, 131, 107866. [Google Scholar] [CrossRef]
- Feng, C.; Zhong, Y.; Gao, Y.; Scott, M.R.; Huang, W. Tood: Task-aligned one-stage object detection. In Proceedings of the 2021 IEEE/CVF International Conference on Computer Vision (ICCV), Montreal, QC, Canada, 10–17 October 2021; pp. 3490–3499. [Google Scholar]
- Goyal, A.; Bochkovskiy, A.; Deng, J.; Koltun, V. Non-deep networks. Adv. Neural Inf. Process. Syst. 2022, 35, 6789–6801. [Google Scholar]
- Hu, J.; Shen, L.; Sun, G. Squeeze-and-excitation networks. In Proceedings of the IEEE Conference on Computer Vision and Pattern Recognition, Salt Lake City, UT, USA, 18–23 June 2018; pp. 7132–7141. [Google Scholar]
- Ouyang, D.; He, S.; Zhang, G.; Luo, M.; Guo, H.; Zhan, J.; Huang, Z. Efficient multi-scale attention module with cross-spatial learning. In Proceedings of the ICASSP 2023–2023 IEEE International Conference on Acoustics, Speech and Signal Processing (ICASSP), Rhodes Island, Greece, 4–10 June 2023; pp. 1–5. [Google Scholar]
- Hou, Q.; Zhou, D.; Feng, J. Coordinate attention for efficient mobile network design. In Proceedings of the IEEE/CVF Conference on Computer Vision and Pattern Recognition, Virtual, 19–25 June 2021; pp. 13713–13722. [Google Scholar]
- Liu, S.; Qi, L.; Qin, H.; Shi, J.; Jia, J. Path aggregation network for instance segmentation. In Proceedings of the IEEE Conference on Computer Vision and Pattern Recognition, Salt Lake City, UT, USA, 18–23 June 2018; pp. 8759–8768. [Google Scholar]
- Tan, M.; Pang, R.; Le, Q.V. Efficientdet: Scalable and efficient object detection. In Proceedings of the IEEE/CVF Conference on Computer Vision and Pattern Recognition, Seattle, WA, USA, 14–19 June 2020; pp. 10781–10790. [Google Scholar]
- Jiang, Y.; Tan, Z.; Wang, J.; Sun, X.; Lin, M.; Li, H. Giraffedet: A heavy-neck paradigm for object detection. arXiv 2022, arXiv:2202.04256. [Google Scholar]


| Item | Value |
|---|---|
| CPU | 18 vCPU AMD EPYC 9754 128-Core Processor |
| GPU | NVIDIA GeForce RTX 4090D(24GB) |
| Python | 3.9 |
| Pytorch | 2.0 |
| CUDA | 11.8 |
| Parameter | Value |
|---|---|
| Epochs | 300 |
| Batch size | 32 |
| Workers | 8 |
| Optimizer | SGD |
| Learning rate | 0.01 |
| Momentum | 0.973 |
| C2f_Par | EMA | CE- GFPN | Insulator | Insulator Defect | Ring Defect | Gasket Missing | Pin Defect |
|---|---|---|---|---|---|---|---|
| - | - | - | 91.6 | 76.4 | 53.4 | 69.8 | 25.2 |
| √ | - | - | 94.1 | 79.2 | 57.3 | 72.8 | 21.5 |
| - | √ | - | 93.7 | 80.8 | 62.1 | 72.1 | 29.5 |
| - | - | √ | 92.8 | 83.7 | 59.1 | 72.2 | 28.7 |
| √ | √ | - | 93.3 | 81.2 | 62.9 | 72.9 | 28.4 |
| √ | - | √ | 93.2 | 82.2 | 60.1 | 71.9 | 33.4 |
| √ | √ | √ | 93 | 82.3 | 74.5 | 73.1 | 26.3 |
| C2f_Par | EMA | CE-GFPN | mAP@50 | mAP@50-95 |
|---|---|---|---|---|
| - | - | - | 63.3 | 38.1 |
| √ | - | - | 65 | 41 |
| - | √ | - | 67.6 | 42.9 |
| - | - | √ | 67.3 | 43.3 |
| √ | √ | - | 67.7 | 43.1 |
| √ | - | √ | 68.2 | 44.9 |
| √ | √ | √ | 69.9 | 45.7 |
| Method | P | R | mAP@50 | mAP@50-95 |
|---|---|---|---|---|
| Base | 63.2 | 66.3 | 63.3 | 38.1 |
| Base + SE | 58.6 | 66.4 | 63.9 | 40.5 |
| Base + CA | 59.9 | 65.1 | 64.1 | 41.4 |
| Base + NAM | 62.5 | 63.8 | 64.8 | 42.7 |
| Base + ECA | 63.9 | 65.2 | 65.6 | 43.1 |
| Base + EMA | 67.5 | 66.6 | 67.6 | 42.9 |
| Method | P | R | mAP@50 | mAP@50-95 |
|---|---|---|---|---|
| Base + PAN | 63.2 | 66.3 | 63.3 | 38.1 |
| Base + AFPN | 63.5 | 66.5 | 64.6 | 45 |
| Base + BiFPN | 64.2 | 63.9 | 63.7 | 37.3 |
| Base + GFPN | 63.1 | 68.2 | 67.3 | 43.3 |
| Method | mAP@50 | mAP@50-95 | Parameters (MB) | GFLOPs (G) | FPS |
|---|---|---|---|---|---|
| Faster-RCNN | 59.7 | 37.5 | 41.4 | 70.1 | 38 |
| Cascade-RCNN | 65.9 | 40.5 | 69.2 | 98.6 | 33 |
| YOLOv5n | 63 | 38.2 | 2.5 | 7.1 | 90 |
| YOLOv6n | 62.2 | 38.4 | 4.2 | 11.8 | 99 |
| YOLOv8n | 63.3 | 38.1 | 3.1 | 8.1 | 86 |
| YOLOv8s | 67.6 | 44.7 | 11 | 28.4 | 80 |
| RT-DETR | 58.1 | 37.9 | 32 | 103.5 | 31 |
| PGE-YOLO | 69.9 | 45.7 | 3.5 | 9.1 | 81 |
| Metrics | Faster RCNN | Cascade RCNN | YOLOv5 | YOLOv8 | PGE-YOLO |
|---|---|---|---|---|---|
| P | 85.5 | 93.1 | 98.5 | 98.5 | 97.1 |
| R | 86.9 | 96.9 | 96.3 | 95.8 | 97.9 |
| mAP@50 | 88.4 | 97.3 | 98.3 | 97.8 | 99 |
| mAP@50-95 | 59.1 | 73.7 | 79.9 | 80 | 81.5 |
| Metrics | Faster RCNN | Cascade RCNN | YOLOv5 | YOLOv8 | PGE-YOLO |
|---|---|---|---|---|---|
| P | 65.7 | 71.2 | 77.9 | 79 | 83.9 |
| R | 55.7 | 60.2 | 78 | 80 | 81.2 |
| mAP@50 | 71.9 | 80.2 | 82 | 84.2 | 86.2 |
| mAP@50-95 | 42.3 | 52 | 57.7 | 57.8 | 61 |
Disclaimer/Publisher’s Note: The statements, opinions and data contained in all publications are solely those of the individual author(s) and contributor(s) and not of MDPI and/or the editor(s). MDPI and/or the editor(s) disclaim responsibility for any injury to people or property resulting from any ideas, methods, instructions or products referred to in the content. |
© 2024 by the authors. Licensee MDPI, Basel, Switzerland. This article is an open access article distributed under the terms and conditions of the Creative Commons Attribution (CC BY) license (https://creativecommons.org/licenses/by/4.0/).
Share and Cite
Cai, Z.; Wang, T.; Han, W.; Ding, A. PGE-YOLO: A Multi-Fault-Detection Method for Transmission Lines Based on Cross-Scale Feature Fusion. Electronics 2024, 13, 2738. https://doi.org/10.3390/electronics13142738
Cai Z, Wang T, Han W, Ding A. PGE-YOLO: A Multi-Fault-Detection Method for Transmission Lines Based on Cross-Scale Feature Fusion. Electronics. 2024; 13(14):2738. https://doi.org/10.3390/electronics13142738
Chicago/Turabian StyleCai, Zixuan, Tianjun Wang, Weiyu Han, and Anan Ding. 2024. "PGE-YOLO: A Multi-Fault-Detection Method for Transmission Lines Based on Cross-Scale Feature Fusion" Electronics 13, no. 14: 2738. https://doi.org/10.3390/electronics13142738
APA StyleCai, Z., Wang, T., Han, W., & Ding, A. (2024). PGE-YOLO: A Multi-Fault-Detection Method for Transmission Lines Based on Cross-Scale Feature Fusion. Electronics, 13(14), 2738. https://doi.org/10.3390/electronics13142738