Article

Determination of Parameters of Radio Frequency Identification Transponder Antennas Dedicated to IoTT Systems Located on Non-Planar Objects

by
Magdalena Nizioł
1,*,
Piotr Jankowski-Mihułowicz
2,* and
Mariusz Węglarski
2
1
Department of Metrology and Diagnostic Systems, Rzeszów University of Technology, Wincentego Pola 2, 35-959 Rzeszów, Poland
2
Department of Electronic and Telecommunications Systems, Rzeszów University of Technology, Wincentego Pola 2, 35-959 Rzeszów, Poland
*
Authors to whom correspondence should be addressed.
Electronics 2024, 13(14), 2800; https://doi.org/10.3390/electronics13142800
Submission received: 30 June 2024 / Revised: 11 July 2024 / Accepted: 15 July 2024 / Published: 16 July 2024
(This article belongs to the Special Issue Antennas for IoT Devices)

Abstract

:
Integration of Radio Frequency Identification (RFID) technology with conductive textiles has greatly expanded the possibilities for creating smart devices that fit perfectly into the concept of the Internet of Things. The use of e-textiles for antenna manufacturing has enabled the development of a textronic RFID tag. Integration of such tags into products with often non-flat surfaces may result in exposure to changes in antenna geometry caused by bending. As a result, the antenna parameters may change, resulting in disruption of the entire tag operation. The authors, through simulation and experimental studies, analyzed the effects of bending the antennas of RFID tags operating in the HF (High Frequency) band.

1. Introduction

The first mentions of the concept of the Internet of Things (IoT) appeared in the last century, but with rapidly progressing technological developments, it has gained importance in recent years [1,2]. This concept assumes the creation of a wired or wireless network of interconnected devices within which it will be possible to acquire, process and exchange data. The implementation of such a solution enables us, among other things, to increase the automation of many processes in various industries.
The concept of the Internet of Things is extremely broad and can cover almost any sector using intelligent systems. Considerable specialization in narrow thematic areas has resulted in the gradual introduction of more precise, industry-specific definitions of this concept, e.g., the Internet of Medical Things [3,4], the Industrial Internet of Things [5], the Internet of Military Things [6,7,8], and the Internet of Musical Things [9,10]. The increasing integration of textile materials with smart devices encourages us to narrow-down the definition of this research area to the Internet of Textile Things (IoTT).
Radio Frequency Identification (RFID) technology is significantly important to the context of IoT, as it significantly expands the possibilities of creating intelligent solutions, such as in healthcare [11,12,13], inventory or supply chain management [14,15,16,17], or access control [18,19].
RFID systems consist of a reader (management unit that can be connected to the Internet) and a tag (wireless communication with the reader). The RFID tag is made of a microelectronic chip with an antenna. Tags can be passive, semi-passive, or active, and operate in different frequency bands, which will directly determine the operating range. In the case of tags operating in the HF (High Frequency) band with an operating frequency of f0 = 13.56 MHz, the range is usually up to approximately 1 m. The antenna of such a tag is a loop, usually rectangular, with specific parameters—considering a series model: series resistance RS and series inductance LS, which form a resonant circuit with the chip capacitance (CTC) (Figure 1). For the tag to work properly and effectively, the antenna must be well matched to the system, therefore great care must be taken both during its design and synthesis.
The progressive miniaturization of tags along with the increasing popularization of electroconductive textile materials enables the use of RFID systems in the wearable devices sector, which are extremely popular in many applications. To integrate RFID technology and textronics, the concept of textronic tags [20,21] has been developed, in which the chip is in the form of a semi-finished product (e.g., a button), and the antenna made of e-textile material is embroidered or ironed into a classic textile base. This type of tag can be incorporated into target products (e.g., clothes) in an almost invisible way, and their flexibility does not limit the functionality of the product or the comfort of its use.
One of the problems that RFID tags (including those used in the textile industry) are exposed to is a change in the geometry of the antenna caused by the curvature of the object (usually cylindrical) on which it is placed. A situation of this type occurs when building RFID systems for monitoring marked bottles [22,23,24] or collecting selected medical data [25,26,27] (the curvature of transponders placed, e.g., around the wrist can be approximated by the curvature of cylindrical objects).
The impact of an antenna’s curvature on its parameters is an issue often analyzed by researchers, and it concerns several types of antennas [28,29,30]. In the case of RFID tags, in certain situations any change in antenna parameters can be a very significant problem. Therefore, the authors decided to investigate this and analyze the dependence of the resistance and inductance of the antenna loops of textronic HF band tags on their curvature.
In the literature cited in the previous two paragraphs, researchers mainly analyzed the parameters of the scattering matrix, antenna gain, and induced voltage. The study of the parameters selected by the authors constitutes a slightly more in-depth analysis of the problem, because the cause of the effects presented by others is analyzed.

2. Materials and Methods

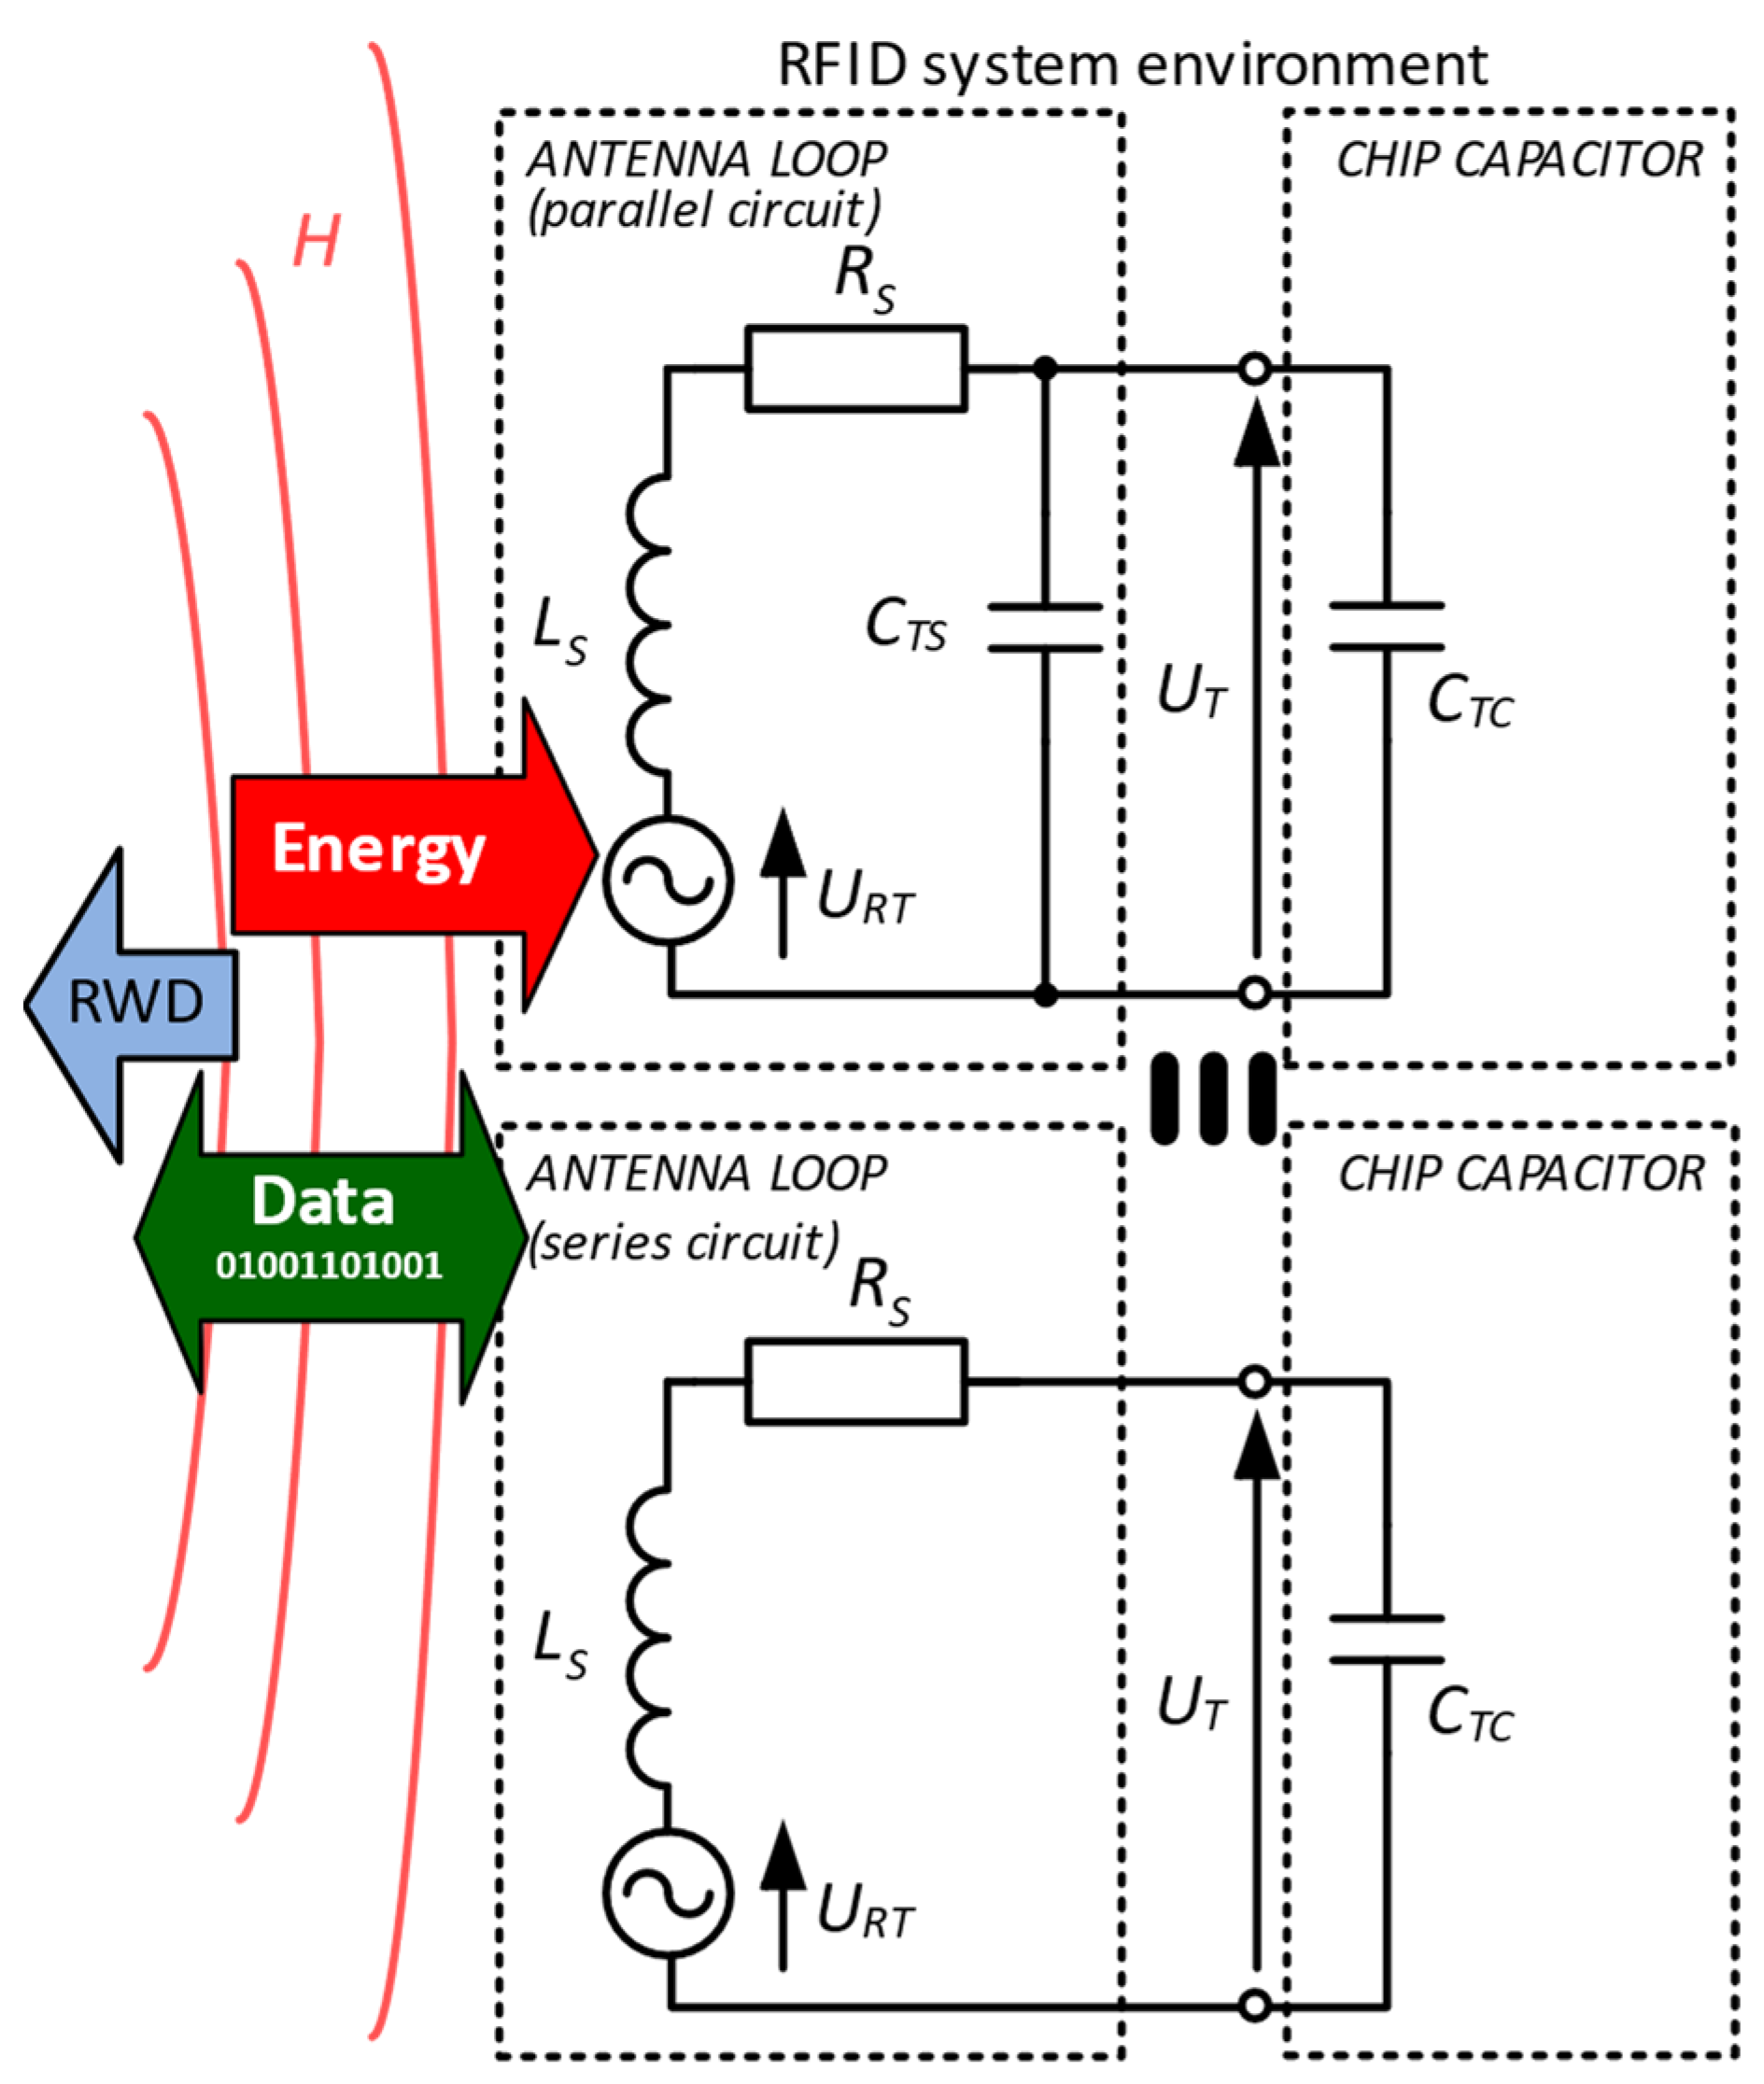
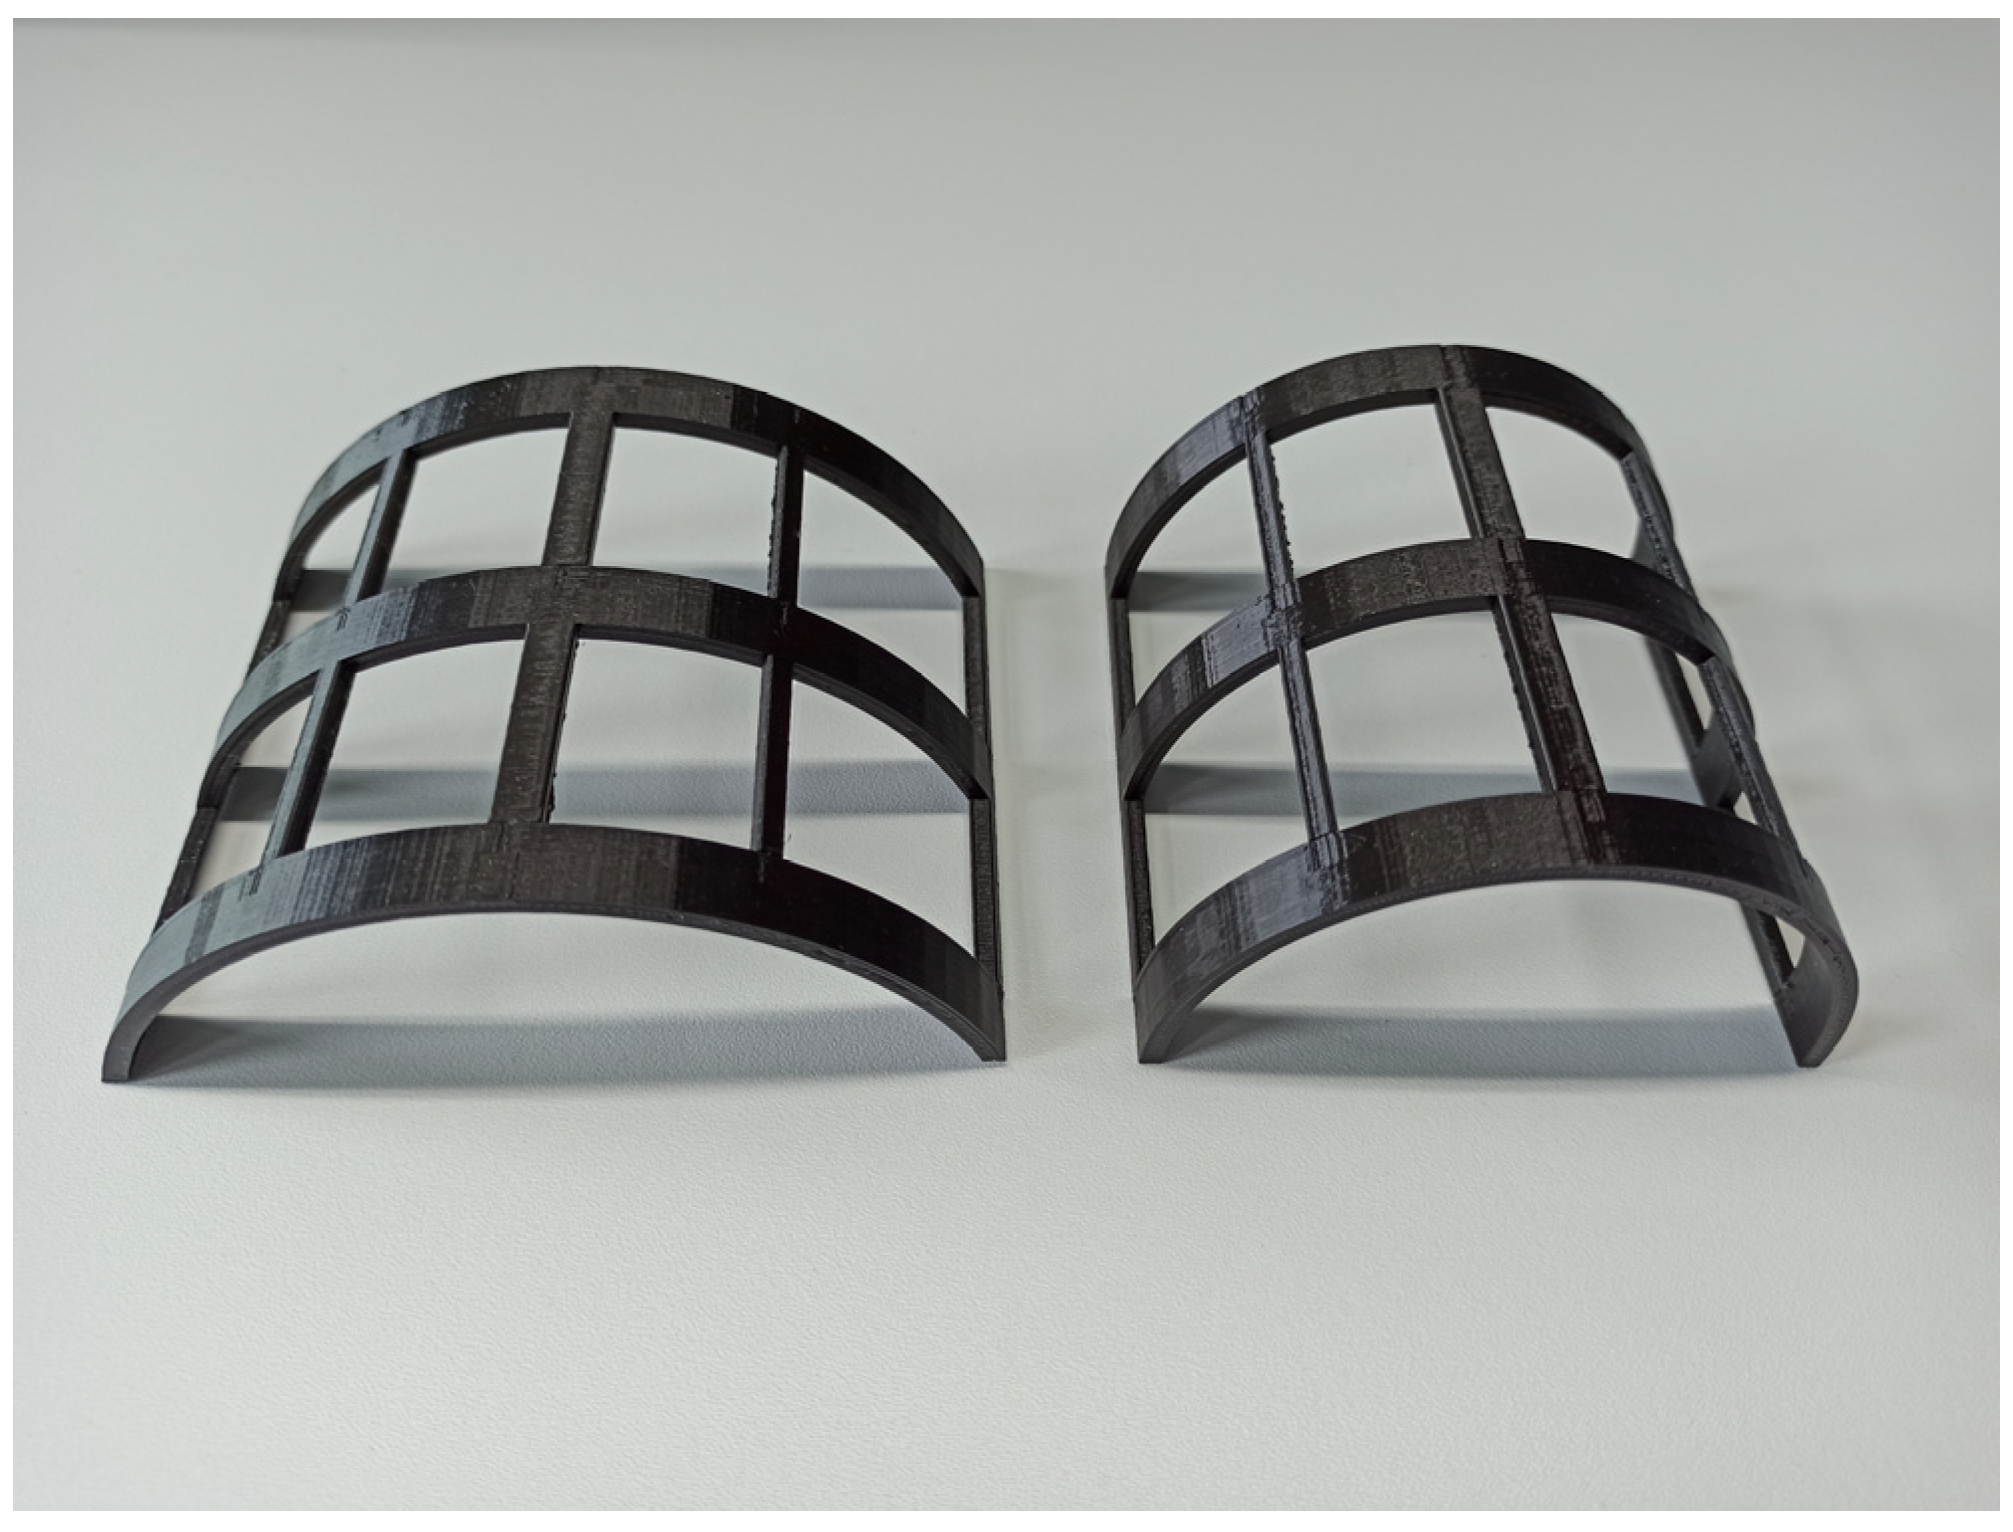
2.1. HF RFID Transponder Textile Antenna

One of the areas covered by the research team, which includes the authors of the article, is the integration of RFID technology with textile products. P. Jankowski-Mihułowicz and M. Węglarski in the patent PL 231291 B1 [31] (Polish Patent Office) presented the concept of a textronic RFID tag in which the antenna is integrated with the textile substrate and the chip is present in a separate semi-finished product (button).
As the test object, the authors decided to use an RFID tag operating in the HF band, which could be integrated with textile products and would enable its use in systems (using typical mobile devices such as smartphones or tablets with RFID interface and NFC functions) for access control (tag integrated directly with clothing or in the form of a dedicated wristband), tracking textile products, or monitoring specific parameters (e.g., temperature). In the context of IoTT, an equally interesting application may be the use of such a tag as a ski pass sewn directly onto a ski jacket (e.g., sleeve).
SL13A from AMS (now ams-OSRAM AG—Premstaetten, Austria) was chosen as the integrated circuit that would create the test tag. Although it is now considered obsolete and has therefore been decommissioned, it is still an interesting alternative. It is a circuit operating in semi-passive or passive mode in the HF band (f0 = 13.56 MHz). It has a built-in temperature sensor, so it is used in monitoring temperature-sensitive products, including medical devices.
The HF tag antenna is a (usually) rectangular coil with a specific inductance, the target value of which results from the chip capacitance—the antenna and the chip form a parallel LC resonant circuit with a resonant frequency equal to the tag’s operating frequency—then the best conditions for data and energy transmission are ensured. The value of the antenna inductance can be determined using the Equation (1).
L = 1 4 π 2 f 0 2 C T
The capacitance CT of the selected chip was 25 pF. Using the Equation (1), the value of the antenna loop inductance L was calculated to be 5.51 µH.
To determine the geometric dimensions of the antenna loop that can enable us to obtain the assumed inductance value, ready-made toolkits from chip manufacturers can be used, which significantly support the design processes.
An example of such a tool is eDesignSuite (Figure 2) from STMicroelectronics (Plan-les-Ouates, Switzerland), which was used during the antenna-design process. The designed antenna loop was shaped like a square with a side of 80.2 mm, the distance between the turns was 1 mm, and the number of turns was 5. The average conductor width was assumed to be 0.2 mm. The theoretical value of the inductance of such a loop is equal to 5.55 µH (Figure 3), which is a satisfactory result—the synthesis process of the prepared project could be started.
The designed antenna is intended to be an integral part of the textile product; therefore, a linen fabric (Tkaniny24.pl—Iława, Poland) (substrate) and an electrically conductive thread (antenna loop geometry) were used for its production. The model piece was made using Adafruit 640 thread (Adafruit Industries—New York City, NY, USA), which is a 2 ply 316L stainless steel thread.
The developed geometry was exported to an embroidery machine program and sewn. Moreover, to facilitate tag testing, the antenna was immediately integrated with the button (small PCB) on which the chip was located. A photograph of the completed antenna is shown in Figure 4.
Placing the chip on the PCB in the form of a button allows for the aesthetic integration of the tag with textile industry products, including clothes. In the created tag, the antenna and the chip must be connected by wire. The conductive thread is connected to the chip pins through prepared vias, the spacing of which resembles classic solutions from the clothing sector. The sewn antenna differs slightly from the design—visible rounding on the corners is the result of an imperfect embroidery process, which depends, among other things, on the set speed, stitch length and thread tension.

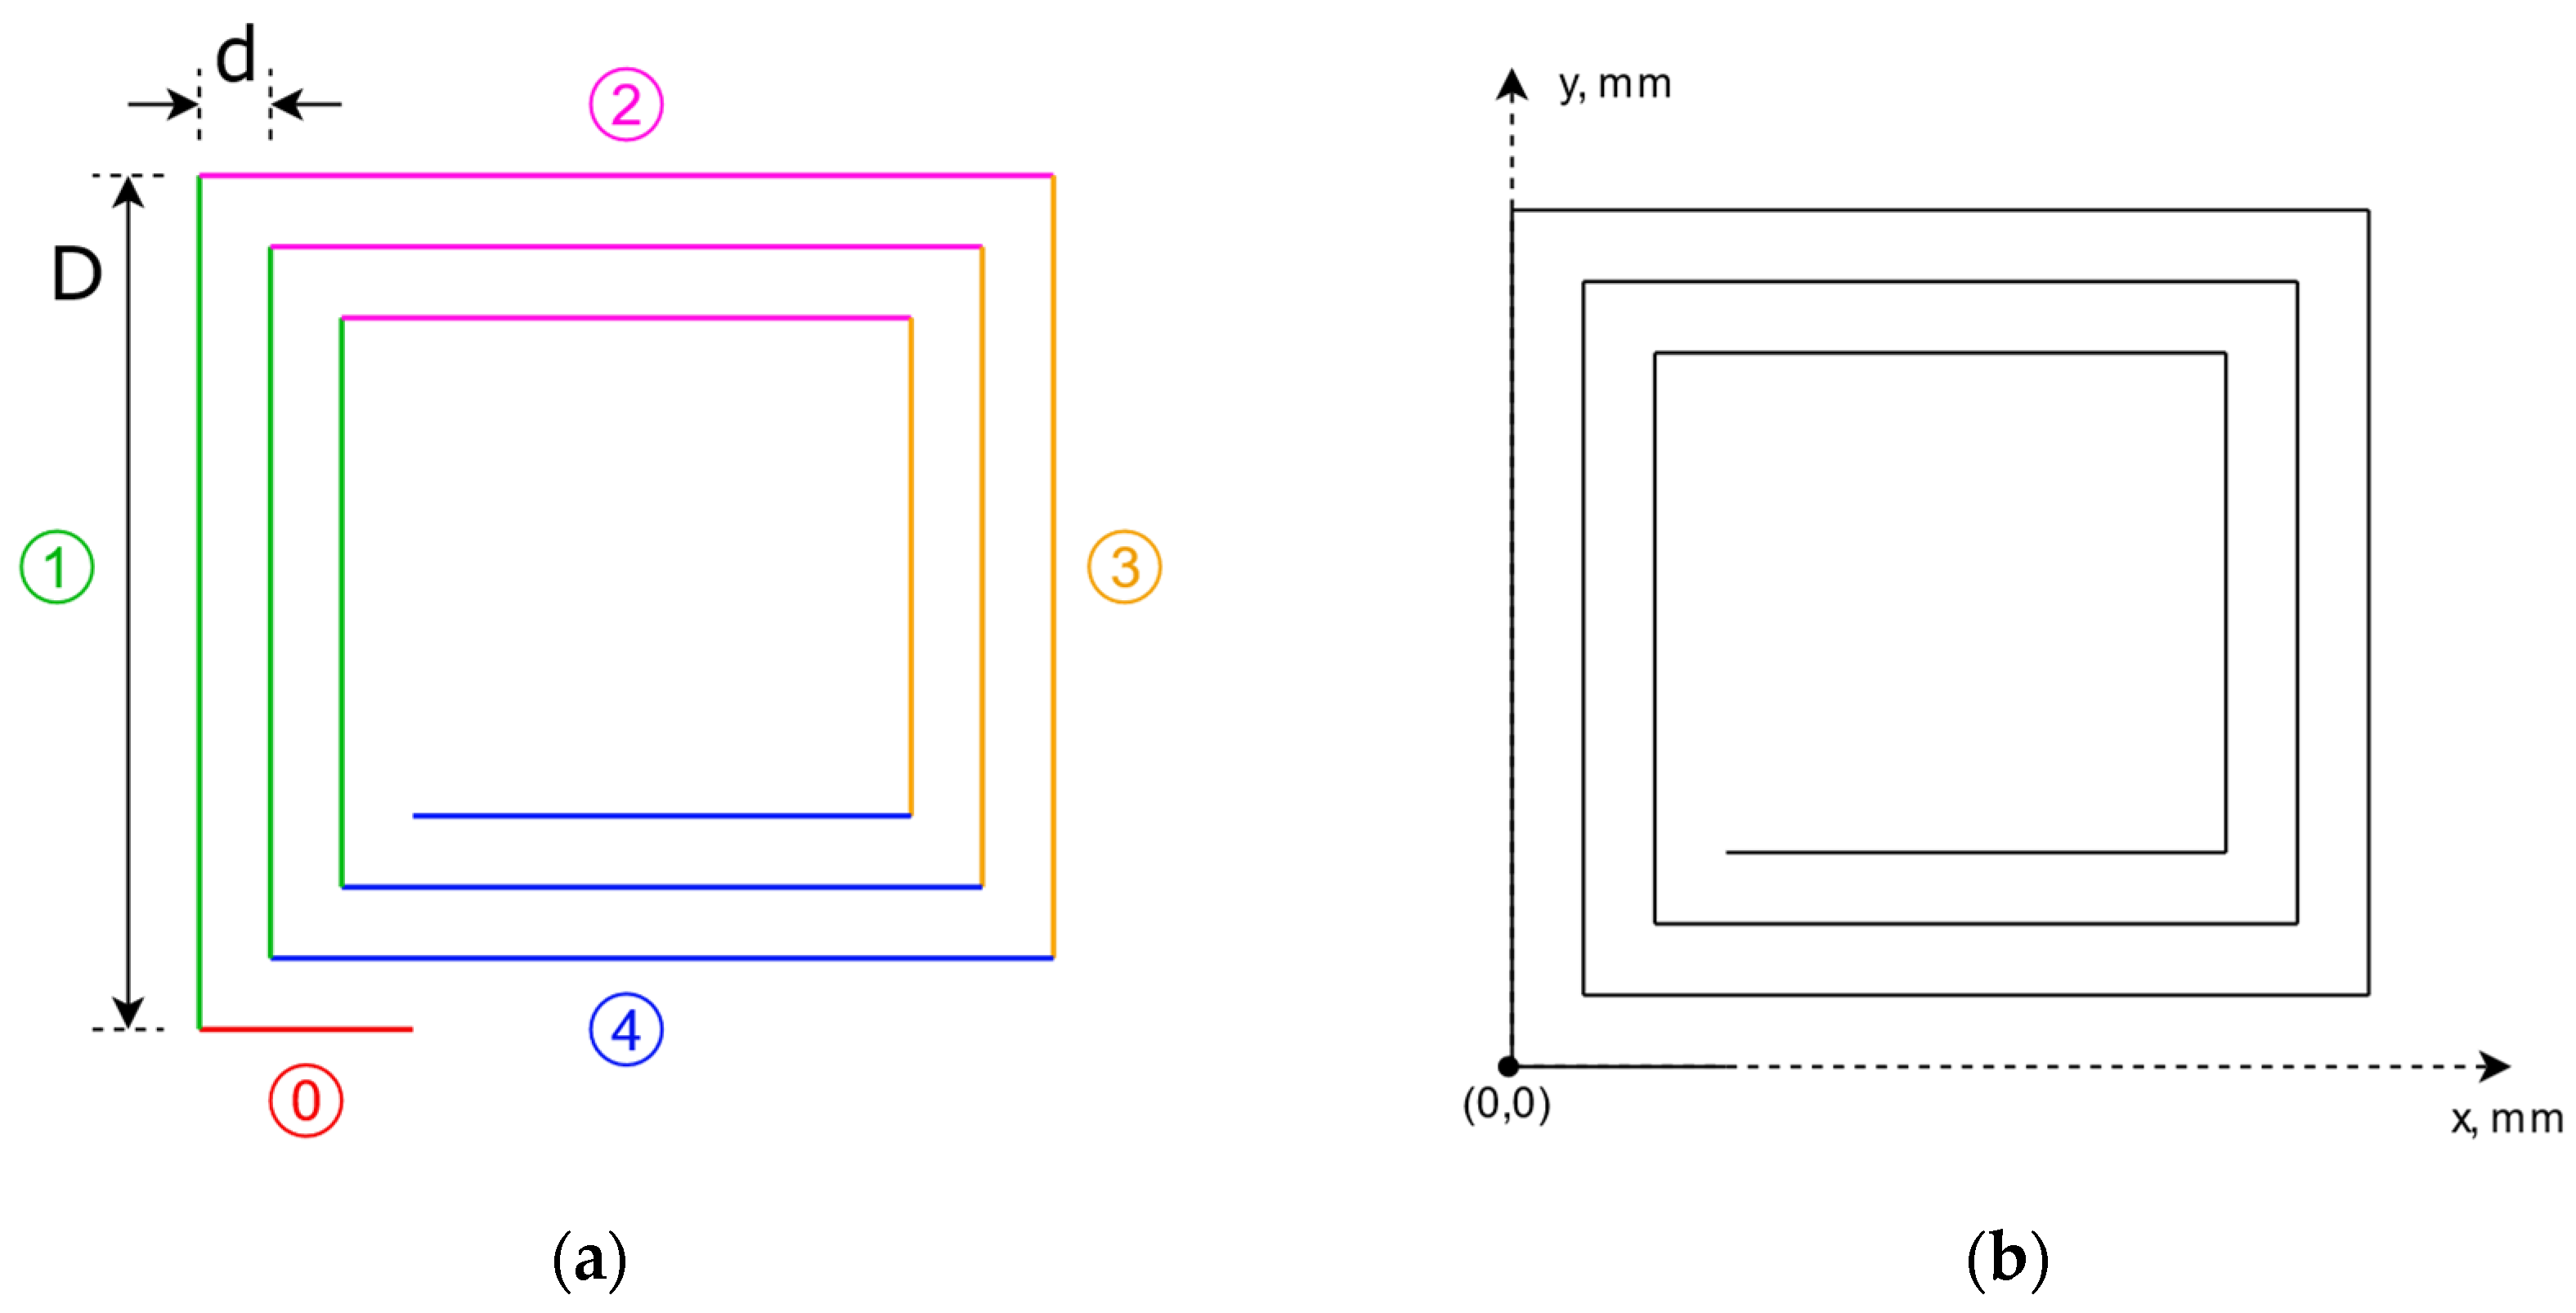
2.2. Parametric Model

The basis for conducting numerical analyses of the tested antennas is the development of a universal parametric model that will enable the automation of the simulation research stage.
Due to the geometric shape of the designed antenna, before describing its model with parametric equations, it should be divided into smaller sections and the origin of the co-ordinate system should be determined (Figure 5).
The symbol D denotes the length/width of the antenna (if the antenna is rectangular instead of square, then its width and length can be distinguished into DX and DY), and d the gap between successive turns. The adopted origin of the co-ordinate system and the division of the antenna loop into 5 sections (marked with different colors for easier distinguishment) ensured that its beginning and end aligned with each other, while maintaining the full number of turns. The parametric form of individual sections is described by the Equations (2)–(11).
Section 0:
x 0 = N · d t · N · d
y 0 = 0 + t · 0
Section 1:
x 1 = d · i + t · 0
y 1 = i · d + t · D 2 · i · d
Section 2:
x 2 = i · d + t · D 2 · i · d
y 2 = D i · d + t · 0
Section 3:
x 3 = D i · d + t · 0
y 3 = D i · d + t · i + 1 · d D + i · d
Section 4:
x 4 = D i · d + t · i + 1 · d D + i · d
y 4 = i + 1 · d + t · 0
In the presented equations, the symbol N denotes the number of antenna turns, and i—the index of subsequent iterations, varying in the range from 0 to N − 1. The t parameter varies in the range from 0 to 1.
The bending model requires the introduction of a third dimension. Sections 1 and 3 are analogous to the flat model (only the height of subsequent turns changes, directly determined by the distance between the turns). Sections 0, 2, and 4 can be described using semicircle equations, the general form of which is written as Formulas (12) and (13).
x = x 0 + R · sin α · t + β
y = y 0 + R · cos α · t + β
In these equations, x0, y0 denote the center of the circle, R—the length of the radius, α—the central angle of the circle, β—the initial angle (counterclockwise), t—parameter, t ∈ [0, 1]. The graphical representation of individual parameters is shown in Figure 6.
In Figure 6a, arc D represents the length of the first turn. In Figure 6b, the black arc (on the bottom) represents the turn with index i, while the red arc (on the top) represents the turn with index i + 1. The turns are numbered in ascending order towards the center of the antenna loop.
The height of subsequent turns of the antenna loop is regulated by the initial angle. The part of the circle arc defined as d, as in the case of the flat model, is the gap between the turns, and this is a known value. The value of the radius R will also be known, therefore, by transforming the formula of the arc length into the angle (14)–(15); the parametric Equations (16)–(30) of individual sections can be related to the geometric dimensions of the antenna and the object that will determine its curvature. From an engineering point of view, this is a more advantageous solution because it is easier and faster to determine the radius of the target object (by measuring its circumference or diameter) than to determine the values of individual angles.
α = D R   [ r a d ]
β = d R   [ r a d ]
Section 0:
x 0 = R + R · cos t · N · d R + D R N · d R
y 0 = 0 + t · 0
z 0 = R · sin t · N · d R + D R N · d R
Section 1:
x 1 = R + R cos D R i · d R + t · 0
y 1 = i · d + t · D 2 · i · d
z 1 = R sin t · i · d R + D R i · d R
Section 2:
x 2 = R + R · cos D R 2 · i · d R · t + i · d R
y 2 = D i · d + t · 0
z 2 = R · sin D R 2 · i · d R · t + i · d R
Section 3:
x 3 = R + R · cos i · d R + t · 0
y 3 = D i · d + t · i + 1 · d D + i · d
z 3 = R · sin i · d R + t · 0
Section 4:
x 4 = R + R · c o s D R 2 · i + 1 · d R · t + i · d R
y 4 = i + 1 · d + t · 0
z 4 = R · s i n D R 2 · i + 1 · d R · t + i · d R
The determined parametric equations were used to create 3D models of antenna loops (Figure 7) in the DesignSpark Mechanical program, although it is possible to implement them in any CAD program enabling mathematical modeling of geometry.
The created models were exported to STEP files, which enabled their subsequent import into the EMCoS Studio environment, where the geometry was assigned the attributes of real electroconductive threads, and an electromagnetic analysis was performed.

3. Results

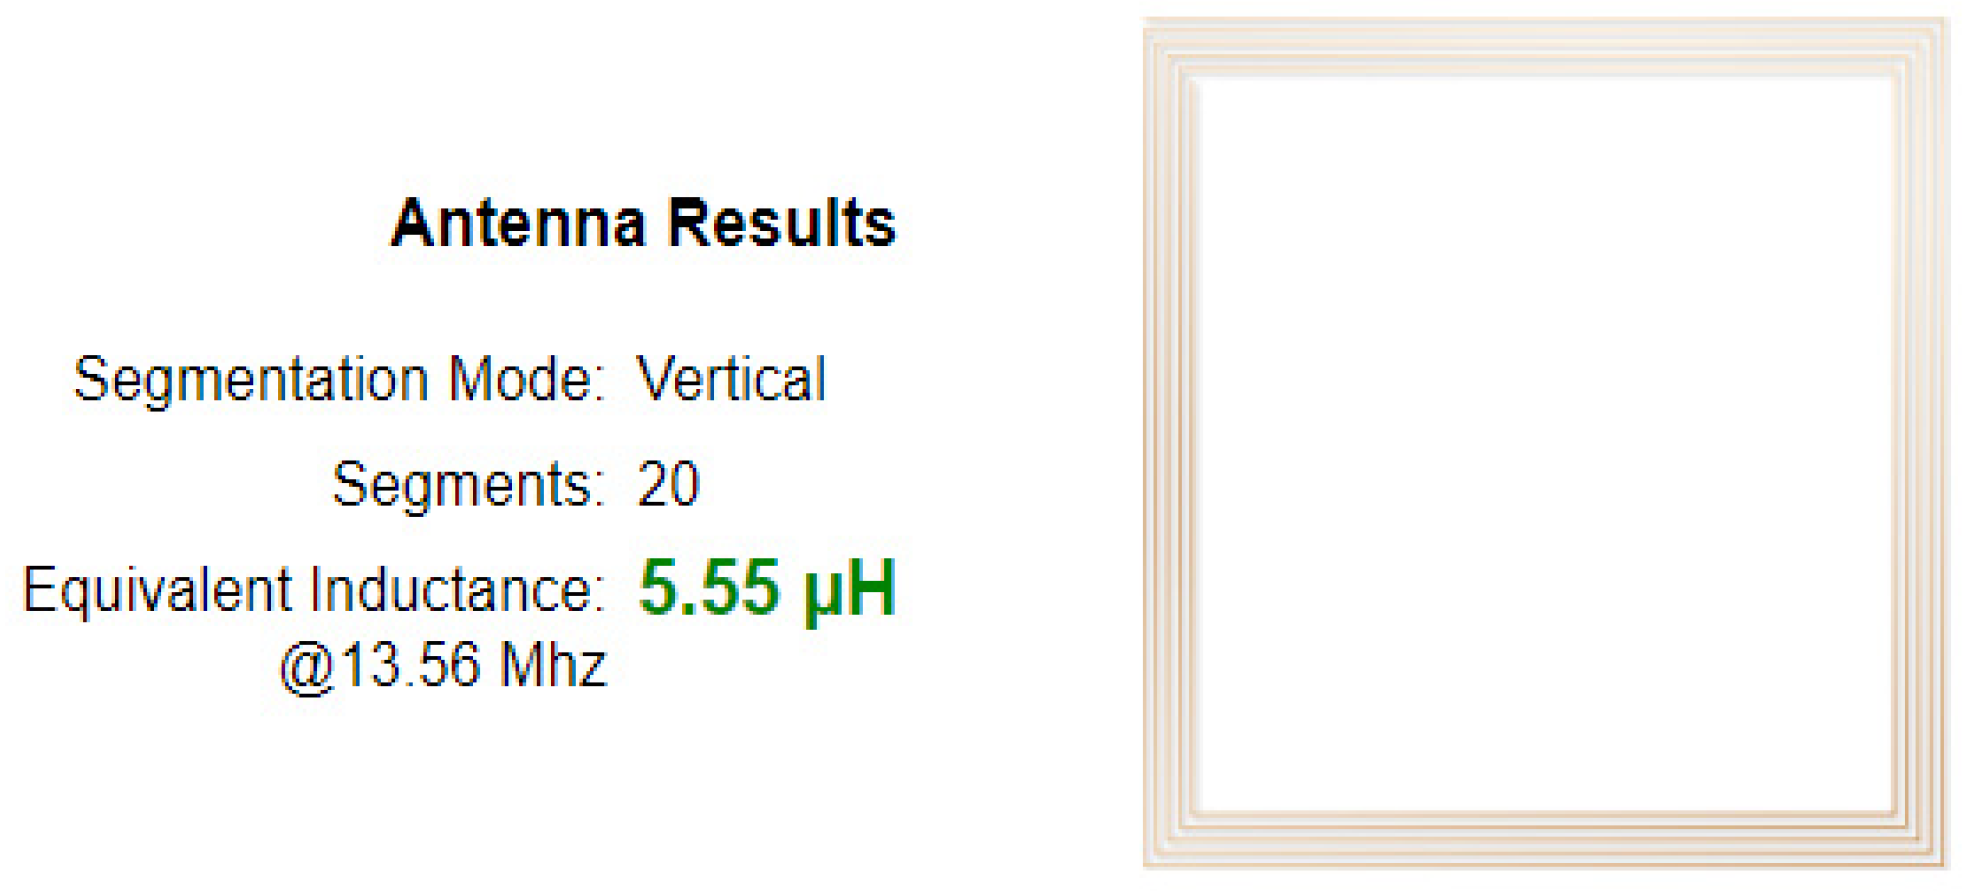
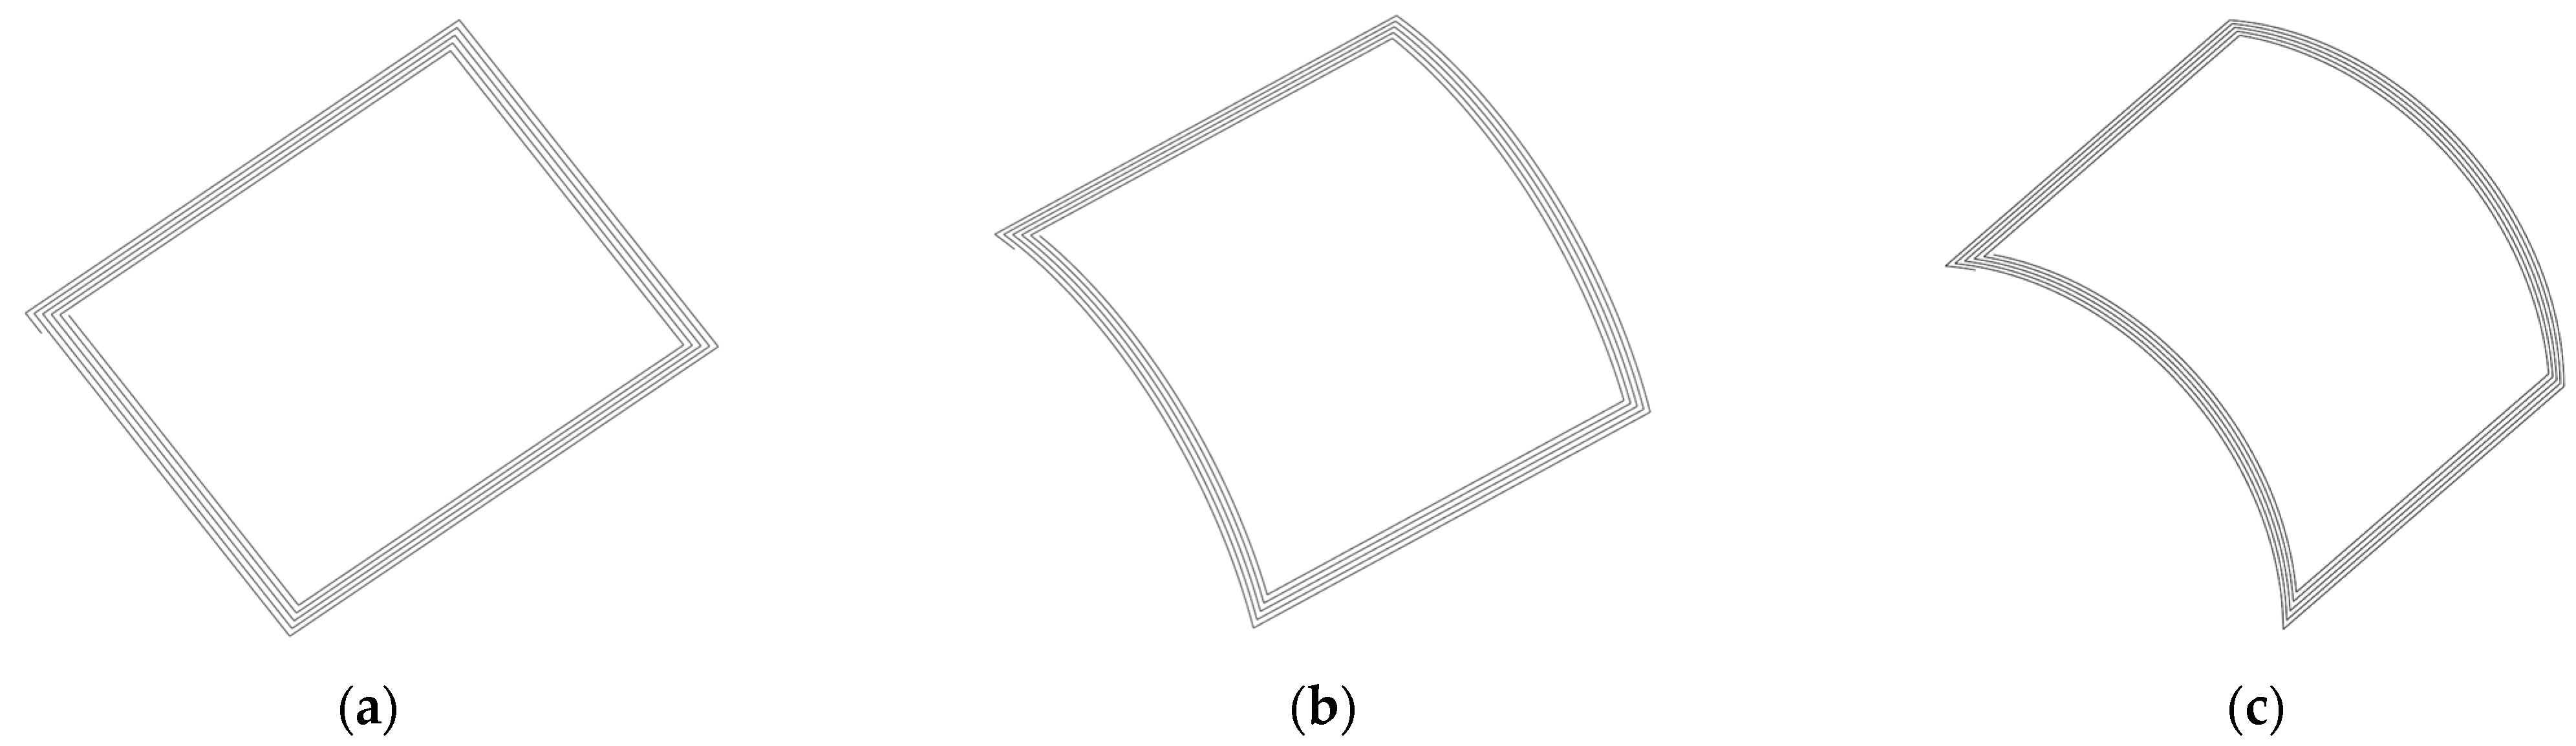
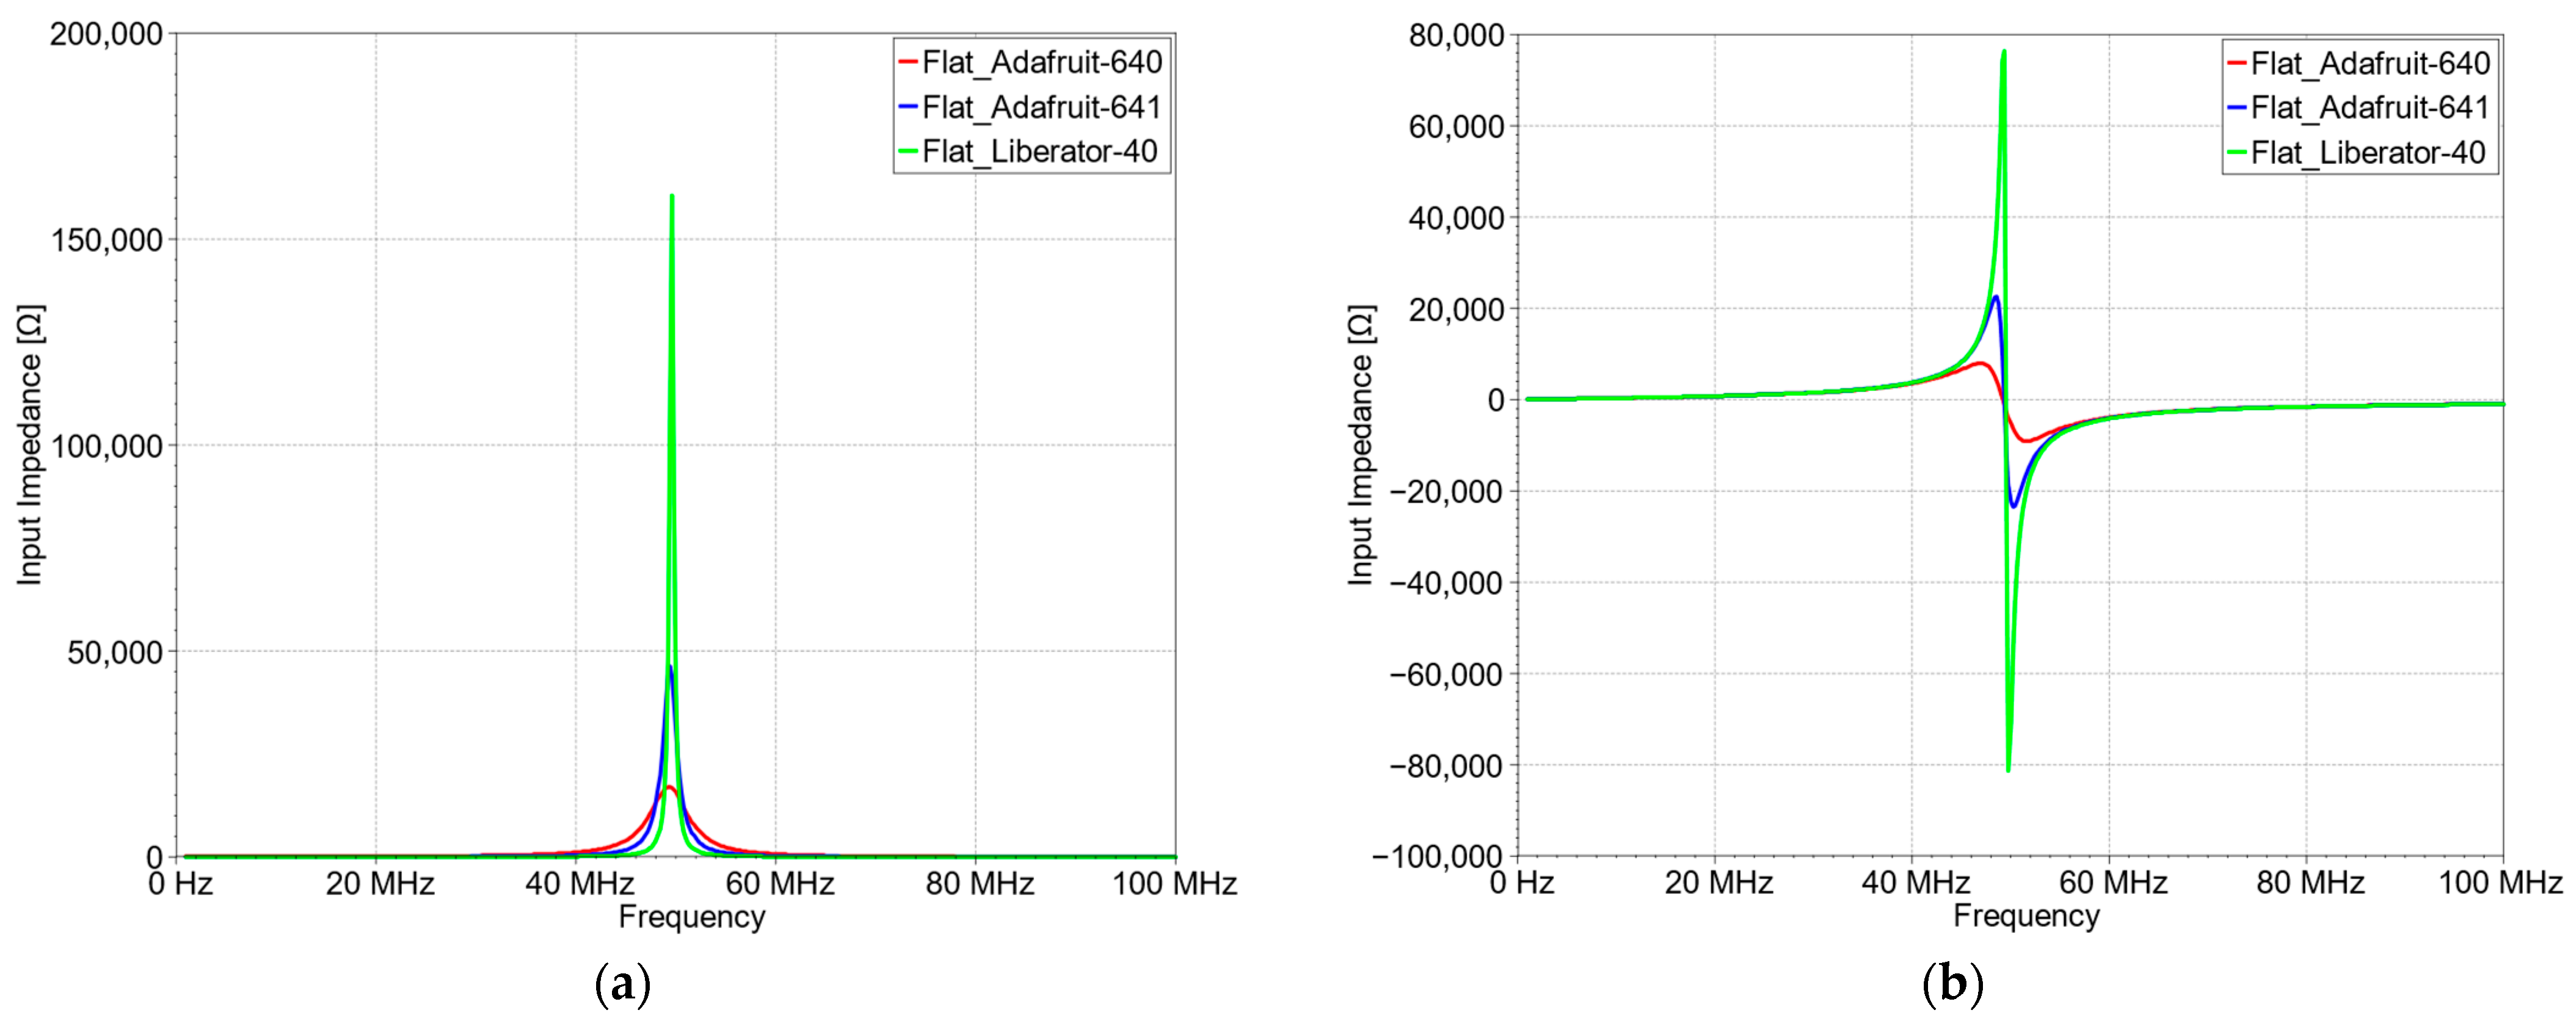
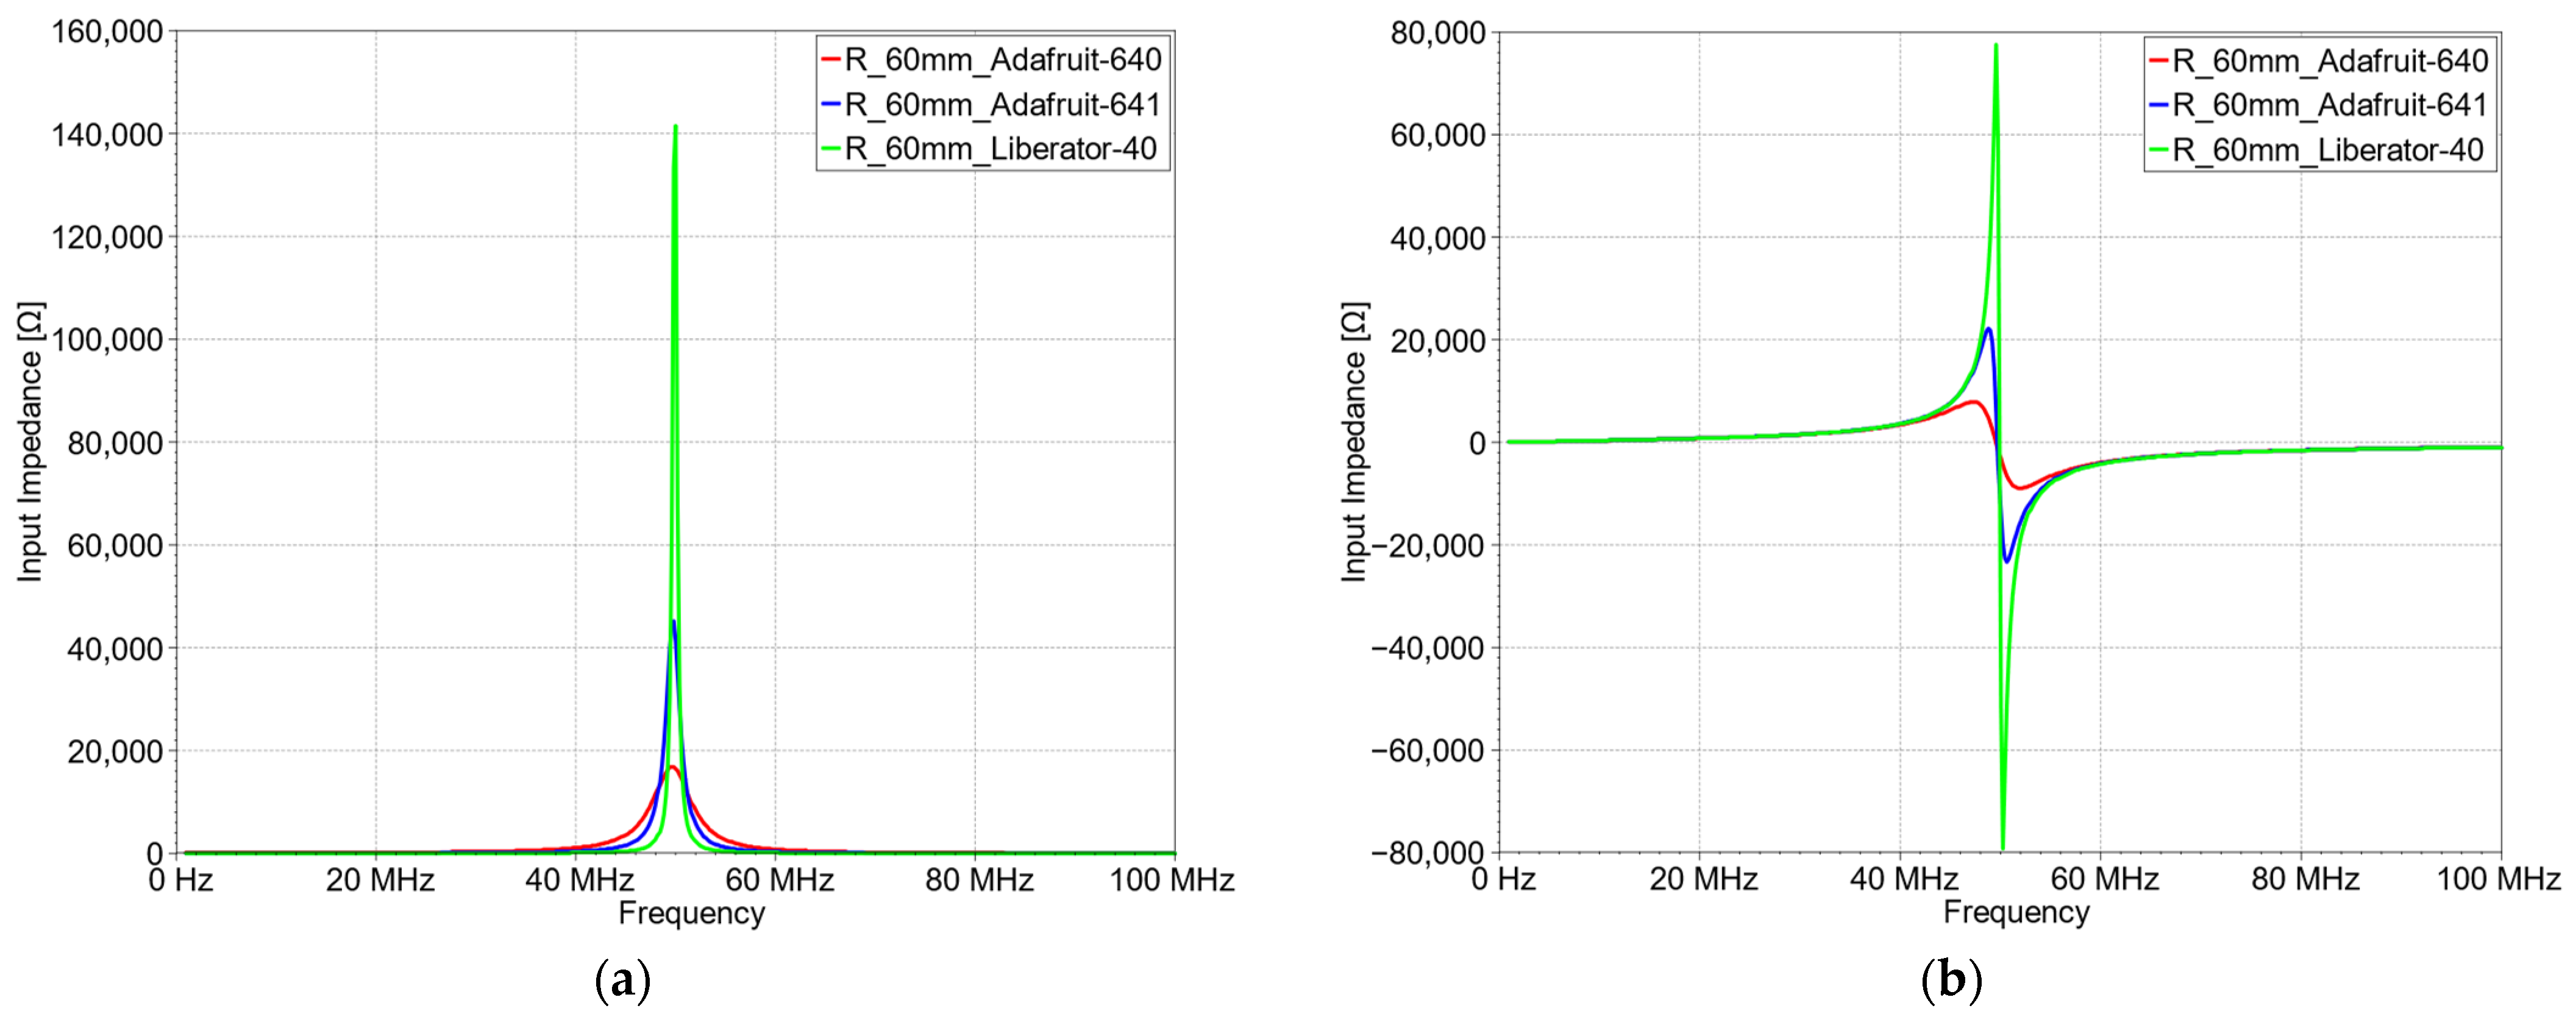
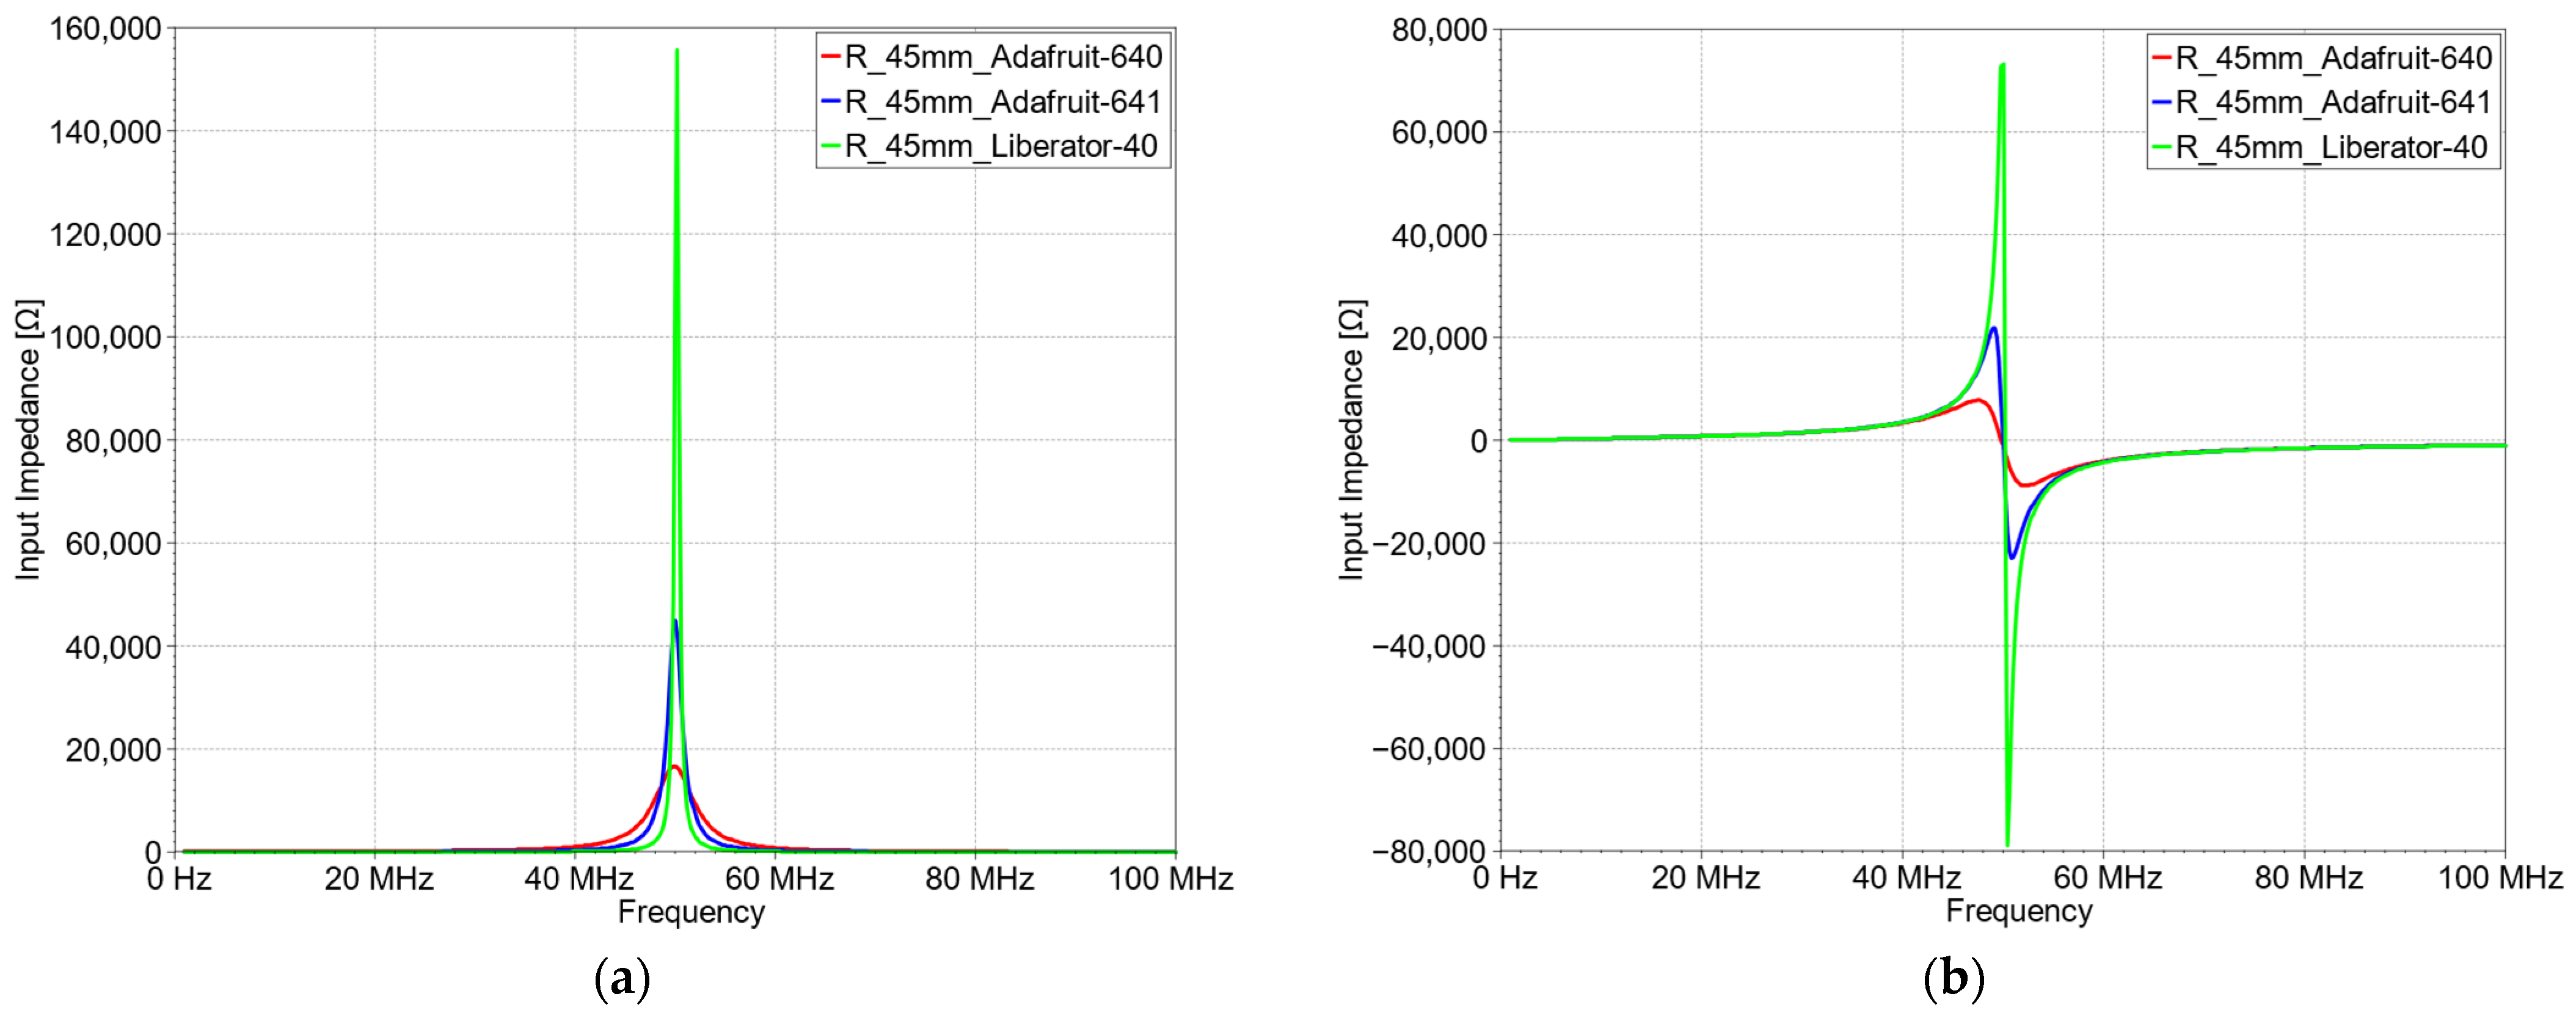
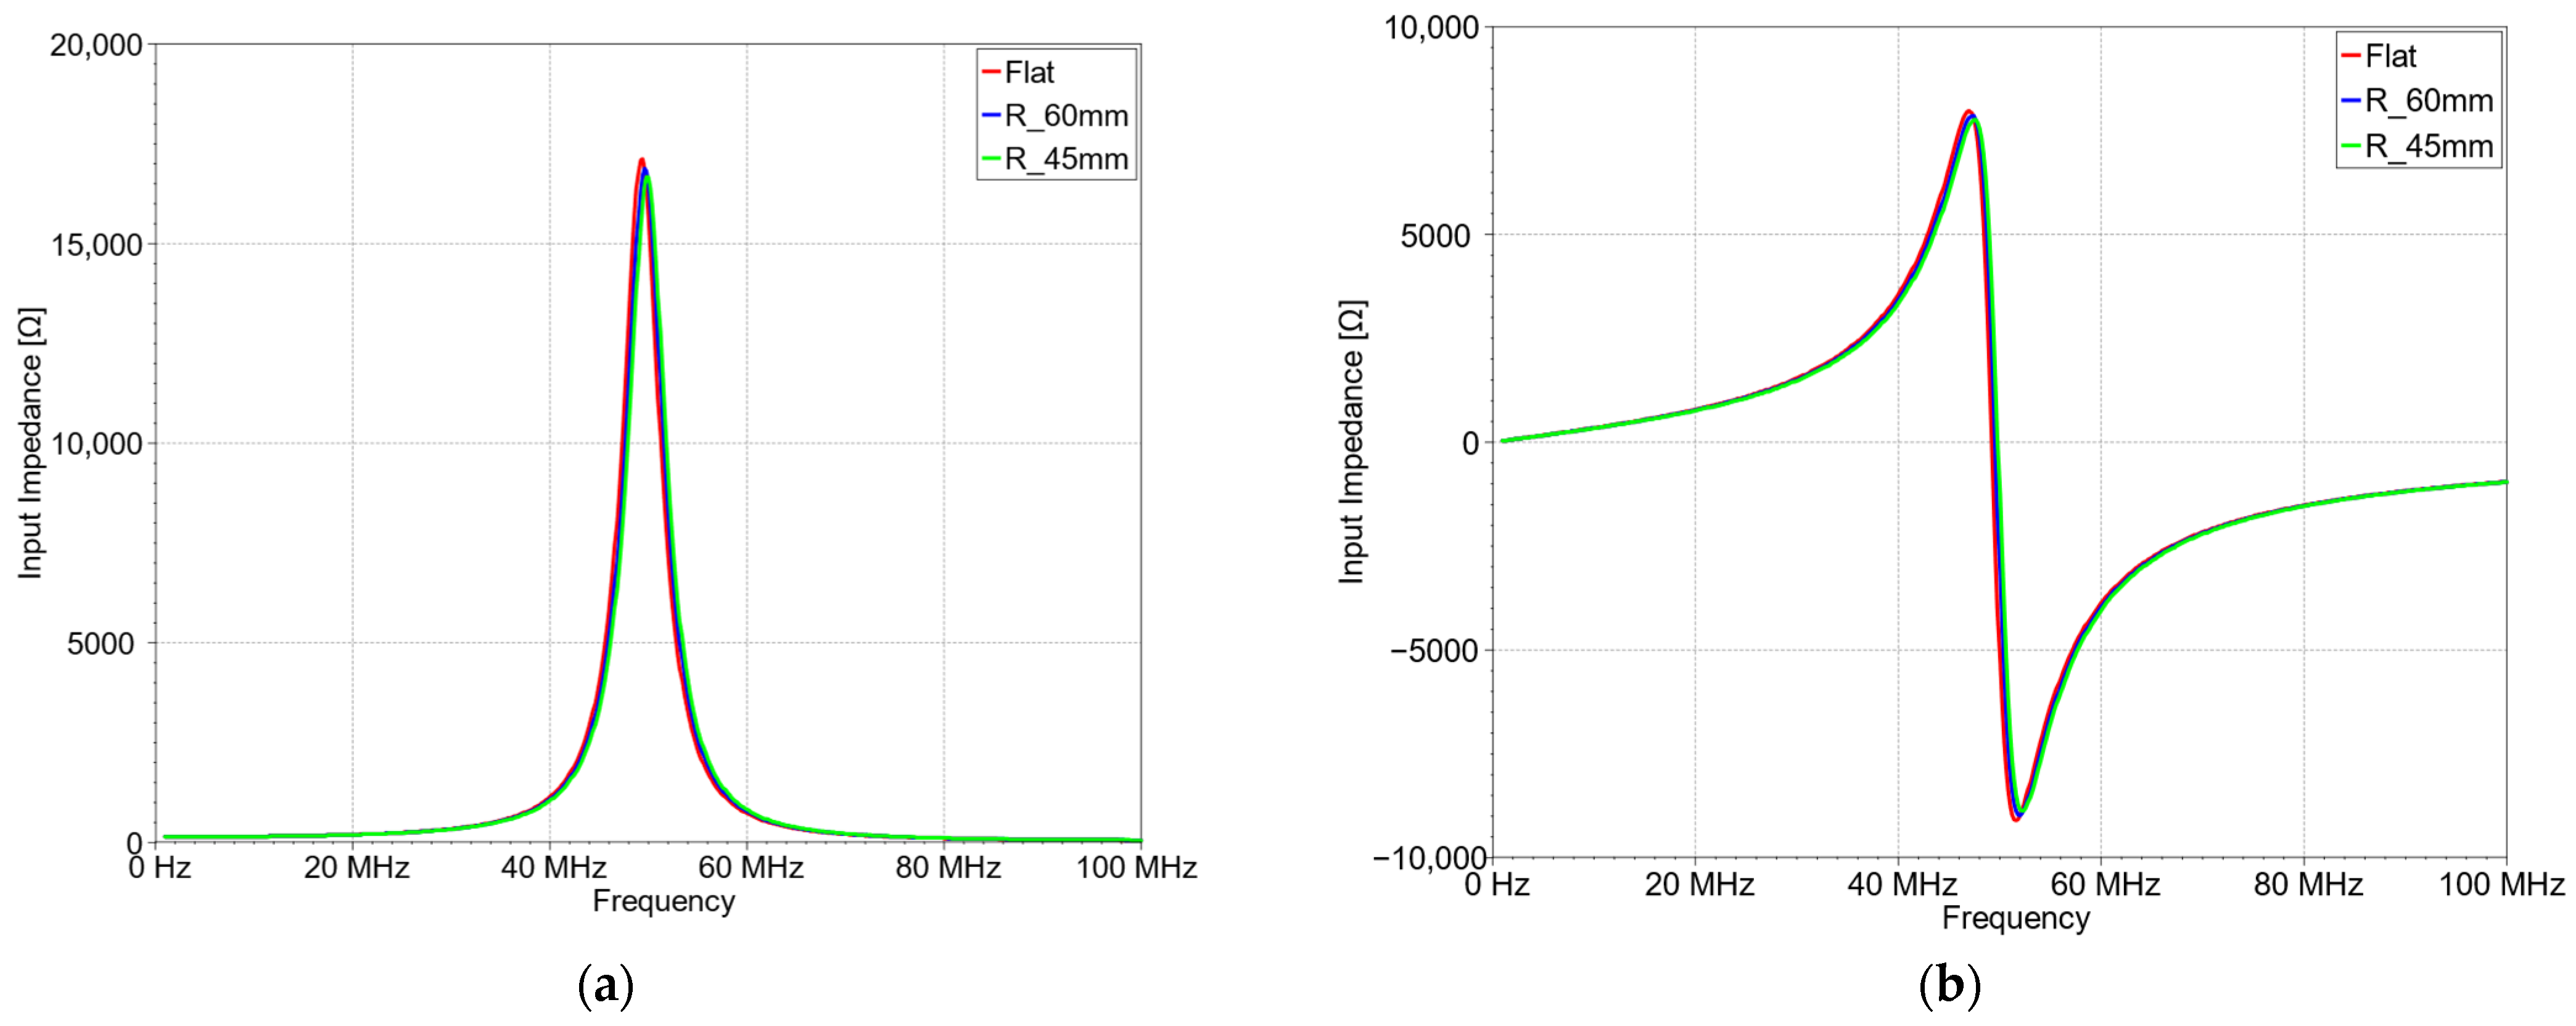
3.1. Simulation Test

The generated parametric 3D models (a flat model and two bent models on objects with radii R1 = 60 mm and R2 = 45 mm) were imported into the EMCoS Studio 2023 program. Based on the imported geometry, wired antenna models with the parameters (Table 1) of real conductive threads were generated.
The prepared antenna loops (Figure 8) were subjected to electromagnetic analysis in the frequency range from 1 to 100 MHz, and their input impedances were determined. To obtain reliable results, the analysis parameters included the environment (air) parameters of the tested object. The real part (series resistance of the antenna loop) and the imaginary part (reactance) were exported separately for further analysis. The obtained results are presented graphically in Figure 9, Figure 10, Figure 11 and Figure 12.
For each model (flat, R = 60 mm, R = 45 mm), a major influence of the conductive thread parameters on the values of real and imaginary impedance within the antenna’s self-resonance is observed. The greater the conductivity of the thread, the greater the values of both parts of the impedance.
As the antenna’s curvature changes, its self-resonance frequency also changes, but this value at each level of antenna-bending is much higher than the tag’s operating frequency (13.56 MHz).
From the point of view of the effectiveness of the tag, the values of the analyzed parameters are crucial for its operating frequency, therefore the values of the resistance and inductance of the antenna loop were determined for f = 13.56 MHz. The resistance can be read directly from the real part of the impedance, while the inductance should be calculated from the imaginary part using Equation (31). The determined values are presented in Table 2.
L S = X L 2 · π · f
The observed difference in the resistance values of the antenna loop made with different conductive threads is obvious because each thread has a different internal resistance value. Analyzing the obtained data, one can notice the relationship between the antenna’s curvature and its parameters. As the bend increases, the resistance and inductance decrease—in the case of resistance, this is an insignificant change, within the margin of error. Although the level of observed changes may reduce the effectiveness of the tag, it will not cause it to stop working.

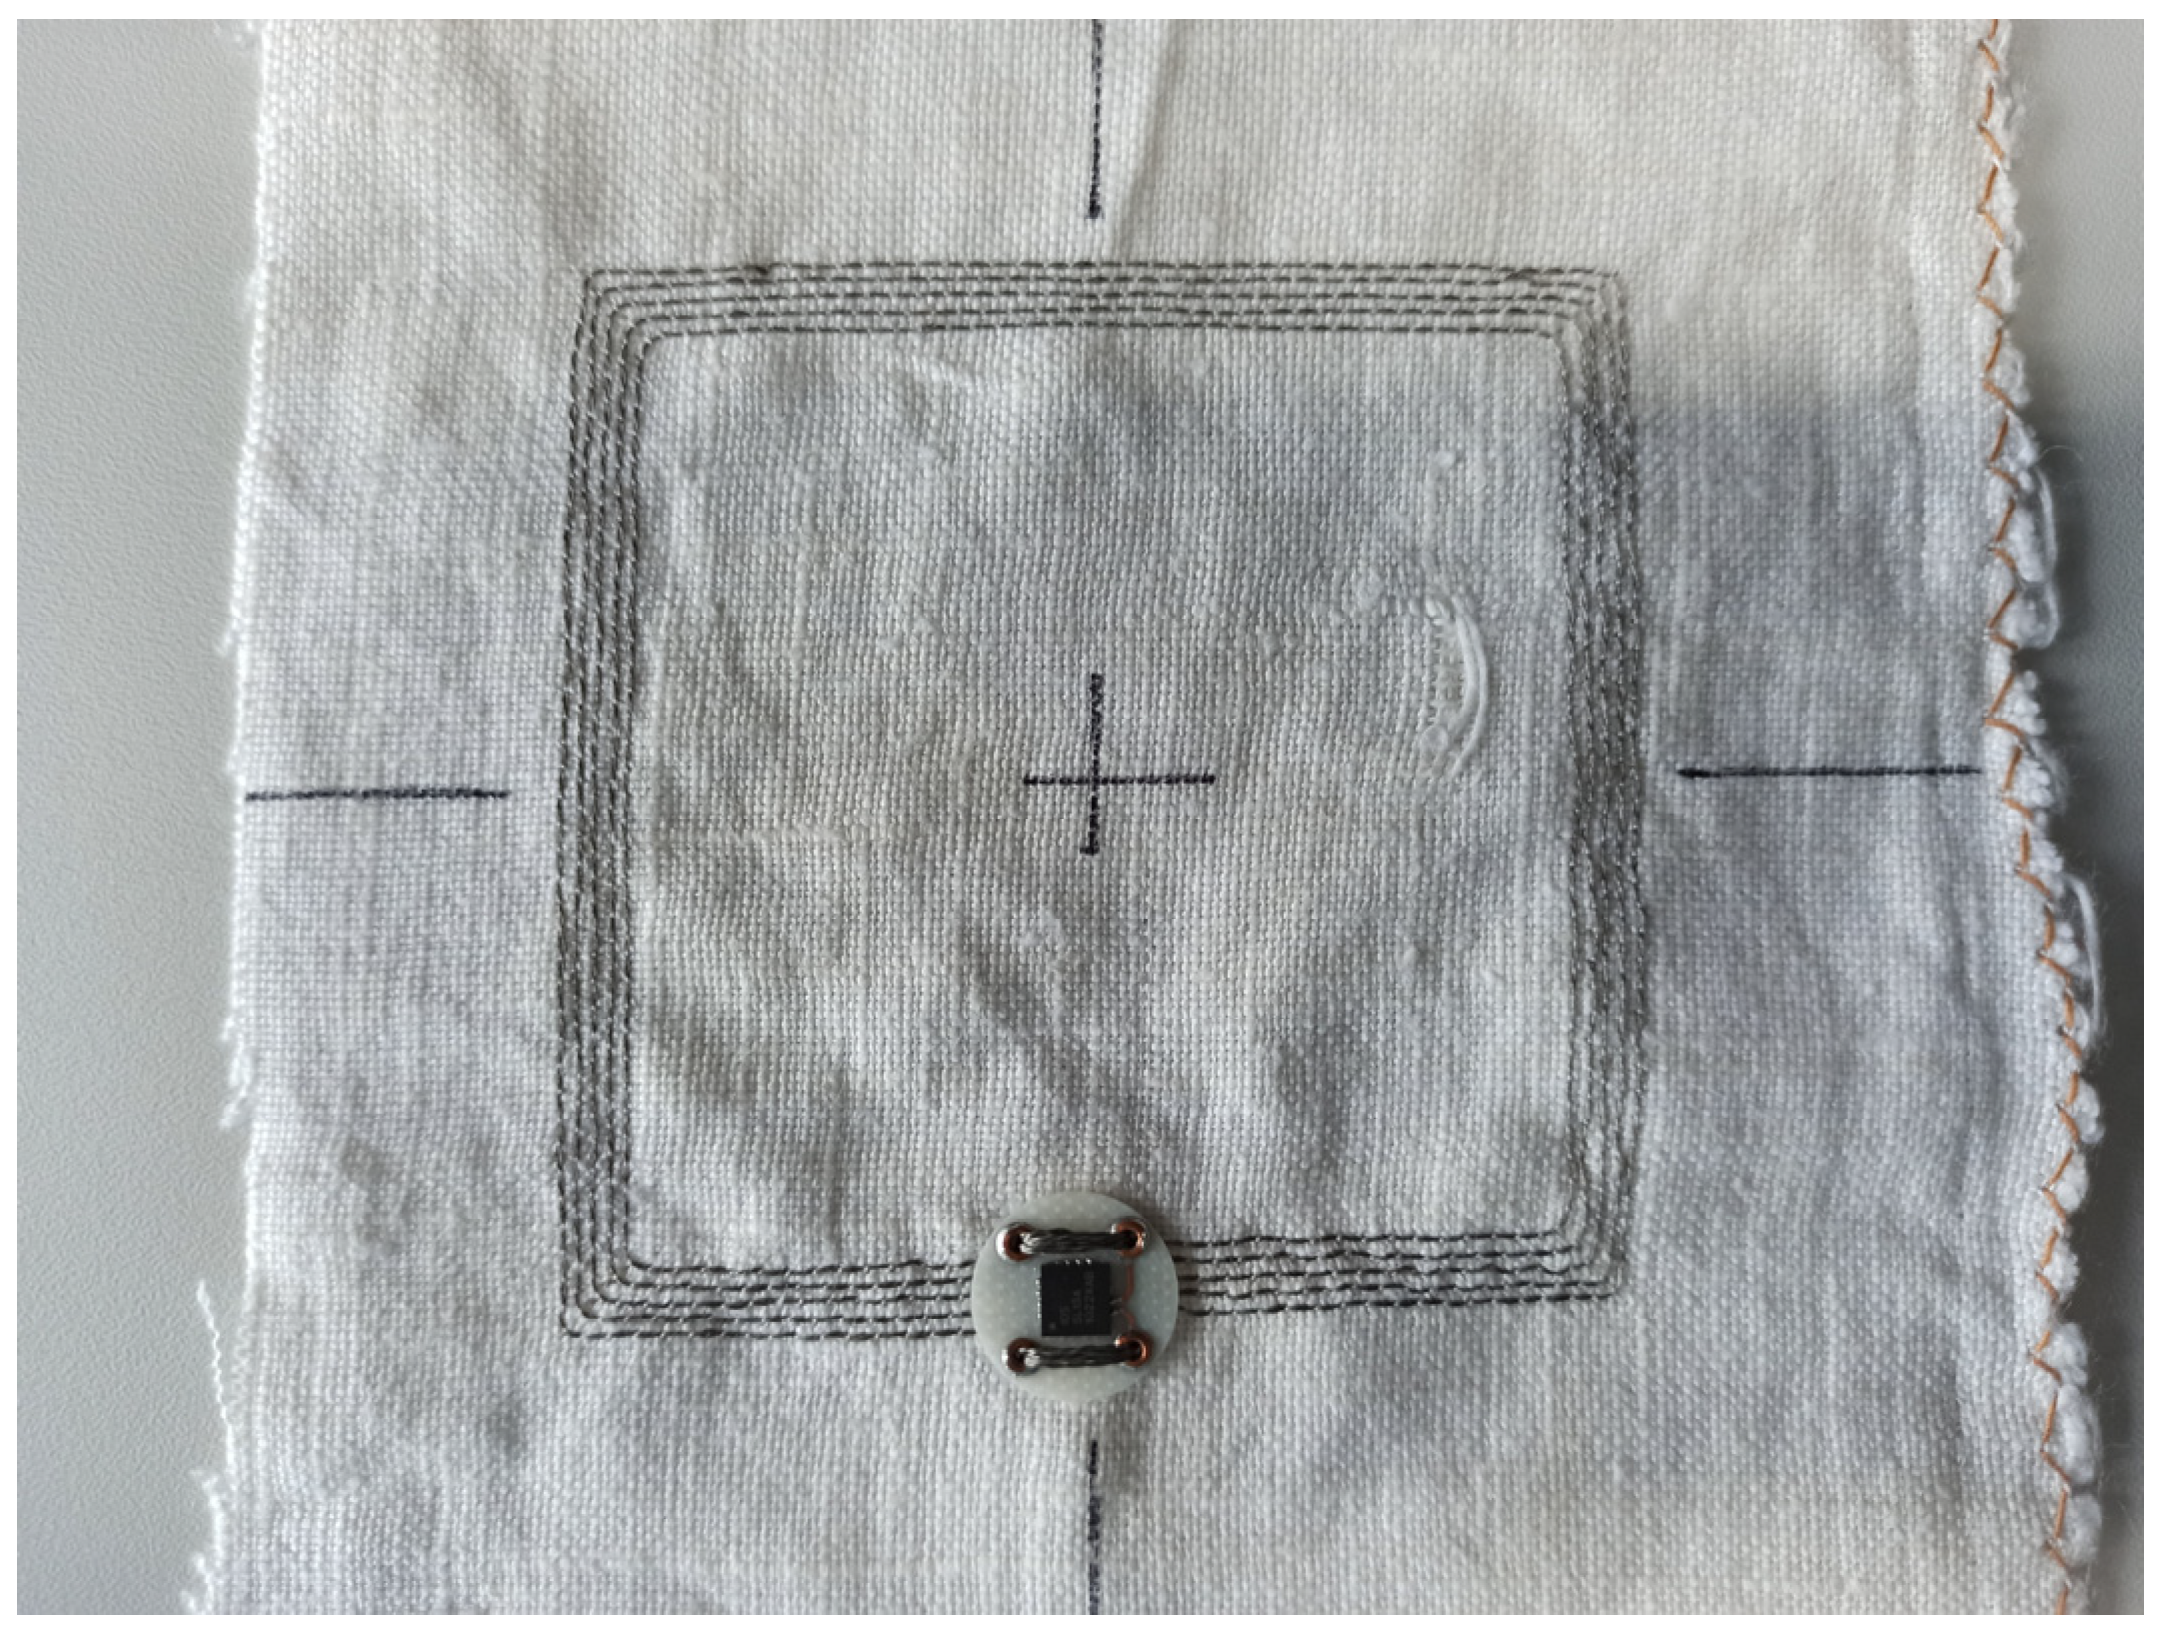
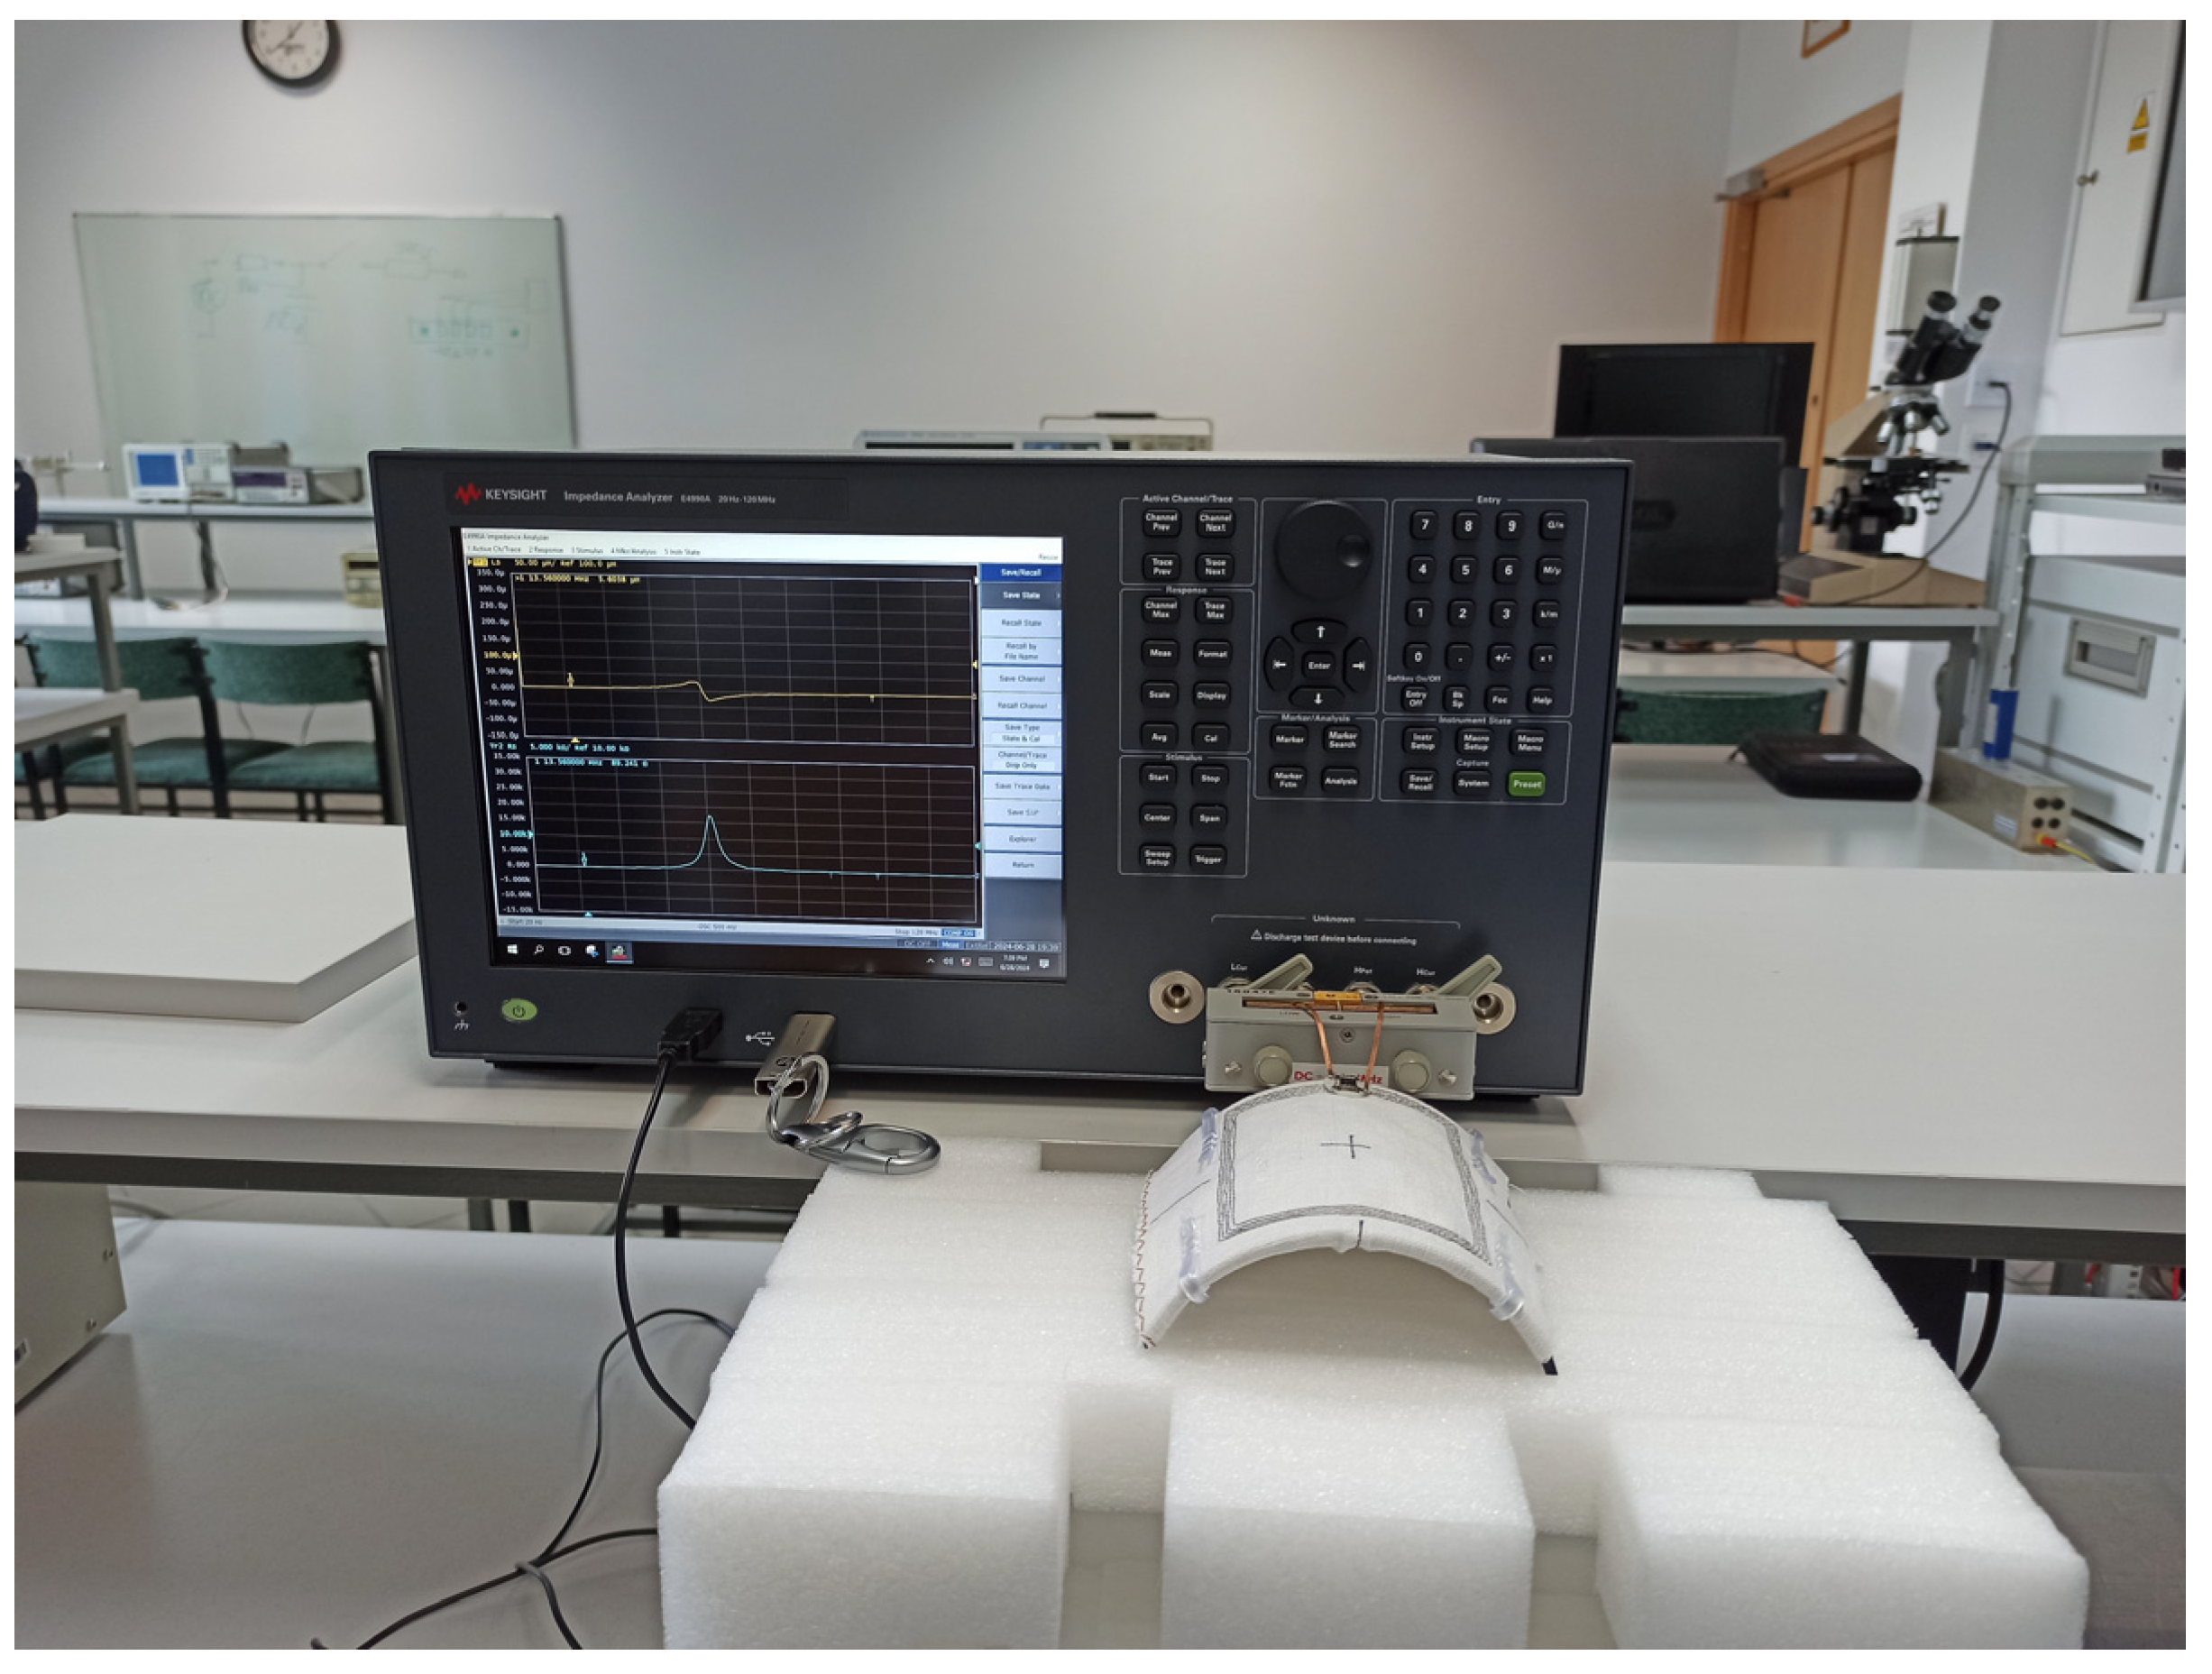
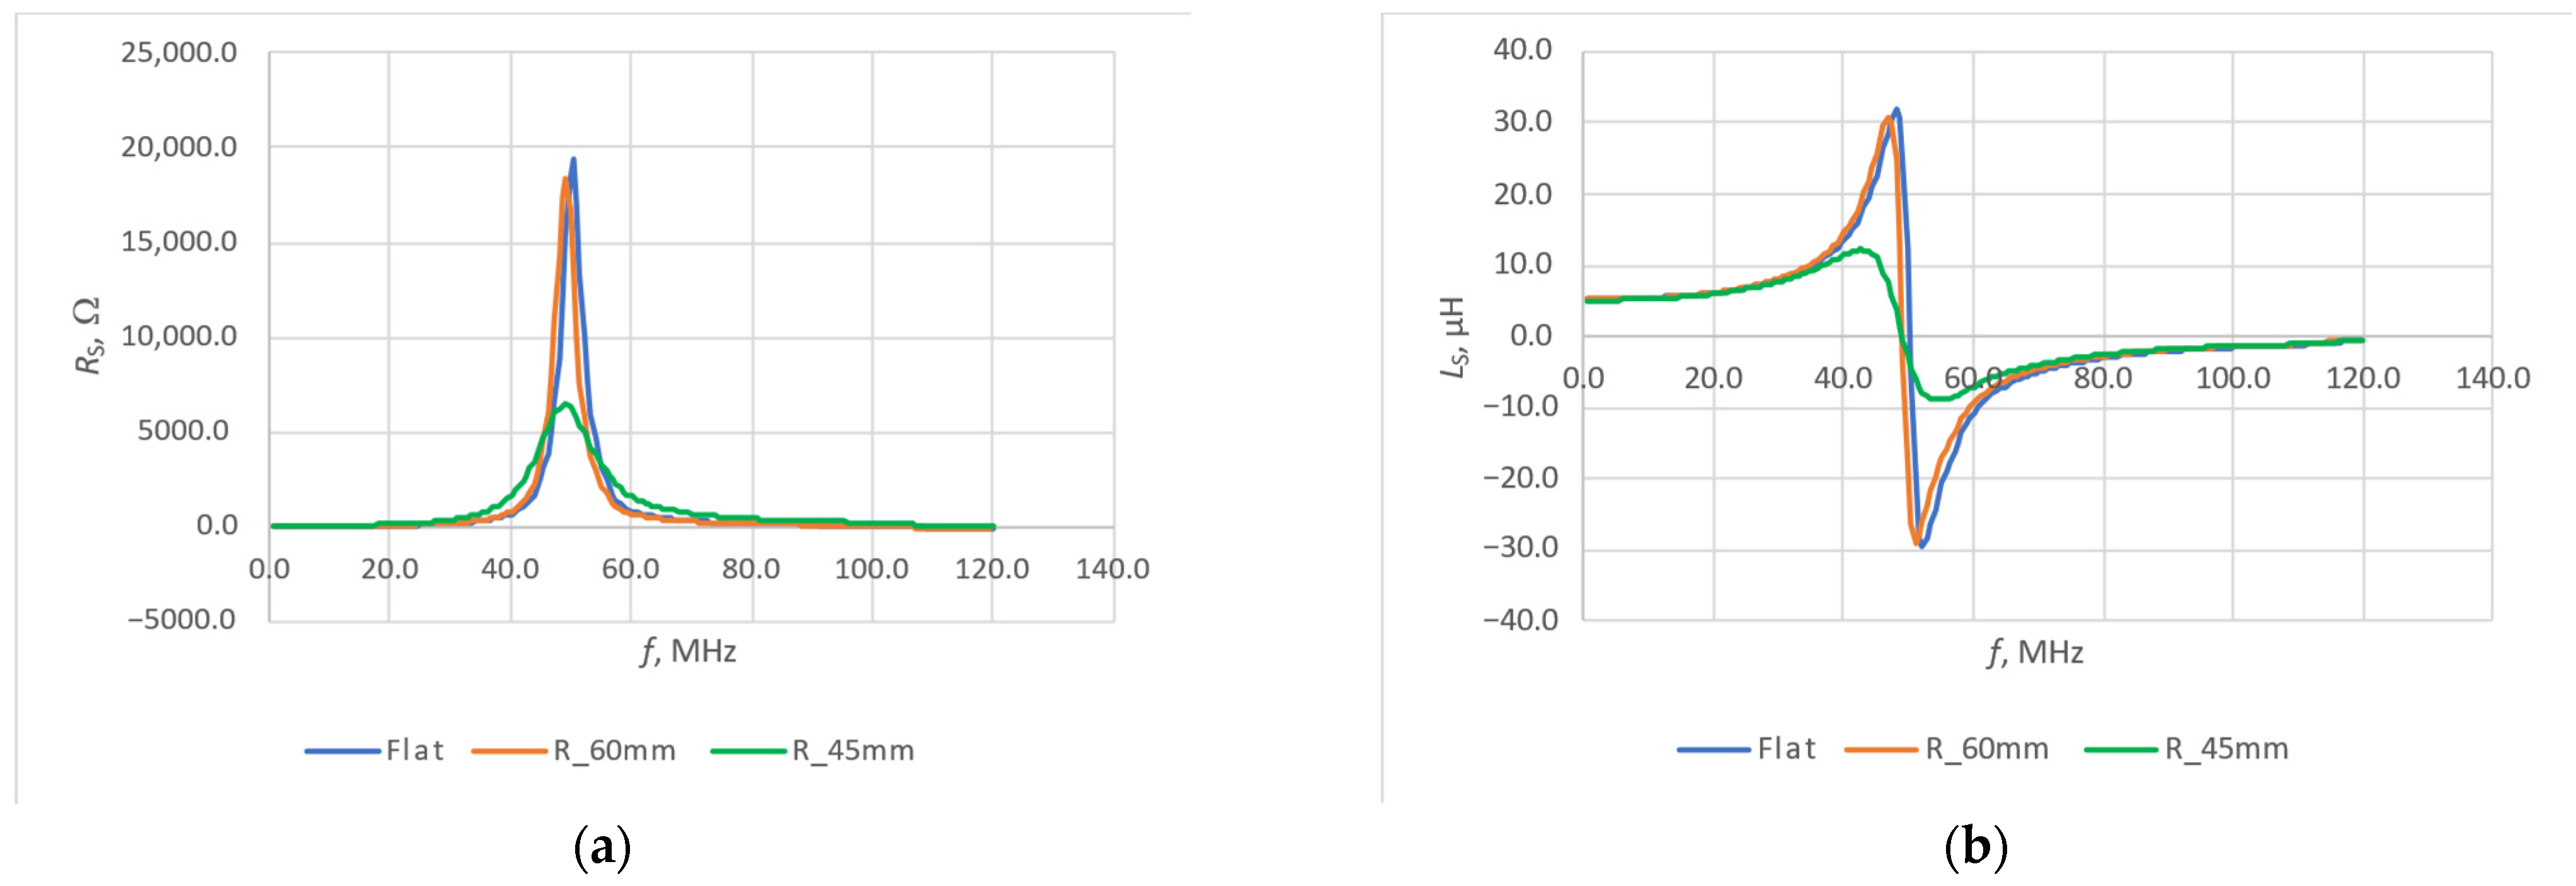
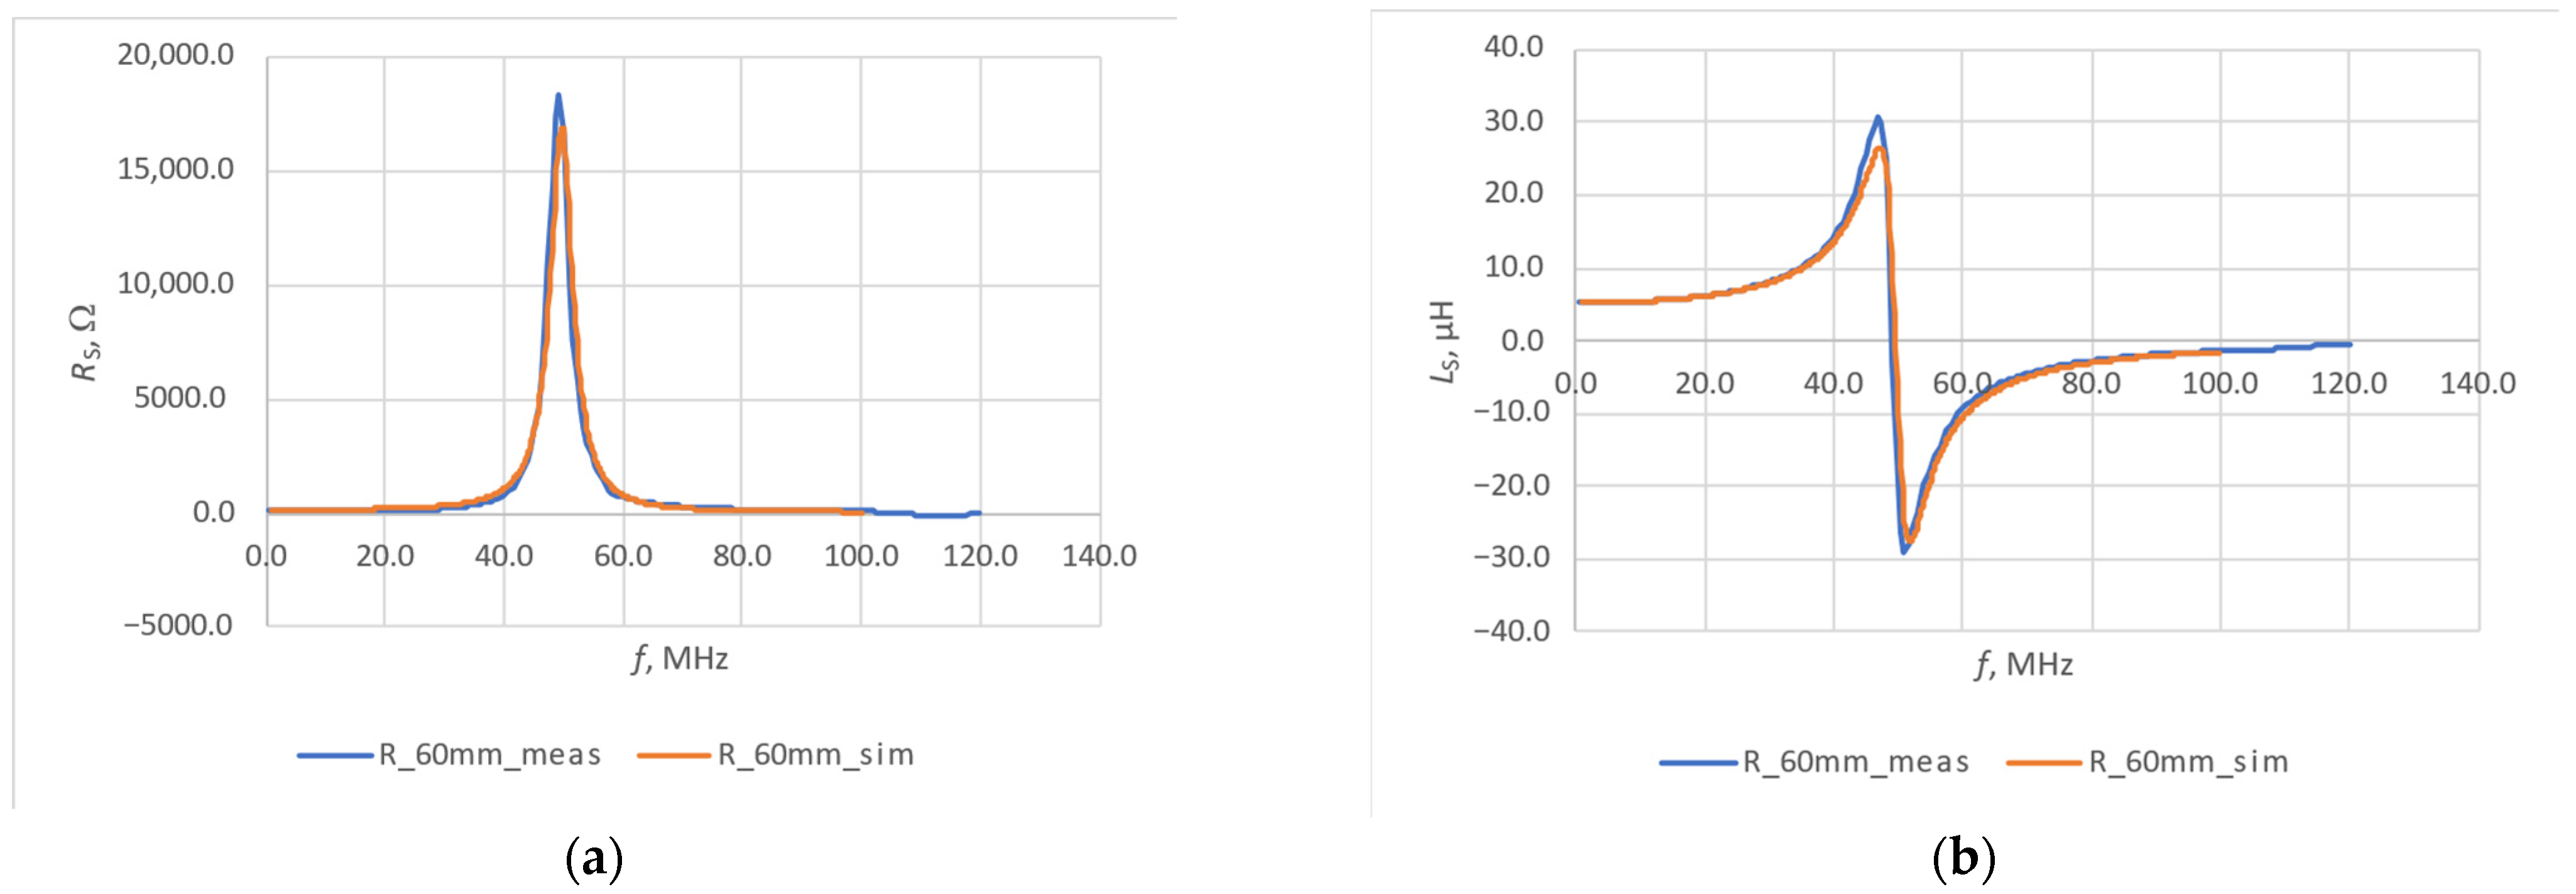
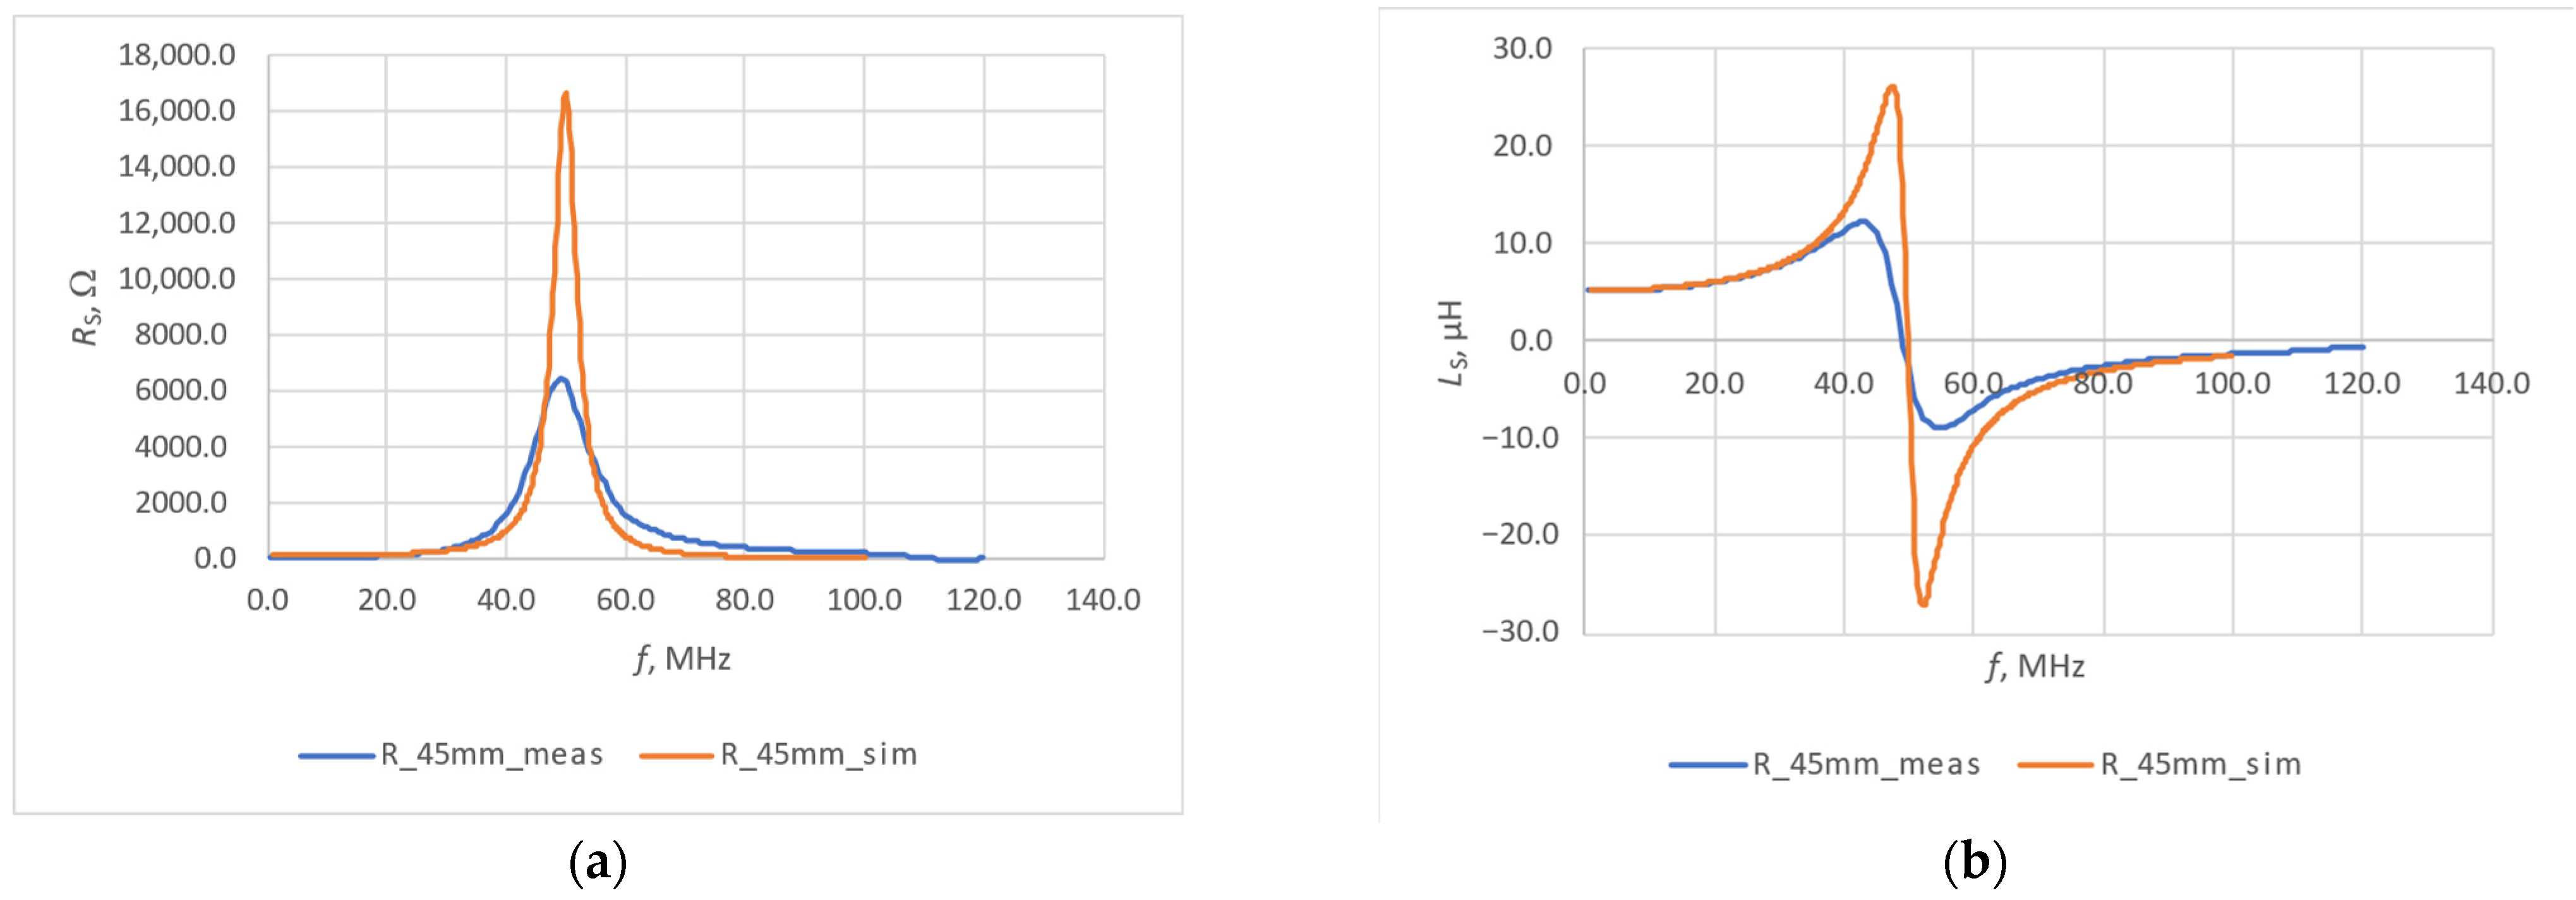
3.2. Experimental Verification

The simulation results, although reliable, should be verified experimentally, because the simulation often does not take into account all the variables that individually are not important, but cumulatively can significantly change the final result.
Experimental verification of the obtained results was carried out for one case, i.e., an antenna sewn with Adafruit 640 thread. Resistance and inductance measurements were performed over a wider frequency range than the simulation analysis—from 20 Hz to 120 MHz (the full frequency range of the analyzer)—for a flat model and two radii of curvature—R1 = 60 mm, R2 = 45 mm. To ensure even bending of the antenna over its entire length/width, dedicated polylactide stands were prepared (Figure 13).
Measurements were performed using a Keysight E4990A impedance analyzer with a 16047E adapter. Before collecting measurement data, in accordance with the procedure, calibration was performed when the measurement leads were short-circuited and open. The antenna was connected to the analyzer using the shortest possible copper connections. A photograph of the prepared measurement stand is shown in Figure 14.
To ensure the shortest possible connection of the tested antenna with the impedance analyzer, its height was adjusted using polystyrene supports. When testing a bent antenna, it was secured on the stand with plastic clips. The antenna was connected to the measuring device using the shortest possible copper strips. The obtained results are presented in Figure 15, Figure 16 and Figure 17.
To facilitate analysis, the results obtained independently for all three models were summarized together. The obtained waveforms are shown in Figure 18.
As in the case of simulation tests, a change in the self-resonance frequency was observed. For the operating frequency of the tag, the values of the resistance and inductance of the antenna loop also changed (the measured values of these parameters are presented in Table 3).
The observed trend of changes is consistent with changes resulting from simulation studies. However, the measurement result depends on many secondary factors. One of them is the stretching of the antenna when securing it on the base, which is another element affecting its geometry. In the analyzed case, this impact may be even greater than the change in curvature. Due attention should also be paid to connecting the antenna to the analyzer, because the longer the connection cables, the greater the measurement error will be in the result.
The results obtained from experimental tests were compared with the simulation results. Figure 19, Figure 20 and Figure 21 show a comparison of the waveforms obtained for individual models.
When comparing the simulation results with the experimental tests’ results, the obtained waveforms were similar in shape and trend of changes in the analyzed values for individual models. In Figure 21, in the frequency range around the self-resonant frequency of the antenna loop, the measured waveforms differed significantly from the simulated ones. These waveforms concerned the bend on the base with the radius of 45 mm which, in fact, was a very significant change in shape, and this caused changes in the values of the parameters of the resonant circuit.
The differences occurred due to the simplification of the simulation model in relation to the real antenna loop, which did not take into account inter-turn capacitances, connecting wires used during measurements with the analyzer, the presence of a button, or (which is the most important) additional changes in the antenna geometry caused by its stretching (direct impact on the actual value of the internal resistance of the conductive thread). Moreover, the simulated model assumed the ideal geometry of the designed antenna. Meanwhile, during sewing, rounding appeared on its corners, which also affected the final parameters.

4. Conclusions

The integration of RFID technology with textronics has enabled the introduction of innovative solutions to the market, in which the chip can be integrated, e.g., with a button or patch, and an antenna made of a conductive material combined with the fabric from which a given textile product is sewn.
RFID systems with textronic tags are widely used in many sectors of the economy. There is wireless communication between the tags and the readers using radio waves, and the reader’s connection to the Internet makes such systems ideally fit into the concept of the Internet of Things or, more precisely, into the Internet of Textile Things (IoTT).
The production of RFID tags requires consideration of many technical and aesthetic aspects, especially in the case of products integrated with textile products. However, each tag whose antenna is made on a flexible substrate is exposed to factors that may disturb its operation. One such factor is a change in the geometry of the antenna caused by a change in its curvature—e.g., after placing the tag on a cylindrical object.
The authors decided to analyze the impact of changing the curvature of the antenna of an RFID tag operating in the HF band on its parameters—resistance and inductance. Simulation and experimental tests were performed.
The analyses confirmed that changing the antenna’s curvature affects its parameters. It was observed that as the bending of the antenna loop increases, its inductance value decreases. The inductance of the antenna loop together with the capacitance of the RFID chip creates a resonant circuit, and the best conditions for energy and data transfer occur when the antenna is perfectly matched (resonance frequency equal to the operating frequency of the tag—13.56 MHz). Therefore, changing the value of the analyzed parameter may affect the effectiveness of the tag. The tested antenna is characterized by a relatively low Q factor and, therefore, a wide bandwidth, so the observed range of changes will not cause the tag to stop working, but its operating range will change.
Discrepancies were observed between the results of simulations and measurements of changes in the resistance of the tested antenna. During experimental research, a real object is exposed to many factors that burden the results with additional errors. One such factor is the tension of the thread when it is placed on the bending base or changing the position of the button with the integrated circuit—stretching or contracting the conductive thread causes a change in its internal resistance. The value of the inter-turn capacitance also changes.
It is very difficult to compare the obtained results with the results of other researchers, because slightly different parameters were analyzed (last paragraph of the introduction). Additionally, a tag operating in a different frequency band was analyzed. Solutions for the UHF band often appear in the literature. However, it is consistent with the observations that changing the antenna curvature actually affects the parameters of the tested antennas.
The impact of placing antennas, not only for RFID tags, on non-planar objects is an important and interesting issue. The analyses performed constitute the basis for further research in this area, both in the context of other types of antenna and other materials used to create them.

Author Contributions

Conceptualization, P.J.-M. and M.W.; methodology, P.J.-M. and M.N.; validation, P.J.-M.; formal analysis, M.N.; investigation, P.J.-M. and M.W.; resources, M.N.; data curation, M.N.; writing—original draft preparation, M.N.; writing—review and editing, M.N.; visualization, M.N.; supervision, P.J.-M.; project administration, P.J.-M.; funding acquisition, P.J.-M. and M.W. All authors have read and agreed to the published version of the manuscript.

Funding

This research received no external funding.

Data Availability Statement

All calculated and measured data will be provided upon request to the corresponding authors by email with appropriate justification.

Conflicts of Interest

The authors declare no conflicts of interest.

References

  1. Lombardi, M.; Pascale, F.; Santaniello, D. Internet of Things: A General Overview between Architectures, Protocols and Applications. Information 2021, 12, 87. [Google Scholar] [CrossRef]
  2. Tawalbeh, L.; Muheidat, F.; Tawalbeh, M.; Quwaider, M. IoT Privacy and Security: Challenges and Solutions. Appl. Sci. 2020, 10, 4102. [Google Scholar] [CrossRef]
  3. Padma, A.; Seth, B.; Ramachandran, G. Analysis of Current Smart Wearable Trends Using Internet of Medical Things. In Proceedings of the 3rd International Conference on Artificial Intelligence and Smart Energy, ICAIS, Coimbatore, India, 2–4 February 2023. [Google Scholar]
  4. Vital, D. A Biomimetic Resonator for Fabric-Based Wireless Power Transfer, Harvesting, and Charging of Sensors and Internet of Medical Things. In Proceedings of the 2022 IEEE 12th International Conference on RFID Technology and Applications, RFID-TA, Cagliari, Italy, 12–14 September 2022. [Google Scholar]
  5. Chit, T.W.; Ning, L.; Paliath, N.A.; Long, Y.M.; Akhtar, H.; Shanshan, Y. IIoT-Enabled and Data-Driven Sustainability Evaluation Framework for Textile Supply Chain. In Proceedings of the 16th IEEE Conference on Industrial Electronics and Applications, ICIEA, Chengdu, China, 1–4 August 2021. [Google Scholar]
  6. Li, X.; Pan, W.; An, J.; Wan, P. The Application Research on Military Internet of Things. In Proceedings of the 2020 17th International Computer Conference on Wavelet Active Media Technology and Information Processing, ICCWAMTIP, Chengdu, China, 17–19 December 2021. [Google Scholar]
  7. Donghao, C.; Bohua, Z.; Chaomin, O.; Zhiyu, C. Research on Military Internet of Things Technology Application in the Context of National Security. In Proceedings of the 2021 2nd International Conference on Electronics, Communications and Information Technology, CECIT, Sanya, China, 27–29 December 2021. [Google Scholar]
  8. Bing, L.; Gu, Y.; Hu, L.; Bowen, L.; Lihua, Y.; Wang, J.; Yin, Y. Ultra Reliability and Massive Connectivity Provision in Integrated Internet of Military Things (IoMT) Based on Tactical Datalink. Def. Technol. 2024, 33, 386–398. [Google Scholar] [CrossRef]
  9. Loncar, P. Internet of Musical Things and Music Data Visualization. In Proceedings of the 2022 45th Jubilee International Convention on Information, Communication and Electronic Technology, MIPRO, Opatija, Croatia, 23–27 May 2022. [Google Scholar]
  10. Turchet, L.; Casari, P. Latency and Reliability Analysis of a 5G-Enabled Internet of Musical Things System. IEEE Internet Things J. 2024, 11, 1228–1240. [Google Scholar] [CrossRef]
  11. Bouhassoune, I.; Chaibi, H.; Chehri, A.; Saadane, R. A Review of RFID-Based Internet of Things in the Healthcare Area, the New Horizon of RFID. In Proceedings of the Procedia Computer Science, Zurich, Switzerland, 14–17 June 2022; Volume 207. [Google Scholar]
  12. Sahukara, K.V.; Ammisetty, M.B.; Devi, G.S.K.G.; Prathyusha, S.; Nikhita, T.S. COVID-SAFE: IoT Based Health Monitoring System Using RFID in Pandemic Life. In Proceedings of the 2021 IEEE International Conference on RFID Technology and Applications, RFID-TA 2021, Delhi, India, 6–8 October 2021. [Google Scholar]
  13. Almalki, H.; Rankin, A.C.; Juette, A.; Youssef, M.M.G. Radio-Frequency Identification (RFID) Tag Localisation of Non-Palpable Breast Lesions a Single Centre Experience. Breast 2023, 69, 417–421. [Google Scholar] [CrossRef] [PubMed]
  14. Varriale, V.; Cammarano, A.; Michelino, F.; Caputo, M. Integrating Blockchain, RFID and IoT within a Cheese Supply Chain: A Cost Analysis. J. Ind. Inf. Integr. 2023, 34, 100486. [Google Scholar] [CrossRef]
  15. Tan, W.C.; Sidhu, M.S. Review of RFID and IoT Integration in Supply Chain Management. Oper. Res. Perspect. 2022, 9, 100229. [Google Scholar] [CrossRef]
  16. Bianco, G.M.; Panunzio, N.; Pintaudi, A.; Santamaria, S.; Faustino, F.; Occhiuzzi, C.; Marrocco, G. RFID Labeling of Police Equipment. In Proceedings of the 2021 IEEE International Conference on RFID Technology and Applications, RFID-TA 2021, Delhi, India, 6–8 October 2021. [Google Scholar]
  17. Yaman, O.; Tuncer, T.; Ertam, F. Automated Book Location and Classification Method Using RFID Tags for Smart Libraries. Microprocess. Microsyst. 2021, 87, 104388. [Google Scholar] [CrossRef]
  18. Jakub, D.; Filip, L. Comparison of the Difficulty Overcoming of RFID Electronic Access Control Systems and Overcoming of Pin Tumbler Locks. In Proceedings of the Transportation Research Procedia, Online, 28 June–2 July 2021; Volume 55. [Google Scholar]
  19. Chen, Y.; Zhao, H.; Li, Z.; Lan, S.; Dai, X. Design of RFID Access Control System Based on 51 Microcontroller. In Proceedings of the Proceedings—2023 International Conference on Computers, Information Processing and Advanced Education, CIPAE, Ottawa, ON, Canada, 26–28 August 2023. [Google Scholar]
  20. Jankowski-Mihułowicz, P.; Węglarski, M.; Chamera, M.; Pyt, P. Textronic Uhf Rfid Transponder. Sensors 2021, 21, 1093. [Google Scholar] [CrossRef] [PubMed]
  21. Jankowski-Mihułowicz, P.; Węglarski, M.; Pyt, P.; Skrobacz, K.; Karpiński, K. UHF Textronic RFID Transponder with Bead-Shaped Microelectronic Module. Electronics 2023, 12, 4873. [Google Scholar] [CrossRef]
  22. Peters, S.; Hangmann, C.; Wüllner, I.; Traupe, J.; John, T.; Weigel, R.; Scheiner, B. Low-Cost and High Performance Antenna Setup for Updating EPaper Displays on Curved RFID SmartTags Used in Pharmaceutical Studies. In Proceedings of the IEEE MTT-S International Microwave Symposium Digest, San Diego, CA, USA, 11–16 June 2023. [Google Scholar]
  23. Garg, M.; Sharma, A.; Garcia Zuazola, I.J.; Gupta, A. Compact UHF RFID Balun-like Integrated Tag Antenna for Long Range Detection of Water Bottles. IET Microw. Antennas Propag. 2023, 17, 909–919. [Google Scholar] [CrossRef]
  24. He, S.; Zhang, Y.; Li, L.; Lu, Y.; Zhang, Y.; Liu, H. High Performance UHF Rfid Tag Antennas on Liquid-Filled Bottles. Prog. Electromagn. Res. 2019, 165, 83–92. [Google Scholar] [CrossRef]
  25. Ozek, E.A.; Tanyeli, S.; Yapici, M.K. Flexible Graphene Textile Temperature Sensing RFID Coils Based on Spray Printing. IEEE Sens. J. 2021, 21, 26382–26388. [Google Scholar] [CrossRef]
  26. Biswas, B.; Karmakar, A.; Chandra, V. Miniaturised Wideband Ingestible Antenna for Wireless Capsule Endoscopy. IET Microw. Antennas Propag. 2020, 14, 293–301. [Google Scholar] [CrossRef]
  27. Tong, Y.; Meng, F.; Zhang, Y.; Hu, J. The Impact of Contextual Factors on the Performance of Human Breath Monitoring Using Flexible UHF RFID Temperature Sensing Yarn and Its Underlying Mechanisms. Sens. Actuators A Phys. 2024, 375, 115522. [Google Scholar] [CrossRef]
  28. El Bakkali, M.; Martinez-Estrada, M.; Fernandez-Garcia, R.; Gil, I.; Mrabet, O. El Effect of Bending on a Textile UHF-RFID Tag Antenna. In Proceedings of the 14th European Conference on Antennas and Propagation, EuCAP 2020, Copenhagen, Denmark, 15–20 March 2020. [Google Scholar]
  29. Zaidi, N.I.; Abd Rahman, N.H.; Yahya, M.F.; Nordin, M.S.A.; Subahir, S.; Yamada, Y.; Majumdar, A. Analysis on Bending Performance of the Electro-Textile Antennas with Bandwidth Enhancement for Wearable Tracking Application. IEEE Access 2022, 10, 31800–31820. [Google Scholar] [CrossRef]
  30. Jeong, S.; Kim, T.W.; Lee, S.; Sim, B.; Park, H.; Son, K.; Son, K.; Kim, S.; Shin, T.; Kim, Y.C.; et al. Analysis of Repetitive Bending on Flexible Wireless Power Transfer (WPT) PCB Coils for Flexible Wearable Devices. IEEE Trans. Compon. Packag. Manuf. Technol. 2022, 12, 1748–1756. [Google Scholar] [CrossRef]
  31. Jankowski-Mihułowicz, P.; Węglarski, M. Textronic RFID Transponder. Patent PL 231291 B1, 19 March 2019. [Google Scholar]
Figure 1. HF band RFID transponder circuit diagram.
Electronics 13 02800 g001
Figure 2. View of the eDesignSuite tool for NFC/RFID calculations.
Electronics 13 02800 g002
Figure 3. Output from the eDesignSuite tool—inductance of the designed antenna.
Electronics 13 02800 g003
Figure 4. Photograph of the HF RFID transponder antenna.
Electronics 13 02800 g004
Figure 5. Visualization of the antenna model: (a) sectioning; (b) co-ordinate system.
Electronics 13 02800 g005
Figure 6. Visualization of the bent model parameters: (a) central angle of the circle; (b) initial angle.
Electronics 13 02800 g006
Figure 7. View of generated 3D models in CAD software (https://www.autodesk.com/solutions/cad-software): (a) flat model; (b) model curved on a 60 mm radius object; (c) model curved on a 45 mm radius object.
Electronics 13 02800 g007
Figure 8. View of the antenna created in EMCoS Studio: (a) flat model; (b) curved model.
Electronics 13 02800 g008
Figure 9. The waveforms of the simulated impedance for the flat model made with different threads: (a) real part; (b) imaginary part.
Electronics 13 02800 g009
Figure 10. The waveforms of the simulated impedance for the model curved on a 60 mm radius object made with different threads: (a) real part; (b) imaginary part.
Electronics 13 02800 g010
Figure 11. The waveforms of the simulated impedance for the model curved on a 45 mm radius object made with different threads: (a) real part; (b) imaginary part.
Electronics 13 02800 g011
Figure 12. The waveforms of the simulated impedance for the different curvature of the antenna made with Adafruit 640 thread: (a) real part; (b) imaginary part.
Electronics 13 02800 g012
Figure 13. Photograph of the bending stands.
Electronics 13 02800 g013
Figure 14. Photograph of the measurement stand.
Electronics 13 02800 g014
Figure 15. Measured waveforms of inductance (yellow waveform) and resistance (blue waveform) of the flat antenna.
Electronics 13 02800 g015
Figure 16. Measured waveforms of inductance (yellow waveform) and resistance (blue waveform) of the antenna curved on a 60 mm radius stand.
Electronics 13 02800 g016
Figure 17. Measured waveforms of inductance (yellow waveform) and resistance (blue waveform) of the antenna curved on a 45 mm radius stand.
Electronics 13 02800 g017
Figure 18. The waveforms of the measured parameters for the different curvature of the antenna: (a) series resistance; (b) series inductance.
Electronics 13 02800 g018
Figure 19. Comparison of measured and simulated waveforms for the flat model: (a) series resistance; (b) series inductance.
Electronics 13 02800 g019
Figure 20. Comparison of measured and simulated waveforms for the curved model (R = 60 mm): (a) series resistance; (b) series inductance.
Electronics 13 02800 g020
Figure 21. Comparison of measured and simulated waveforms for the curved model (R = 45 mm): (a) series resistance; (b) series inductance.
Electronics 13 02800 g021
Table 1. Parameters of the conductive threads.
ThreadMeasured Resistance, Ω/mCalculated Conductance, S/m
Adafruit 64058.18.77 · 104
Adafruit 64120.12.53 ∙ 105
Liberator 402.861.78 ∙ 106
Table 2. Simulated values of series resistance and series inductance of the tested antenna made with different threads.
ThreadFlat ModelCurved Model (R = 60 mm)Curved Model (R = 45 mm)
RS, ΩLS, µHRS, ΩLS, µHRS, ΩLS, µH
Adafruit 640160.505.68160.125.59159.835.53
Adafruit 64155.975.7255.835.6355.735.57
Liberator 409.855.719.835.639.815.56
Table 3. Measured values of series resistance and series inductance of the tested antenna.
RS, ΩLS, µH
Flat model84.6635.5954
Curved model (R = 60 mm)84.5545.5616
Curved model (R = 45 mm)101.935.4647
Disclaimer/Publisher’s Note: The statements, opinions and data contained in all publications are solely those of the individual author(s) and contributor(s) and not of MDPI and/or the editor(s). MDPI and/or the editor(s) disclaim responsibility for any injury to people or property resulting from any ideas, methods, instructions or products referred to in the content.

