
Quality of Experience That Matters in Gaming Graphics: How to Blend Image Processing and Virtual Reality
 , , ,
, , ,  , , , and
Abstract
:1. Introduction
- QoE assessment with parameters such as image blur, video resolution, graphics quality, and the buffering of online VR games played using the mobile app.
- Subjective QoE of the users was collected when they played high-quality and low-quality graphics games with the VR box using Wi-Fi and 5G networks. The main purpose of the high and low quality is to identify the importance and user engagement on the particular cloud.
2. Background of the Study
2.1. Super-Resolution Techniques
2.2. Color Correction
2.3. Motion Sickness Reduction
2.4. Stereoscopic Image Processing
2.5. Quality of Art Direction
2.6. Quality of Texture
2.7. Quality of Lighting
2.8. Quality of Animation
2.9. Quality of Performance
3. Methodology
3.1. Gaming Environment
3.2. Network and Device Selection
3.3. Game Selections
4. Result and Discussion
Results and Analysis: High-Quality and Low-Quality Gaming Experience through VR Box
5. Proposed Future Work of Graphics Cloud Games
6. Conclusions
Author Contributions
Funding
Institutional Review Board Statement
Informed Consent Statement
Data Availability Statement
Conflicts of Interest
References
- Tyagi, M.; Agarwal, R.; Rai, A. Factors affecting gaming engines: Analytical Study. In Proceedings of the 2023 International Conference on Computer Communication and Informatics, ICCCI 2023, Coimbatore, India, 23–25 January 2023. [Google Scholar] [CrossRef]
- Ishak, S.A.; Hasran, U.A.; Din, R. Media Education through Digital Games: A Review on Design and Factors Influencing Learning Performance. Educ. Sci. 2023, 13, 102. [Google Scholar] [CrossRef]
- Kim, J.H.; Kang, K.H. The effect of promotion on gaming revenue: A study of the US casino industry. Tour. Manag. 2018, 65, 317–326. [Google Scholar] [CrossRef]
- Speelman, E.N.; Rodela, R.; Doddema, M.; Ligtenberg, A. Serious gaming as a tool to facilitate inclusive business; a review of untapped potential. Curr. Opin. Environ. Sustain. 2019, 41, 31–37. [Google Scholar] [CrossRef]
- Awan, O.; Dey, C.; Salts, H.; Brian, J.; Fotos, J.; Royston, E.; Braileanu, M.; Ghobadi, E.; Powell, J.; Chung, C.; et al. Making Learning Fun: Gaming in Radiology Education. Acad. Radiol. 2019, 26, 1127–1136. [Google Scholar] [CrossRef]
- Toh, W. The Player Experience and Design Implications of Narrative Games. Int. J. Hum.-Comput. Interact. 2023, 39, 2742–2769. [Google Scholar] [CrossRef]
- Liu, Q.; Yuan, H.; Hamzaoui, R.; Su, H.; Hou, J.; Yang, H. Reduced reference perceptual quality model with application to rate control for video-based point cloud compression. IEEE Trans. Image Process. 2021, 30, 6623–6636. [Google Scholar] [CrossRef]
- Palestini, C.; Meschini, A.; Perticarini, M.; Basso, A. Neural Networks as an Alternative to Photogrammetry. Using Instant NeRF and Volumetric Rendering. In Beyond Digital Representation: Advanced Experiences in AR and AI for Cultural Heritage and Innovative Design; Springer: Cham, Switzerland, 2024. [Google Scholar] [CrossRef]
- Korkut, E.H.; Surer, E. Visualization in virtual reality: A systematic review. Virtual Real. 2023, 27, 1447–1480. [Google Scholar] [CrossRef]
- Yang, F.; Ding, X.; Liu, Y.; Ma, F. Inter-reflection compensation for immersive projection display. Multimed. Tools Appl. 2024, 83, 10427–10443. [Google Scholar] [CrossRef]
- Choi, H.; Oh, J.; Chung, J.; Alexandropoulos, G.C.; Choi, J. WiThRay: A Versatile Ray-Tracing Simulator for Smart Wireless Environments. IEEE Access 2023, 11, 56822–56845. [Google Scholar] [CrossRef]
- Vrana, V.; Das, S. Dynamic Restructuring of Digital Media and Entertainment Sector: Role of Urbanization, Industrial Innovation, and Technological Evolution. In Digital Entertainment as Next Evolution in Service Sector: Emerging Digital Solutions in Reshaping Different Industries; Springer: Singapore, 2023; pp. 15–34. [Google Scholar] [CrossRef]
- Goh, E.; Al-Tabbaa, O.; Khan, Z. Unravelling the complexity of the Video Game Industry: An integrative framework and future research directions. Telemat. Inform. Rep. 2023, 12, 100100. [Google Scholar] [CrossRef]
- Pan, S.; Xu, G.J.; Guo, K.; Park, S.H.; Ding, H. Cultural insights in souls-like games: Analyzing player behaviors, perspectives, and emotions across a multicultural context. IEEE Trans. Games 2024, 1–12. [Google Scholar] [CrossRef]
- Pan, S.; Xu, G.J.; Guo, K.; Park, S.H.; Ding, H. Video-based engagement estimation of game streamers: An interpretable multimodal neural network approach. IEEE Trans. Games 2023, 1–12. [Google Scholar] [CrossRef]
- Kovalenko, V.V.; Marienko, M.V.; Sukhikh, A.S. Use of Augmented and Virtual Reality Tools in a General Secondary Education Institution in the Context of Blended Learning. Inf. Technol. Learn. Tools 2021, 86, 70–86. [Google Scholar] [CrossRef]
- Zhang, Q.; Wang, K.; Zhou, S. Application and practice of vr virtual education platform in improving the quality and ability of college students. IEEE Access 2020, 8, 162830–162837. [Google Scholar] [CrossRef]
- Spagnolo, F.; Corsonello, P.; Frustaci, F.; Perri, S. Design of a Low-Power Super-Resolution Architecture for Virtual Reality Wearable Devices. IEEE Sens. J. 2023, 23, 9009–9016. [Google Scholar] [CrossRef]
- Cheng, D.; Chen, L.; Lv, C.; Guo, L.; Kou, Q. Light-guided and cross-fusion U-Net for anti-illumination image super-resolution. IEEE Trans. Circuits Syst. Video Technol. 2022, 32, 8436–8449. [Google Scholar] [CrossRef]
- Yang, S.; Jin, Y.; Lei, J.; Zhang, S. Multi-directional guidance network for fine-grained visual classification. Vis. Comput. 2024, 1–12. [Google Scholar] [CrossRef]
- Li, Y.; Yue, J.; Wang, J.; Tang, C.; He, Y.; Jia, W.; Zou, K.; Zhang, L.; Yang, H.; Liu, Y. A Weight-Reload-Eliminated Compute-in-Memory Accelerator for 60 fps 4K Super-Resolution. IEEE Trans. Circuits Syst. II Express Briefs 2023, 70, 1179–1183. [Google Scholar] [CrossRef]
- Yin, L.; Wang, L.; Lu, S.; Wang, R.; Yang, Y.; Yang, B.; Liu, S.; AlSanad, A.; AlQahtani, S.A.; Yin, Z.; et al. Convolution-Transformer for Image Feature Extraction. Comput. Model. Eng. Sci. 2024, 1–20. [Google Scholar] [CrossRef]
- Madhusudana, P.C.; Soundararajan, R. Subjective and objective quality assessment of stitched images for virtual reality. IEEE Trans. Image Process. 2019, 28, 5620–5635. [Google Scholar] [CrossRef]
- Duan, H.; Min, X.; Sun, W.; Zhu, Y.; Zhang, X.P.; Zhai, G. Attentive Deep Image Quality Assessment for Omnidirectional Stitching. IEEE J. Sel. Top. Signal Process. 2023, 17, 1150–1164. [Google Scholar] [CrossRef]
- Riecke, B.E.; Clement, D.; Adhikari, A.; Quesnel, D.; Zielasko, D.; Von Der Heyde, M. HyperJumping in Virtual Vancouver: Combating Motion Sickness by Merging Teleporting and Continuous VR Locomotion in an Embodied Hands-Free VR Flying Paradigm. In Proceedings of the Special Interest Group on Computer Graphics and Interactive Techniques Conference, Vancouver, BC, Canada, 7–11 August 2022. [Google Scholar] [CrossRef]
- Qi, F.; Tan, X.; Zhang, Z.; Chen, M.; Xie, Y.; Ma, L. Glass makes blurs: Learning the visual blurriness for glass surface detection. IEEE Trans. Ind. Inform. 2024, 20, 6631–6641. [Google Scholar] [CrossRef]
- Caputo, A.; Zancanaro, M.; Giachetti, A. Eyes on Teleporting: Comparing Locomotion Techniques in Virtual Reality with Respect to Presence, Sickness and Spatial Orientation. In Human-Computer Interaction—INTERACT 2023; Springer: Cham, Switzerland, 2023; Volume 14144, pp. 547–566. [Google Scholar] [CrossRef]
- Zhou, T.; Cai, Z.; Liu, F.; Su, J. In pursuit of beauty: Aesthetic-aware and context-adaptive photo selection in crowdsensing. IEEE Trans. Knowl. Data Eng. 2023, 35, 9364–9377. [Google Scholar] [CrossRef]
- Xu, M.; Li, C.; Zhang, S.; Callet, P.L. State-of-the-Art in 360 Video/Image Processing: Perception, Assessment and Compression. IEEE J. Sel. Top. Signal Process. 2020, 14, 5–26. [Google Scholar] [CrossRef]
- El Beheiry, M.; Doutreligne, S.; Caporal, C.; Ostertag, C.; Dahan, M.; Masson, J.B. Virtual Reality: Beyond Visualization. J. Mol. Biol. 2019, 431, 1315–1321. [Google Scholar] [CrossRef]
- Laghari, A.A.; Laghari, K.u.R.; Memon, K.A.; Soomro, M.B.; Laghari, R.A.; Kumar, V. Quality of experience (QoE) assessment of games on workstations and mobile. Entertain. Comput. 2020, 34, 100362. [Google Scholar] [CrossRef]
- Illahi, G.K.; Gemert, T.V.; Siekkinen, M.; Masala, E.; Oulasvirta, A.; Ylä-Jääski, A. Cloud Gaming with Foveated Video Encoding. ACM Trans. Multimed. Comput. Commun. Appl. 2020, 16, 1–24. [Google Scholar] [CrossRef]
- Nevelsteen, K.J. Virtual world, defined from a technological perspective and applied to video games, mixed reality, and the Metaverse. Comput. Animat. Virtual Worlds 2018, 29, e1752. [Google Scholar] [CrossRef]
- Jumani, A.K.; Siddique, W.A.; Laghari, A.A.; Abro, A.; Khan, A.A. Virtual reality and augmented reality for education. In Multimedia Computing Systems and Virtual Reality; CRC Press: Boca Raton, FL, USA, 2022; pp. 189–210. [Google Scholar]
- Laghari, A.A.; He, H.; Memon, K.A.; Laghari, R.A.; Halepoto, I.A.; Khan, A. Quality of experience (QoE) in cloud gaming models: A review. Multiagent Grid Syst. 2019, 15, 289–304. [Google Scholar] [CrossRef]
- Krahenbuhl, P. Free Supervision from Video Games. In Proceedings of the IEEE Computer Society Conference on Computer Vision and Pattern Recognition, Salt Lake City, UT, USA, 18–23 June 2018; pp. 2955–2964. [Google Scholar] [CrossRef]
- Madiha, H.; Lei, L.; Laghari, A.A.; Karim, S. Quality of experience and quality of service of gaming services in fog computing. In Proceedings of the ICMSS 2020: 2020 4th International Conference on Management Engineering, Software Engineering and Service Sciences, Wuhan, China, 17–19 January 2020; pp. 225–228. [Google Scholar] [CrossRef]
- Laghari, A.A.; Jumani, A.K.; Kumar, K.; Chhajro, M.A. Systematic Analysis of Virtual Reality and Augmented Reality. Int. J. Inf. Eng. Electron. Bus. 2021, 13, 36–43. [Google Scholar] [CrossRef]
- Laghari, A.A.; Laghari, R.A.; Khan, A. Quality of Experience Assessment of Online Server/Cloud Gaming. In Proceedings of the 2022 8th Annual International Conference on Network and Information Systems for Computers, ICNISC 2022, Hangzhou, China, 16–19 September 2022; pp. 834–837. [Google Scholar] [CrossRef]
- Brookes, J.; Warburton, M.; Alghadier, M.; Mon-Williams, M.; Mushtaq, F. Studying human behavior with virtual reality: The Unity Experiment Framework. Behav. Res. Methods 2020, 52, 455–463. [Google Scholar] [CrossRef] [PubMed]
- Ahir, K.; Govani, K.; Gajera, R.; Shah, M. Application on Virtual Reality for Enhanced Education Learning, Military Training and Sports. Augment. Hum. Res. 2020, 5, 7. [Google Scholar] [CrossRef]
- Elbamby, M.S.; Perfecto, C.; Bennis, M.; Doppler, K. Toward Low-Latency and Ultra-Reliable Virtual Reality. IEEE Netw. 2018, 32, 78–84. [Google Scholar] [CrossRef]
- Albaghajati, A.; Ahmed, M. Video Game Automated Testing Approaches: An Assessment Framework. IEEE Trans. Games 2023, 15, 81–94. [Google Scholar] [CrossRef]
- Biggar, O.; Shames, I. The graph structure of two-player games. Sci. Rep. 2023, 13, 1833. [Google Scholar] [CrossRef]
- Avola, D.; Cinque, L.; Foresti, G.L.; Marini, M.R. A novel low cybersickness dynamic rotation gain enhancer based on spatial position and orientation in virtual environments. Virtual Real. 2023, 27, 3191–3209. [Google Scholar] [CrossRef]
- Kari, T.; Kosa, M. Acceptance and use of virtual reality games: An extension of HMSAM. Virtual Real. 2023, 27, 1585–1605. [Google Scholar] [CrossRef]
- Lee, H.; Jung, T.H.; tom Dieck, M.C.; Chung, N. Experiencing immersive virtual reality in museums. Inf. Manag. 2020, 57, 103229. [Google Scholar] [CrossRef]
- Guo, T.; Yuan, H.; Hamzaoui, R.; Wang, X.; Wang, L. Dependence-Based Coarse-to-Fine Approach for Reducing Distortion Accumulation in G-PCC Attribute Compression. IEEE Trans. Ind. Inform. 2024, 1–11. [Google Scholar] [CrossRef]
- Berg, L.P.; Vance, J.M. Industry use of virtual reality in product design and manufacturing: A survey. Virtual Real. 2017, 21, 1–17. [Google Scholar] [CrossRef]
- Maltezos, E.; Doulamis, A.; Ioannidis, C. Improving the visualisation of 3D textured models via shadow detection and removal. In Proceedings of the 2017 9th International Conference on Virtual Worlds and Games for Serious Applications, VS-Games, Athens, Greece, 6–8 September 2017; pp. 161–164. [Google Scholar] [CrossRef]
- Shin, D.H. The role of affordance in the experience of virtual reality learning: Technological and affective affordances in virtual reality. Telemat. Inform. 2017, 34, 1826–1836. [Google Scholar] [CrossRef]
- Dincelli, E.; Yayla, A. Immersive virtual reality in the age of the Metaverse: A hybrid-narrative review based on the technology affordance perspective. J. Strateg. Inf. Syst. 2022, 31, 101717. [Google Scholar] [CrossRef]
- Hassapopoulou, M. Playing with history: Collective memory, national trauma, and dark tourism in virtual reality docugames. New Rev. Film Telev. Stud. 2018, 16, 365–392. [Google Scholar] [CrossRef]
- Xi, X.; Xi, B.; Miao, C.; Yu, R.; Xie, J.; Xiang, R.; Hu, F. Factors influencing technological innovation efficiency in the Chinese video game industry: Applying the meta-frontier approach. Technol. Forecast. Soc. Chang. 2022, 178, 121574. [Google Scholar] [CrossRef]
- Boletsis, C.; Cedergren, J.E. VR Locomotion in the New Era of Virtual Reality: An Empirical Comparison of Prevalent Techniques. Adv. Hum.-Comput. Interact. 2019, 2019, 7420781. [Google Scholar] [CrossRef]
- Sun, G.; Xu, Z.; Yu, H.; Chen, X.; Chang, V.; Vasilakos, A.V. Low-latency and resource-efficient service function chaining orchestration in network function virtualization. IEEE Internet Things J. 2019, 7, 5760–5772. [Google Scholar] [CrossRef]
- BT, I.T.U. Methodologies for the subjective assessment of the quality of television images. In Document Recommendation ITU-R BT. 500-14 (10/2019); ITU: Geneva, Switzerland, 2020. [Google Scholar]
- International Telecommunication Union. Subjective video quality assessment methods for multimedia applications. In ITU-T Recommendation P.910; ITU: Geneva, Switzerland, 2023. [Google Scholar]
- Electronics Force. Available online: https://www.electronicsforce.com/index.php?main_page=product_info&products_id=66245 (accessed on 20 May 2024).


| Parameters | Wi-Fi-H | Wi-Fi-L | 5G-H | 5G-L |
|---|---|---|---|---|
| Image Blur | 2.7 | 3.4 | 2.2 | 3.1 |
| Resolution fluctuation/Jagged | 2.5 | 4.1 | 3.5 | 4.7 |
| Graphics Quality | 4.3 | 3.2 | 4.8 | 4.2 |
| Buffering | 2.1 | 4.3 | 3.2 | 3.7 |
| Sum of Squares | df | Mean Square | F | Sig. | |
|---|---|---|---|---|---|
| Image_Blur | |||||
| Between Groups | 37.060 | 3 | 12.353 | 7.337 | 0.000 |
| Within Groups | 303.065 | 180 | 1.684 | ||
| Total | 340.125 | 183 | |||
| Low_Resolution | |||||
| Between Groups | 120.196 | 3 | 40.065 | 31.880 | 0.000 |
| Within Groups | 226.217 | 180 | 1.257 | ||
| Total | 346.413 | 183 | |||
| Graphic_Quality | |||||
| Between Groups | 60.973 | 3 | 20.324 | 29.832 | 0.000 |
| Within Groups | 122.630 | 180 | 0.681 | ||
| Total | 183.603 | 183 | |||
| Buffering | |||||
| Between Groups | 120.016 | 3 | 40.005 | 38.710 | 0.000 |
| Within Groups | 186.022 | 180 | 1.033 | ||
| Total | 306.038 | 183 |
| Dependent Variable | Groups | Mean Diff (I–J) | Std. Error | Sig. | 95% CI | ||
|---|---|---|---|---|---|---|---|
| (I) | (J) | L. B | U. B | ||||
| Image Blur | Wi-Fi H | Wi-Fi L | −0.674 | 0.271 | 0.082 | −1.40 | 0.05 |
| 5G H | 0.522 | 0.271 | 0.332 | −0.20 | 1.24 | ||
| 5G L | −0.391 | 0.271 | 0.899 | −1.11 | 0.33 | ||
| Wi-Fi L | Wi-Fi H | 0.674 | 0.271 | 0.082 | −0.05 | 1.40 | |
| 5G H | 1.196 * | 0.271 | 0.000 | 0.47 | 1.92 | ||
| 5G L | 0.283 | 0.271 | 1.000 | −0.44 | 1.00 | ||
| 5G H | Wi-Fi H | −0.522 | 0.271 | 0.332 | −1.24 | 0.20 | |
| Wi-Fi L | −1.196 * | 0.271 | 0.000 | −1.92 | −0.47 | ||
| 5G L | −0.913 * | 0.271 | 0.005 | −1.63 | −0.19 | ||
| 5G L | Wi-Fi H | 0.391 | 0.271 | 0.899 | −0.33 | 1.11 | |
| Wi-Fi L | −0.283 | 0.271 | 1.000 | −1.00 | 0.44 | ||
| 5G H | 0.913 * | 0.271 | 0.005 | 0.19 | 1.63 | ||
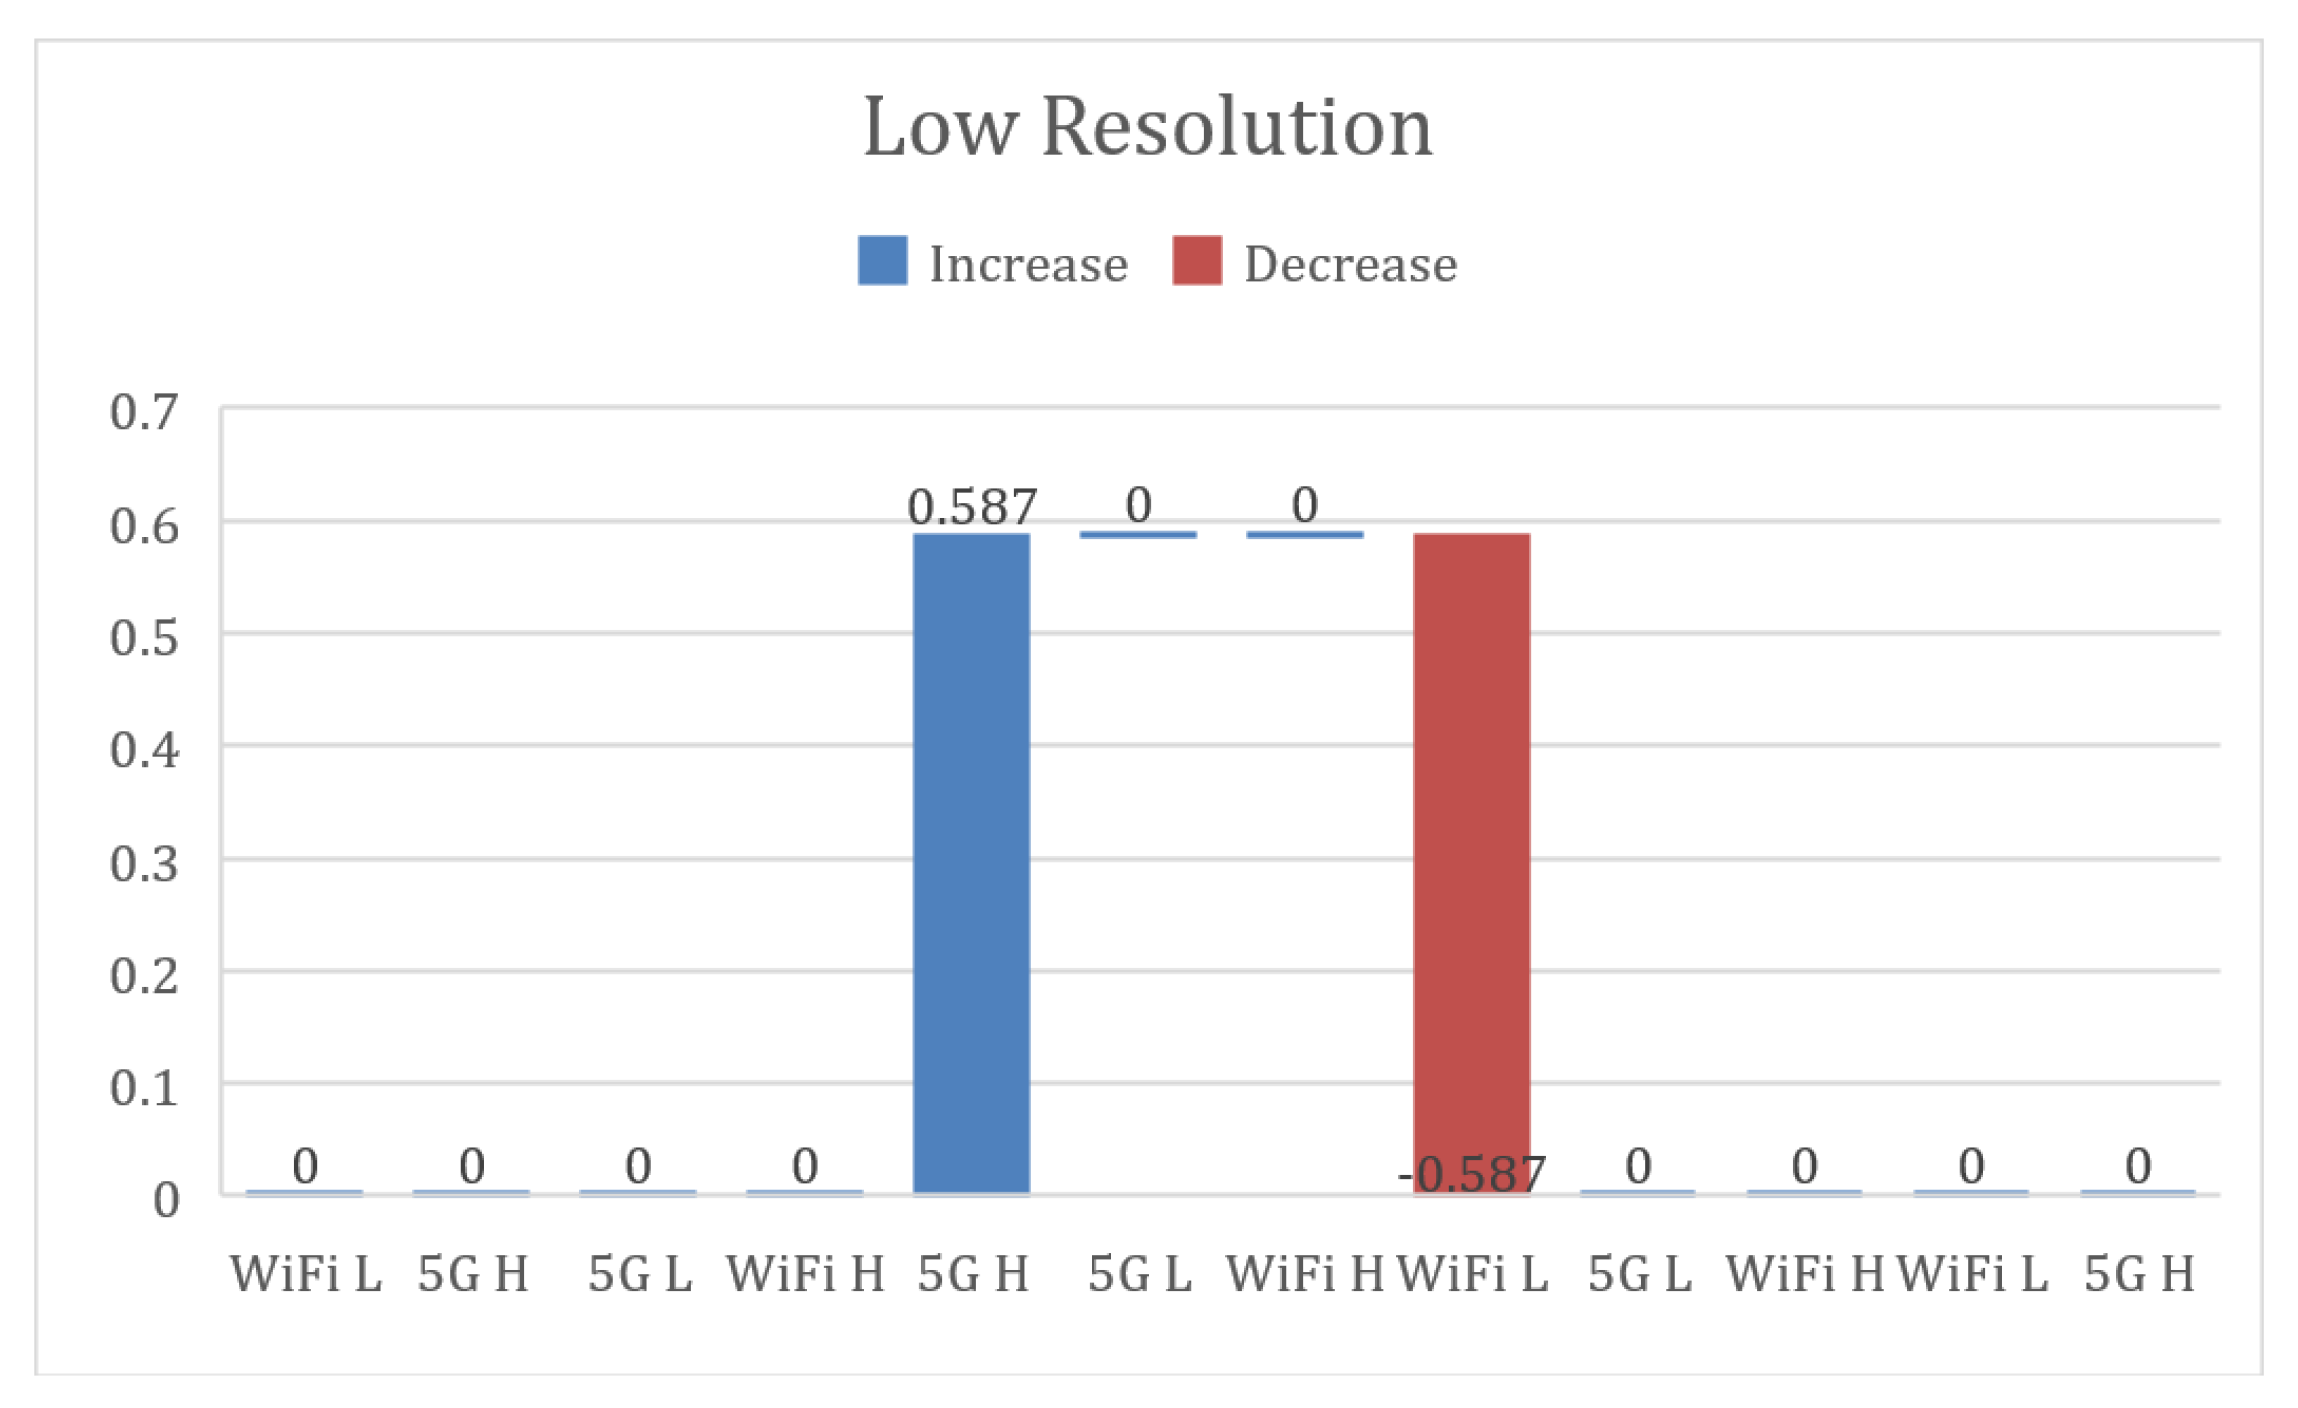
| Low Resolution | Wi-Fi H | Wi-Fi L | −1.565 * | 0.234 | 0.000 | −2.19 | −0.94 |
| 5G H | −0.978 * | 0.234 | 0.000 | −1.60 | −0.35 | ||
| 5G L | −2.196 * | 0.234 | 0.000 | −2.82 | −1.57 | ||
| Wi-Fi L | Wi-Fi H | 1.565 * | 0.234 | 0.000 | 0.94 | 2.19 | |
| 5G H | 0.587 | 0.234 | 0.078 | −0.04 | 1.21 | ||
| 5G L | −0.630 * | 0.234 | 0.046 | −1.25 | −0.01 | ||
| 5G H | Wi-Fi H | 0.978 * | 0.234 | 0.000 | 0.35 | 1.60 | |
| Wi-Fi L | −0.587 | 0.234 | 0.078 | −1.21 | 0.04 | ||
| 5G L | −1.217 * | 0.234 | 0.000 | −1.84 | −0.59 | ||
| 5G L | Wi-Fi H | 2.196 * | 0.234 | 0.000 | 1.57 | 2.82 | |
| Wi-Fi L | 0.630 * | 0.234 | 0.046 | 0.01 | 1.25 | ||
| 5G H | 1.217 * | 0.234 | 0.000 | 0.59 | 1.84 | ||
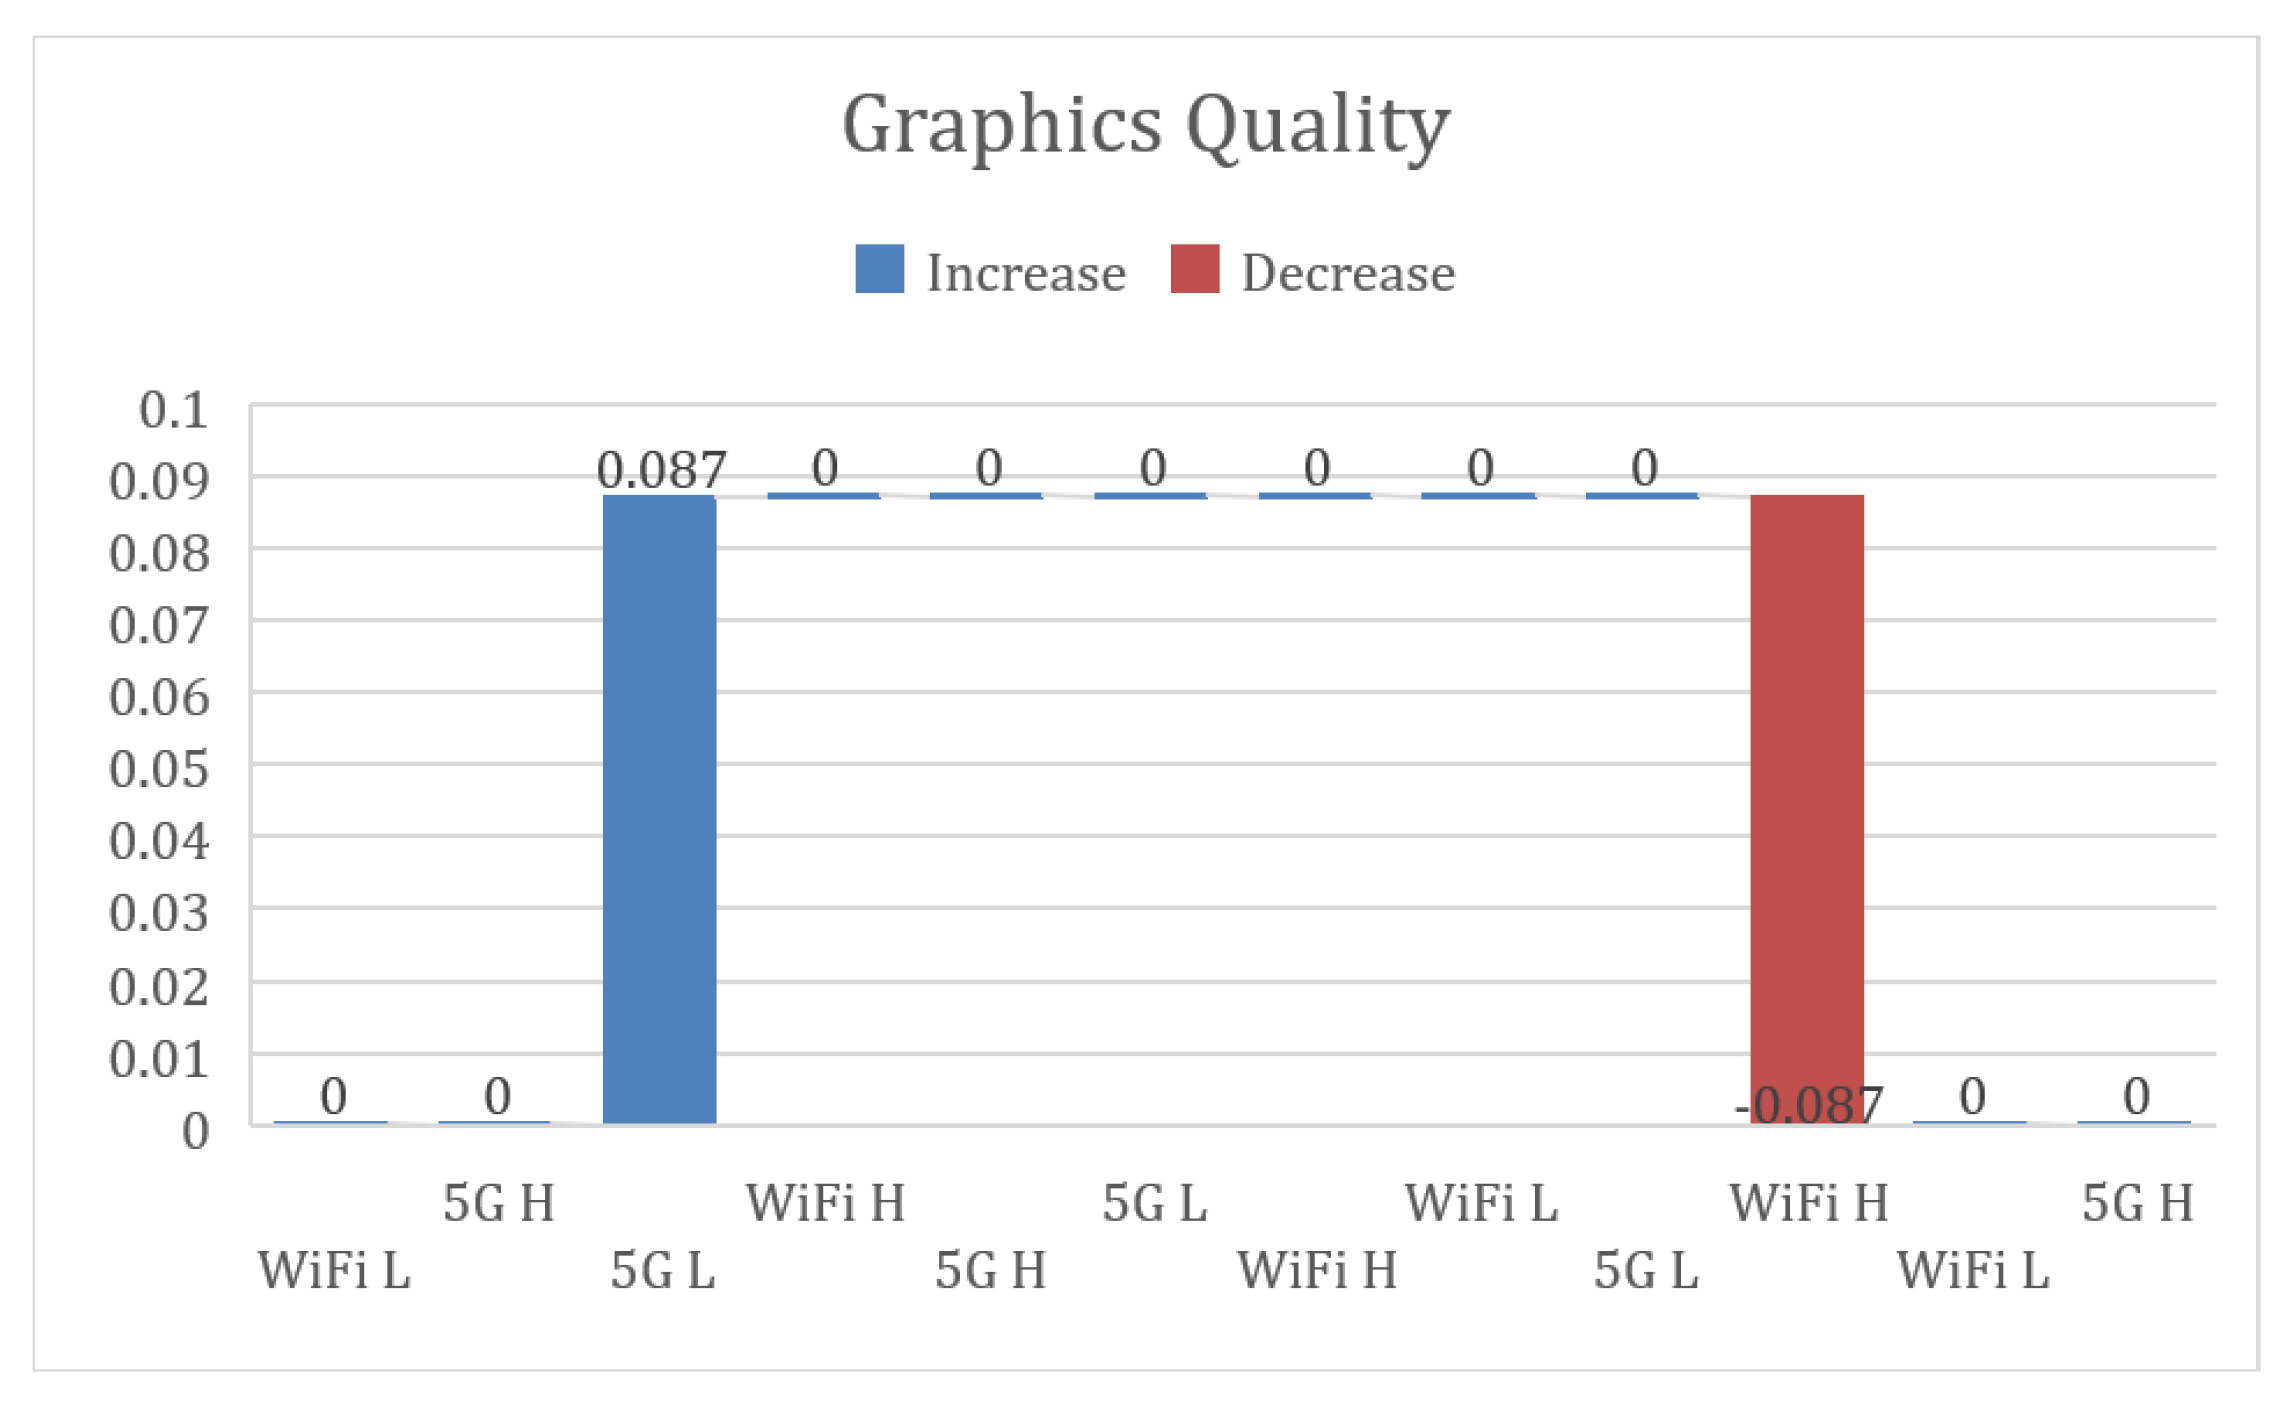
| Graphic Quality | Wi-Fi H | Wi-Fi L | 1.087 * | 0.172 | 0.000 | 0.63 | 1.55 |
| 5G H | −0.500 * | 0.172 | 0.025 | −0.96 | −0.04 | ||
| 5G L | 0.087 | 0.172 | 1.000 | −0.37 | 0.55 | ||
| Wi-Fi L | Wi-Fi H | −1.087 * | 0.172 | 0.000 | −1.55 | −0.63 | |
| 5G H | −1.587 * | 0.172 | 0.000 | −2.05 | −1.13 | ||
| 5G L | −1.000 * | 0.172 | 0.000 | −1.46 | −0.54 | ||
| 5G H | Wi-Fi H | 0.500 * | 0.172 | 0.025 | 0.04 | 0.96 | |
| Wi-Fi L | 1.587 * | 0.172 | 0.000 | 1.13 | 2.05 | ||
| 5G L | 0.587 * | 0.172 | 0.005 | 0.13 | 1.05 | ||
| 5G L | Wi-Fi H | −0.087 | 0.172 | 1.000 | −0.55 | 0.37 | |
| Wi-Fi L | 1.000 * | 0.172 | 0.000 | 0.54 | 1.46 | ||
| 5G H | −0.587 * | 0.172 | 0.005 | −1.05 | −0.13 | ||
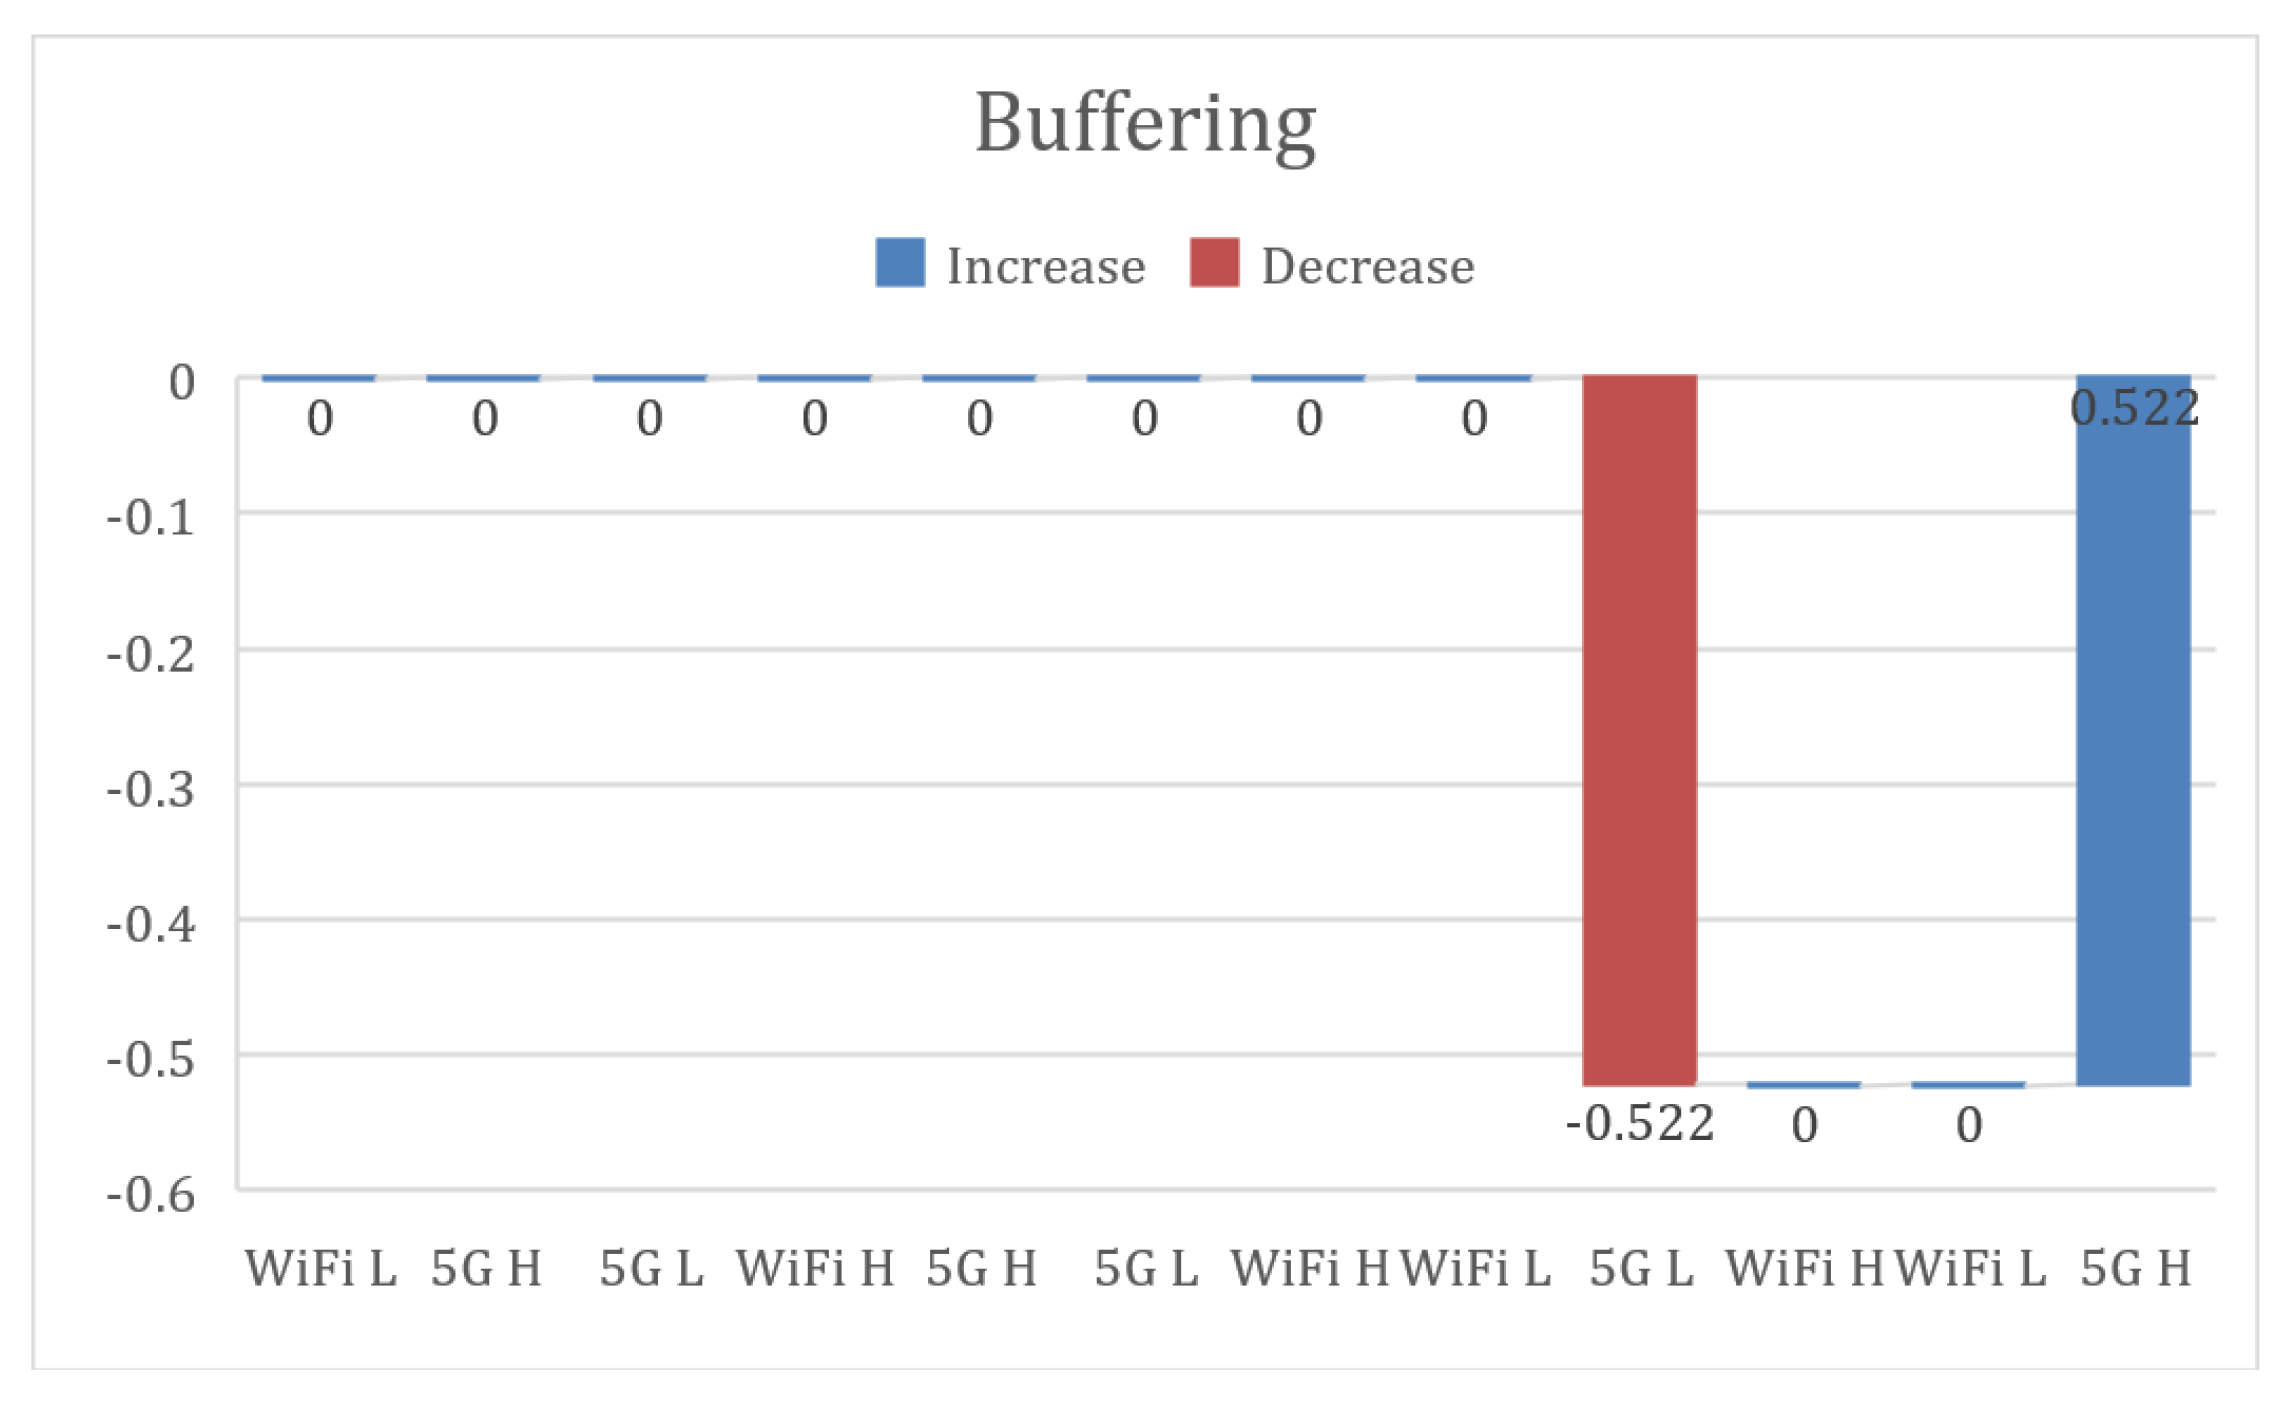
| Buffering | Wi-Fi H | Wi-Fi L | −2.196 * | 0.212 | 0.000 | −2.76 | −1.63 |
| 5G H | −1.087 * | 0.212 | 0.000 | −1.65 | −0.52 | ||
| 5G L | −1.609 * | 0.212 | 0.000 | −2.17 | −1.04 | ||
| Wi-Fi L | Wi-Fi H | 2.196 * | 0.212 | 0.000 | 1.63 | 2.76 | |
| 5G H | 1.109 * | 0.212 | 0.000 | 0.54 | 1.67 | ||
| 5G L | 0.587 * | 0.212 | 0.037 | 0.02 | 1.15 | ||
| 5G H | Wi-Fi H | 1.087 * | 0.212 | 0.000 | 0.52 | 1.65 | |
| Wi-Fi L | −1.109 * | 0.212 | 0.000 | −1.67 | −0.54 | ||
| 5G L | −0.522 | 0.212 | 0.089 | −1.09 | 0.04 | ||
| 5G L | Wi-Fi H | 1.609 * | 0.212 | 0.000 | 1.04 | 2.17 | |
| Wi-Fi L | −0.587 * | 0.212 | 0.037 | −1.15 | −0.02 | ||
| 5G H | 0.522 | 0.212 | 0.089 | −0.04 | 1.09 | ||
| Levene Statistic | df1 | df2 | Sig. | |
|---|---|---|---|---|
| Image Blur | ||||
| Based on Mean | 11.992 | 3 | 180 | 0.000 |
| Based on Median | 7.056 | 3 | 180 | 0.000 |
| Based on Median and with adjusted df | 7.056 | 3 | 169.338 | 0.000 |
| Based on trimmed mean | 11.041 | 3 | 180 | 0.000 |
| Low Resolution | ||||
| Based on Mean | 32.765 | 3 | 180 | 0.000 |
| Based on Median | 19.625 | 3 | 180 | 0.000 |
| Based on Median and with adjusted df | 19.625 | 3 | 159.411 | 0.000 |
| Based on trimmed mean | 32.869 | 3 | 180 | 0.000 |
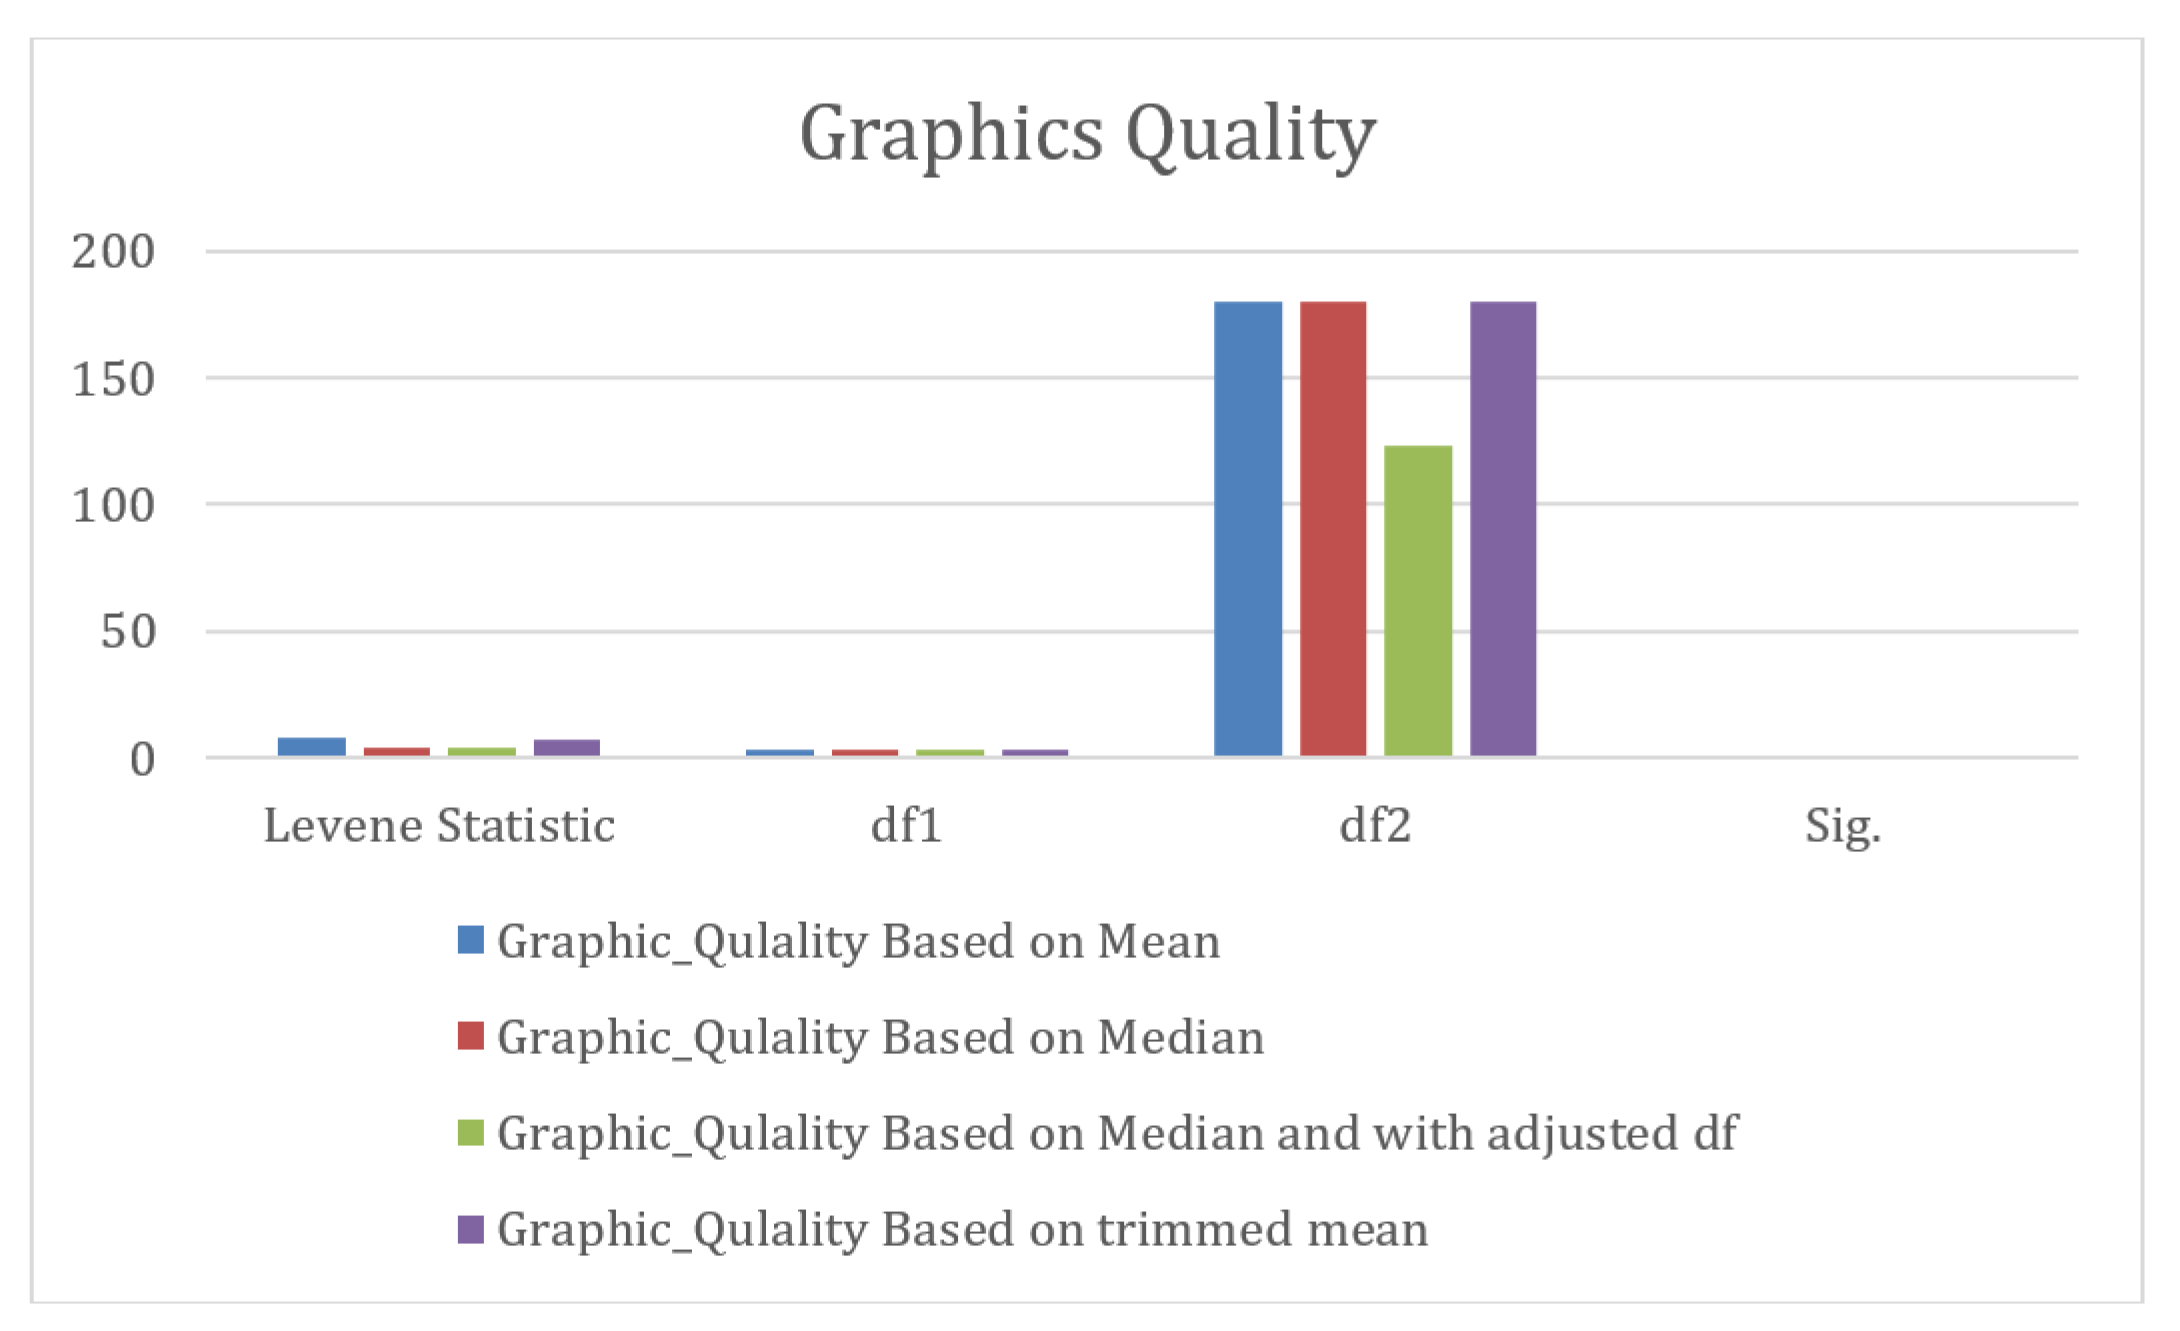
| Graphic Quality | ||||
| Based on Mean | 7.875 | 3 | 180 | 0.000 |
| Based on Median | 3.978 | 3 | 180 | 0.009 |
| Based on Median and with adjusted df | 3.978 | 3 | 123.162 | 0.010 |
| Based on trimmed mean | 7.625 | 3 | 180 | 0.000 |
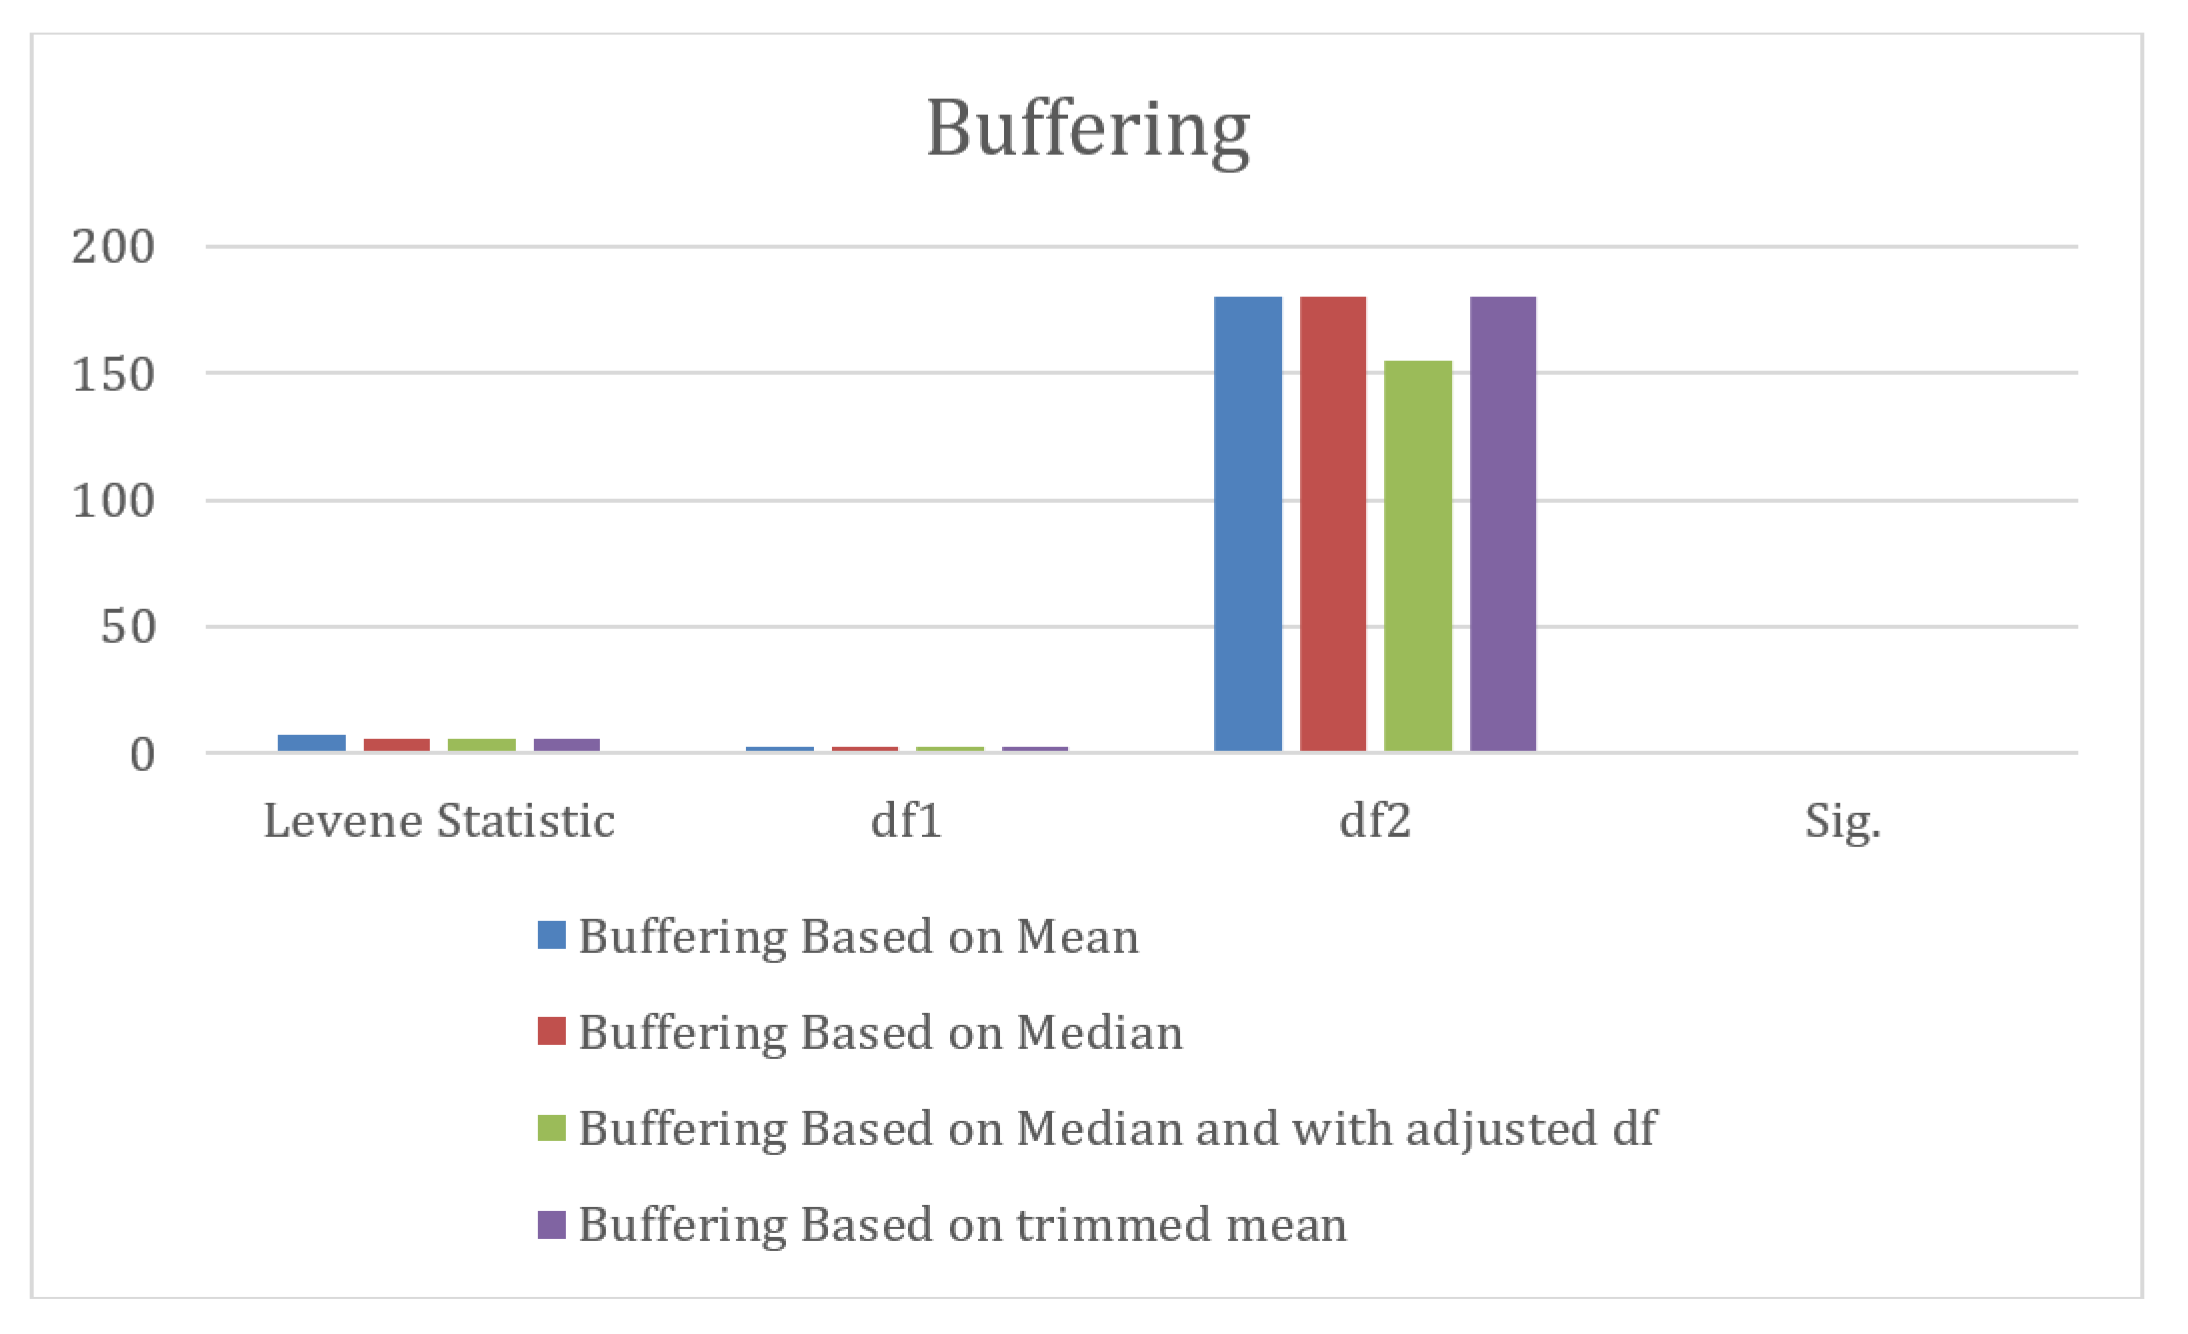
| Buffering | ||||
| Based on Mean | 7.455 | 3 | 180 | 0.000 |
| Based on Median | 5.935 | 3 | 180 | 0.001 |
| Based on Median and with adjusted df | 5.935 | 3 | 155.029 | 0.001 |
| Based on trimmed mean | 5.853 | 3 | 180 | 0.001 |
| Parameter | Value |
|---|---|
| N | 184 |
| Kendall’s W a | 0.141 |
| Chi-Square | 77.931 |
| df | 3 |
| Asymp. Sig. | 0.000 |
| Groups | N | Mean Rank |
|---|---|---|
| Graphic Quality | ||
| Wi-Fi H | 46 | 104.21 |
| Wi-Fi L | 46 | 47.41 |
| 5G H | 46 | 127.90 |
| 5G L | 46 | 90.48 |
| Total | 184 | |
| Image Blur | ||
| Wi-Fi H | 46 | 85.93 |
| Wi-Fi L | 46 | 114.13 |
| 5G H | 46 | 65.96 |
| 5G L | 46 | 103.98 |
| Total | 184 | |
| Low Resolution | ||
| Wi-Fi H | 46 | 56.59 |
| Wi-Fi L | 46 | 102.80 |
| 5G H | 46 | 76.65 |
| 5G L | 46 | 133.96 |
| Total | 184 | |
| Buffering | ||
| Wi-Fi H | 46 | 48.43 |
| Wi-Fi L | 46 | 132.78 |
| 5G H | 46 | 82.34 |
| 5G L | 46 | 106.45 |
| Total | 184 | |
| Graphics | Image | Low | Buffering | |
|---|---|---|---|---|
| Quality | Blur | Resolution | ||
| Chi-Square | 64.017 | 22.980 | 59.650 | 66.143 |
| df | 3 | 3 | 3 | 3 |
| Asymp. Sig. | 0.000 | 0.000 | 0.000 | 0.000 |
| Wi-Fi H vs. Wi-Fi L | Wi-Fi H vs. 5G H | Wi-Fi H vs. 5G L | Wi-Fi L vs. 5G H | Wi-Fi L vs. 5G L | 5G H vs. 5G L | ||
|---|---|---|---|---|---|---|---|
| Image Blur | t | −2.380 | 1.635 | −1.373 | 4.682 | 1.338 | −3.549 |
| sig | 0.019 | 0.105 | 0.173 | 0.000 | 0.330 | 0.010 | |
| CI (Lower) | −1.237 | −0.112 | −0.957 | 0.688 | −0.137 | −1.424 | |
| CI (Upper) | −0.111 | 1.156 | 0.175 | 1.703 | 0.702 | −0.400 | |
| Low Resolution | t | −5.529 | −3.405 | −8.557 | 2.816 | −3.856 | −7.130 |
| sig | 0.000 | 0.001 | 0.000 | 0.006 | 0.030 | 0.000 | |
| CI (Lower) | −2.128 | −1.549 | −2.705 | 0.173 | −0.955 | −1.557 | |
| CI (Upper) | −1.003 | −0.407 | −1.686 | 1.001 | −0.310 | −0.880 | |
| Graphic Quality | t | 5.059 | −2.962 | 0.468 | −10.104 | −5.703 | 5.133 |
| sig | 0.000 | 0.004 | 0.641 | 0.000 | 0.090 | 0.010 | |
| CI (Lower) | 0.660 | −0.835 | −0.282 | −1.899 | −1.348 | 0.360 | |
| CI (Upper) | 1.514 | −0.165 | 0.456 | −1.275 | −0.650 | 0.814 | |
| Buffering | t | −10.232 | −4.388 | −6.417 | 6.745 | 3.477 | −2.493 |
| sig | 0.000 | 0.000 | 0.000 | 0.000 | 0.000 | 0.330 | |
| CI (Lower) | −2.622 | −1.579 | −2.107 | 0.782 | 0.252 | −0.938 | |
| CI (Upper) | −1.769 | −0.595 | −1.111 | 1.435 | 0.250 | −0.110 |
Disclaimer/Publisher’s Note: The statements, opinions and data contained in all publications are solely those of the individual author(s) and contributor(s) and not of MDPI and/or the editor(s). MDPI and/or the editor(s) disclaim responsibility for any injury to people or property resulting from any ideas, methods, instructions or products referred to in the content. |
© 2024 by the authors. Licensee MDPI, Basel, Switzerland. This article is an open access article distributed under the terms and conditions of the Creative Commons Attribution (CC BY) license (https://creativecommons.org/licenses/by/4.0/).
Share and Cite
Jumani, A.K.; Shi, J.; Laghari, A.A.; Estrela, V.V.; Sampedro, G.A.; Almadhor, A.; Kryvinska, N.; ul Nabi, A. Quality of Experience That Matters in Gaming Graphics: How to Blend Image Processing and Virtual Reality. Electronics 2024, 13, 2998. https://doi.org/10.3390/electronics13152998
Jumani AK, Shi J, Laghari AA, Estrela VV, Sampedro GA, Almadhor A, Kryvinska N, ul Nabi A. Quality of Experience That Matters in Gaming Graphics: How to Blend Image Processing and Virtual Reality. Electronics. 2024; 13(15):2998. https://doi.org/10.3390/electronics13152998
Chicago/Turabian StyleJumani, Awais Khan, Jinglun Shi, Asif Ali Laghari, Vania V. Estrela, Gabriel Avelino Sampedro, Ahmad Almadhor, Natalia Kryvinska, and Aftab ul Nabi. 2024. "Quality of Experience That Matters in Gaming Graphics: How to Blend Image Processing and Virtual Reality" Electronics 13, no. 15: 2998. https://doi.org/10.3390/electronics13152998