

Collaborative Decision Making with Responsible AI: Establishing Trust and Load Models for Probabilistic Transparency

Abstract
1. Introduction
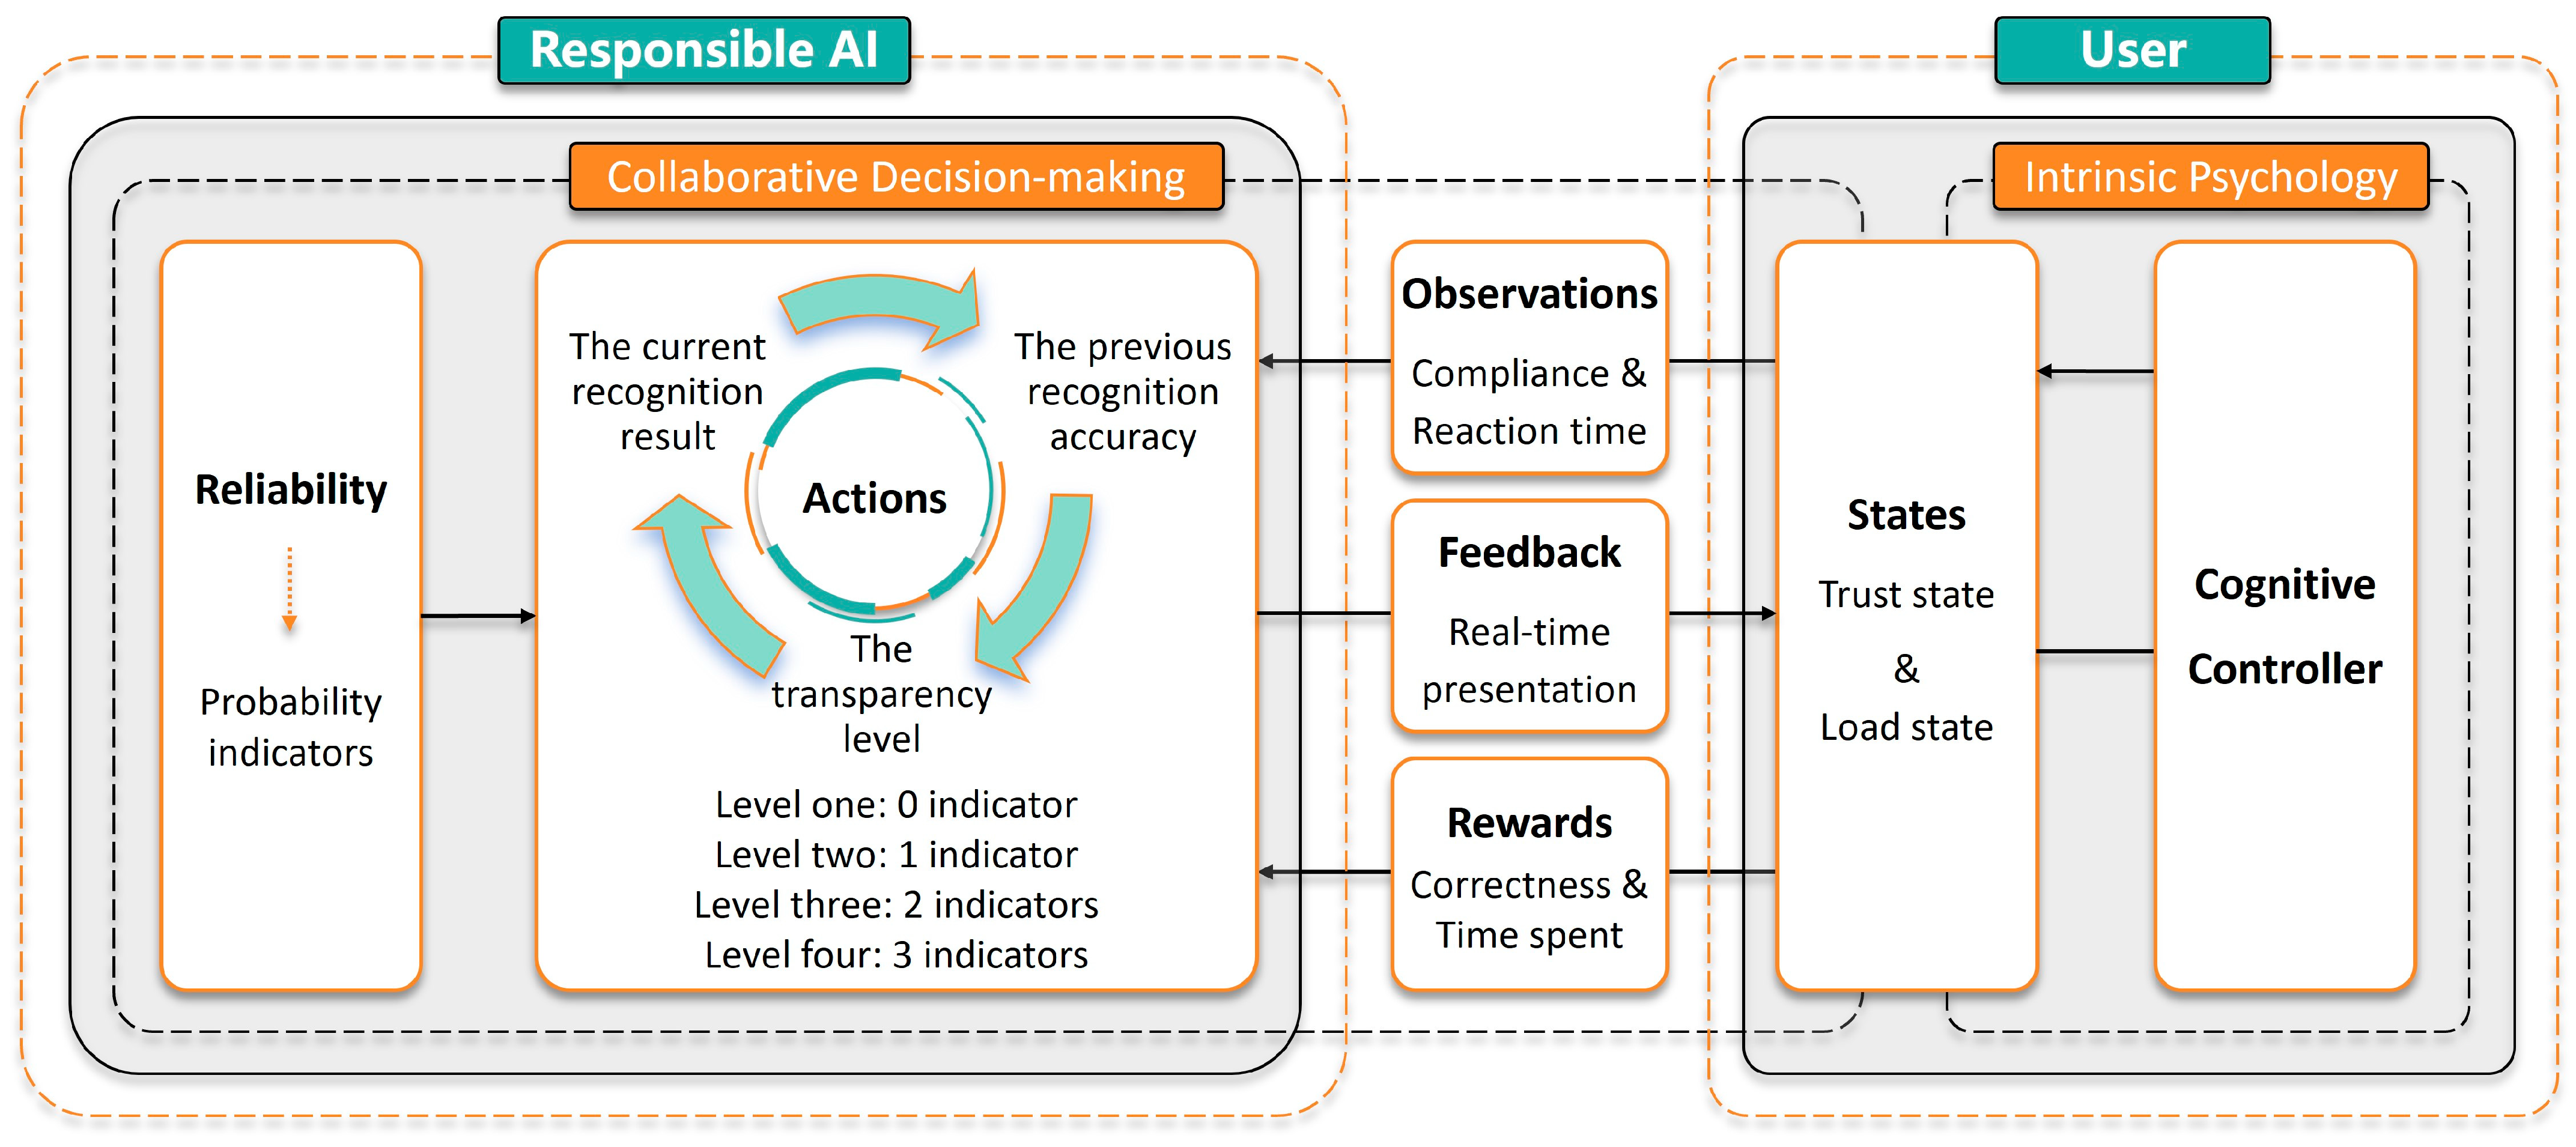
- The AI system first makes a decision and generates “Actions”. The AI system consolidates and analyzes various data to make decisions, such as determining whether an object is a threat or not. As a responsible AI, the “Actions” presented to users include three aspects: the current decision result, the correctness of the previous decision result, and the system’s transparency. The system’s transparency describes the reliability of the current decision result, reflected through a probabilistic indicator system. This probabilistic indicator system, being an abstract expression, can have different meanings in various application environments, such as reflecting the accuracy of data from various sources using measurement error, natural variation, and prediction error, or indicating the evaluation and measurement of the AI system itself using feature vector similarity, probability scores, and model confidence. The number of probabilistic indicators presented to the user reflects the transparency level of the AI system. For example, level 1 transparency indicates only providing the AI’s decision result to the user, while level 4 transparency includes the decision result plus three probabilistic indicators;
- “Actions” and “Feedback” are presented to the user in real-time, prompting changes in the user’s “States”. In the “Actions”, the correctness of the previous decision result pertains to the AI system’s decision result, while “Feedback” pertains to the correctness of the user’s previous decision. For instance, if in the previous collaborative decision, the user judged an object as a threat and it indeed was a threat, the “Feedback” will inform the user in real time that their decision was correct. Upon perceiving the “Actions” and “Feedback”, the user’s cognitive system is stimulated, which then responds to control interactive behaviors. This process affects the user’s trust and cognitive load states;
- The AI system generates “Observations” about the user and estimates the “States”. Influenced by trust and cognitive load states, the user exhibits two types of behavioral responses. One aspect is the user’s decision outcome, i.e., agreeing or disagreeing with the AI system’s decision, reflecting the user’s compliance with the AI system. The other aspect is the user’s response time in collaborative decision making. By observing these two behavioral responses, the AI system estimates the trust and cognitive load states;
- The AI system calculates the “Rewards” of the collaborative decision. The “Rewards” of the collaborative decision are composed of two aspects involving trust and cognitive load. One aspect is the ultimate correctness of the collaborative decision. Blind trust and compliance with the AI system are not always beneficial. For example, if the AI system judges an object as a threat when it is not and the user complies with the AI’s result, this should be considered a negative reward. The other aspect is the shorter the decision time, the higher the reward. In summary, the reward setting provides an optimization direction for the AI system’s dynamic adjustment, aiming to improve decision accuracy while reducing response time;
- The AI system dynamically adjusts the system’s transparency. Based on the estimation of “States” and the real-time calculation of “Rewards”, the AI system can determine the “Actions” strategy that maximizes “Rewards” under the current “States”. Among the three elements of “Actions”, the current decision result and the correctness of the previous decision result are directly tied to system reliability and cannot be adjusted through design. In contrast, system transparency is the object of dynamic adjustment. Therefore, the AI system can dynamically adjust the number of probabilistic indicators presented to the user to build a responsible AI system. This constitutes a cycle in the human–AI collaboration process, wherein the sequence of decisions (e.g., continuously judging whether multiple targets are threats), the user’s “States” dynamically change, and the number of probabilistic indicators displayed by the AI system also dynamically changes, ensuring that transparency always follows the optimal strategy for maximizing decision accuracy and minimizing time.
- State estimation through observations: Trust and load states are not directly accessible and need to be estimated through partial observations. Quantifying trust and load states first requires obtaining their current status; however, these states are difficult to observe directly and are hidden variables within cognitive processes. In the field of human–computer interaction research, the evaluation of trust and load states for electronic systems largely relies on self-reported survey methods. For example, the Likert Scale is used to assess trust states and the NASA Task Load Index is used to assess load states. However, in the context of real-time feedback algorithms, continuously querying the cognitive domain is usually infeasible. Therefore, this study constructs observation probability functions based on user observations (compliance and response time) to quantitatively estimate users’ trust and load states;
- Dynamic Characteristic Construction: Trust and load states are not fixed characteristics; they have a complex relationship with transparency and mutually influence each other. These states are highly sensitive to transparency and adaptively adjust during interactions. As the sequence of interactions unfolds, the dynamic interplay between these states and transparency evolves. Therefore, this study constructs transition probability functions to model the dynamic properties of users’ trust and load states.
2. Related Works
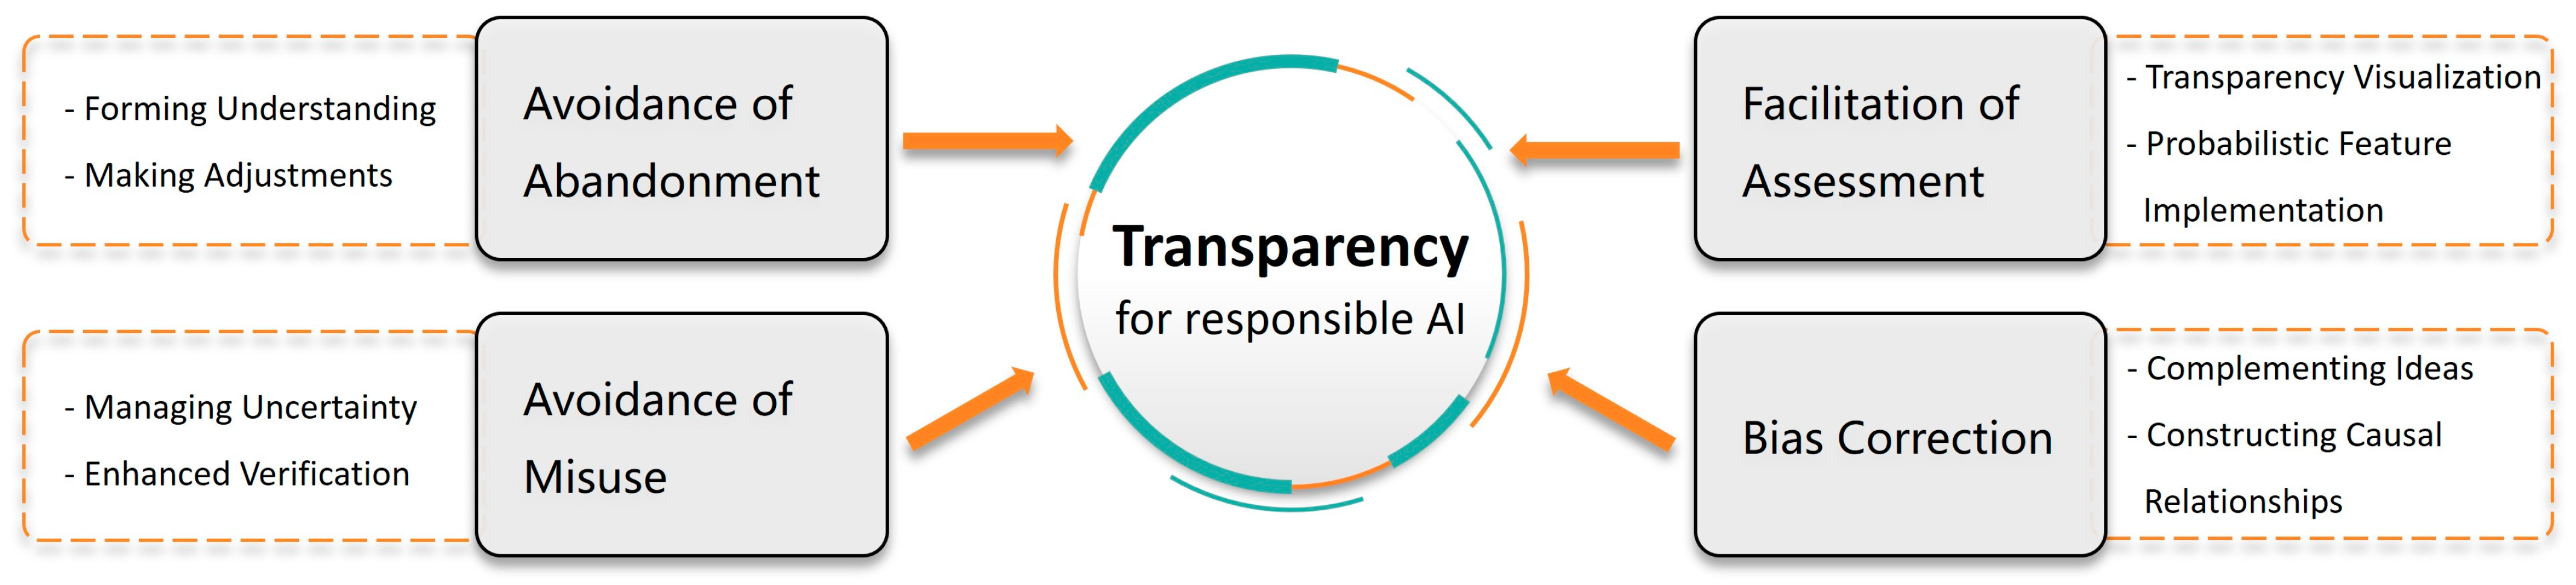
- Avoidance of abandonment. When AI operates in a “black box” manner and its output results do not match user expectations, it leads to biases in users’ perceptions of AI capabilities [21]. This ongoing cognitive dilemma and negative emotions affect users’ attitudes and behavioral intentions, gradually eroding and inhibiting their confidence in the system [22], thereby reducing their willingness to use the technology. More critically, this loss of confidence may introduce potential risks in critical real-time decision-making scenarios, affecting decision quality and implementation effectiveness [2]. This scenario is particularly evident in significant decision choices involving military recognition, disaster relief, and medical diagnosis [4]. Good transparency can present fundamental information, action reasons, and uncertain predictions, which aid users in understanding AI and making necessary adjustments, including providing missing instructions or information to AI and correcting its understanding [23];
- Avoidance of misuse. When AI outputs are not sufficiently understood and validated, misuse of its results may lead to adverse consequences or poor decisions [24]. The lack of necessary questioning of AI results and critical thinking will lead to the cognitive domain’s unreasonable confidence in recognition results [25]. Enhancing AI transparency displays can effectively manage uncertainty [2], help users identify when AI may operate beyond its limits, and determine when AI results should not be used [7];
- Facilitation of assessment. Enhanced transparency assists in more accurately assessing computational domain capabilities and limitations for trust calibration. Visualization of transparency and probability indicators is a standard tool for assessing and communicating risks [26]. Responsible AI should enhance the visibility of underlying processes to enable users to understand current states [2]. Precise probability indicators should be implemented in the computational domain, encompassing all sources of decision uncertainty (e.g., model performance, prior knowledge about training data distributions, and input data noise) [27], to emphasize AI limitations [28]. Displaying this information aids in evaluating whether AI logic and decisions are reasonable, judging their consistency with domain prior knowledge and practical experience, thereby calibrating trust [29]. Additionally, providing and highlighting this metadata to users [3] increases their awareness of probabilistic features [30], improves their perception of cognitive decision risks, and promotes greater caution [31];
- Bias correction. Responsible AI can complement users’ ideas through transparency information and probabilistic feature inference [32], for example, Zhou et al. introduce the uncertainty of training data and model represented by knowledge graphs into AI-informed decision making [33]. This additional information will correct users’ cognitive predictions and expectations, thereby improving the quality of recognition decisions [34]. Transparency design assists in constructing and testing causal relationship hypotheses related to recognition decisions [28], including forming reasons for decision outcomes and the association between causes and results [22]. This correction of decision biases is crucial for ensuring accuracy and scientific credibility [24].
3. Model Parameter Settings
3.1. State Set
3.2. Action Set
3.3. Observation Set
3.4. Transition Probability Function
3.5. Observation Probability Function
3.6. Methodological Guide
4. Transparency Experiment
4.1. Experiment Objective
4.2. Experimental Method
4.2.1. Experimental Scenario
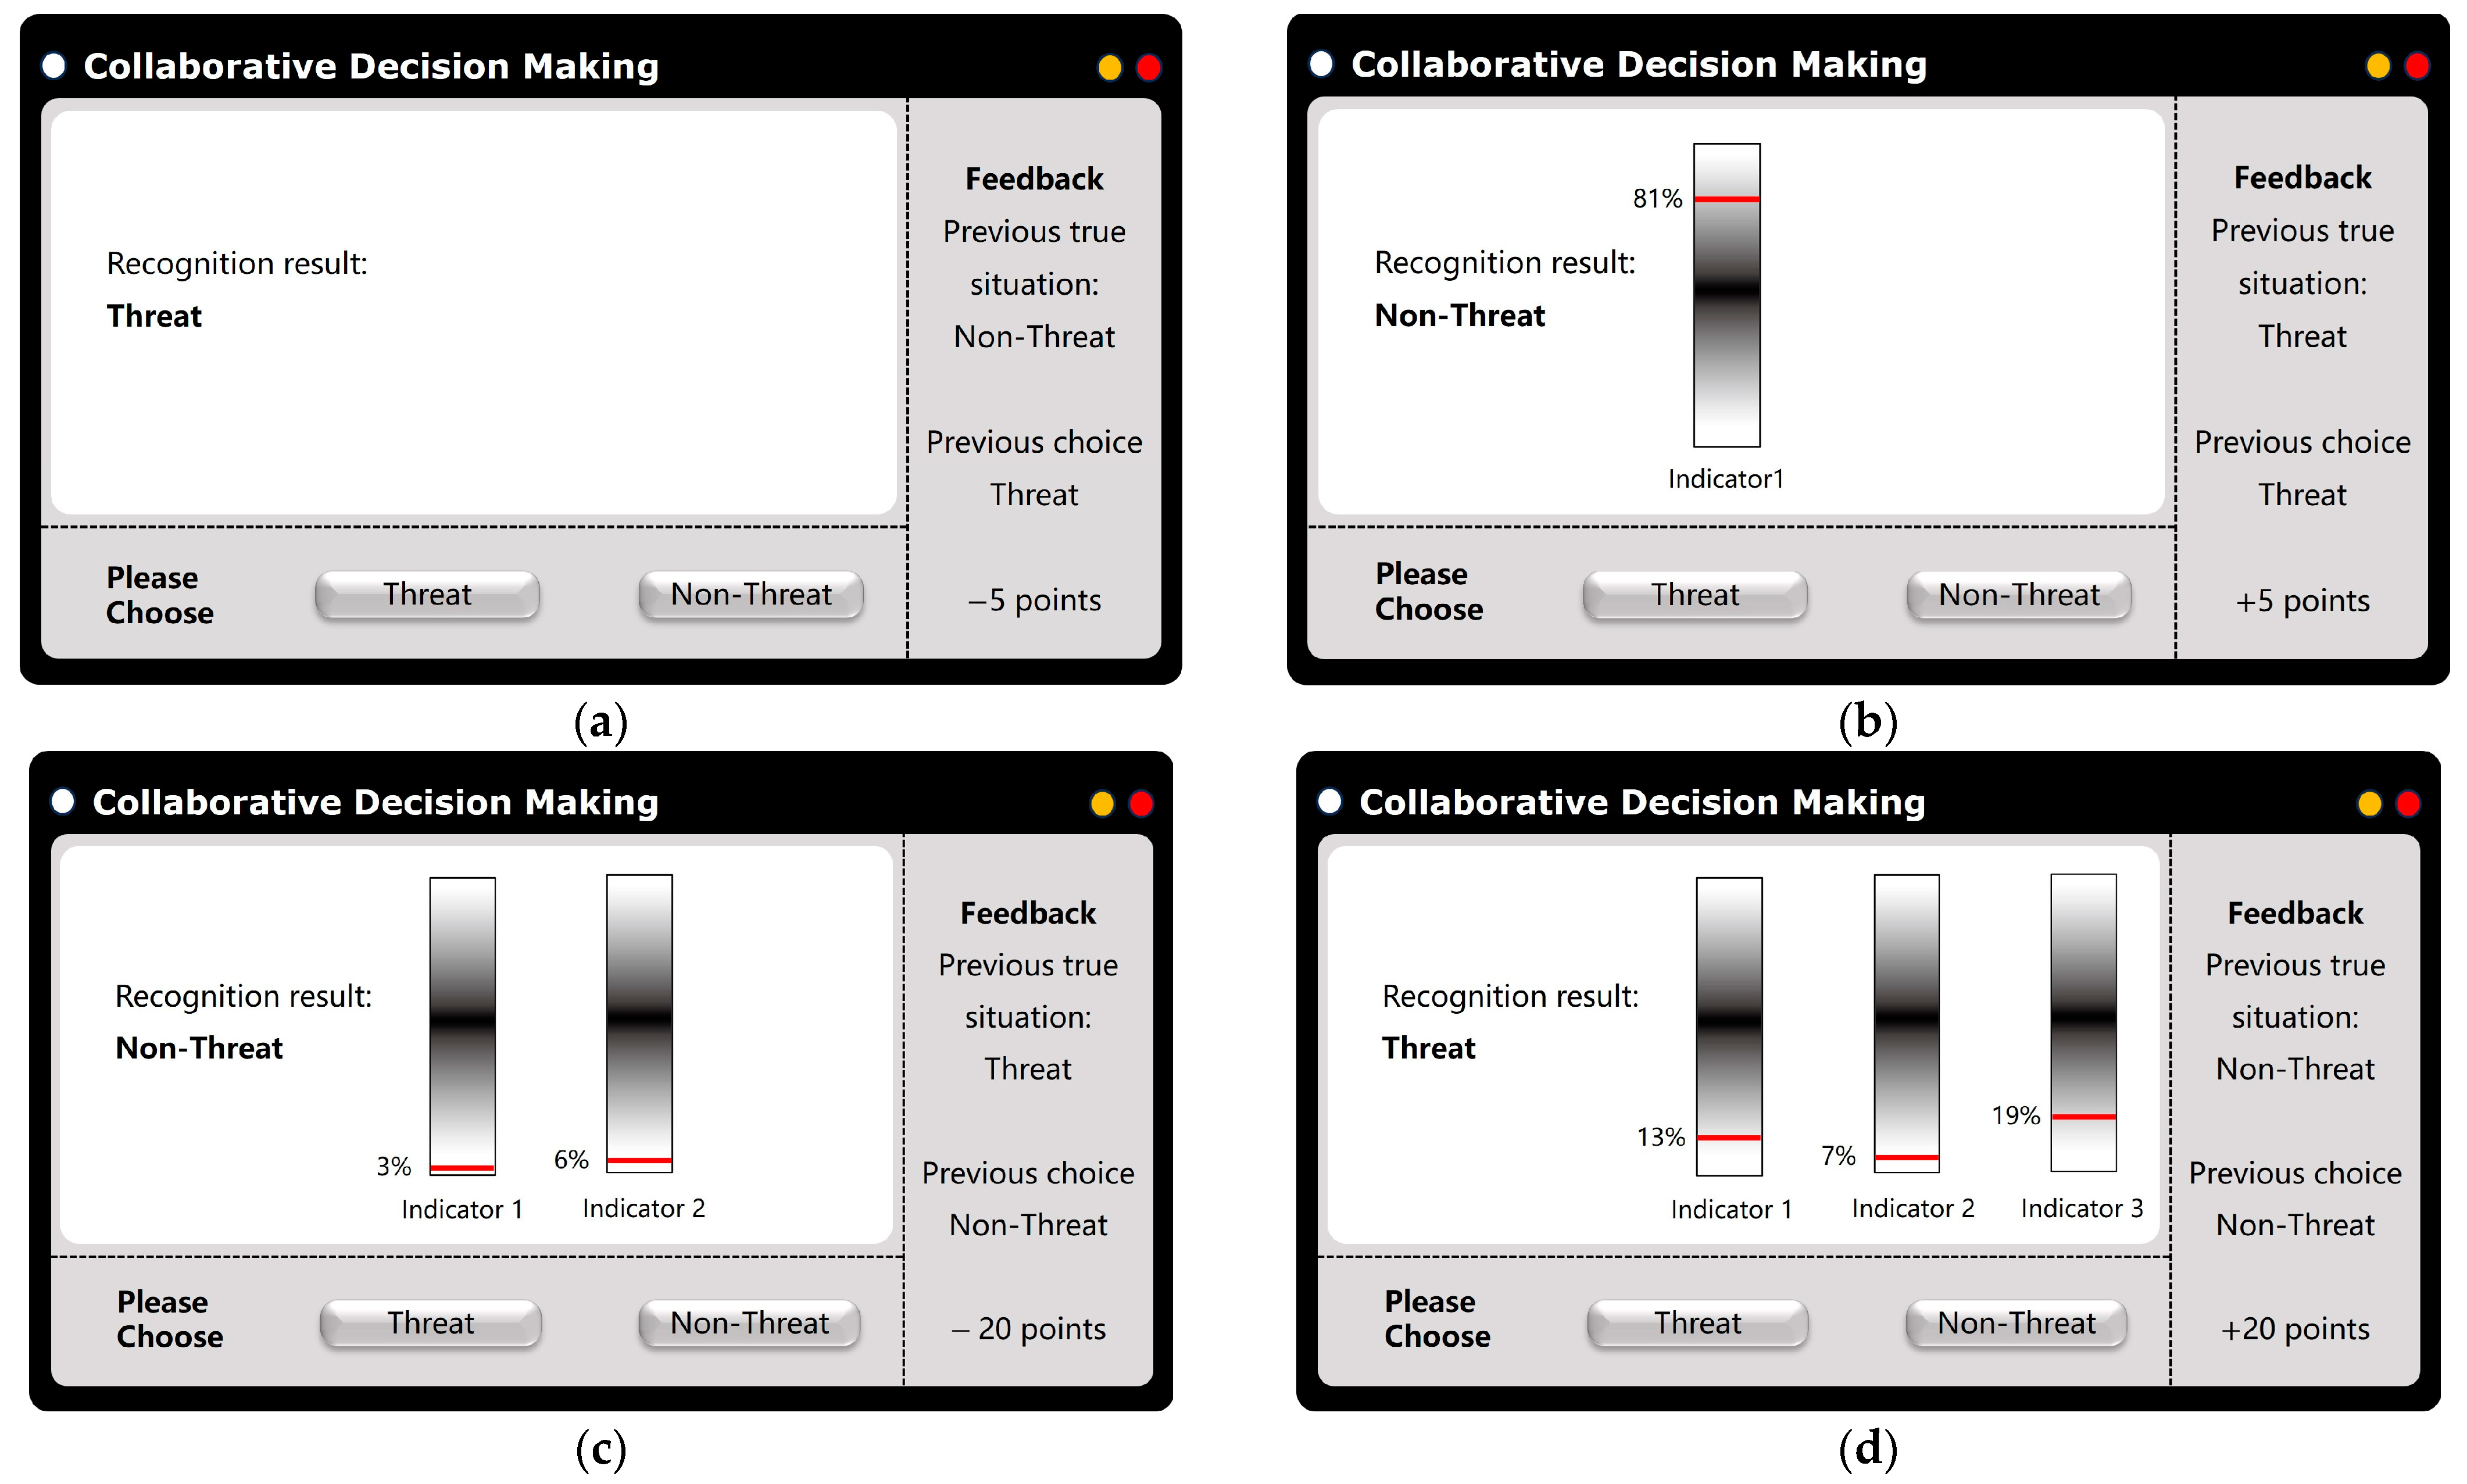
4.2.2. Transparency
4.2.3. Probability Characteristics Setting
- When the system correctly recognizes a true threat () as “threat” (), it is considered a True Positive. The conditional probability is = 0.8. In this case, if the experimental interface is not , at least one probability indicator displayed will have a value between 93% and 97%, while the other probability indicators will randomly distribute between the ranges of 93 to 97% and 80 to 90%;
- When the system incorrectly recognizes a true threat () as “non-threat” (), it is considered a False Negative. The conditional probability is = 0.2. In this case, if the experimental interface is not , at least one probability indicator displayed will have a value between 80% and 90%, while the other probability indicators will randomly distribute between the ranges of 80 to 90% and 10 to 20%;
- When the system correctly recognizes a true non-threat () as “non-threat” (), it is considered a True Negative. The conditional probability is = 0.8. In this case, if the experimental interface is not τ1τ1, the values of all displayed probability indicators will randomly distribute between 3% and 7%;
- When the system incorrectly recognizes a true non-threat () as “threat” (), it is considered a False Positive. The conditional probability is = 0.2. In this case, if the experimental interface is not , at least one probability indicator displayed will have a value between 10% and 20%, while the other probability indicators will randomly distribute between the ranges of 10 to 20% and 3 to 7%.
4.2.4. Real-Time Feedback Setting
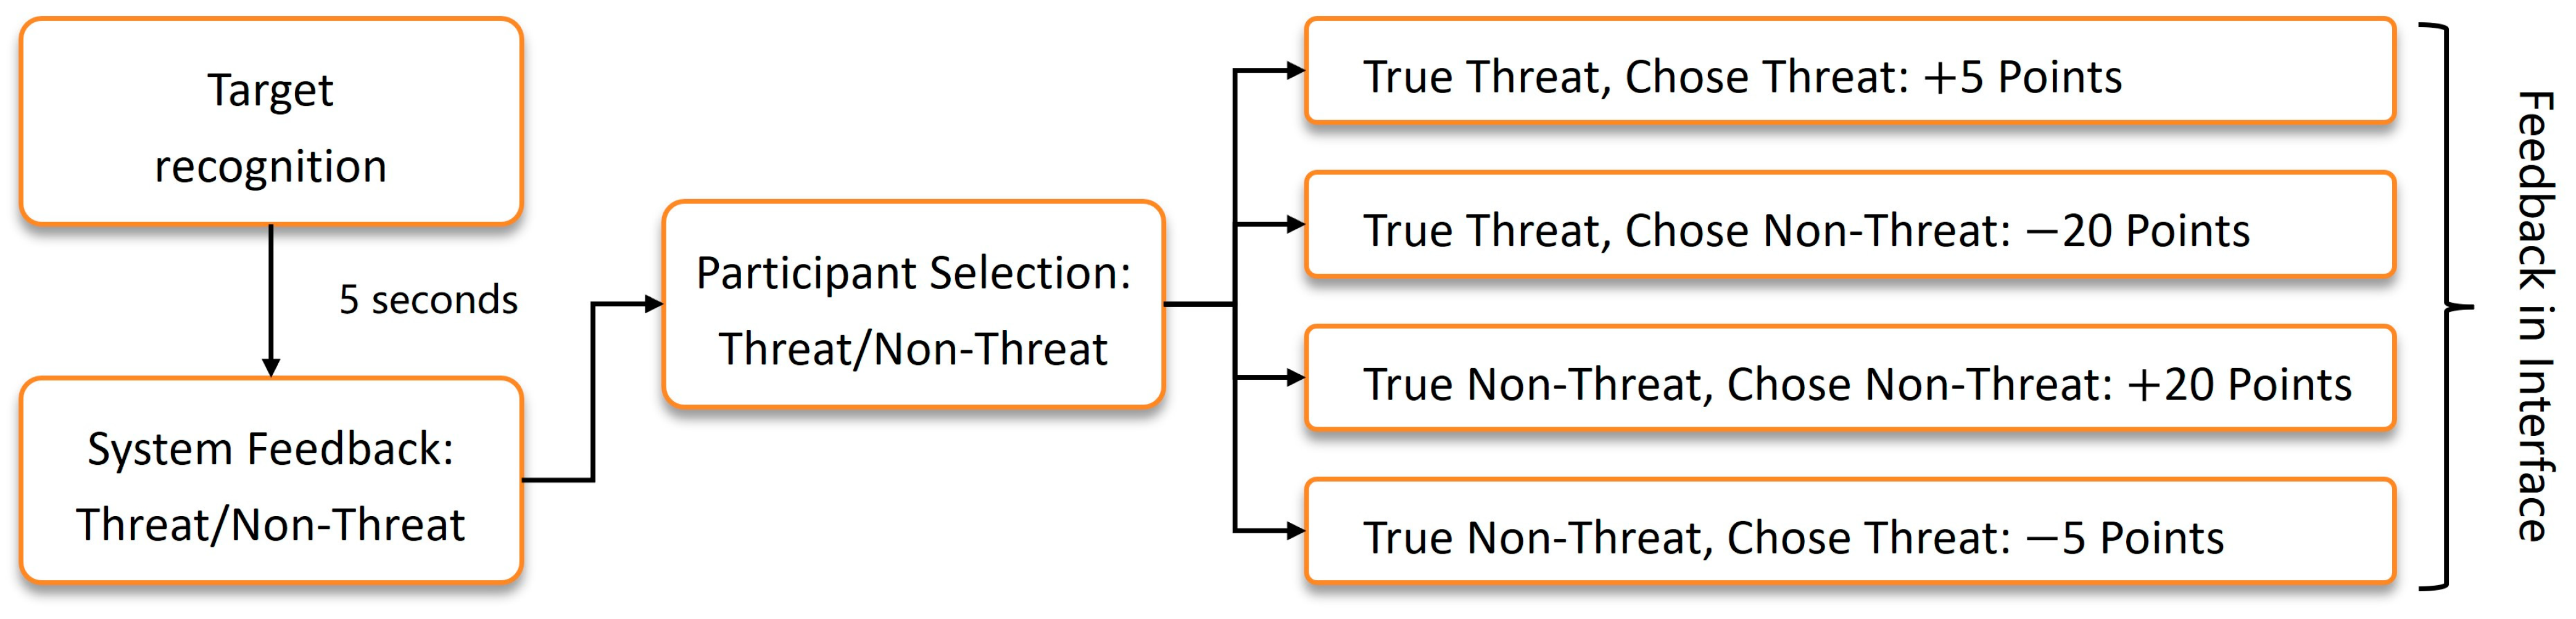
- When the participant correctly identifies a true threat () as a “threat” (), it means that after correctly recognizing the threat, resources must be expended to address the threat, ensuring the completion of the task. Therefore, the decision feedback is set at +5 points, = +5;
- When the participant incorrectly identifies a true threat () as a “non-threat” (), it means that after incorrectly ignoring the threat, the threat is not addressed, leading to punitive consequences and failure to complete the task. Therefore, the decision feedback is set at −20 points, = −20;
- When the participant correctly identifies a true non-threat () as a “non-threat” (), it means that after correctly recognizing the non-threat, resources are not expended to address the threat, ensuring the completion of the task. Therefore, the decision feedback is set at +20 points, = +20;
- When the participant incorrectly identifies a true non-threat () as a “threat” (), it means that after incorrectly recognizing the threat, resources are wasted to address the non-threat, ensuring the completion of the task. Therefore, the decision feedback is set at −5 points, = −5.
4.3. Experimental Procedure
- The interface shows that the system is performing recognition, requiring no action from the participant. This display lasts for 1 s before disappearing. The purpose of this interface is to separate consecutive judgments and prevent participant fatigue, which could affect reaction times;
- The interface then presents the interactive recognition screen, where the participant must decide whether the target is a “threat” or “non-threat” based on the displayed content;
- The interface immediately shows feedback, indicating the correctness of the participant’s judgment and the corresponding score adjustment, which remains until being updated by the next feedback.
5. Model Construction
5.1. Trust Model
5.2. Workload Model
6. Discussion
6.1. Research Methods
- Through cognitive psychology experiments, this study explores how users utilize transparency for visualization, reasoning, and knowledge construction [32], capturing the dynamic impacts of transparency on trust and workload states;
- It combines the cognitive psychology perspective, which emphasizes the importance of communicating transparency, with quantitative statistical methods to manage uncertainty [34], ensuring that AI can clearly convey the decision basis and the probabilistic characteristics contained within its outputs [2];
- By precisely modeling functions such as state transition probability and observation probability, this research provides a method to detail the impact and evolution processes between transparency and trust–load states.
- The experimental tasks adopt more general scenarios, thus making the research results more generalizable;
- The transparency levels were increased to four and the system’s recognition accuracy was improved to 80%, thereby exponentially increasing the complexity of modeling and analysis;
- The feedback given to participants was quantified and scored, constructing a feedback confusion matrix;
- The transparency levels were increased to four and the system’s recognition accuracy was improved to 80%, thereby exponentially increasing the complexity of modeling and analysis.
6.2. State Estimation
6.3. State Modeling
6.4. Limitations
7. Conclusions
Author Contributions
Funding
Institutional Review Board Statement
Data Availability Statement
Acknowledgments
Conflicts of Interest
References
- Barredo Arrieta, A.; Díaz-Rodríguez, N.; Del Ser, J.; Bennetot, A.; Tabik, S.; Barbado, A.; Garcia, S.; Gil-Lopez, S.; Molina, D.; Benjamins, R.; et al. Explainable Artificial Intelligence (XAI): Concepts, Taxonomies, Opportunities and Challenges toward Responsible AI. Inf. Fusion 2020, 58, 82–115. [Google Scholar] [CrossRef]
- Jiang, J.; Karran, A.J.; Coursaris, C.K.; Léger, P.-M.; Beringer, J. A Situation Awareness Perspective on Human-AI Interaction: Tensions and Opportunities. Int. J. Hum.–Comput. Interact. 2023, 39, 1789–1806. [Google Scholar] [CrossRef]
- de Visser, E.J.; Peeters, M.M.M.; Jung, M.F.; Kohn, S.; Shaw, T.H.; Pak, R.; Neerincx, M.A. Towards a Theory of Longitudinal Trust Calibration in Human–Robot Teams. Int. J. Soc. Robot. 2020, 12, 459–478. [Google Scholar] [CrossRef]
- Brasse, J.; Broder, H.R.; Förster, M.; Klier, M.; Sigler, I. Explainable Artificial Intelligence in Information Systems: A Review of the Status Quo and Future Research Directions. Electron. Mark. 2023, 33, 26. [Google Scholar] [CrossRef]
- Abdul, A.; Vermeulen, J.; Wang, D.; Lim, B.Y.; Kankanhalli, M. Trends and Trajectories for Explainable, Accountable and Intelligible Systems: An HCI Research Agenda. In Proceedings of the 2018 CHI Conference on Human Factors in Computing Systems, Montreal, QC, Canada, 21–26 April 2018; Association for Computing Machinery: New York, NY, USA, 2018; pp. 1–18. [Google Scholar]
- Purificato, E.; Lorenzo, F.; Fallucchi, F.; De Luca, E.W. The Use of Responsible Artificial Intelligence Techniques in the Context of Loan Approval Processes. Int. J. Hum.–Comput. Interact. 2023, 39, 1543–1562. [Google Scholar] [CrossRef]
- Vorm, E.S.; Combs, D.J.Y. Integrating Transparency, Trust, and Acceptance: The Intelligent Systems Technology Acceptance Model (ISTAM). Int. J. Hum.–Comput. Interact. 2022, 38, 1828–1845. [Google Scholar] [CrossRef]
- Korporaal, M.; Ruginski, I.T.; Fabrikant, S.I. Effects of Uncertainty Visualization on Map-Based Decision Making Under Time Pressure. Front. Comput. Sci. 2020, 2. [Google Scholar] [CrossRef]
- Franconeri, S.L.; Padilla, L.M.; Shah, P.; Zacks, J.M.; Hullman, J. The Science of Visual Data Communication: What Works. Psychol. Sci. Public Interest 2021, 22, 110–161. [Google Scholar] [CrossRef] [PubMed]
- Huang, C.-L.; Haried, P. An Evaluation of Uncertainty and Anticipatory Anxiety Impacts on Technology Use. Int. J. Hum.–Comput. Interact. 2020, 36, 641–649. [Google Scholar] [CrossRef]
- Angerschmid, A.; Zhou, J.; Theuermann, K.; Chen, F.; Holzinger, A. Fairness and Explanation in AI-Informed Decision Making. Mach. Learn. Knowl. Extr. 2022, 4, 556–579. [Google Scholar] [CrossRef]
- Sacha, D.; Senaratne, H.; Kwon, B.C.; Ellis, G.; Keim, D.A. The Role of Uncertainty, Awareness, and Trust in Visual Analytics. IEEE Trans. Vis. Comput. Graph. 2016, 22, 240–249. [Google Scholar] [CrossRef] [PubMed]
- Akash, K.; McMahon, G.; Reid, T.; Jain, N. Human Trust-Based Feedback Control: Dynamically Varying Automation Transparency to Optimize Human-Machine Interactions. IEEE Control Syst. Mag. 2020, 40, 98–116. [Google Scholar] [CrossRef]
- Akash, K.; Reid, T.; Jain, N. Improving Human-Machine Collaboration Through Transparency-Based Feedback—Part II: Control Design and Synthesis. IFAC-PapersOnLine 2019, 51, 322–328. [Google Scholar] [CrossRef]
- McMahon, G.; Akash, K.; Reid, T.; Jain, N. On Modeling Human Trust in Automation: Identifying Distinct Dynamics through Clustering of Markovian Models. IFAC-PapersOnLine 2020, 53, 356–363. [Google Scholar] [CrossRef]
- Hu, W.-L.; Akash, K.; Reid, T.; Jain, N. Computational Modeling of the Dynamics of Human Trust During Human–Machine Interactions. IEEE Trans. Hum.-Mach. Syst. 2019, 49, 485–497. [Google Scholar] [CrossRef]
- Akash, K.; Polson, K.; Reid, T.; Jain, N. Improving Human-Machine Collaboration Through Transparency-Based Feedback—Part I: Human Trust and Workload Model. IFAC-PapersOnLine 2019, 51, 315–321. [Google Scholar] [CrossRef]
- Chen, J.Y.C. Transparent Human–Agent Communications. Int. J. Hum.–Comput. Interact. 2022, 38, 1737–1738. [Google Scholar] [CrossRef]
- Zhou, J.; Chen, F. Towards Humanity-in-the-Loop in AI Lifecycle. In Humanity Driven AI: Productivity, Well-Being, Sustainability and Partnership; Chen, F., Zhou, J., Eds.; Springer International Publishing: Cham, Switzerland, 2022; pp. 3–13. ISBN 978-3-030-72188-6. [Google Scholar]
- Alexander, V.; Blinder, C.; Zak, P.J. Why Trust an Algorithm? Performance, Cognition, and Neurophysiology. Comput. Hum. Behav. 2018, 89, 279–288. [Google Scholar] [CrossRef]
- Cila, N. Designing Human-Agent Collaborations: Commitment, Responsiveness, and Support. In Proceedings of the 2022 CHI Conference on Human Factors in Computing Systems, New Orleans, LA, USA, 29 April–5 May 2022; Association for Computing Machinery: New York, NY, USA, 2022; pp. 1–18. [Google Scholar]
- Shulner-Tal, A.; Kuflik, T.; Kliger, D. Enhancing Fairness Perception—Towards Human-Centred AI and Personalized Explanations Understanding the Factors Influencing Laypeople’s Fairness Perceptions of Algorithmic Decisions. Int. J. Hum.–Comput. Interact. 2023, 39, 1455–1482. [Google Scholar] [CrossRef]
- Chen, J.Y.C.; Lakhmani, S.G.; Stowers, K.; Selkowitz, A.R.; Wright, J.L.; Barnes, M. Situation Awareness-Based Agent Transparency and Human-Autonomy Teaming Effectiveness. Theor. Issues Ergon. Sci. 2018, 19, 259–282. [Google Scholar] [CrossRef]
- Padilla, L.M.K.; Castro, S.C.; Hosseinpour, H. Chapter Seven—A Review of Uncertainty Visualization Errors: Working Memory as an Explanatory Theory. In Psychology of Learning and Motivation; Federmeier, K.D., Ed.; The Psychology of Learning and Motivation; Academic Press: Cambridge, MA, USA, 2021; Volume 74, pp. 275–315. [Google Scholar]
- Kale, A.; Nguyen, F.; Kay, M.; Hullman, J. Hypothetical Outcome Plots Help Untrained Observers Judge Trends in Ambiguous Data. IEEE Trans. Vis. Comput. Graph. 2019, 25, 892–902. [Google Scholar] [CrossRef]
- Bancilhon, M.; Liu, Z.; Ottley, A. Let’s Gamble: How a Poor Visualization Can Elicit Risky Behavior. In Proceedings of the 2020 IEEE Visualization Conference (VIS), Salt Lake City, UT, USA, 25–30 October 2020; pp. 196–200. [Google Scholar]
- Begoli, E.; Bhattacharya, T.; Kusnezov, D. The Need for Uncertainty Quantification in Machine-Assisted Medical Decision Making. Nat. Mach. Intell. 2019, 1, 20–23. [Google Scholar] [CrossRef]
- Liao, Q.V.; Gruen, D.; Miller, S. Questioning the AI: Informing Design Practices for Explainable AI User Experiences. In Proceedings of the 2020 CHI Conference on Human Factors in Computing Systems, Honolulu, HI, USA, 25–30 April 2020; Association for Computing Machinery: New York, NY, USA, 2020; pp. 1–15. [Google Scholar]
- Stone, P.; Jessup, S.A.; Ganapathy, S.; Harel, A. Design Thinking Framework for Integration of Transparency Measures in Time-Critical Decision Support. Int. J. Hum.–Comput. Interact. 2022, 38, 1874–1890. [Google Scholar] [CrossRef]
- Heltne, A.; Frans, N.; Hummelen, B.; Falkum, E.; Germans Selvik, S.; Paap, M.C.S. A Systematic Review of Measurement Uncertainty Visualizations in the Context of Standardized Assessments. Scand. J. Psychol. 2023, 64, 595–608. [Google Scholar] [CrossRef] [PubMed]
- Preston, A.; Ma, K.-L. Communicating Uncertainty and Risk in Air Quality Maps. IEEE Trans. Vis. Comput. Graph. 2023, 29, 3746–3757. [Google Scholar] [CrossRef]
- Andrienko, N.; Andrienko, G.; Chen, S.; Fisher, B. Seeking Patterns of Visual Pattern Discovery for Knowledge Building. Comput. Graph. Forum 2022, 41, 124–148. [Google Scholar] [CrossRef]
- Zhou, J.; Zheng, B.; Chen, F. Effects of Uncertainty and Knowledge Graph on Perception of Fairness. In Proceedings of the IUI’23 Companion: Companion Proceedings of the 28th International Conference on Intelligent User Interfaces, Sydney, NSW, Australia, 27–31 March 2023; Association for Computing Machinery: New York, NY, USA, 2023; pp. 151–154. [Google Scholar]
- van der Bles, A.M.; van der Linden, S.; Freeman, A.L.J.; Mitchell, J.; Galvao, A.B.; Zaval, L.; Spiegelhalter, D.J. Communicating Uncertainty about Facts, Numbers and Science. R. Soc. Open Sci. 2019, 6, 181870. [Google Scholar] [CrossRef]
- Hullman, J. Why Authors Don’t Visualize Uncertainty. IEEE Trans. Vis. Comput. Graph. 2020, 26, 130–139. [Google Scholar] [CrossRef] [PubMed]
- Sterzik, A.; Lichtenberg, N.; Krone, M.; Baum, D.; Cunningham, D.W.; Lawonn, K. Enhancing Molecular Visualization: Perceptual Evaluation of Line Variables with Application to Uncertainty Visualization. Comput. Graph. 2023, 114, 401–413. [Google Scholar] [CrossRef]
- Shin, D. Embodying Algorithms, Enactive Artificial Intelligence and the Extended Cognition: You Can See as Much as You Know about Algorithm. J. Inf. Sci. 2023, 49, 18–31. [Google Scholar] [CrossRef]
- Ferrario, A.; Loi, M.; Viganò, E. In AI We Trust Incrementally: A Multi-Layer Model of Trust to Analyze Human-Artificial Intelligence Interactions. Philos. Technol. 2020, 33, 523–539. [Google Scholar] [CrossRef]
- Cassenti, D.N.; Kaplan, L.M. Robust Uncertainty Representation in Human-AI Collaboration. In Proceedings of the Artificial Intelligence and Machine Learning for Multi-Domain Operations Applications III, Online Only, 12–17 April 2021; SPIE: Philadelphia, PA, USA, 2021; Volume 11746, pp. 249–262. [Google Scholar]
- Panagiotidou, G.; Vandam, R.; Poblome, J.; Moere, A.V. Implicit Error, Uncertainty and Confidence in Visualization: An Archaeological Case Study. IEEE Trans. Vis. Comput. Graph. 2022, 28, 4389–4402. [Google Scholar] [CrossRef] [PubMed]
- Manjarrez, E.; DeLuna-Castruita, A.; Lizarraga-Cortes, V.; Flores, A. Similarity Index of Ex-Gaussian Reaction Time Signatures. BioRxiv 2023. [Google Scholar] [CrossRef]
- Castro-Palacio, J.C.; Fernández-de-Córdoba, P.; Isidro, J.M.; Sahu, S.; Navarro-Pardo, E. Human Reaction Times: Linking Individual and Collective Behaviour Through Physics Modeling. Symmetry 2021, 13, 451. [Google Scholar] [CrossRef]
- Piccolotto, N.; Bögl, M.; Miksch, S. Visual Parameter Space Exploration in Time and Space. Comput. Graph. Forum 2023, 42, e14785. [Google Scholar] [CrossRef]

| Model Sets | Inclusive Tuples | Tuple Parameters |
|---|---|---|
| State Set | ||
| Action Set | ||
| Observation Set | ||
| True Situation | AI Recognizes Correctly | AI Recognizes Incorrectly |
|---|---|---|
| Threat | = 0.8 | = 0.2 |
| Non-threat | = 0.8 | = 0.2 |
| True Situation | Participant Recognizes Correctly | Participant Recognizes Incorrectly |
|---|---|---|
| Threat | = +5 | = −20 |
| Non-threat | = +20 | = −5 |
Disclaimer/Publisher’s Note: The statements, opinions and data contained in all publications are solely those of the individual author(s) and contributor(s) and not of MDPI and/or the editor(s). MDPI and/or the editor(s) disclaim responsibility for any injury to people or property resulting from any ideas, methods, instructions or products referred to in the content. |
© 2024 by the authors. Licensee MDPI, Basel, Switzerland. This article is an open access article distributed under the terms and conditions of the Creative Commons Attribution (CC BY) license (https://creativecommons.org/licenses/by/4.0/).
Share and Cite
Wang, X.; Li, Y.; Xue, C. Collaborative Decision Making with Responsible AI: Establishing Trust and Load Models for Probabilistic Transparency. Electronics 2024, 13, 3004. https://doi.org/10.3390/electronics13153004
Wang X, Li Y, Xue C. Collaborative Decision Making with Responsible AI: Establishing Trust and Load Models for Probabilistic Transparency. Electronics. 2024; 13(15):3004. https://doi.org/10.3390/electronics13153004
Chicago/Turabian StyleWang, Xinyue, Yaxin Li, and Chengqi Xue. 2024. "Collaborative Decision Making with Responsible AI: Establishing Trust and Load Models for Probabilistic Transparency" Electronics 13, no. 15: 3004. https://doi.org/10.3390/electronics13153004
APA StyleWang, X., Li, Y., & Xue, C. (2024). Collaborative Decision Making with Responsible AI: Establishing Trust and Load Models for Probabilistic Transparency. Electronics, 13(15), 3004. https://doi.org/10.3390/electronics13153004