Article

An Encrypted Traffic Classification Approach Based on Path Signature Features and LSTM

1
School of Software, Xinjiang University, Urumqi 830091, China
2
College of Information Science and Engineering, Xinjiang University, Urumqi 830046, China
*
Author to whom correspondence should be addressed.
Electronics 2024, 13(15), 3060; https://doi.org/10.3390/electronics13153060
Submission received: 27 June 2024 / Revised: 29 July 2024 / Accepted: 31 July 2024 / Published: 2 August 2024

Abstract

:
Classifying encrypted traffic is a crucial aspect of network security. However, popular methods face several limitations, such as a reliance on feature engineering and the need for complex model architectures to ensure effective classification. To address these challenges, we propose a method that combines path signature features with Long Short-Term Memory (LSTM) models to classify service types within encrypted traffic. Our approach constructs traffic paths using packet size and arrival times. We generate path signature features at various scales using an innovative multi-scale cumulative feature extraction technique. These features serve as inputs for LSTM networks to perform the classification. Notably, by using only 24 sequential packet features in conjunction with LSTM models, our method has achieved significant success in classifying service types within encrypted traffic. The experimental results highlight the superiority of our proposed method compared to leading approaches in the field.

1. Introduction

In the era of ubiquitous Internet connectivity, network traffic classification has emerged as a cornerstone in cybersecurity. This discipline’s importance is underscored by its critical applications in intrusion detection, traffic trend analysis, quality of service management, and enhancing network visibility [1]. With the widespread adoption of encryption technologies, the landscape of network traffic has dramatically changed as more users and service providers choose to transmit information through encrypted traffic [2].
Encrypted traffic differs from unencrypted traffic in that it employs encryption protocols to encode data transmitted between devices, thereby preventing unauthorized parties from accessing it. This encryption ensures significant advantages in terms of privacy and security by safeguarding sensitive information from interception and exploitation by malicious actors. Encrypted traffic maintains the confidentiality and integrity of user data, communications, and transactions, making them tamper-proof. In contrast, unencrypted traffic transmits data in plain text, which can be easily intercepted and read by anyone with network access. While unencrypted traffic allows for simpler monitoring and analysis by network administrators, it exposes users to a higher risk of data breaches and privacy violations. The primary advantages of unencrypted traffic are its simplicity and lower computational overhead, which can result in faster data transmission. However, the security benefits of encrypted traffic far outweigh these advantages, making encryption essential in today’s digital environment.
Although encrypted traffic safeguards the privacy and anonymity of most users, it simultaneously presents substantial challenges to cybersecurity [3]. Criminals increasingly leverage sophisticated encryption techniques to conduct illegal activities, significantly undermining the stability of cyberspace and posing threats to national security. Researchers urgently need new classification methods to address this formidable challenge.
The advent of encryption has posed a substantial challenge to traditional traffic classification methods [4]. Techniques that once relied on payload inspection and port-based classification have now been rendered ineffective against the veil of encryption [5,6].
Historically, the field has leaned on statistical methods and, more recently, machine learning algorithms to navigate the complexities of encrypted traffic classification [7,8,9,10]. These methods, however, come with their own set of challenges. They often require extensive feature engineering efforts and are heavily dependent on the quality and quantity of the available data. Moreover, although practical, the intricate designs of deep learning models demand vast computational resources and large datasets to achieve satisfactory accuracy [4].
Nowadays, real-world applications for encrypted traffic classification include Cisco Encrypted Traffic Analytics (ETA), Darktrace, Symantec Encrypted Traffic Management (ETM), and Vectra AI. Cisco ETA identifies malware in encrypted traffic using network telemetry and machine learning. Darktrace uses AI-driven anomaly detection to identify threats in encrypted data. Symantec ETM decrypts, inspects, and re-encrypts traffic, utilizing deep packet inspection for classification. Vectra AI’s Cognito platform employs machine learning and behavioral analysis to detect threats within encrypted traffic. These solutions highlight the industry’s reliance on machine learning, AI, and advanced network analysis for secure and effective encrypted traffic management.
The path signature feature proposed by Chen [11] has been successfully applied in recent years to fields such as machine learning, pattern recognition, and path analysis. This feature has also recently been introduced to the domain of encrypted traffic classification, where it has demonstrated its feasibility across several datasets [12]. However, the inherent complexity of path signature features means that classification results are not consistently satisfactory. In encrypted traffic classification, the challenge of fully leveraging path signature features to attain satisfactory results persists, necessitating further investigation and innovation.
In this paper, we introduce a multi-scale cumulative path signature feature extraction method to maximize the information content of path signature features. To fully exploit the potential of these features, we have explored their integration with deep neural networks. This integration has led to satisfactory classification results, demonstrating the effectiveness of combining path signature features with deep learning in encrypted traffic classification.
The main contributions of this paper are as follows:
  • We propose an encrypted traffic classifier that combines path signature features with an LSTM model. This classifier extracts the complex dynamics and geometric structures of encrypted traffic using path signature features and utilizes an LSTM model to perform the classification task, significantly reducing the computational resources required for traffic classification.
  • We introduce a multi-scale cumulative feature extraction method to generate path signature features that are optimally suited for LSTM models. Using this method, the classification accuracy of the LSTM model can be improved by 5–30%, validating the effectiveness of our new feature extraction approach.
  • Our proposed method achieves competitive classification results using only 24 consecutive packet length and time interval features. It demonstrates classification accuracies of 94.74%, 90.53%, 93.86%, and 95.03% on the ISCX-VPN, ISCX-nonVPN, ISCX-Tor, and ISCX-nonTor datasets, respectively, proving the effectiveness of our approach.

2. Related Work

2.1. Encrypted Traffic Classification

Internet traffic classification can be categorized into three main domains:
  • Distinguishing between encrypted and unencrypted traffic [3];
  • Identifying the specific applications associated with the traffic [13];
  • Classifying traffic based on different service types. Service types refer to the purpose of the traffic, i.e., traffic generated to meet specific user needs. For example, file transfer traffic is generated when users perform upload or download operations on the network, and streaming traffic is generated when users use streaming media services, such as listening to music or watching videos [14].
This section summarizes vital methods for network traffic classification, categorized based on the techniques used: port-based, payload-based, fingerprint construction, statistical methods, and deep learning models.
Port-based: This method, one of the oldest in network traffic classification, relied on fixed port numbers assigned by the Internet Assigned Numbers Authority (IANA) during the Internet’s early development. This approach facilitated the association of network applications with their corresponding traffic via port scanning, thus enabling traffic identification [15]. However, with the exponential growth of network applications and dynamic port techniques, port scanning no longer applies to the current network environment [5]. Our method, notably, does not depend on port numbers.
Payload-based: Addressing the limitations of port scanning, researchers have proposed Deep Packet Inspection (DPI) methods [6] for traffic identification. DPI examines a packet’s data part (payload) and uses known signatures to identify the traffic type. The core principle of DPI is that various communication protocol data packets have certain packet formats, and specific characters or strings with meaningful information can be found by extracting the payload of packets. These specific payload contents serve as indicators for traffic type recognition [6]. However, this method poses risks of infringing on user privacy, incurring high computation costs, and becoming ineffective when dealing with encrypted traffic [16]. Our approach circumvents the reliance on payload information.
Fingerprint construction: To address the limitations of payload-based traffic classification methods, several studies have utilized unencrypted protocol field information for traffic classification [3]. For instance, T Van Ede et al. [17] employs features such as device type, certificate details, packet size, and timing information to represent each flow, constructing a fingerprint library through clustering and cross-correlation techniques for efficient traffic classification. However, these methods heavily rely on plaintext information, which can be easily tampered with during transmission, leading to the loss of accurate meaning. Conversely, our model operates independently of plaintext information within the data packets.
Statistical methods: This category involves manually extracting features such as traffic size and timing using machine learning algorithms for traffic classification. The Random Forest classifier is a classic machine learning algorithm that operates by constructing multiple decision trees during training and outputting the class pattern for the classification task. This ensemble method enhances the model’s robustness and accuracy by mitigating the common overfitting issue in individual decision trees. For example, VF Taylor et al. [9] uses a Random Forest classifier with packet size features for classification tasks. On the other hand, Vinai George Biju [18] employed the Support Vector Machine (SVM) algorithm to classify encrypted traffic. SVM is also a classic machine learning algorithm that works by finding the optimal hyperplane that maximizes the margin between different classes in the feature space, performing exceptionally well in high-dimensional spaces. Although these methods bypass the need for packet content inspection, thus suiting encrypted traffic classification, they also face limitations. Simple statistical features often fall short of accurate classification, and deriving complex features demands significant effort and resources. Our methodology relies on straightforward statistical features to derive path signature features, enriching feature informativeness without complex engineering.
Deep learning models: The advent of deep learning has significantly influenced the use of these models in encrypted traffic classification. DF [19] first uses a Convolutional Neural Network (CNN) to extract features from encrypted traffic, while FS-NET [20] employs a recursive neural network for encrypted traffic classification. DeepPacket [6] and TSCRNN [21] build models by combining feature extraction and classifier construction, automatically handling feature extraction and classification when the payload of original packets is input into the model. Zhang et al. [22] used graph neural networks to extract packet-level features for traffic classification. MT-FlowFormer [23] uses a semi-supervised flow transformer to complete encrypted flow classification. Lin et al. [16] captured robust and general associations from raw traffic packets using large pre-trained models such as Bidirectional Encoder Representation from Transformers (BERT), achieving excellent classification results. Nonetheless, deep learning models typically require intricate network architectures and vast datasets for optimal performance. Contrarily, our model is designed to be efficient and requires fewer resources.

2.2. Path Signature Features

Path signatures were initially proposed by Chen [11] as a core concept in rough path theory, where “rough” refers to continuous paths that exhibit sharp fluctuations in rough paths. These paths are continuous but not differentiable everywhere, and the continuous packet size sequences in encrypted traffic can be seen as rough paths. In recent years, path signatures have regained researchers’ attention and have been successfully applied in machine learning, pattern recognition, and data analysis fields. Graham [24] used sliding-window-based path signature features with a CNN for handwritten character recognition, achieving excellent results. L. G. Gyurkó [25] used path signatures to extract features from financial data flows for financial data classification. I. P. Arribas [26] applied path signatures to the medical field to differentiate mental disorders. In [12], a novel methodology was introduced for describing signatures through length-normalized path signatures. The study also explored path signature features, employing them in conjunction with the Random Forest algorithm for the classification of encrypted traffic. Overall, these applications demonstrate the effectiveness of extracting features using path signature functions and the value of representing information-rich vectors. The next section introduces the definition of path signatures, their low-order geometric interpretation, and relevant properties. For more mathematical proofs, refer to [11].

2.2.1. Definition of Path Signatures

A path signature is a transformative mapping function that converts raw path data into a sequence of real numbers [12]. Each number within this sequence is derived uniquely through the data points along the original path, capturing a distinct geometric characteristic of that path. For a path X in d-dimensional Euclidean space Rd, defined as a continuous mapping from the interval [a, b] to Rd, written as X: [a, b] → Rd, the parameter t ∈ [a, b] delineates a trajectory within this d-dimensional Euclidean space:
X t = X t 1 , X t 2 , X t 3 , , X t d .
where X t d represents an arbitrary continuous path in the d-th dimension. The path signature is an infinite sequence of a path X: [a, b] → Rd, consisting of the zeroth-order signature (1) and various order signature terms (also called iterated integrals):
S ( X ) a , b = ( 1 , S ( X ) a , b 1 , , S ( X ) a , b d , S ( X ) a , b 1,1 , S X ) a , b 1,2 , , S ( X ) a , b d , d .
For a d-dimensional path X, its k-fold iterated integral can be expressed as follows:
S ( X ) a , t i 1 , , i k = a < t k < t a < t 1 < t 2 d X t 1 i 1 d X t k i k .
In Formula (3), t1, t2,…, tk refer to integration variables that are distinct from t. This distinction is made to avoid confusion with the path parameter t during multiple integrations. Taking the two-dimensional path X t = X t 1 ,   X t 2 shown in Figure 1 as an example, its third-order path signature features are as follows: {57.17, 54.67, 23.67, 30.33, 44.17, 34.33, 22.83, 20.83}.

2.2.2. Geometric Interpretation of Path Signatures

To further explain the geometric interpretation of path signature features, we use a two-dimensional path X t = X t 1 ,   X t 2 as an example, where t ∈ [0,4], (a = 0,b = 4). The path is defined by X t 1 = { 1,3 , 5,8 } and X t 2 = 1,4 , 2,6 . It is important to note that t is a continuous parameter; for the sake of convenience, we have chosen four discrete points to construct the path. The shape of the path is shown in Figure 1. The computed zeroth-order, first-order, and second-order path signatures are as follows:
S = 1 , S 1 , S 2 , S 1,1 , S 1,2 , S 2,1 , S 2,2 = 1,7 , 5,24.5,19,16,12.5 .
Within the path signature framework, the first element, denoted by 1, is a constant, signifying the zeroth-order characteristic of the path. S 1 )   and   S ( 2 ) represent the first-order path signature components, corresponding to the projection distances of the path along the X1 and X2 axes, respectively. The expressions S 1,2   and   S 2,1 denote the areas bounded by the path and the straight lines parallel to the coordinate axes, extending through the path’s start and end points. Meanwhile, S 1,1   and   S 2,2 reflect half the squared projection distances of the path on the X1 and X2 axes, correspondingly. We explain only the zeroth-, first-, and second-order path signature features, as higher-order path signatures are difficult to describe visually, and our method uses only up to second-order signatures.

2.2.3. Properties of Path Signatures

In this section, we will elaborate on the crucial properties of path signature features. These properties constitute the theoretical foundation and notable advantages of their application in encrypted traffic classification. They are detailed as follows:
  • Uniqueness: Hambly et al. [27] established that each rough path possesses a distinct path signature, ensuring a one-to-one correspondence between non-tree-like paths and their signatures. This fundamental property asserts that path signatures can precisely encapsulate the geometric traits of paths. Incorporating time as a monotonically increasing dimension in the sequence of encrypted traffic transforms these sequences into non-tree-like paths, thus providing a robust theoretical framework for substituting original paths with their path signature features as input for analytical models.
  • Invariance under parameter changes: Different sampling strategies yield varied parameters for the same path, yet the path signature remains consistent across these variations [27]. This invariance implies that classification outcomes for traffic from specific application types remain stable, unaffected by the diversity in parameters. Leveraging this attribute allows for the elimination of discrepancies introduced by various reparameterizations of traffic within the same category, highlighting a crucial advantage of utilizing path signature features.
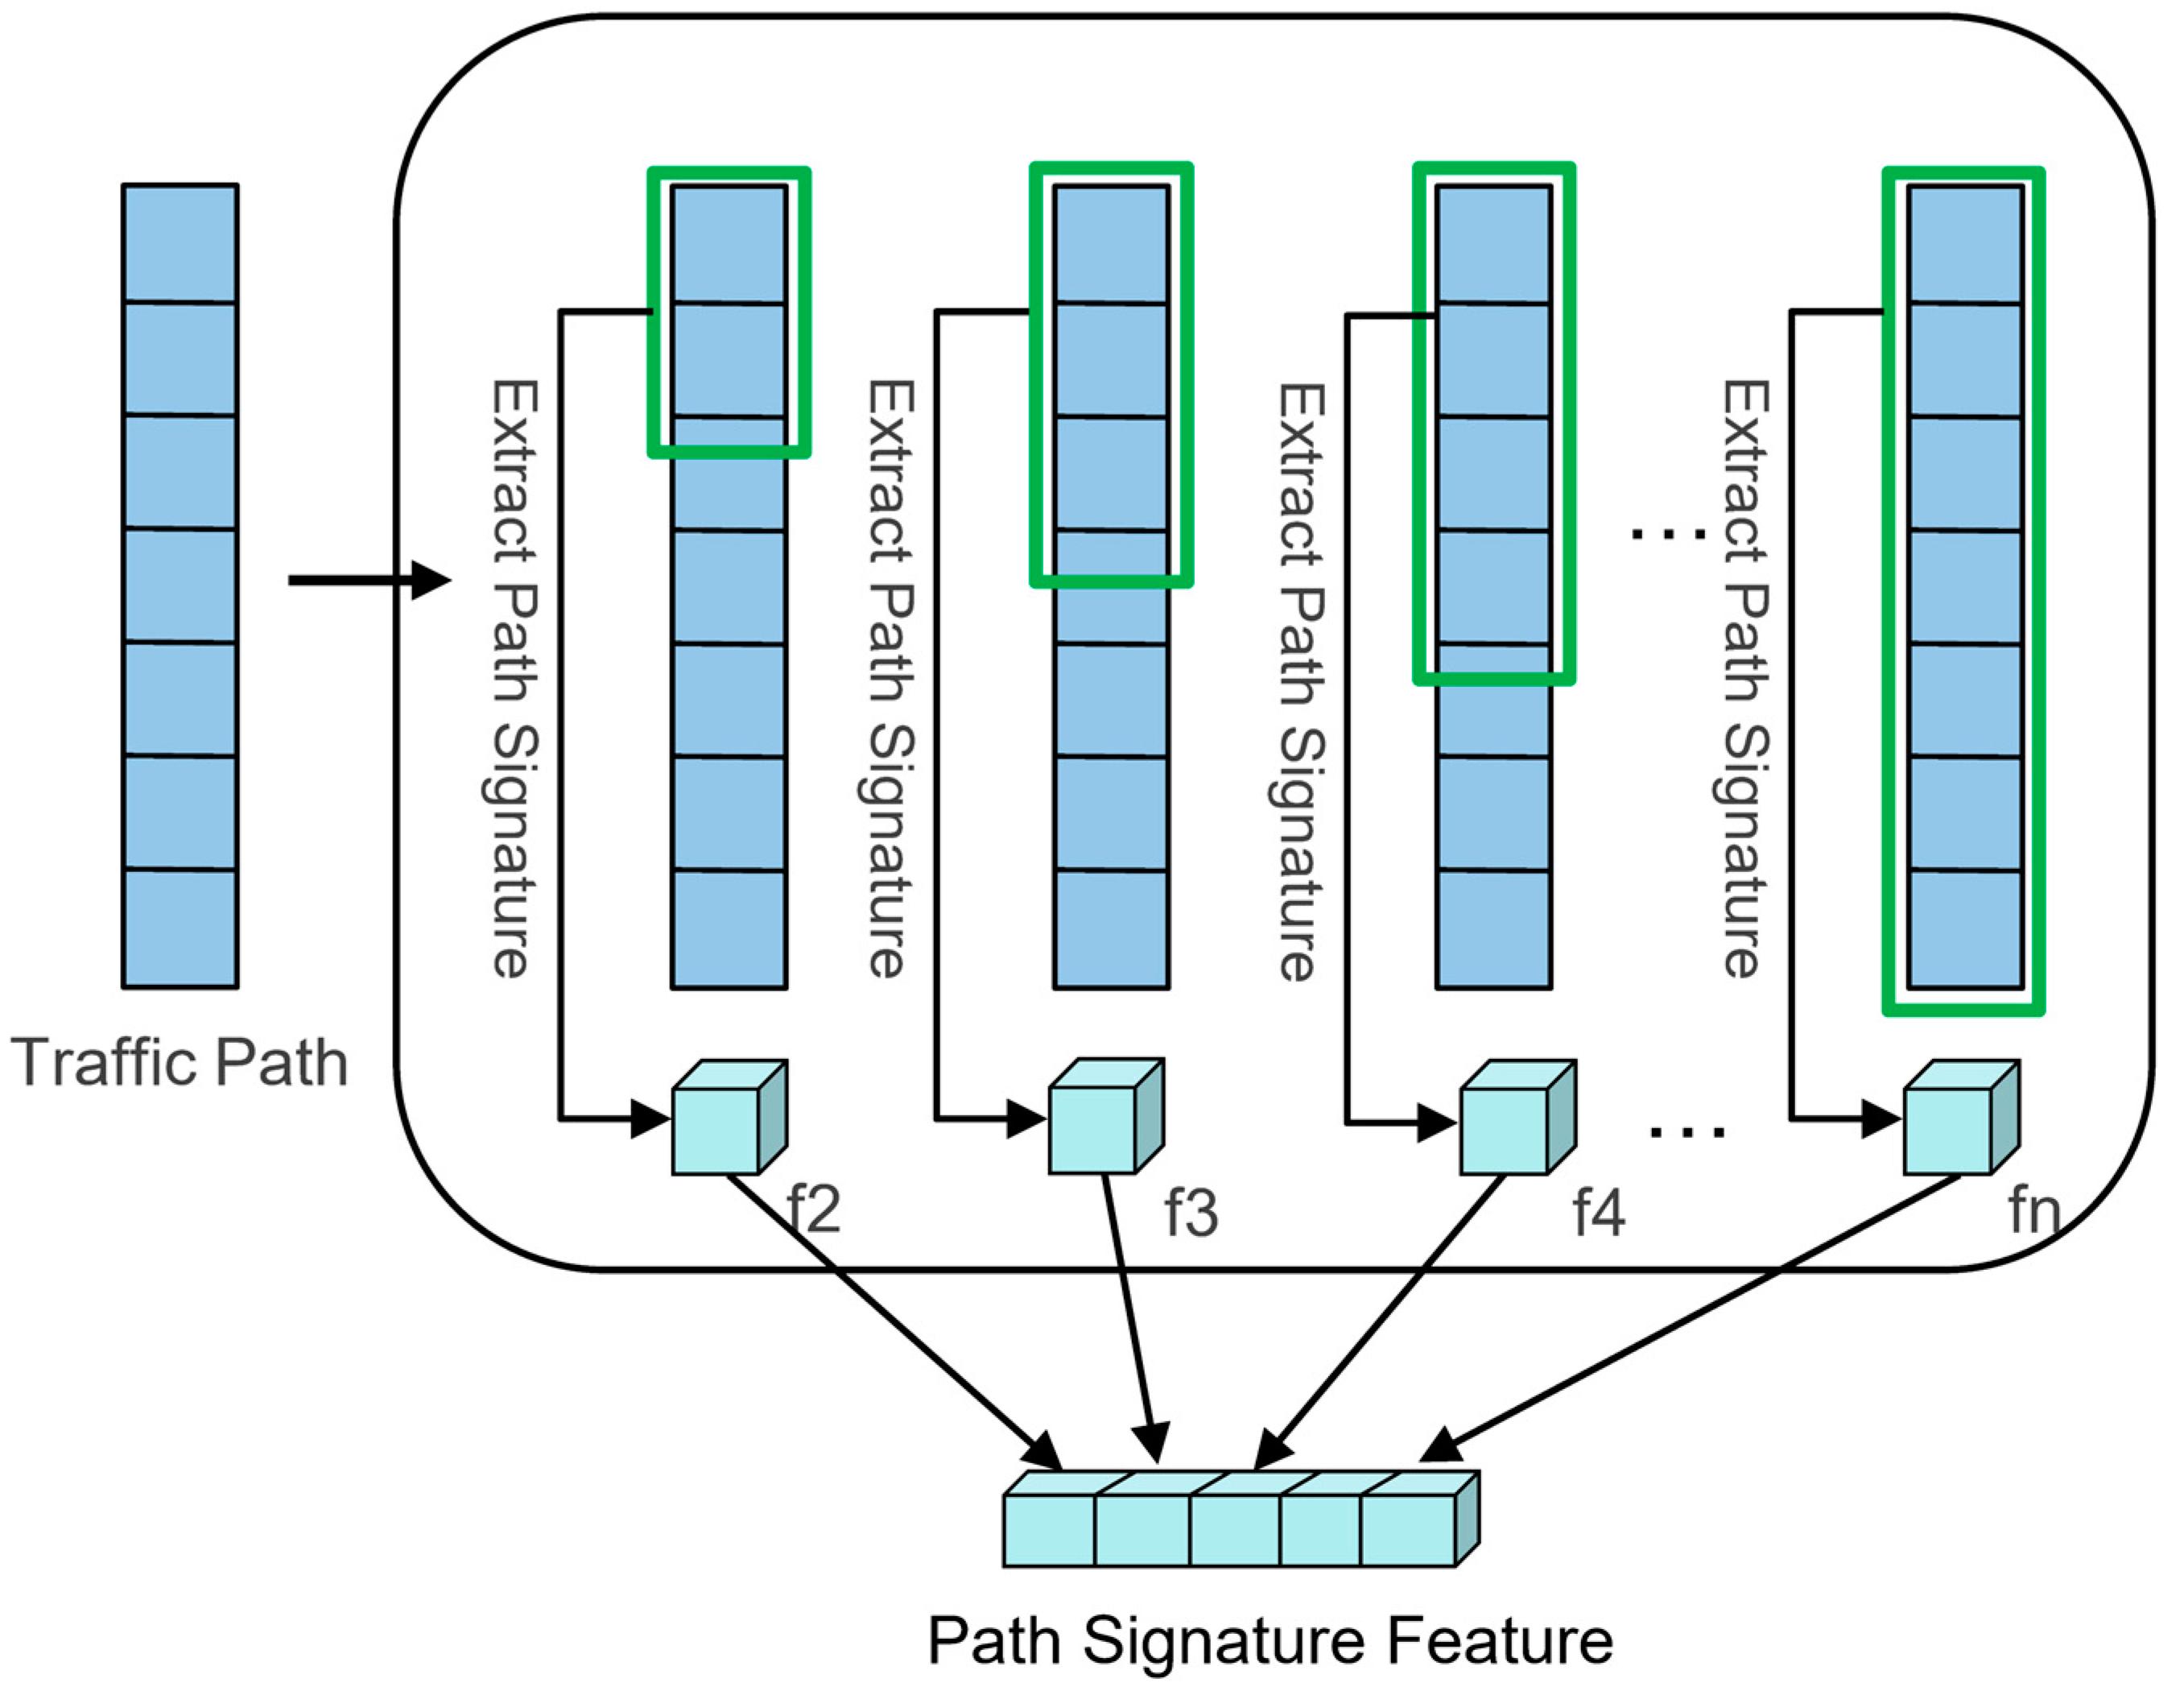
  • Dimension invariance: The dimensionality of path signature features is determined solely by the chosen truncation depth, independent of the actual path length [27]. For instance, considering the previously discussed two-dimensional path X t = X t 1 ,   X t 2 , t ∈ [0,4], (a = 0,b = 4) with X t 1 = { 1,3 , 5,8 } and X t 2 = { 1,4 , 2,6 } , truncating to one dimension results in a path signature length of 3, while truncation to two dimensions yields a length of 7. This fixed-length feature extraction from paths of varying lengths significantly simplifies the feature extraction process, especially for models necessitating fixed-length input features.
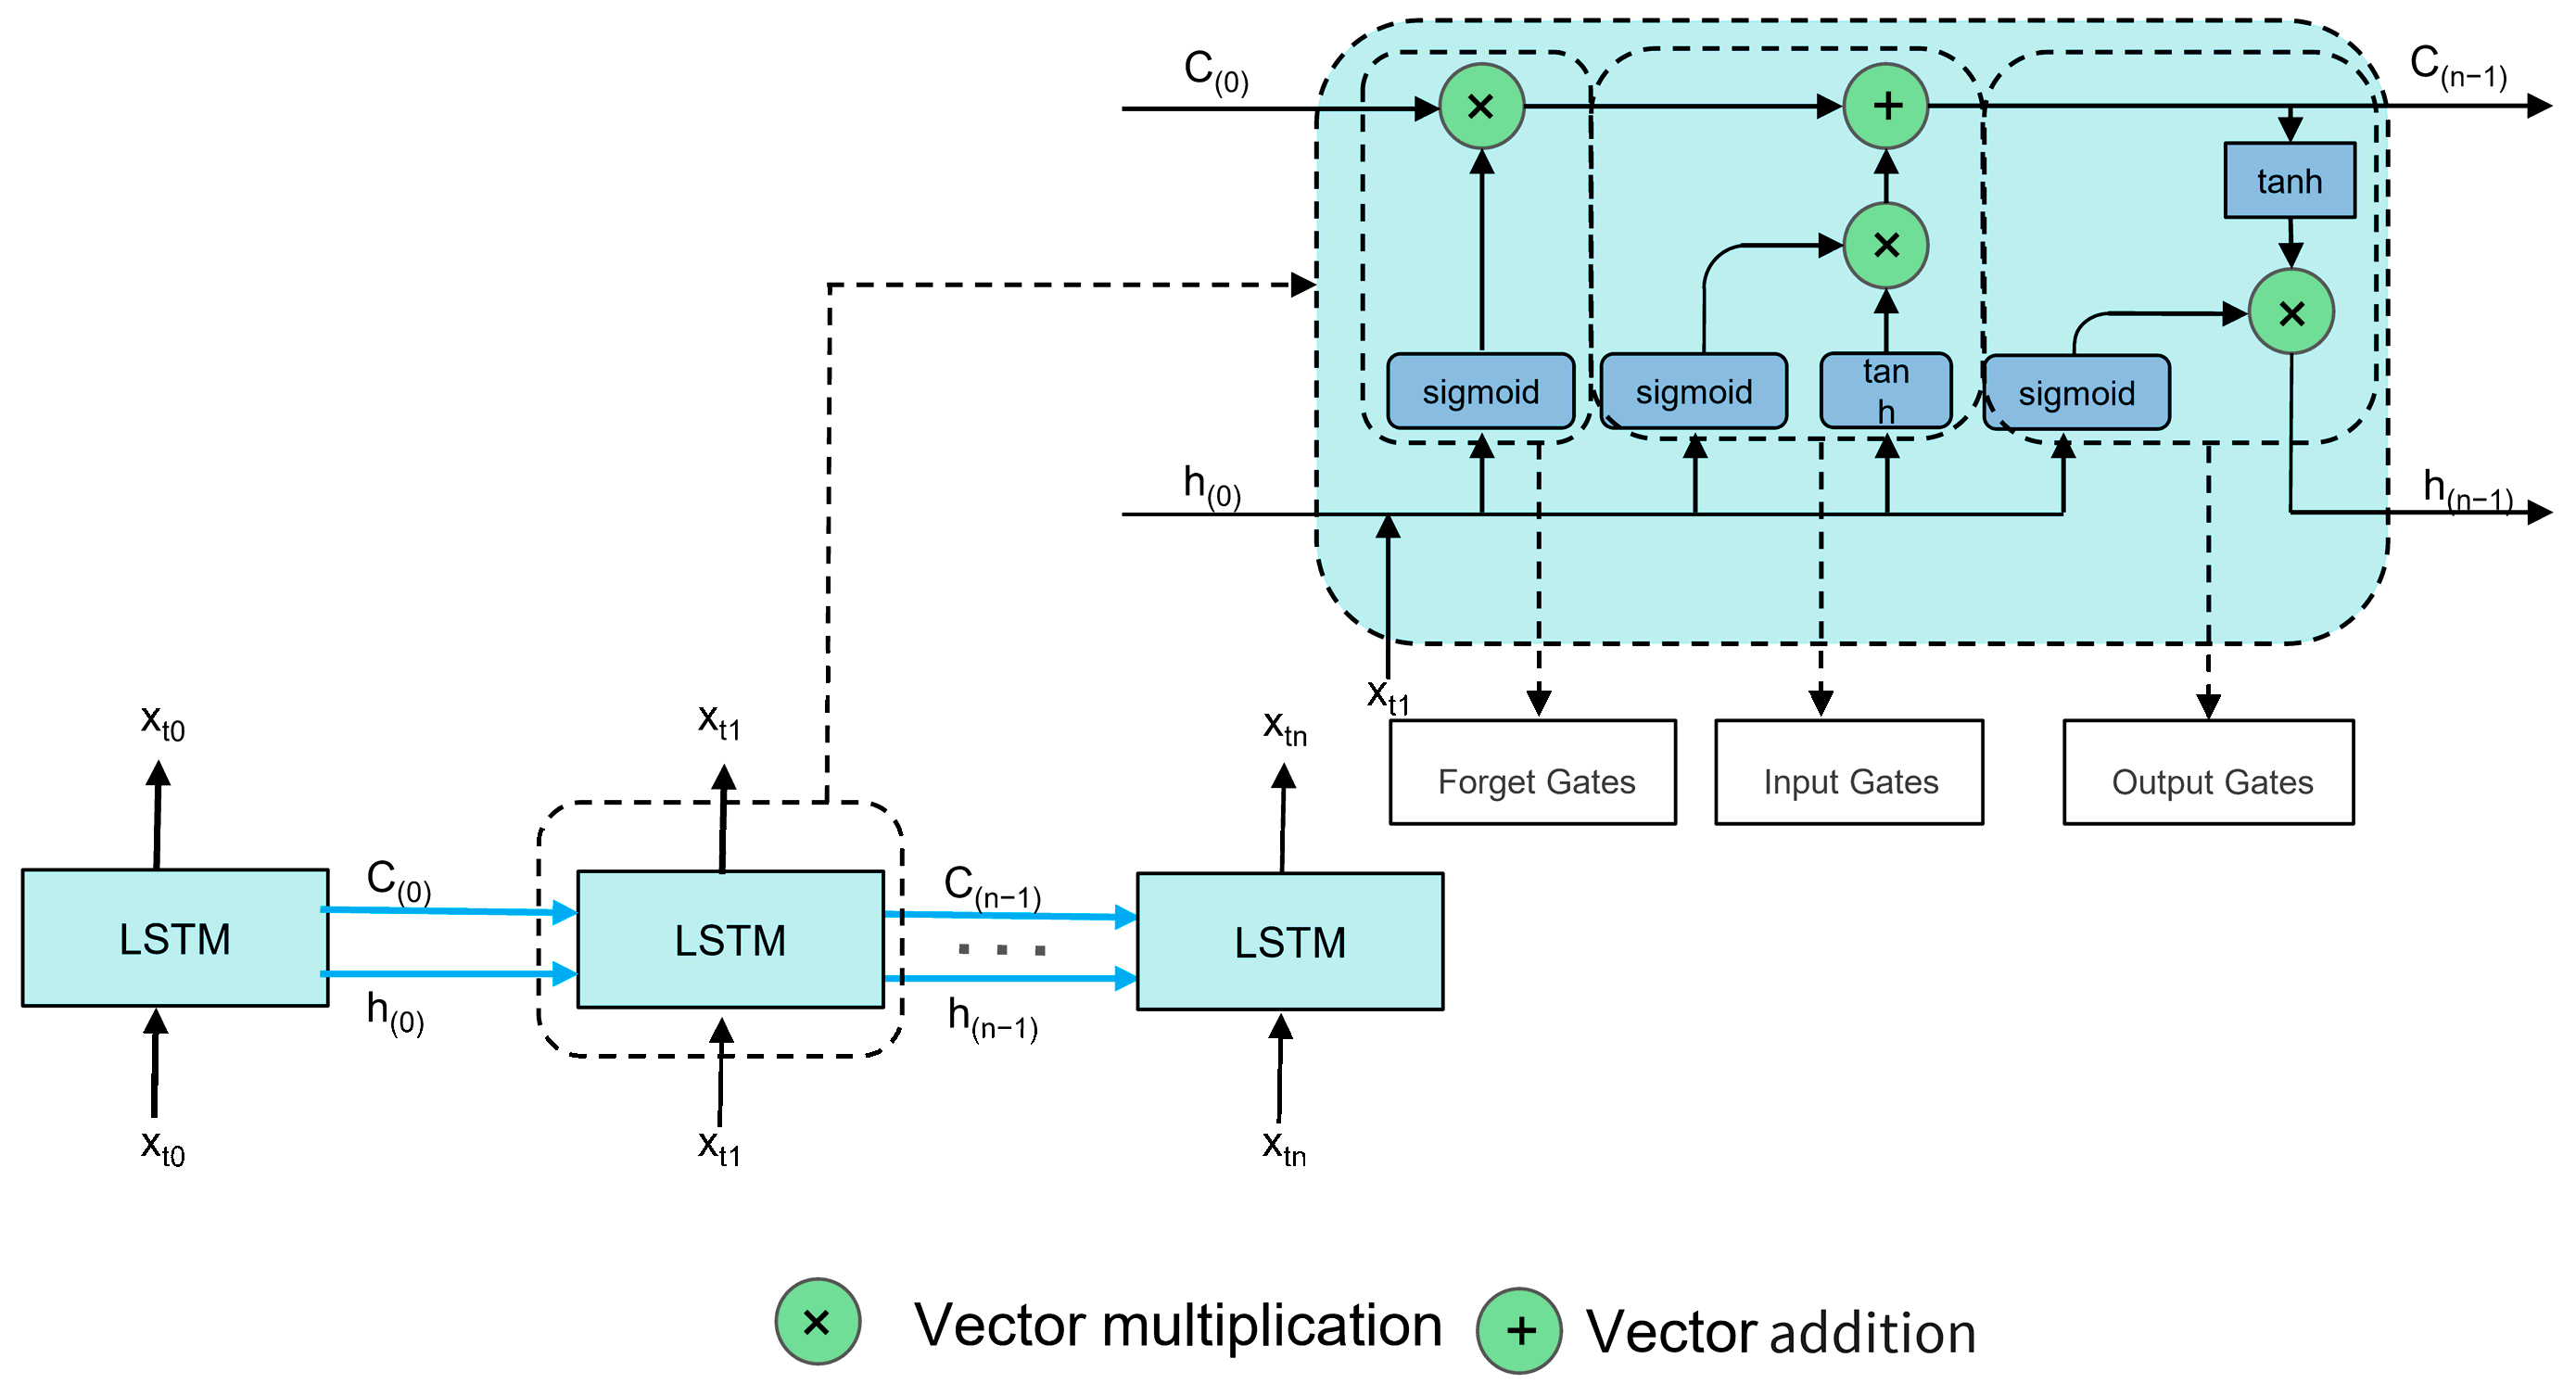
2.3. LSTM Model

LSTM networks, a subclass of Recurrent Neural Networks (RNNs), are distinguished by their capacity for maintaining long-term dependencies [28]. Shen et al. used LSTM to analyze the drag coefficient of car bodies [29]. Ref. [30] applied LSTM to predict groundwater levels, showcasing the model’s ability to handle fluctuating environmental data and provide accurate forecasts. Ref. [31] explored the prospects of applying LSTM in the field of autonomous driving, highlighting its potential to process and learn from vast amounts of sequential data. These diverse applications underscore the versatility of LSTM in various fields and its robust capability in handling time series data. Illustrated in Figure 2, LSTM units are set apart from traditional RNNs through the integration of three distinct “gates”, which collectively enhance the model’s memory management capabilities [32]:
  • Input Gate: Oversees the flow of incoming data into the cell, deciding how much of the new information should be stored;
  • Output Gate: Determines the extent to which the cell’s current state influences other parts of the network, controlling the output flow;
  • Forget Gate: Adjusts the cell’s self-recurrent connections using sigmoid functions to scale values between 0 and 1, determining what information is discarded or retained.
As a typical time series model, LSTM effectively handles path signature features within sequences. Known for its ability to capture long-term dependencies in sequential data [29,30,31], LSTM is particularly well-suited for this task due to the inherent sequential nature of network traffic data. Compared to other well-known deep learning models such as CNNs or Transformers, LSTM has the following advantages in this encrypted traffic classification task:
  • Better handling of temporal dependencies: While CNNs excel at capturing spatial hierarchies and patterns, they are typically more effective in processing data with spatial correlations (such as images) and cannot capture temporal dependencies as effectively as LSTM [33].
  • More straightforward and more direct data processing: Applying CNNs to sequence data requires transforming the time series into a format suitable for convolution operations, necessitating more complex data processing. In contrast, LSTM allows direct input of time series features into the model.
  • Lower computational resource requirements: Transformer models have recently gained popularity for their success in sequence-to-sequence tasks, especially in natural language processing. Transformers use self-attention mechanisms to capture dependencies between different parts of the input sequence, regardless of their distance [34]. While this is beneficial for capturing global dependencies, Transformers typically require substantial computational resources and large datasets for practical training. LSTM networks, using inherent gating mechanisms to process sequential data, require fewer computational resources for training and deployment.

3. Methodology

3.1. Overview of the Approach

The process flow of our method for classifying encrypted traffic is illustrated in Figure 3. Initially, during the data preprocessing phase, we dissect pcap files from publicly accessible datasets by employing the five-tuple criteria, subsequently discarding packets lacking valid payloads. This step ensures the creation of data flows of uniform length. Moving forward to the feature extraction phase, we derive size, direction, and arrival time attributes from these uniform data flows to establish traffic paths. A transformation process is applied to these traffic paths to enrich them with additional information. The next stage involves leveraging multi-scale accumulation techniques to distill path signature features from these enhanced traffic paths. After extracting these features, we apply data-balancing techniques to achieve a well-balanced training set. These optimized path signature features are input into an LSTM model and fully connected layers to execute the final classification task. The forthcoming subsections will delve into each phase of this methodology in greater depth.

3.2. Data Preprocessing

In handling the raw pcap files from the dataset, we employ SplitCap to segregate them into individual session files, utilizing the five-tuple criteria—source IP, source port, destination IP, destination port, and the transport layer protocol [3]. The following steps involve eliminating sessions devoid of data and duplicates. To mitigate the risk of model overfitting with this dataset, we anonymize the MAC and IP addresses in the packet data by substituting them with zeros [6]. Following this, we further refine the session files to ensure each contains precisely 24 data packets—a parameter whose significance will be elaborated on in the upcoming experimental section. Sessions not meeting the 24 data packet criterion are excluded, generating sample files that align with our experimental prerequisites.

3.3. Build Traffic Paths

Upon standardizing the session files to a uniform length, we categorize data packets transmitted from the client to the server with positive values while labeling packets moving in the reverse direction with negative values. This process results in the creation of a data packet length sequence, L = l 1 , l 2 , , l n , where l represents the length of each data packet [26]. Additionally, we capture the arrival time for each data packet. To synchronize these timestamps, we normalize the data to compile a time sequence for the packets, denoted as T = t 1 , t 2 , , t n , where t represents the arrival time for each data packet.

3.4. Transform Traffic Paths

Following the extraction of two-dimensional path signature features, which encapsulate the data packet time and length, we recognize that the representation of inter-session information remains incomplete. To enhance the utilization of inter-session characteristics, we adopt a methodology inspired by the work of Xu et al. [12]. This approach involves transforming the original traffic paths to unveil additional layers of information, thereby facilitating a more detailed and informative analysis.

3.4.1. Path Splitting

In our method, the term “client” refers to users who require Internet services. It is the clients’ use of various services on the Internet that generates different types of encrypted traffic. For instance, when a user uploads or downloads files online, file transfer traffic is produced. Similarly, when a user uses streaming services, such as listening to music or watching videos, streaming traffic is generated. To more accurately depict the traffic flow dynamics between the client and server, we partition the data packet length sequence into two distinct sequences. One sequence captures data transmissions from the client to the server, while the other details transmissions from the server to the client [12]. This division is formalized as follows below.
For client-to-server transmissions:
C = c 1 , c 2 , , c n , c i = 0 ,     l i < 0 l i ,     l i > 0 . .
Conversely, for server-to-client transmissions:
S = s 1 , s 2 , , s n , s i = l i ,     l i < 0 0 ,     l i > 0 . .
By assigning data packet sizes from the opposite direction of transmission as zero, we underscore the distinctive flow properties inherent to each direction, laying a foundational framework for further path transformations.

3.4.2. Path Accumulation

Accumulation features play a crucial role in classifying encrypted traffic [35], primarily because the payload size tends to remain constant across the same type of traffic service, leading to similar accumulation patterns. To leverage this consistency for revealing information within encrypted traffic payloads, we define the accumulation features as follows below.
Direct accumulation of packet lengths:
L = l 1 , l 2 , , l n , l i = i = 1 κ l i ,
For client-directed transmissions:
C = c 1 , c 2 , , c n , c i = i = 1 κ c i ,
For server-directed transmissions:
S = s 1 , s 2 , , s n , s i = i = 1 k s i .
Hence, we achieve a comprehensive representation of the traffic path through the following:
X t l , c , s , l , c , s , t = L , C , S , L , C , S , T , t 0 , n .
This representation integrates the initial data packet length sequences and their accumulated versions alongside the arrival time sequence, offering a multifaceted view of the traffic flow for adequate classification. Taking a specific traffic path L = [194,−83,−32,53,86] and T = [0,2,5,8,10] as an example, the corresponding transformed traffic path is shown in Table 1.

3.5. Extracting Path Signature
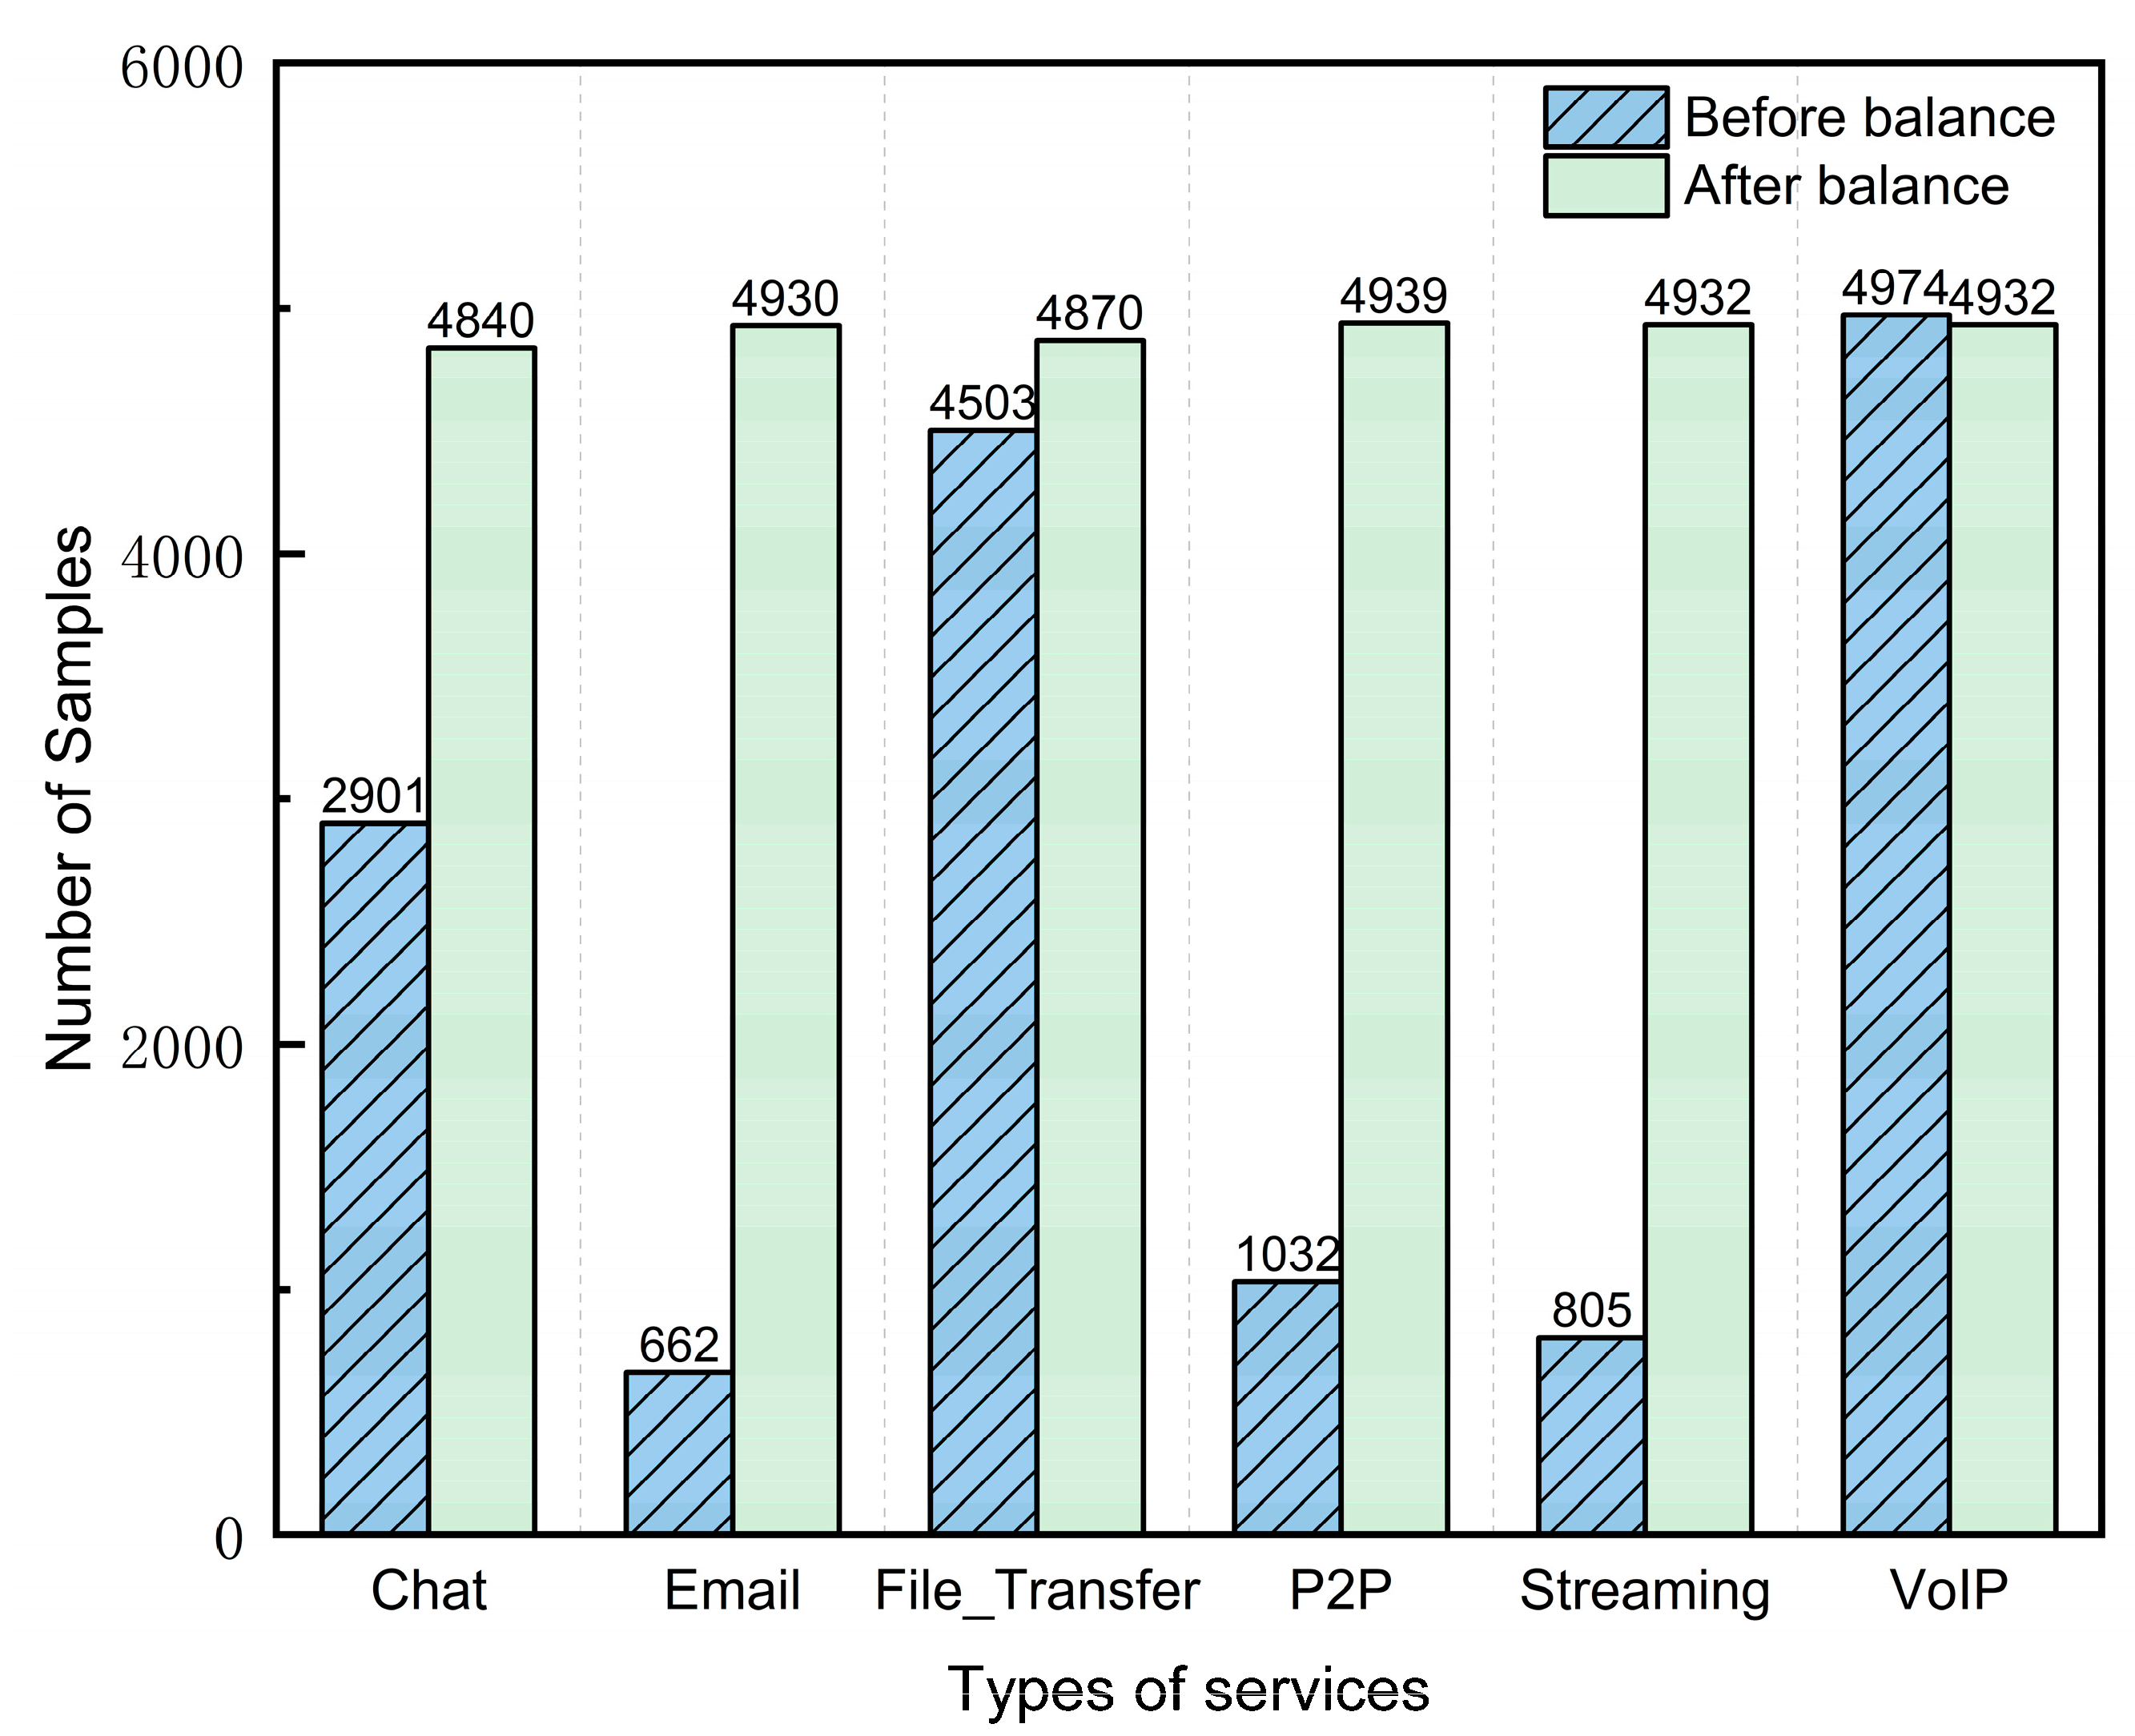
Upon the transformation of traffic paths, our next step involves extracting path signature features. We define the path feature f for each transformed path as follows:
f t = ϕ ( X t l , c , s , l , c , s , t ) ,   t 0 ,   n .
Here, ϕ ( X ) denotes the function responsible for extracting the path signature and f t represents the path signature of the first t data packets. It is important to note that the dimensionality of the path signature features depends solely on the path’s chosen truncation depth, independent of the actual length of each path. Within a many-to-one LSTM model, it is customary to utilize the features of the last time step as the input for final classification.
Leveraging the unique properties of the path signature and the LSTM model, as depicted in Figure 4, we introduce a novel multi-scale accumulation feature extraction approach. This method enhances the informational value extracted at the final time step input to the model. The formulation and structure of the input feature sequence are detailed as follows:
F = f 2 , f 3 , , f n .
The requirement that n ≥ 2 stems from the consideration that a path signature based on fewer than two data packets lacks substantive relevance. When n = 1, the path signature reduces to merely reflecting a single data packet’s length and arrival time, failing to satisfy the criteria for our experimental setup. Consequently, we compile the path signature sequence F, where each item contains the path signature features of the first n data packets, and all path signatures have the same dimension.

3.6. Data Balancing

Encountering imbalanced data across different classifications is a common issue when collecting experimental data from datasets. Implementing data-balancing techniques is pivotal to bolster training tasks’ effectiveness. This section delineates the strategies we have adopted to achieve data balance.

3.6.1. SMOTE (Synthetic Minority Over-Sampling Technique)

Introduced by Chawla [36], SMOTE is a leading oversampling methodology to rectify data imbalance issues. It augments the dataset by creating new, synthetic instances for the minority class derived from existing observations. Within the feature space, SMOTE crafts synthetic samples resembling the minority class. Specifically, for each minority class sample, SMOTE identifies its n nearest neighbors using Euclidean distance. Following this, one neighbor is chosen randomly, generating a vector linking this neighbor and the sample. A synthetic instance is then formed by adding a random fraction of this vector to the original sample. This procedure is repeated until the target oversampling rate is attained [36]. The SMOTE algorithm’s formula is given as follows:
n = s + d     s R s , 0 d 1 .
where s symbolizes the minority class samples, s R denotes the neighbors determined by k nearest neighbors, d is a randomly selected value within the range [0,1], and n represents the generated synthetic sample. As shown in Figure 5, two different colored points represent two different types of samples, the three nearest neighbors of sample s are s 1 R , s 2 R , and s 3 R . Using the SMOTE method, a neighbor s 1 R is randomly selected for sample s, and a new sample n is obtained through calculation.

3.6.2. ENN (Edited Nearest Neighbors)

ENN employs the k nearest neighbors algorithm as a secondary sampling strategy [37]. It aims to prune the dataset by removing instances likely to be misclassified. ENN computes the Euclidean distance for every instance to pinpoint its k nearest neighbors (where k is commonly set to 3). If most of these neighbors do not share the instance’s class, the instance and its neighbors are excised from the dataset [37]. Thus, ENN can effectively decrease the presence of majority class samples within the training set. Taking sample e in Figure 5 as an example, its k (set to 3) neighbors are all from other classes. Using the ENN method, all four samples will be removed.

3.6.3. SMOTE-ENN

SMOTE-ENN combines the strengths of both SMOTE and ENN into a unified approach to data balancing, as proposed by Batista et al. [38]. Initially, the dataset undergoes an enhancement via the SMOTE algorithm, which amplifies the minority class’s representation through synthetic sample creation. Once an adequate number of minority class samples is produced, the ENN algorithm is applied to refine the dataset further by removing instances close to the classification boundary. This sequential application of SMOTE and ENN facilitates a more evenly distributed sample set across classes [38].

3.7. Input to the LSTM Model

The sequence of path signatures, denoted as F, serves as the input to the LSTM model, setting the stage for the classification process. The configuration of time steps within the LSTM correlates directly with the length of the initial traffic path, reduced by one. Consequently, the feature fn+1 at the nth time step encapsulates the path signature of a traffic path comprising n + 1 data packets. This arrangement ensures that with each additional time step, incrementally more information is incorporated, enriching the data representation. Notably, the feature at the final time step integrates the path signature of the entire traffic path, embodying the most exhaustive information available.
The inherent memory capability of the LSTM model [28] plays a pivotal role, enabling each time step to harness and convey information from preceding steps. As a result, the concluding time step effectively aggregates information across the entire sequence, circumventing the potential drawbacks of relying solely on global features. This comprehensive information integration significantly boosts the model’s classification precision.

3.8. Fully Connected Layer

Following the LSTM’s processing of the input sequence, the last time step’s output undergoes extraction and is then directed towards a fully connected layer, where the classification endeavor is actualized. The essence of this layer lies in its capacity to transition the LSTM-acquired data features into the domain of label space. The operation within the fully connected layer is mathematically depicted as follows:
Y = W × X + B .
where Y is the output vector, W is the weight of the fully connected layer, X is the input vector derived from the LSTM’s final time step, and B is the bias.

3.9. Complete Workflow

In this section, we will explain our proposed method’s workflow in detail. After capturing a traffic segment, we first extract the two basic statistical features of packet length and packet arrival time to form the traffic path. We then split the packet length sequence into two paths representing the direction of packet transmission. Next, we perform an accumulation process to obtain three paths representing the cumulative packet length transmission. This results in a seven-dimensional traffic path.
By employing the path signature feature function, we transform the seven-dimensional traffic path into high-dimensional path signature features, which are then fed into the LSTM model. The LSTM model processes the input sequence progressively, step by step. At each time step, the input features interact with the hidden state and memory cell state from the previous time step. Through a series of gating mechanisms, the hidden state and memory cell state are updated at each time step, allowing the model to effectively capture temporal dependencies within the traffic data.
After processing the entire sequence, the hidden state of the LSTM model at the final time step is selected as the feature output. This hidden state has integrated information from the entire input sequence and represents the global characteristics of the sequence data. The selected hidden state is then input into a fully connected layer. The fully connected layer, through a series of weights and activation functions, further processes the hidden state to generate a probability distribution for the classification result. Table 2 illustrates the changes in shape at each stage of processing an encrypted traffic sequence containing 24 packets.

4. Discussion

In this section, we will elaborate on various aspects of our experimental framework, shedding light on various facets such as the experimental environment, evaluation metrics, datasets employed, data processing techniques, and the selection of hyperparameters. Furthermore, to establish our methodology’s efficacy and competitive edge, we conducted comparative experiments against prevailing mainstream techniques. Ablation studies were also undertaken to underscore the contribution and impact of individual components within our proposed framework.

4.1. Experimental Environment

The experiments were conducted on a Windows 10 operating system with Python version 3.9. We implemented the LSTM model using PyTorch version 1.13.1. We set the initial learning rate for model training to 0.0001 and the training epochs to 500. The LSTM model used for this experiment has 64 hidden dimensions, and the output dimension of the subsequent fully connected layer is 6, corresponding to the six-class classification task of encrypted traffic service types.

4.2. Evaluation Metrics

We employed four evaluation metrics to assess the performance of the method: accuracy (AC), precision (PR), recall (RC), and F1 score (F1). True positives (TPs) are correctly identified positive samples, false positives (FPs) are negative samples misclassified as positive, true negatives (TNs) are correctly identified negative samples, and false negatives (FNs) are positive samples misclassified as negative.
Accuracy = T P + T N T P + T N + F P + F N ,
Precision = T P T P + F P ,
Recall = T P T P + F N ,
F1-score = 2 Precision Recall Precision + Recall .
These metrics offer a comprehensive view of the model’s efficacy, encapsulating its accuracy, precision, and sensitivity in classifying the data into its respective categories.

4.3. Datasets

To comprehensively verify the performance of our proposed method, we used two publicly available datasets: the ISCX VPN-nonVPN dataset [39] and the ISCX Tor-nonTor dataset [40]. These datasets were published by the University of New Brunswick.
The ISCX VPN-nonVPN dataset consists of two parts: ISCX-VPN and ISCX-nonVPN. The ISCX-VPN dataset contains traffic captured in a VPN environment for six service types: chat, email, file transfer, streaming, P2P, and VoIP. The ISCX-nonVPN dataset includes the same types of traffic, but captured outside the VPN environment.
Similarly, the ISCX Tor-nonTor dataset is divided into ISCX-Tor and ISCX-nonTor. The ISCX-Tor dataset collects traffic through the Tor network, which provides a high level of anonymity. The ISCX-nonTor dataset contains traffic collected outside the Tor environment, with traffic types identical to those in the ISCX-VPN dataset. Table 3 presents the main applications corresponding to each service type and provides a brief description.
After obtaining the dataset, we used the packet length and arrival time to construct our path signature features. Packet length refers to the byte size of each packet in the data stream. Since traffic transmission in a network is usually bidirectional, we added positive and negative signs to indicate the direction of the traffic: traffic from the client to the server was set as positive, and traffic from the server to the client was set as negative. This created a packet length sequence that represents both the transmission direction and packet load size.
Packet arrival time refers to the time at which each packet is received, starting from the reception of the first packet and recording the arrival time of each subsequent packet. This results in an increasing time series that represents the transmission frequency of the packets. By segmenting and accumulating the packet length sequence and normalizing the packet arrival times, we obtained the final traffic path. This path was then input into the path signature feature function to derive the traffic path signature features required for our method.

4.4. Data Balancing

In addressing the sample imbalance inherent in the ISCX VPN-nonVPN dataset for the classification of encrypted traffic, our methodology employed a multifaceted approach to ensure equitable representation across different traffic service types. Initially, a threshold of 5000 samples was established, whereby categories exceeding this number had a random subset of 5000 samples chosen, whereas categories falling below this threshold utilized all available samples to maximize data usage. After this selection, the category with the lowest sample count was identified, establishing a benchmark for uniformity. A portion corresponding to one-fifth of this minimal count was extracted from each category to assemble a comprehensive test set, ensuring a balanced representation. The SMOTE-ENN was applied to address the residual imbalance in the training dataset, synthesizing new samples for minority classes and removing ambiguous samples to refine the dataset quality. Figure 6 compares the number of samples for each category before and after balancing for the training set data in the ISCX-VPN dataset.

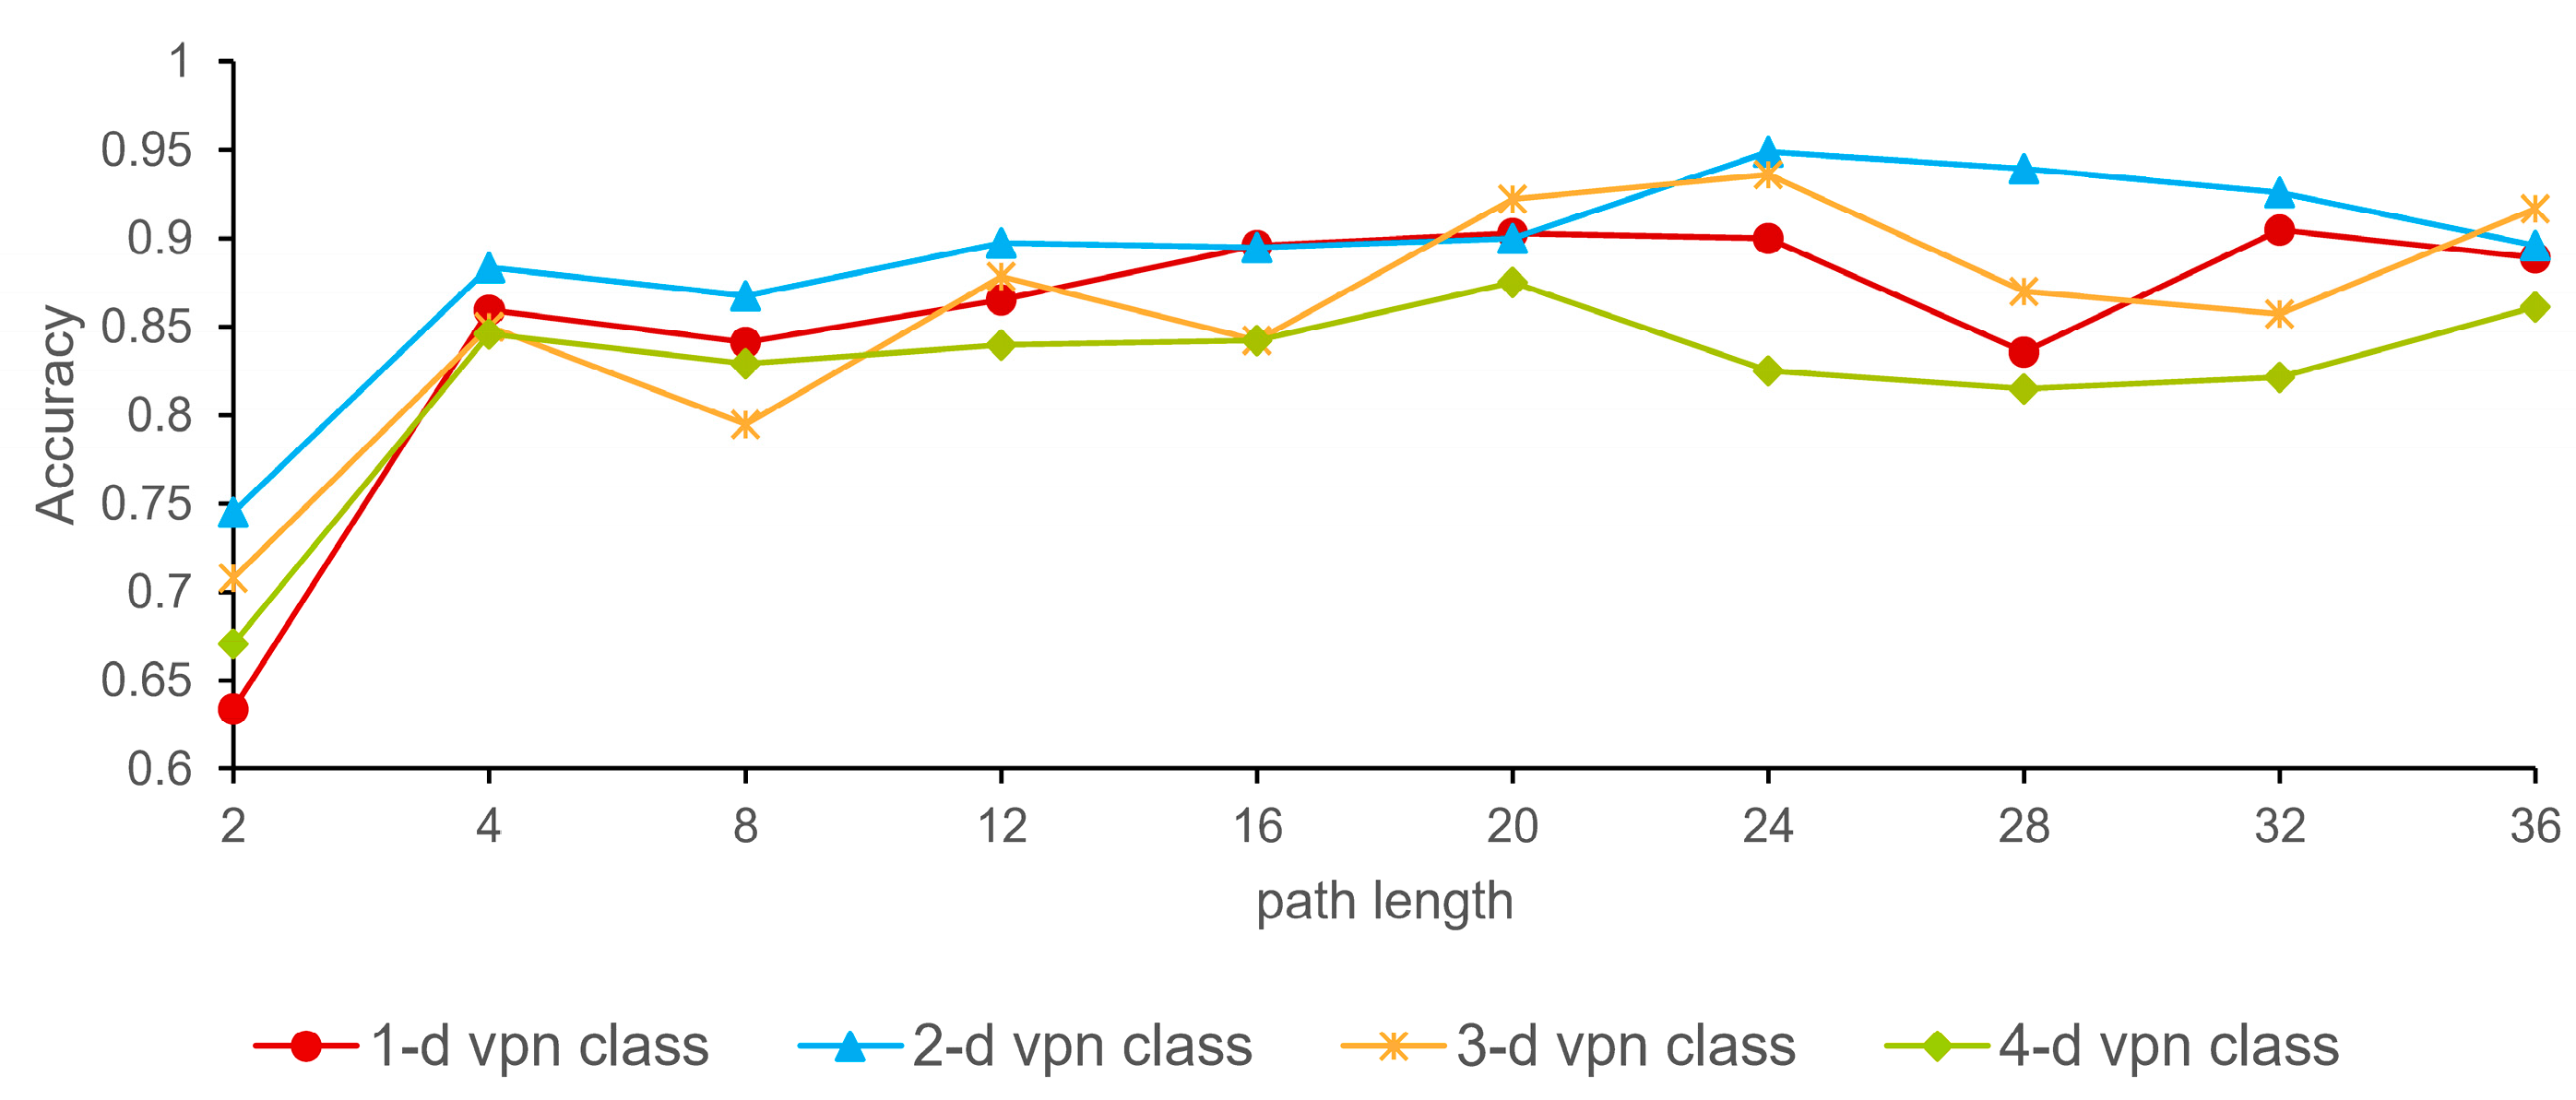
4.5. Parameter Selection

In our experiments, the values of two crucial hyperparameters, namely the length the of traffic paths and the dimensions of the path signatures, played a significant role and were closely related to the model’s performance. They directly shaped the model’s ability to learn from and interpret the data, influencing the analysis’s depth and breadth. The traffic path length determines the input data for each analysis instance, impacting the model’s comprehension of session continuity. Meanwhile, the dimensionality of the path signatures affects the complexity and detail of the features extracted from the traffic paths, balancing between information richness and computational feasibility. In this section, we elaborate on the process of obtaining these hyperparameters.
The optimal traffic path length is dictated by the necessity to include a sufficient number of consecutive data packets with valid payloads in a session file, which constructs the basis of the original traffic path. A path length that is too succinct may lead to session files devoid of adequate data for efficacious traffic classification tasks. Conversely, overly elongated traffic paths may unnecessarily increase data collection requirements without proportionate gains in classification accuracy [41]. Discerning the optimal length of traffic paths was vital as a foundational element in our experimental design.
In classifying service types for encrypted traffic under VPN conditions, we aimed to determine the optimal path length. As shown in Figure 7, when the path length was relatively short, the classification accuracy fluctuated and gradually improved with increasing path length for any given dimension. When the path length reached 20, various-dimensional models achieved relatively good classification performance. Among these, the two-dimensional path model attained the highest classification accuracy (94.74%) when the path length was 24. Subsequently, as the path length increased, the classification accuracy did not significantly improve and, in some dimensions, even decreased. Consequently, we selected 24 as our optimal parameter for the path length.
Moreover, the choice of path signature dimensions is equally critical. Higher-order path signatures inherently encapsulate more information than their lower-order counterparts. Nevertheless, a rise in path signature dimensions precipitates an exponential surge in feature dimensions [11]. For instance, a second-order signature feature in a seven-dimensional traffic path would have a dimensionality of 56, escalating to 399 for the third order and 2800 for the fourth order. This trend underscores the balance required between the informational gain from increased path signature dimensions and the resultant computational complexity.
As shown in Figure 7, based on our experiments, increasing the dimensions did not significantly improve the classification performance. There was a slight decrease in performance when the dimensions were increased to four. We opted for a two-dimensional path signature as the optimal parameter considering classification performance and computational efficiency.

4.6. Sensitivity Analysis

To evaluate the robustness of our method, we conducted a sensitivity analysis. Sensitivity analysis is a technique used to assess a model’s responsiveness to parameter changes. We observed the impact on model performance by varying the learning rate and regularization parameters during model training. Expressly, while evaluating the impact of the learning rate, we set the L2 regularization parameter to 0.0001, and while assessing the impact of the regularization parameter, we set the learning rate to 0.0001. The experimental results are shown in Table 4 and Table 5.
It can be observed that as the learning rate and regularization parameters changed, our proposed method’s classification accuracy remained consistently high, despite some fluctuations. This indicates the strong robustness of our method. The ability to maintain a high level of accuracy under varying conditions demonstrates the reliability and stability of our approach.

4.7. Ablation Study

To underscore the contributions of each component within our proposed method for encrypted traffic classification, we executed a series of ablation studies. These studies were designed to assess the impact of the path signature feature individually, the multi-scale cumulative feature extraction method, and the LSTM model on the overall performance.
Path signature feature ablation: For this part of the study, we no longer extract path signature features from the traffic paths. Instead, the raw seven-dimensional feature samples were fed directly into the LSTM model, bypassing the path signature processing step. All other experimental conditions were maintained using the established method.
Feature extraction method ablation: In evaluating the role of our multi-scale cumulative feature extraction method, we set aside this advanced approach in favor of the classical method referenced by Xu et al. [12]. The features obtained through this traditional extraction process were then introduced to the LSTM model for classification. Again, this adjustment was made while keeping all other experimental parameters unchanged.
LSTM model ablation: To examine the specific contribution of the LSTM model, we replaced it with a Random Forest algorithm for the classification task, employing parameter settings aligned with those suggested by Xu [12]. This substitution allowed us to directly compare the efficacy of LSTM with an alternative, well-established classification technique.
The outcomes of these ablation experiments, as depicted in Figure 8, exhibit significant variations when juxtaposed with the results achieved using our whole method. Such differences highlight each component’s critical role in our methodology, validating their collective necessity and effectiveness in enhancing classification accuracy.
Through these ablation studies, the integral value and synergistic effect of the path signature features, the novel feature extraction method, and the LSTM model were demonstrated, affirming their indispensable contributions to our method’s superior performance.

4.8. Comparison Experiments

4.8.1. The Benchmark Methods

To ascertain the effectiveness of our proposed encrypted traffic classification method, it was benchmarked against 11 contemporary mainstream approaches. These methodologies span across the following:
  • Fingerprint construction: FlowPrint [17];
  • Statistical methods: AppScanner [9], CUMUL [35], K-FP (K-Fingerprinting) [42], GRAIN [43], and ETC-PS [12];
  • Deep learning models: FS-net [20], DF [19], MT-FlowFormer [23], GraphDApp [44], and ET-BERT (flow) [16].
Notably, our proposed method exclusively utilizes flow-level features of encrypted traffic. For the sake of fairness, we opted to compare it against ET-BERT (flow), which also relies solely on flow-level features, rather than ET-BERT (packet), which achieves better classification performance but requires packet-level features.

4.8.2. Experimental Results

We evaluated the effectiveness of various methods, including our own, on the ISCX VPN-nonVPN and ISCX Tor-nonTor datasets, as shown in Table 6 and Table 7. Table 6 presents the classification performance of traffic service types in VPN and non-VPN environments, while Table 7 shows the classification performance in Tor and non-Tor environments. Our method demonstrated a superior and competitive performance across most metrics compared to most benchmark methods.
In these classification tasks, our method exhibited significant improvements in accuracy, precision, recall, and F1 score compared to ETC-PS, which also utilizes path signature features. When compared to the highest performing model, ET-BERT (flow), our method’s accuracy was only 0.58% lower in the VPN environment and 1.57% lower in the Tor environment classification tasks. However, it is essential to acknowledge that ET-BERT (flow) is a complex, large-scale pre-trained model, starkly contrasting our more streamlined approach using a classical small-scale LSTM model.

4.8.3. Performance Analysis

To more comprehensively evaluate the model’s complexity and the computational resources required, we used parameters (Params), floating-point operations (FLOPs), inference time, and latency time as evaluation metrics. Parameters denote the cumulative sum of all learnable weights and biases within a neural network, while FLOPs primarily refer to the number of floating-point arithmetic operations required during the neural network’s forward and backward propagation processes.
In our experiment, we used a batch size of 32 samples. The time taken from inputting the model to obtaining the prediction results is referred to as the inference time, whereas latency time refers to the duration from loading the 32 samples into memory to obtaining the prediction results. It is important to note that the number of parameters and FLOPs can only be used to evaluate deep learning models. Therefore, we only assessed methods that utilize deep learning models.
Table 8 presents the Params, FLOPs, inference time, and latency time for different methods. The data in the table clearly show that our method exhibits significant advantages in several aspects for the same encrypted traffic classification task.
Firstly, our method uses significantly fewer parameters (Params) than other methods in terms of model complexity. This means that our model structure is more concise and efficient, which helps reduce the risk of overfitting while improving the model’s interpretability and maintainability.
Secondly, regarding computational resource requirements, our method requires fewer floating-point operations (FLOPs). This indicates that our model demands less computation during forward and backward propagation, allowing faster training and inference processes. This is particularly important for resource-constrained applications, such as embedded systems or mobile devices.
Furthermore, our method demonstrates clear advantages in both inference time and latency time. The inference time is shorter, and the latency time is lower. This indicates that our model is not only computationally efficient but also highly responsive, making it suitable for real-time or near-real-time applications. Considering all these factors, we deem the slight discrepancy in classification accuracy to be acceptable.
We attribute the short inference time and latency time of our method to the following two main reasons:
  • Our model architecture has a lower complexity and requires fewer computational resources. As a result, the calculations are completed quickly once the samples are input into the model, thereby reducing the inference time.
  • Our sample size is relatively small, with an input size of (1,23,56). Additionally, the computational load on the CPU is minimal, allowing for a swift transfer of data from the CPU to the GPU, thereby reducing the latency time.

4.8.4. Statistical Analysis

To further validate the effectiveness of our method, we employed the Wilcoxon signed-rank test to determine if there are statistically significant differences between our classification results and those of other models. The Wilcoxon signed-rank test is a widely used statistical method for comparing two sets of data [45]. Our null hypothesis posits the following: “The two detection methods have the same classification performance”. If the p-value is greater than 0.05, we accept the null hypothesis. If the p-value is less than 0.05, we reject the null hypothesis at a 95% confidence level. The p-values comparing our proposed method with each baseline model are shown in Table 9 and Table 10.
Based on the results, we can conclude that the p-values for all methods compared to our method, except for ET-BERT, are less than 0.05. This indicates that, except for ET-BERT, there are significant differences in classification performance between our method and the other methods. Specifically, a p-value less than 0.05 means we can reject the null hypothesis at a 95% confidence level, implying that the assumption that the two methods have the same classification performance does not hold.
Therefore, our method significantly outperforms the other baseline models in terms of classification performance, except for ET-BERT. For ET-BERT, the p-value is greater than 0.05, indicating no statistically significant difference in classification performance between our method and ET-BERT. This further validates the effectiveness of our method, demonstrating that the advantages of our model in complexity and computational resources do not come at the expense of classification performance.

5. Conclusions and Future Works

In this study, we proposed a method that combines path signature features with an LSTM model to classify encrypted traffic service types using only 24 consecutive inter-traffic features. The core of our method involves extracting fundamental features (such as packet size and arrival time) from the sequence of encrypted traffic packets to construct detailed traffic paths. These paths undergo a transformation process and are enhanced using multi-scale, cumulative feature extraction techniques, ultimately generating multi-scale path signature features. These features are then effectively used as inputs to the LSTM model, resulting in precise classification outcomes.
We evaluated our method on the publicly available ISCX VPN-nonVPN and ISCX Tor-nonTor datasets. The experimental results showed classification accuracies of 94.74%, 90.53%, 93.86%, and 95.03% in the VPN, non-VPN, Tor, and non-Tor environments, respectively. These results are comparable to the state-of-the-art methods. Additionally, our performance analysis and statistical analysis experiments demonstrated the advantages of our method over large-scale neural network models.
However, as a classification method that relies on packet length, our approach, like other methods [12] based on packet length features, is extremely limited in effectiveness against encrypted traffic that uses packet length obfuscation techniques such as packet padding [46]. Packet padding is an effective defense against traffic analysis, making all packet lengths identical. Exploring more distinguishable features in encrypted traffic may address this issue. Additionally, our model employs a relatively simple LSTM structure; it may thus perform poorly when handling more complex real-world classification tasks, indicating a need for more robust classifiers.
In future work, we plan to expand our approach by utilizing more datasets to apply it to more intricate network environments. Furthermore, the exploration of our methodology’s applicability to the domain of anomaly traffic detection remains a central pillar of our future research objectives.

Author Contributions

Conceptualization, Y.M. and N.L.; methodology, Y.M.; software, Y.M.; validation, Y.M., G.Z. and X.Y.; formal analysis, Y.M.; investigation, G.Z.; resources, Y.M.; data curation, X.Y.; writing—original draft preparation, Y.M.; writing—review and editing, Y.M.; visualization, G.Z.; supervision, N.L.; project administration, N.L.; funding acquisition, N.L. All authors have read and agreed to the published version of the manuscript.

Funding

This work was funded in part by the National Social Science Fund of China under Grant 20&ZD293.

Data Availability Statement

Publicly available datasets were analyzed in this study. These data can be found here: https://www.unb.ca/cic/datasets/vpn.html (accessed on 1 June 2024).

Acknowledgments

The authors would like to thank the anonymous reviewers for their contribution to this paper.

Conflicts of Interest

The authors declare no conflict of interest.

References

  1. Bader, O.; Lichy, A.; Hajaj, C.; Dubin, R.; Dvir, A. MalDIST: From Encrypted Traffic Classification to Malware Traffic Detection and Classification. In Proceedings of the 2022 IEEE 19th Annual Consumer Communications & Networking Conference (CCNC), Las Vegas, NV, USA, 8–11 January 2022; pp. 527–533. [Google Scholar]
  2. Wang, Y.; He, H.; Lai, Y.; Liu, A.X. A Two-Phase Approach to Fast and Accurate Classification of Encrypted Traffic. IEEE/ACM Trans. Netw. 2023, 31, 1071–1086. [Google Scholar] [CrossRef]
  3. Wang, W.; Zhu, M.; Wang, J.; Zeng, X.; Yang, Z. End-to-end encrypted traffic classification with one-dimensional convolution neural networks. In Proceedings of the 2017 IEEE International Conference on Intelligence and Security Informatics (ISI), Beijing, China, 22–24 July 2017; pp. 43–48. [Google Scholar]
  4. Shen, M.; Liu, Y.; Zhu, L.; Xu, K.; Du, X.; Guizani, N. Optimizing Feature Selection for Efficient Encrypted Traffic Classification: A Systematic Approach. IEEE Netw. 2020, 34, 20–27. [Google Scholar] [CrossRef]
  5. Karagiannis, T.; Papagiannaki, K.; Faloutsos, M. BLINC: Multilevel traffic classification in the dark. ACM SIGCOMM Comput. Commun. Rev. 2005, 35, 229–240. [Google Scholar] [CrossRef]
  6. Lotfollahi, M.; Jafari Siavoshani, M.; Shirali Hossein Zade, R.; Saberian, M. Deep packet: A novel approach for encrypted traffic classification using deep learning. Soft Comput. 2020, 24, 1999–2012. [Google Scholar] [CrossRef]
  7. Al-Naami, K.; Chandra, S.; Mustafa, A.; Khan, L.; Thuraisingham, B.M. Adaptive encrypted traffic fingerprinting with bi-directional dependence. In Proceedings of the Conference on Computer Security Applications, Los Angeles, CA, USA, 5–9 December 2016. [Google Scholar]
  8. Taylor, V.F.; Spolaor, R.; Conti, M.; Martinovic, I. Robust Smartphone App Identification via Encrypted Network Traffic Analysis. IEEE Trans. Inf. Forensics Secur. 2018, 13, 63–78. [Google Scholar] [CrossRef]
  9. Taylor, V.F.; Spolaor, R.; Conti, M.; Martinovic, I. AppScanner: Automatic Fingerprinting of Smartphone Apps from Encrypted Network Traffic. In Proceedings of the 2016 IEEE European Symposium on Security and Privacy (EuroS&P), Saarbrucken, Germany, 21–24 March 2016; pp. 439–454. [Google Scholar]
  10. Xie, G.; Li, Q.; Jiang, Y. Self-attentive deep learning method for online traffic classification and its interpretability. Comput. Netw. 2021, 196, 108267. [Google Scholar] [CrossRef]
  11. Chen, K.T. Integration of Paths—A Faithful Representation of Paths by Noncommutative Formal Power Series. Trans. Am. Math. Soc. 1958, 89, 395–407. [Google Scholar] [CrossRef]
  12. Xu, S.-J.; Geng, G.-G.; Jin, X.-B.; Liu, D.-J.; Weng, J. Seeing traffic paths: Encrypted traffic classification with path signature features. IEEE Trans. Inf. Forensics Secur. 2022, 17, 2166–2181. [Google Scholar] [CrossRef]
  13. Yamansavascilar, B.; Guvensan, M.A.; Yavuz, A.G.; Karsligil, M.E. Application identification via network traffic classification. In Proceedings of the 2017 International Conference on Computing, Networking and Communications (ICNC), Silicon Valley, CA, USA, 26–29 January 2017; pp. 843–848. [Google Scholar]
  14. Chen, R.T.Q.; Rubanova, Y.; Bettencourt, J.; Duvenaud, D.K. Neural ordinary differential equations. Adv. Neural Inf. Process. Syst. 2018, 31, 07366. [Google Scholar]
  15. Dainotti, A.; Pescape, A.; Claffy, K.C. Issues and Future Directions in Traffic Classification. IEEE Netw. 2012, 26, 35–40. [Google Scholar] [CrossRef]
  16. Lin, X.; Xiong, G.; Gou, G.; Li, Z.; Shi, J.; Yu, J. Et-bert: A contextualized datagram representation with pre-training transformers for encrypted traffic classification. In Proceedings of the ACM Web Conference 2022, Lyon, France, 25–29 April 2022; pp. 633–642. [Google Scholar]
  17. Van Ede, T.; Bortolameotti, R.; Continella, A.; Ren, J.; Dubois, D.J.; Lindorfer, M.; Choffnes, D.; van Steen, M.; Peter, A. Flowprint: Semi-supervised mobile-app fingerprinting on encrypted network traffic. In Proceedings of the Network and Distributed System Security Symposium (NDSS), San Diego, CA, USA, 23–26 February 2020. [Google Scholar]
  18. Biju, V.G.; Prashanth, C. Friedman and Wilcoxon evaluations comparing SVM, bagging, boosting, K-NN and decision tree classifiers. J. Appl. Comput. Sci. Methods 2017, 9, 23–47. [Google Scholar] [CrossRef]
  19. Sirinam, P.; Imani, M.; Juarez, M.; Wright, M. Deep fingerprinting: Undermining website fingerprinting defenses with deep learning. In Proceedings of the 2018 ACM SIGSAC Conference on Computer and Communications Security, Toronto, ON, Canada, 15–19 October 2018; pp. 1928–1943. [Google Scholar]
  20. Liu, C.; He, L.; Xiong, G.; Cao, Z.; Li, Z. Fs-net: A flow sequence network for encrypted traffic classification. In Proceedings of the IEEE INFOCOM 2019-IEEE Conference On Computer Communications, Paris, France, 29 April–2 May 2019; pp. 1171–1179. [Google Scholar]
  21. Lin, K.; Xu, X.; Gao, H. TSCRNN: A novel classification scheme of encrypted traffic based on flow spatiotemporal features for efficient management of IIoT. Comput. Netw. 2021, 190, 107974. [Google Scholar] [CrossRef]
  22. Zhang, H.; Yu, L.; Xiao, X.; Li, Q.; Mercaldo, F.; Luo, X.; Liu, Q. TFE-GNN: A Temporal Fusion Encoder Using Graph Neural Networks for Fine-grained Encrypted Traffic Classification. In Proceedings of the ACM Web Conference 2023, Austin, TX, USA, 30 April–1 May 2023; pp. 2066–2075. [Google Scholar]
  23. Zhao, R.; Deng, X.; Yan, Z.; Ma, J.; Xue, Z.; Wang, Y. Mt-flowformer: A semi-supervised flow transformer for encrypted traffic classification. In Proceedings of the 28th ACM SIGKDD Conference on Knowledge Discovery and Data Mining, Washington, DC, USA, 14–18 August 2022; pp. 2576–2584. [Google Scholar]
  24. Graham, B. Sparse arrays of signatures for online character recognition. arXiv 2013, arXiv:1308.0371. [Google Scholar]
  25. Gyurkó, L.G.; Lyons, T.; Kontkowski, M.; Field, J. Extracting information from the signature of a financial data stream. arXiv 2013, arXiv:1307.7244. [Google Scholar]
  26. Perez Arribas, I.; Goodwin, G.M.; Geddes, J.R.; Lyons, T.; Saunders, K.E. A signature-based machine learning model for distinguishing bipolar disorder and borderline personality disorder. Transl. Psychiatry 2018, 8, 274. [Google Scholar] [CrossRef] [PubMed]
  27. Hambly, B.; Lyons, T. Uniqueness for the signature of a path of bounded variation and the reduced path group. Ann. Math. 2010, 171, 109–167. [Google Scholar] [CrossRef]
  28. Hochreiter, S.; Schmidhuber, J. Long short-term memory. Neural Comput. 1997, 9, 1735–1780. [Google Scholar] [CrossRef]
  29. Shen, S.; Han, T.; Pang, J. Car drag coefficient prediction using long–short term memory neural network and LASSO. Measurement 2024, 225, 113982. [Google Scholar] [CrossRef]
  30. Yeganeh, A.; Ahmadi, F.; Wong, Y.J.; Shadman, A.; Barati, R.; Saeedi, R. Shallow vs. Deep Learning Models for Groundwater Level Prediction: A Multi-Piezometer Data Integration Approach. Water Air Soil. Pollut. 2024, 235, 441. [Google Scholar] [CrossRef]
  31. Zhao, L.; Farhi, N.; Valero, Y.; Christoforou, Z. Long short-time memory neural networks for human driving behavior modelling. Transp. Res. Procedia 2023, 72, 2589–2596. [Google Scholar] [CrossRef]
  32. Eswarsai. Exploring Different Types of LSTMs. Available online: https://medium.com/analytics-vidhya/exploring-different-types-of-lstms-6109bcb037c4 (accessed on 28 July 2024).
  33. Sun, Y.; Wang, X.; Tang, X. Deeply learned face representations are sparse, selective, and robust. In Proceedings of the IEEE Conference on Computer Vision and Pattern Recognition 2015, Boston, MA, USA, 7–12 June 2015; pp. 2892–2900. [Google Scholar]
  34. Vaswani, A.; Shazeer, N.; Parmar, N.; Uszkoreit, J.; Jones, L.; Gomez, A.N.; Kaiser, Ł.; Polosukhin, I. Attention is all you need. In Proceedings of the Advances in Neural Information Processing Systems 30, Long Beach, CA, USA, 4–9 December 2017; pp. 5998–6008. [Google Scholar]
  35. Panchenko, A.; Lanze, F.; Pennekamp, J.; Engel, T.; Zinnen, A.; Henze, M.; Wehrle, K. Website Fingerprinting at Internet Scale. In Proceedings of the NDSS 2016, San Diego, CA, USA, 21–24 February 2016. [Google Scholar]
  36. Chawla, N.V.; Bowyer, K.W.; Hall, L.O.; Kegelmeyer, W.P. SMOTE: Synthetic minority over-sampling technique. J. Artif. Intell. Res. 2002, 16, 321–357. [Google Scholar] [CrossRef]
  37. Wilson, D.L. Asymptotic properties of nearest neighbor rules using edited data. IEEE Trans. Syst. Man Cybern. 1972, 2, 408–421. [Google Scholar] [CrossRef]
  38. Batista, G.E.; Prati, R.C.; Monard, M.C. A study of the behavior of several methods for balancing machine learning training data. ACM SIGKDD Explor. Newsl. 2004, 6, 20–29. [Google Scholar] [CrossRef]
  39. Draper-Gil, G.; Lashkari, A.H.; Mamun, M.S.I.; Ghorbani, A.A. Characterization of encrypted and vpn traffic using time-related. In Proceedings of the 2nd International Conference on Information Systems Security and Privacy (ICISSP), Rome, Italy, 19–21 February 2016; pp. 407–414. [Google Scholar]
  40. Lashkari, A.H.; Gil, G.D.; Mamun, M.S.I.; Ghorbani, A.A. Characterization of tor traffic using time based features. In Proceedings of the International Conference on Information Systems Security and Privacy, Rome, Italy, 29–31 May 2017; pp. 253–262. [Google Scholar]
  41. Shapira, T.; Shavitt, Y. FlowPic: A generic representation for encrypted traffic classification and applications identification. IEEE Trans. Netw. Serv. Manag. 2021, 18, 1218–1232. [Google Scholar] [CrossRef]
  42. Hayes, J.; Danezis, G. k-fingerprinting: A robust scalable website fingerprinting technique. In Proceedings of the 25th USENIX Security Symposium (USENIX Security 16), Austin, TX, USA, 10–12 August 2016; pp. 1187–1203. [Google Scholar]
  43. Zaki, F.; Afifi, F.; Abd Razak, S.; Gani, A.; Anuar, N.B. GRAIN: Granular multi-label encrypted traffic classification using classifier chain. Comput. Netw. 2022, 213, 109084. [Google Scholar] [CrossRef]
  44. Shen, M.; Zhang, J.; Zhu, L.; Xu, K.; Du, X. Accurate decentralized application identification via encrypted traffic analysis using graph neural networks. IEEE Trans. Inf. Forensics Secur. 2021, 16, 2367–2380. [Google Scholar] [CrossRef]
  45. Sun, P.; Li, S.; Xie, J.; Xu, H.; Cheng, Z.; Yang, R. GPMT: Generating practical malicious traffic based on adversarial attacks with little prior knowledge. Comput. Secur. 2023, 130, 103257. [Google Scholar] [CrossRef]
  46. Yu, S.; Zhao, G.; Dou, W.; James, S. Predicted packet padding for anonymous web browsing against traffic analysis attacks. IEEE Trans. Inf. Forensics Secur. 2012, 7, 1381–1393. [Google Scholar] [CrossRef]
Figure 1. Geometric interpretation of two-dimensional path.
Electronics 13 03060 g001
Figure 2. LSTM model architecture.
Electronics 13 03060 g002
Figure 3. The overall framework of our approach.
Electronics 13 03060 g003
Figure 4. Multi-scale accumulation feature extraction method.
Electronics 13 03060 g004
Figure 5. The example of SMOTE and ENN.
Electronics 13 03060 g005
Figure 6. The number of samples.
Electronics 13 03060 g006
Figure 7. Effect of packet length and dimension (accuracy).
Electronics 13 03060 g007
Figure 8. Results of ablation studies.
Electronics 13 03060 g008
Table 1. Examples of seven different traffic paths.
X 5 l , c , s , l , c , s , t
LCS L C S T
194194019419400
−830−83111194−832
−320−3279194−1155
53530132247−1158
86860218333−11510
Table 2. Data shape changes at each processing stage.
StageDescriptionShape
Raw DataCapture encrypted traffic sequence__
Build Traffic PathsExtract packet length and arrival time(24, 2)
Path SplittingSplit the length sequence into two paths(24, 4)
Path AccumulationAccumulate three-length sequences(24, 7)
Extracting Path
Signature
Use path signature feature function to extract path signature features(24, 56)
LSTM InputUse path signature features as input to LSTM(1, 24, 56)
LSTM Hidden Units64 hidden units of LSTM layer process input sequence, returning hidden states for all time steps(1, 24, 64)
Final Hidden StateSelect the hidden state of the last time step in the LSTM model and input the fully connected layer(1, 64)
Fully Connected Layer OutputThe fully connected layer outputs the probability distribution of the classification result(1, 6)
Table 3. Dataset details.
ServiceApplicationDescription
ChatAIM, ICQ, Skype, Facebook, HangoutsTraffic generated during online chat
communication
EmailEmail, GmailTraffic generated during email
transmission
File transferSkype SFTP, FTPS, SCPTraffic generated during file uploads and downloads
StreamingVimeo, YouTube, Netflix, SpotifyTraffic generated when using streaming applications
P2PuTorrent, BitTorrentTraffic generated when sharing torrent
resources using P2P programs
VoIPFacebook, Skype, Hangouts, VoipBusterTraffic generated during online voice calls
Table 4. Classification accuracy under different learning rates.
Learning Rate0.10.010.0010.00010.00001
Accuracy0.85960.89180.91520.94740.9298
Table 5. Classification accuracy under different regularization parameters.
Regularization Parameters0.010.0010.00010.000050.00001
Accuracy0.80990.90060.94740.9210.9152
Table 6. Classification performance of different methods for ISCX VPN-nonVPN dataset.
DatasetISCX-VPNISCX-nonVPN
MethodAccuracyPrecisionRecallF1-ScoreAccuracyPrecisionRecallF1-Score
FlowPrint [17]0.85380.74510.79170.75660.69440.70730.73100.7131
AppScanner [9]0.88890.86790.88510.87220.75760.75940.74650.7486
CUMUL [35]0.76610.75310.78520.76440.61870.59410.59710.5897
K-FP [42]0.87130.87500.87480.87470.75510.74780.73540.7387
GRAIN [44]0.81290.80770.81090.80270.66670.65320.66640.6567
ETC-PS [12]0.88890.88030.89370.88510.72730.74140.71330.7208
FS-net [20]0.92980.92630.92110.92340.76260.76850.75340.7355
DF [19]0.80120.77990.81520.79210.67420.68570.67170.6701
MT-FlowFormer [23]0.93270.91520.92430.91930.85490.84730.82680.8344
GraphDApp [44]0.64910.56680.61030.57400.44950.42300.36470.3614
ET-BERT (flow) [16]0.95320.94360.95070.94630.91670.92450.92290.9235
Proposed0.94740.94800.94740.94720.90530.90640.90530.9050
Table 7. Classification performance of different methods for ISCX Tor-nonTor dataset.
DatasetISCX-TorISCX-nonTor
MethodAccuracyPrecisionRecallF1-ScoreAccuracyPrecisionRecallF1-Score
FlowPrint [17]0.24000.03000.12500.04840.52430.75900.60740.6153
AppScanner [9]0.75430.66290.60420.61630.91530.84350.8140.8273
CUMUL [35]0.66860.53490.48990.49970.86050.81430.73930.7627
K-FP [42]0.77710.74170.62090.63130.87410.86530.77920.8167
GRAIN [44]0.69140.52530.53460.52340.78950.67140.66150.6613
ETC-PS [12]0.74860.68110.59290.60330.91550.87100.83110.8486
FS-net [20]0.82860.74870.71970.72420.92780.83680.82540.8285
DF [19]0.65140.48030.47670.47190.85680.80030.74150.7590
MT-FlowFormer [23]0.87500.82520.82170.82200.89410.87420.86510.8670
GraphDApp [44]0.42860.25570.25090.22810.69360.54470.53980.5352
ET-BERT(flow) [16]0.95430.92420.96060.93970.90290.85600.82170.8332
Proposed0.93860.94000.93860.93850.95030.95100.95030.9502
Table 8. The complexity of different methods.
MethodParams (M)FLOPs (G)Inference Time (ms)Latency Time (ms)
FS-net [20]2.1724.8639.9445.72
DF [19]1.833.0629.5733.56
MT-FlowFormer [23]0.261.0757.7963.08
GraphDApp [44]0.220.5978.4384.72
ET-BERT (flow) [16]85.7010.87104.04110.94
Proposed0.037.32 × 10−44.025.56
Table 9. The p-values comparing our method with fingerprint construction and statistical methods.
MethodFlowPrint [17]AppScanner [9]CUMUL [35]K-FP [42]GRAIN [44]ETC-PS [12]
p-value0.0069560.0362670.0001860.0054470.0001040.041655
Table 10. The p-values comparing our method with deep learning models.
MethodFS-Net [20]DF [19]MT-FlowFormer [23]GraphDApp [44]ET-BERT (Flow) [16]
p-value0.0157640.0001830.0163510.0003220.167007
Disclaimer/Publisher’s Note: The statements, opinions and data contained in all publications are solely those of the individual author(s) and contributor(s) and not of MDPI and/or the editor(s). MDPI and/or the editor(s) disclaim responsibility for any injury to people or property resulting from any ideas, methods, instructions or products referred to in the content.

