Article

Design a Robust Control System for Rubidium Fountain Clock

1
National Time Service Center, Chinese Academy of Sciences, Xi′an 710600, China
2
Key Laboratory of Time Reference and Applications, Chinese Academy of Sciences, Xi’an 710600, China
3
University of Chinese Academy of Sciences, Beijing 100039, China
*
Authors to whom correspondence should be addressed.
Electronics 2024, 13(16), 3133; https://doi.org/10.3390/electronics13163133
Submission received: 22 July 2024 / Revised: 1 August 2024 / Accepted: 1 August 2024 / Published: 7 August 2024
(This article belongs to the Special Issue Design and Control of Drives and Electrical Machines)

Abstract

:
Rubidium fountain clocks are operated by a control system. In this study, first, the control requirements of a rubidium fountain clock are analyzed; then, a control system is designed and divided into a timing sequence control system, a data acquisition system, and a servo control system. Multiple boards based on PCI extensions for the instrumentation (PXI) bus and Labwindows/CVI software 2019 are adopted. The timing sequence control system outputs 16 transistor–transistor logic (TTL) signals and three arbitrary waveforms. The results show that these signals are synchronized within 380 ns. Moreover, the digital locking frequency of the master laser is triggered by one of the timing signal, sweeping the laser frequency in a wide range during polarization gradient cooling. Two time-of-flight signals are acquired, and Ramsey fringes are scanned using the data acquisition system. An error signal is obtained every two cycles, and it is feed back to the frequency synthesizer and a high resolution offset generator using the servo control system. Then the frequency synthesizer is locked to the Ramsey center resonance. The rubidium atomic fountain clock exhibited a frequency stability of 7.4 × 10⁻¹⁶ at 86,400 s. Moreover, the phase of the Rb fountain clock is compared with that of UTC (NTSC) in real time, demonstrating a frequency drift of 0.00044 ns/day/day. The whole control system is full-featured, robust and flexible, thus satisfying the requirements of rubidium fountain clocks.

1. Introduction

At present, the fountain clocks developed in the world’s main laboratories are divided into cesium atomic fountain clocks and rubidium atomic fountain clocks [1,2,3,4,5,6]. Due to them having a small collision shift and almost the lowest frequency drift, rubidium atomic fountains have received the maximum weight in the generation of international atomic time (TAI) [3,4]. Rubidium atomic fountain clocks are used as time-keeping clocks, and they can run continuously over very long periods, similar to commercial caesium- beam clocks and hydrogen masers, generating time and frequency signals in real time.
Rubidium atomic fountain clocks work in a pulsed mode. Each cycle includes several stages: atoms capture, launch, polarization gradient cooling (PGC), state selection, Ramsey interactions and detection. Finally, a local oscillator (LO) is locked to the Ramsey center resonance of the rubidium atomic fountain clock. Cycles are repeated indefinitely. In each cycle, the control system must precisely control more than a dozen switches or components in the light and magnetic fields.
Virtual instrument technology realizes the control and analysis of various hardware instruments in the laboratory through the front panel of graphical software and hardware boards, and it allows for more flexible and convenient operation. It has also been widely used in the atomic physics experiments [7,8,9,10]. The National Institute of Metrology developed a control system for the cesium and rubidium fountain clocks using Labview software and NI hardware [11,12,13]. The Shanghai Institute of Optics and Fine Mechanics, Chinese Academy of Science developed the control system with Labview software for the Rb fountain clocks that are used as transportable clocks, and don’t need to run continuously [14,15]. Because each clock has a different design, the control system requirements also differ. There have been few detailed studies of the control system for atomic fountain clocks. Reference [16] describes an electronic control System for a cesium fountain clock without data acquisition and servo control functions. Reference [17] presents a control system for a fountain clock and shows that the signal synchronization and control accuracy of the control system can reach a μs magnitude.
The rubidium atomic fountain clock developed by the National Time Service Center (NTSC) is required to generate a 5 MHz/1-pulse per Second (PPS) signal and running for long periods. In this paper, a robust control system based on PXI boards and LabWindows/CVI software is presented, including timing control, data acquisition and servo control systems. The timing control system with delay and pulse width accuracy in the order of μs is realized to complete atoms capture, launch, microwave interaction and laser frequency sweeping. In order to cooling the temperature of the atoms to the order of μK, a sweeping range of 150 MHz to a laser frequency of less than 1 ms is satisfied [18]. The closed-loop locking of the rubidium atomic fountain clock is realized, and its 5 MHz/1 PPS signal is output in real time. Section 2 describes the operation principle of a rubidium atomic fountain clock. Section 3 presents the hardware and software of the control system. The results are presented in Section 4.

2. Operation Principle of a Rb Fountain Clock

A rubidium fountain clock is usually composed of four systems: a physical system, an optical system, a microwave system and a control system. The setup of the NTSC-Rb1 rubidium atomic fountain clock has been described elsewhere [19]. A photograph of NTSC-Rb1 is shown in Figure 1.
The operation of NTSC-Rb1 is realized by the control system controlling the other three systems. Firstly, the cooling laser is locked onto the |52S1/2, F = 2>→|52P3/2, F = 3> of the saturated absorption spectroscopy (SAS) of the 87Rb D2 line with self-developing software. The magnetic shutter is opened by a TTL signal, and the 87Rb atoms that emerge from the vapor chamber are cooled and captured by means of magneto-optical trap (MOT). Then, the frequencies of three upward beams and three downward beams are detuned to v − ∆v and v + ∆v respectively by two TTL signals, and the launch is achieved by moving optical molasses. In the PGC stage, the piezoelectric transducers (PZT) voltage of the laser is directly controlled within ms by an analog signal to increase the laser frequency detuning, and the power is reduced by the voltage controlled attenuator, so that the temperature of the atoms is cooled to the order of μK. At this stage, the atoms are distributed almost equally across the five Zeeman sub-levels of the |52S1/2, F = 2> state. When the atoms reach the state selection cavity, the microwave of the state selection is opened, then the transition of |52S1/2, F = 2, mF = 0→|52S1/2, F = 1, mF = 0> is excited, and the push light is turned on with a delay of 35 ms to push off the atoms remaining in |52S1/2, F = 2, mF ≠ 0>. The atoms in |52S1/2, F = 1, mF = 0> continues to fly through the same microwave cavity once up and once down, interacting with the same microwave field to complete the Ramsey transition. All lasers are turned off during the Ramsey excitation. Before the atoms fall to the detection region, the detection light and repumping light are turned on by TTL signals with a laser shutter, and the fluorescence signals are collected by the fluorescence collector in the detection region. The fluorescence collector integrates a photodetector and a low-noise photo amplifier to convert the fluorescence signal into a voltage signal. Time-of-fight (TOF) signals in the F = 2 state and F = 1 states are detected using the detection of the populations of the double levels [20]. The computer collects the TOF signals and calculates the respective atomic numbers N1 and N2. By calculating the transition probability P = N2/(N2 + N1) on both sides of the Ramsey central fringe, the frequency difference between the interrogation signal and the atomic transition is obtained, which is fed back to the DDS of the synthesizer and high-resolution offset generator (HROG) in order to lock the frequency of the local oscillator to the atomic central transition frequency, the time and frequency signal of the NTSC-Rb1 are output by the HROG in real time.
According to the operation of the NTSC-Rb1, the control signals are divided into four types: counter output (CO), analog output (AO), analog acquisition (AI) and RS232 output signals. Figure 2 shows the timing sequence of the rubidium atomic fountain clock. CO signals are used to open/close the laser shutters and magnetic field shutters and to generate trigger signals in order to initiate the other generations. The frequency of the laser is changed via acousto-optic modulators (AOMs) drivers. The three downward cooling lasers, detection laser, and state-selection pushing laser share a same AOM. Their frequencies are switched by CO signals that controlling the AOM-driver with microwave shutters in different phases during a sequence. The power of the 3D-MOT cooling light is controlled by the AO signals, which are attenuated linearly within a few hundred microseconds during the PGC phase. The AI signals are used for acquire TOF signals in F = 1 and F = 2 states. The software sends command to DDS and HROG via 2 Rs232 ports at a specified time. The resolutions of the pulse width and delay of the AO and CO signals are required to be in the order of hundreds of μs. The minimum time interval between the output changes is 1 μs. The demand for synchronization accuracy is less than 1 μs. The accuracy of the pulse width realized by PC software is unstable due to the influence of the operating system, so hardware control with precise timing is desirable. Table 1 presents an overview of the design specifications.

3. Control System

A diagram of the control system is shown in Figure 3, including the timing sequence control system, the data acquisition system and the servo control system. The timing sequence control system generates CO and AO signals to control the physical system and laser system. The data acquisition system is used to collect the TOF signals triggered by the timing sequence control system. The servo control system modulates the microwave frequency synthesizer to obtain an error signal. Then, the error signal processed by the Proportional Integral Derivative (PID) algorithm is steered to the frequency synthesizer and HROG to realize locking. The standard 5-MHz/1-PPS signals of the NTSC-Rb1 are generated by the HROG.

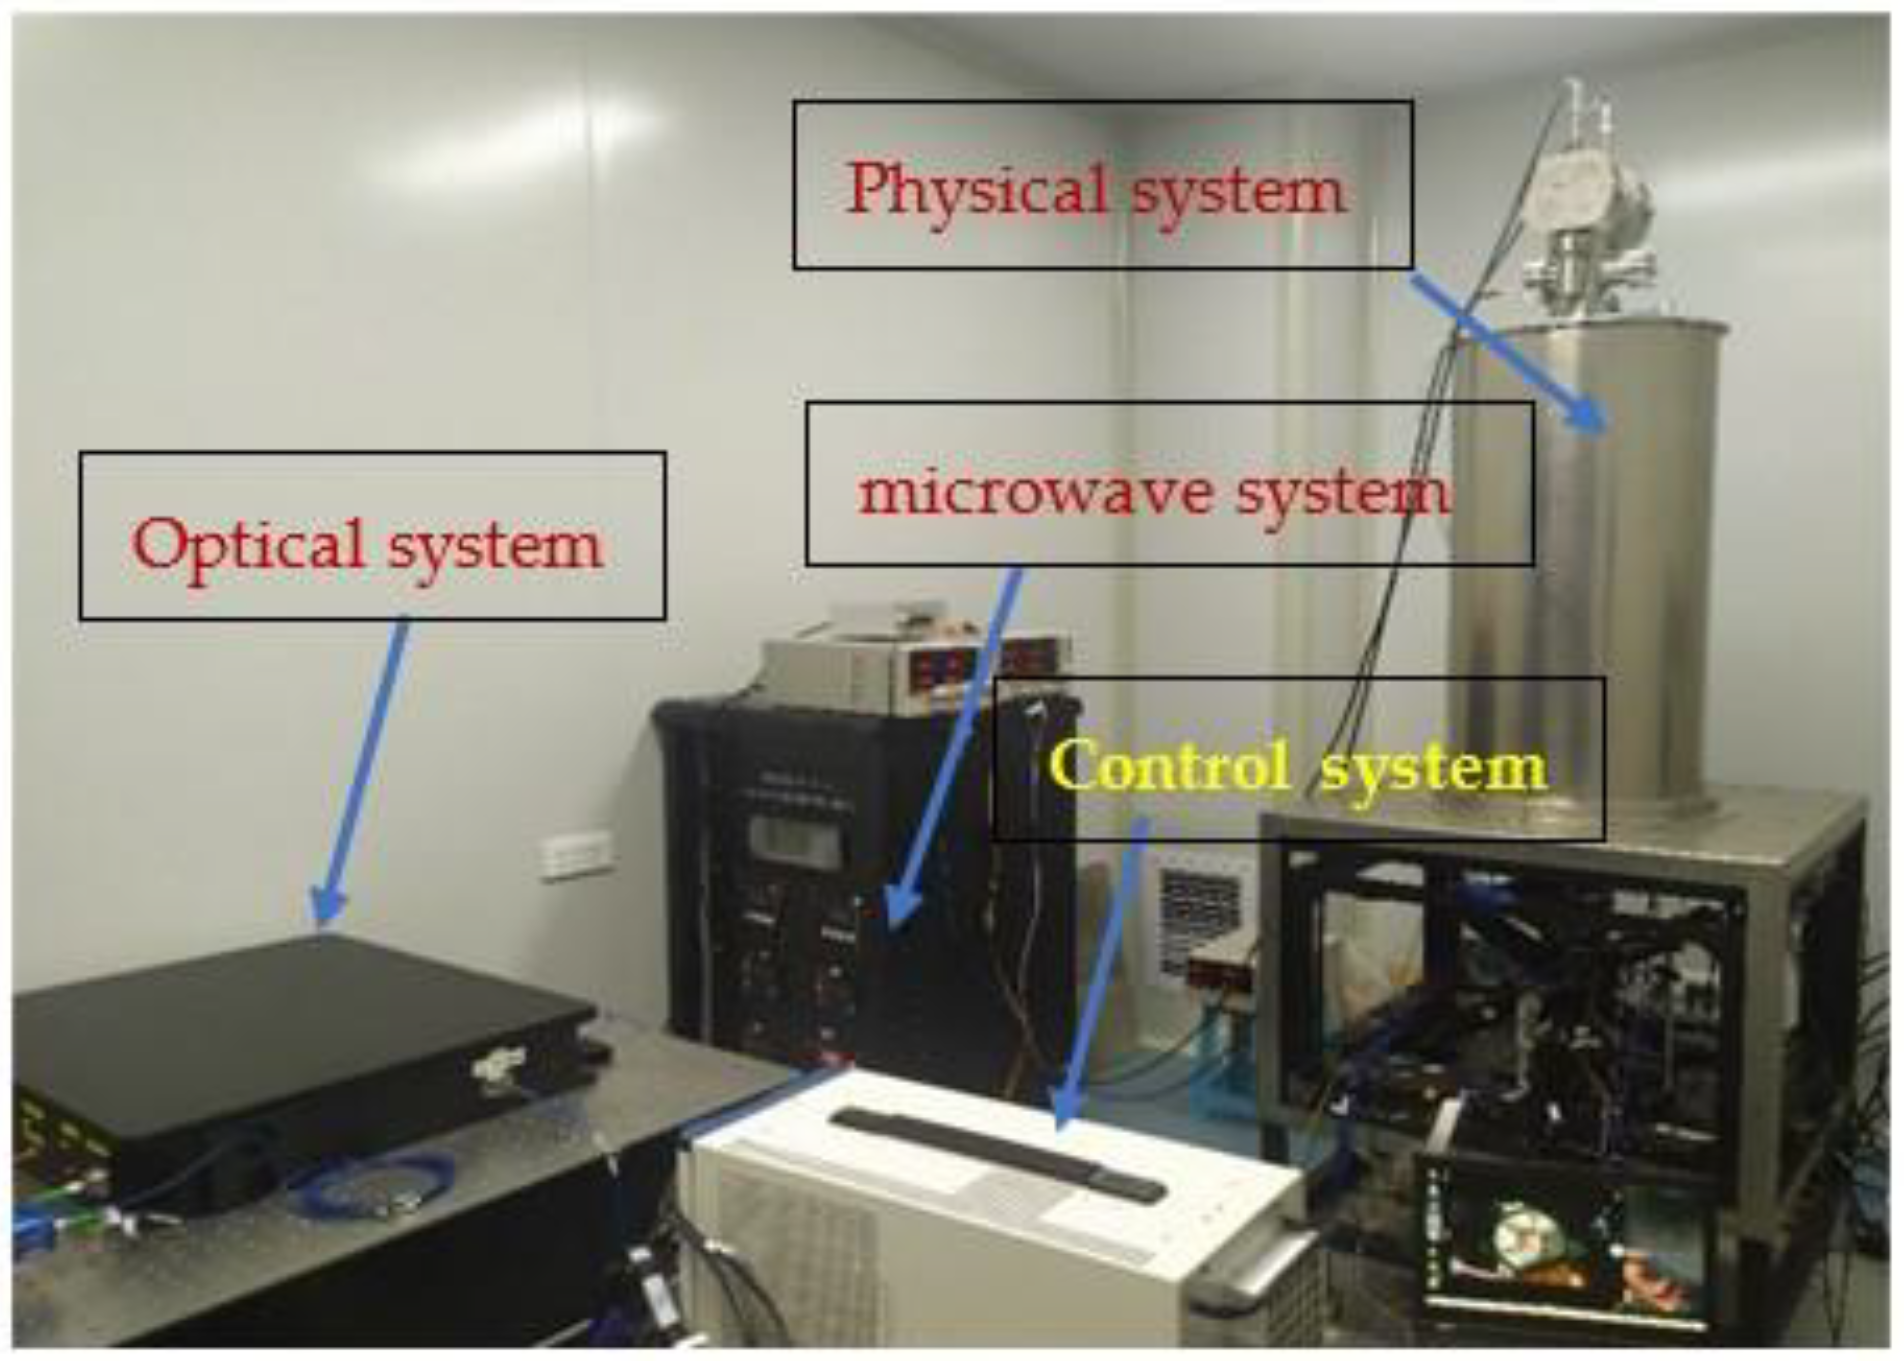
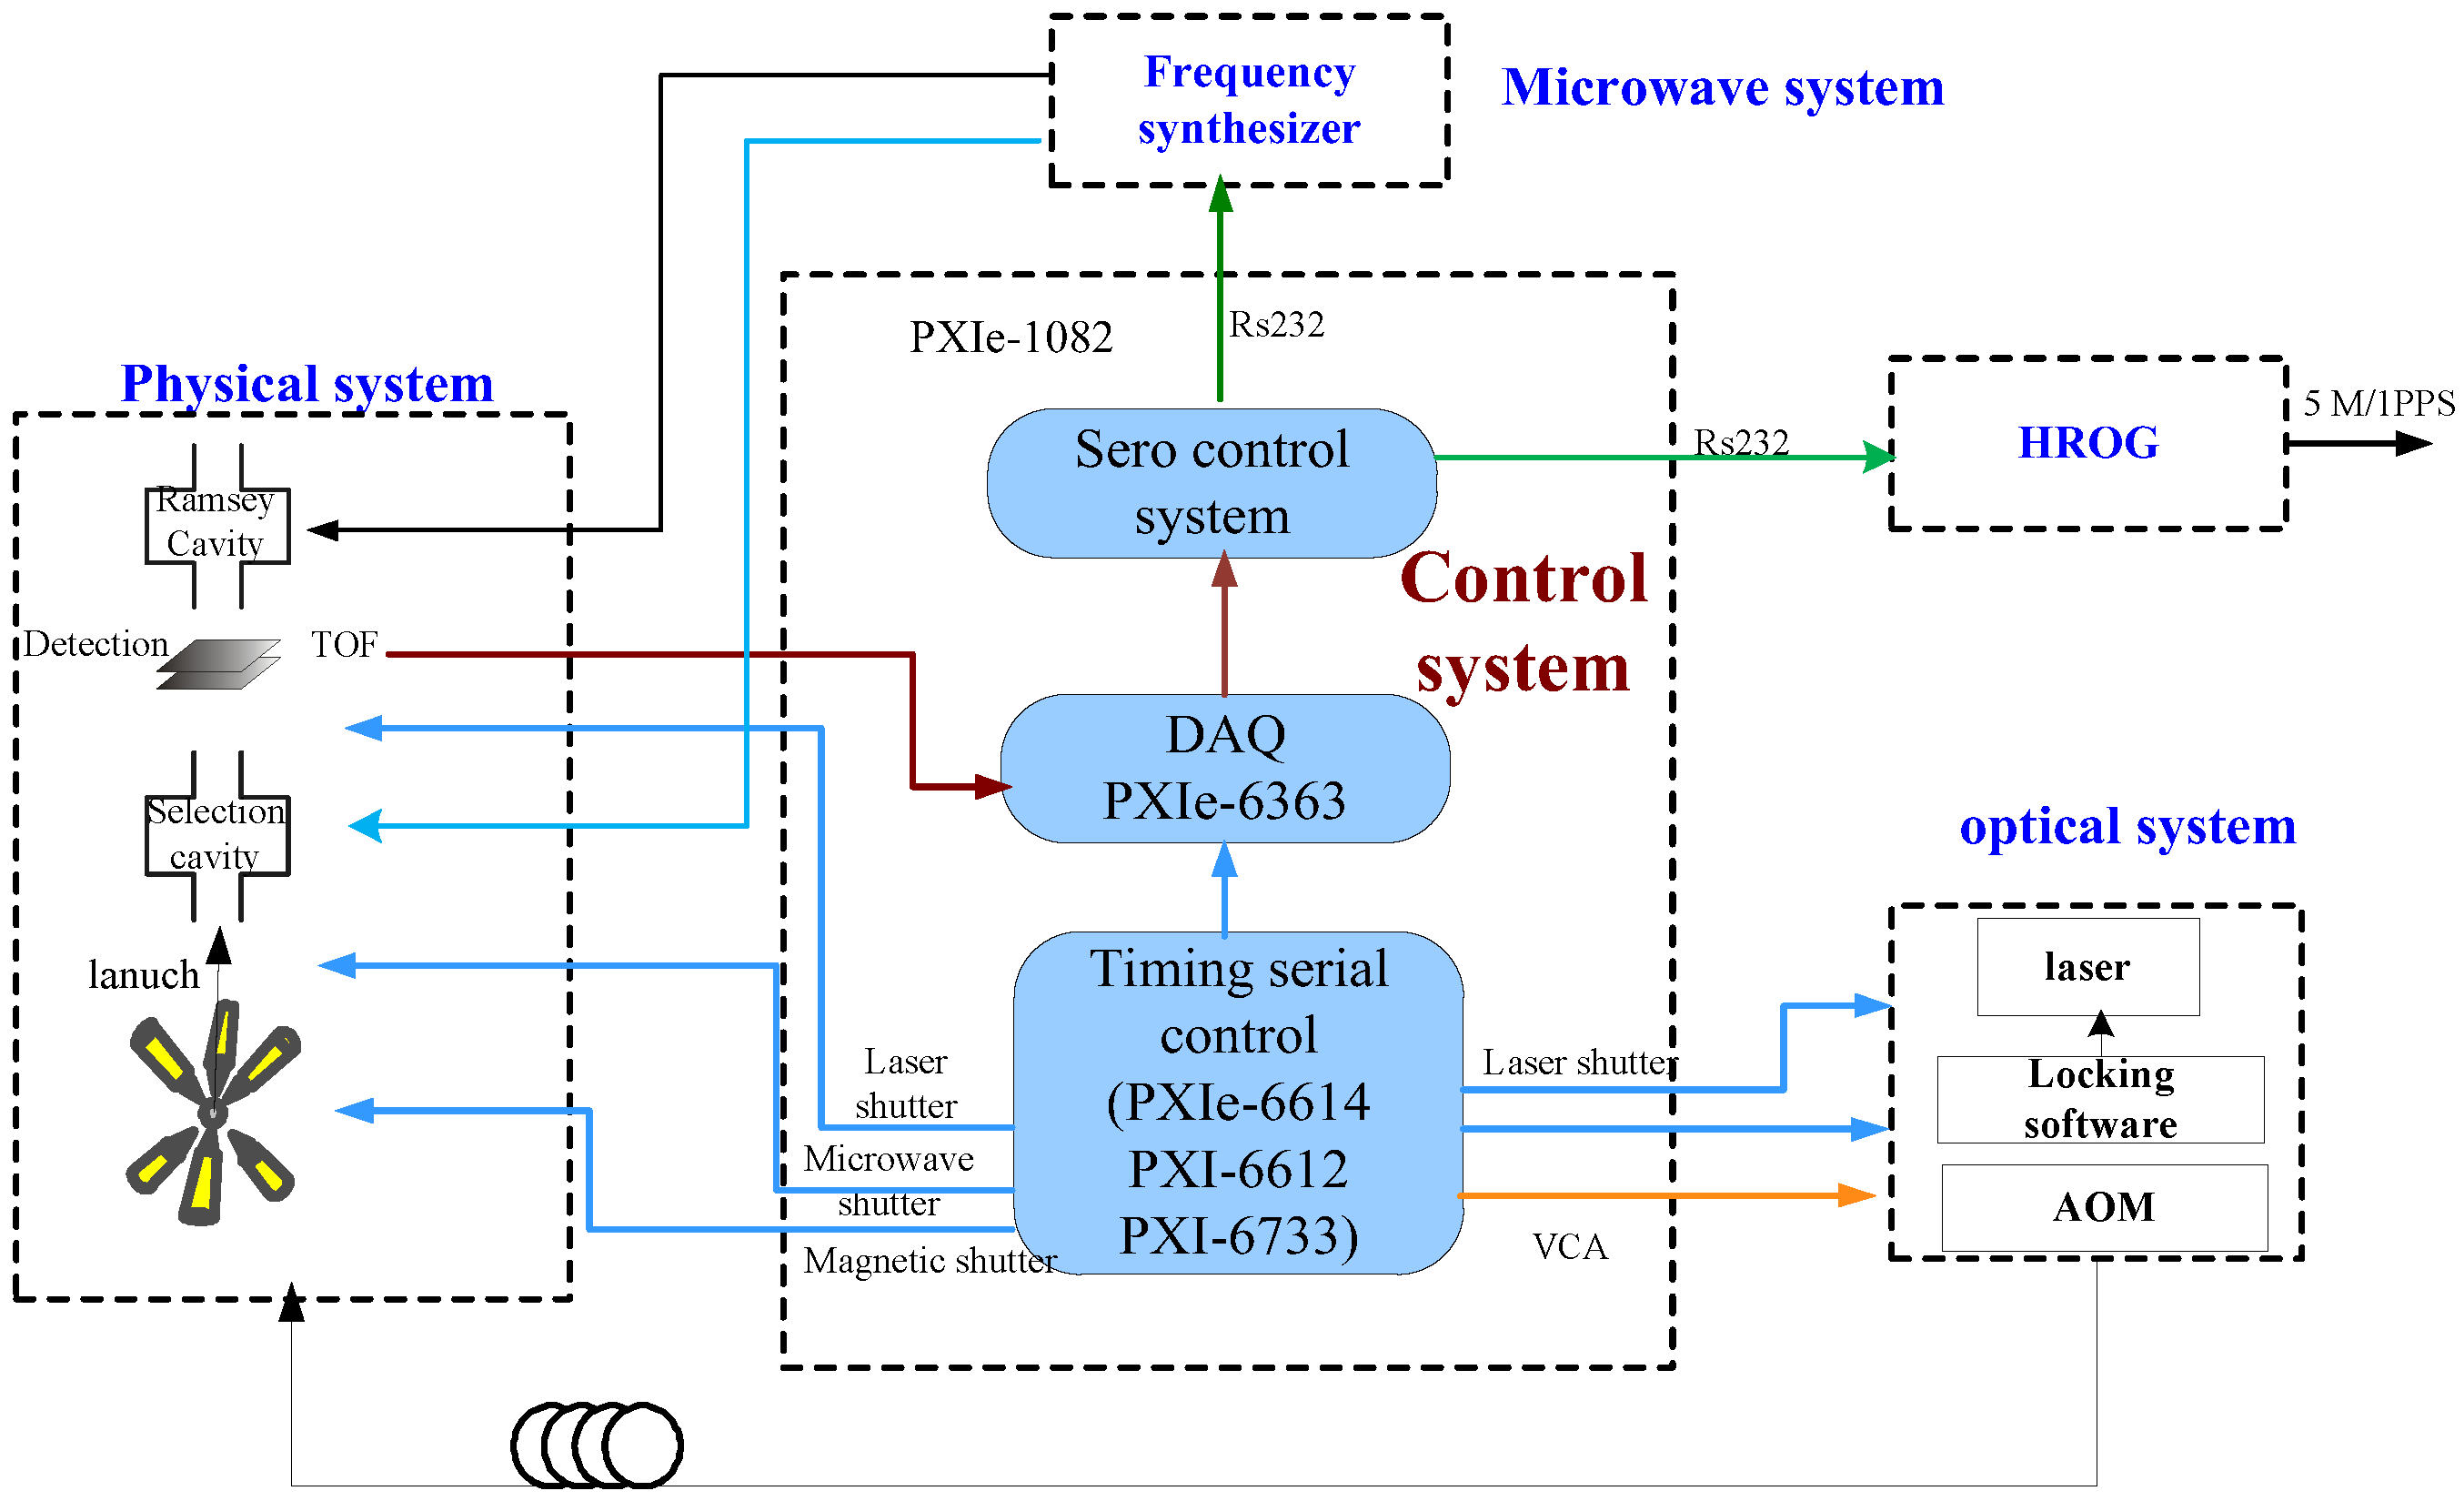
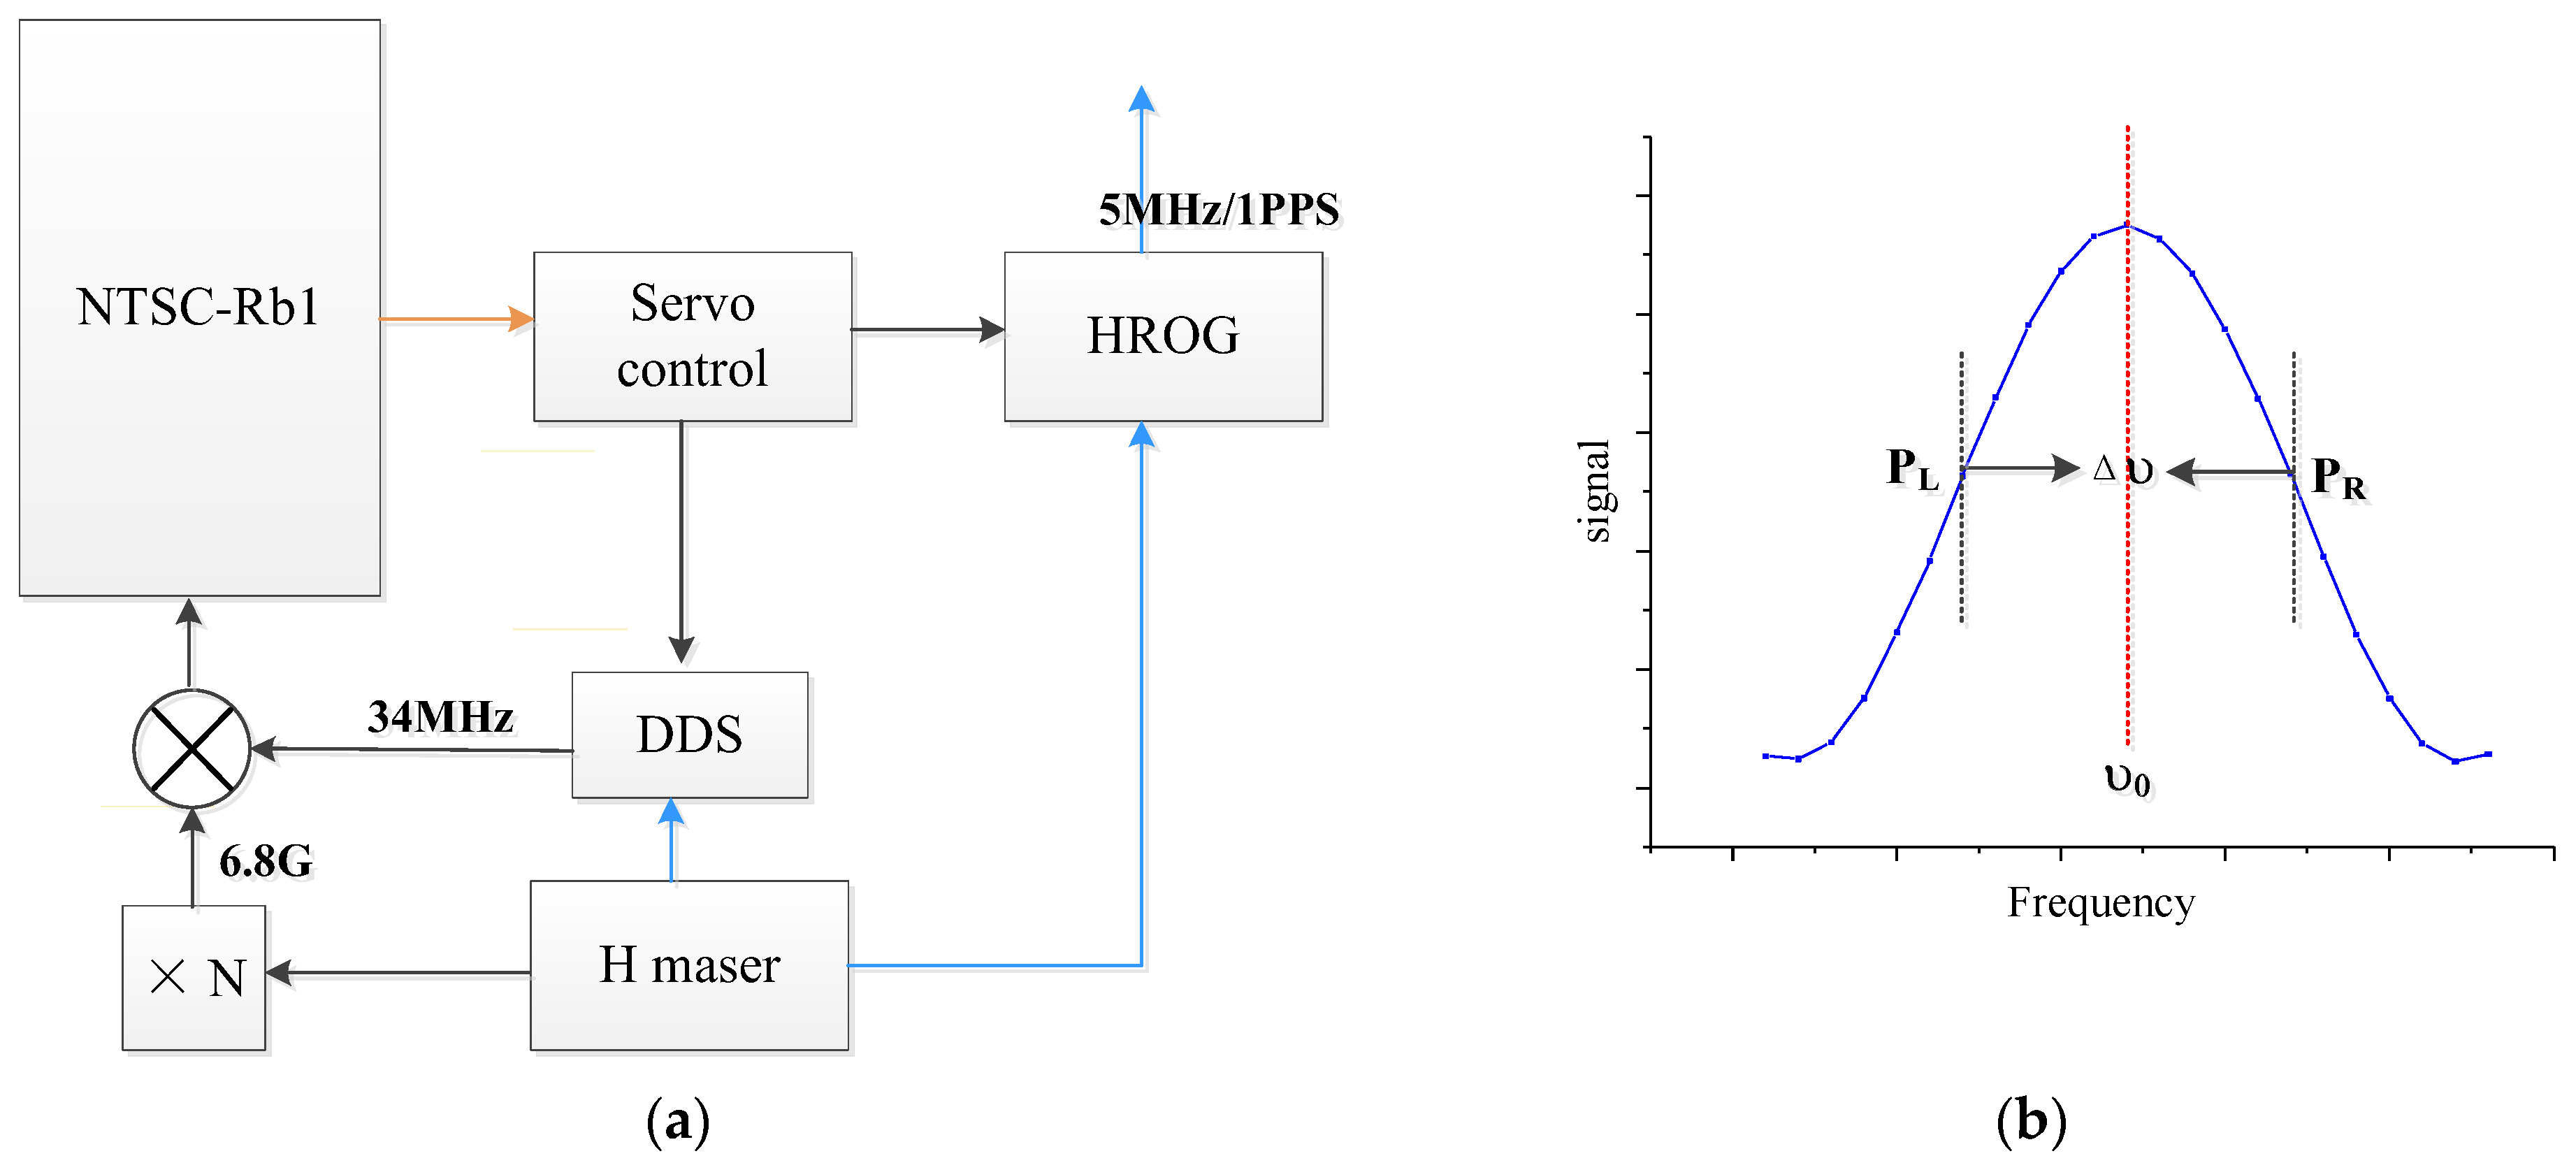
3.1. Control System Hardware

The NI PXIe-1082 chassis and four boards, namely, PXIe-6614, PXIe-6612, PXI-6733, PXIe-6363, which are inserted into the peripheral slots, are adopted in the experiment. PXIe-6614, PXIe-6612 and PXI-6733 output a total of 19 signals to complete the corresponding timing sequence. A multi-function acquisition card PXIe-6363 is used to acquire TOF signals, and a serial card is used to control the DDS and HROG. PXIe-6614 and PXIe-6612 are timing and digital I/O devices that can output 8 TTL signals respectively, and their clock frequencies can reach up to 80 MHz. PXIe-6614 supports buffering technology, and the counter channel can output multiple TTL signals in one cycle. The PXI-6733 board has 8 analog output channels with a 14 bit resolution. In the experiment, CO signals are output by PXIe-6614 and PXIe-6612. AO signals are generated through PXI-6733. The PXIe-6363 includes 16 differential analog acquisition channels with a 16-bit resolution and a 2 MS/s single-channel acquisition rate [21].

3.2. Control Software

The control software is written in Labwindows/CVI, which is a text-based language and requires less time than Labview when running the same program.

3.2.1. Timing Control System

The timing control system outputs 16 TTL signals and 3 AO waveforms. The TTL parameters and analog output parameters can be set and modified on the front panel of the software. The parameters of the TTL signal include the counter channel’s name, clock source, trigger source, initial state, delay and high level time, etc., which can be modified through the function “DAQmxCreateCOPulseChanTicks”. The detailed output functions of each channel are as follows:
TTL1 controls the magnetic field shutter.
TTL2 triggers launching and the other multiple signals.
TTL3 triggers the cooling laser frequency locking program to start acquisition.
TTL4–TTL6 control the microwave shutter to switch the frequencies of the three upward laser beams.
TTL7 and TTL9 control another microwave shutter for switch the frequencies of the three downward laser beams.
TTL10 and TTL11 control the two cooling light shutter of the three upward and three downward beams.
TTL12: controls the shutter of the 3D-MOT repumping light.
TTL13 controls the output of the state-selection microwave. The microwave in the state-selection cavity is activated for 40 ms, and then the frequency deviates by 40 MHz when the atoms leave the state-selection cavity.
TTL14 controls the shutter of the state-selection push light.
TTL15 controls the shutter of the repumping light.
TTL16 controls the shutter of the probe light.
AO1 sweeps the frequency of the maser laser in the PGC phase. The locking and sweeping frequency is applied to the laser directly. The sum of the voltage AO1 and the other locking voltage is output to the PZT of the laser. During the atom capture stage, the output of AO1 is 0 V, and the output voltage after the adder is the frequency locking voltage value ν. In order to maintain locking when the sweeping frequency has a large range, sweeping is trigged at the right time to avoid unlocking. When AO1 is scanned from 0 V to the ∆ν during the PGC, locking is finished, and the voltage after the adder is scanned from the current locking voltage ν to ν + ∆ν, then, it recovers to ν. Thus, wide range frequency scanning during the polarization gradient cooling stage in every cycle does not affect unlocking of the laser frequency.
For AO2 and AO3, the voltage controlled attenuator ZX73-2500+ is used to control the laser power attenuation according to the specified waveform. Two voltage-controlled attenuators placed behind AOM with frequency of 80 MHz+ and 80 MHz− are used to control the power of the three upward and downward lasers. The sampling clock source and output update rate are set through the function “DAQmxCfgSampClkTiming”, and the multi-channel waveform data of a cycle are stored in an array according to the waveform time and update rate, which are written into the output buffer. The output mode is continuous, and each piece of data stored in the buffer is output in sequence when the trigger signal arrives. These channels share the same reference clock to ensure that the output is synchronized.
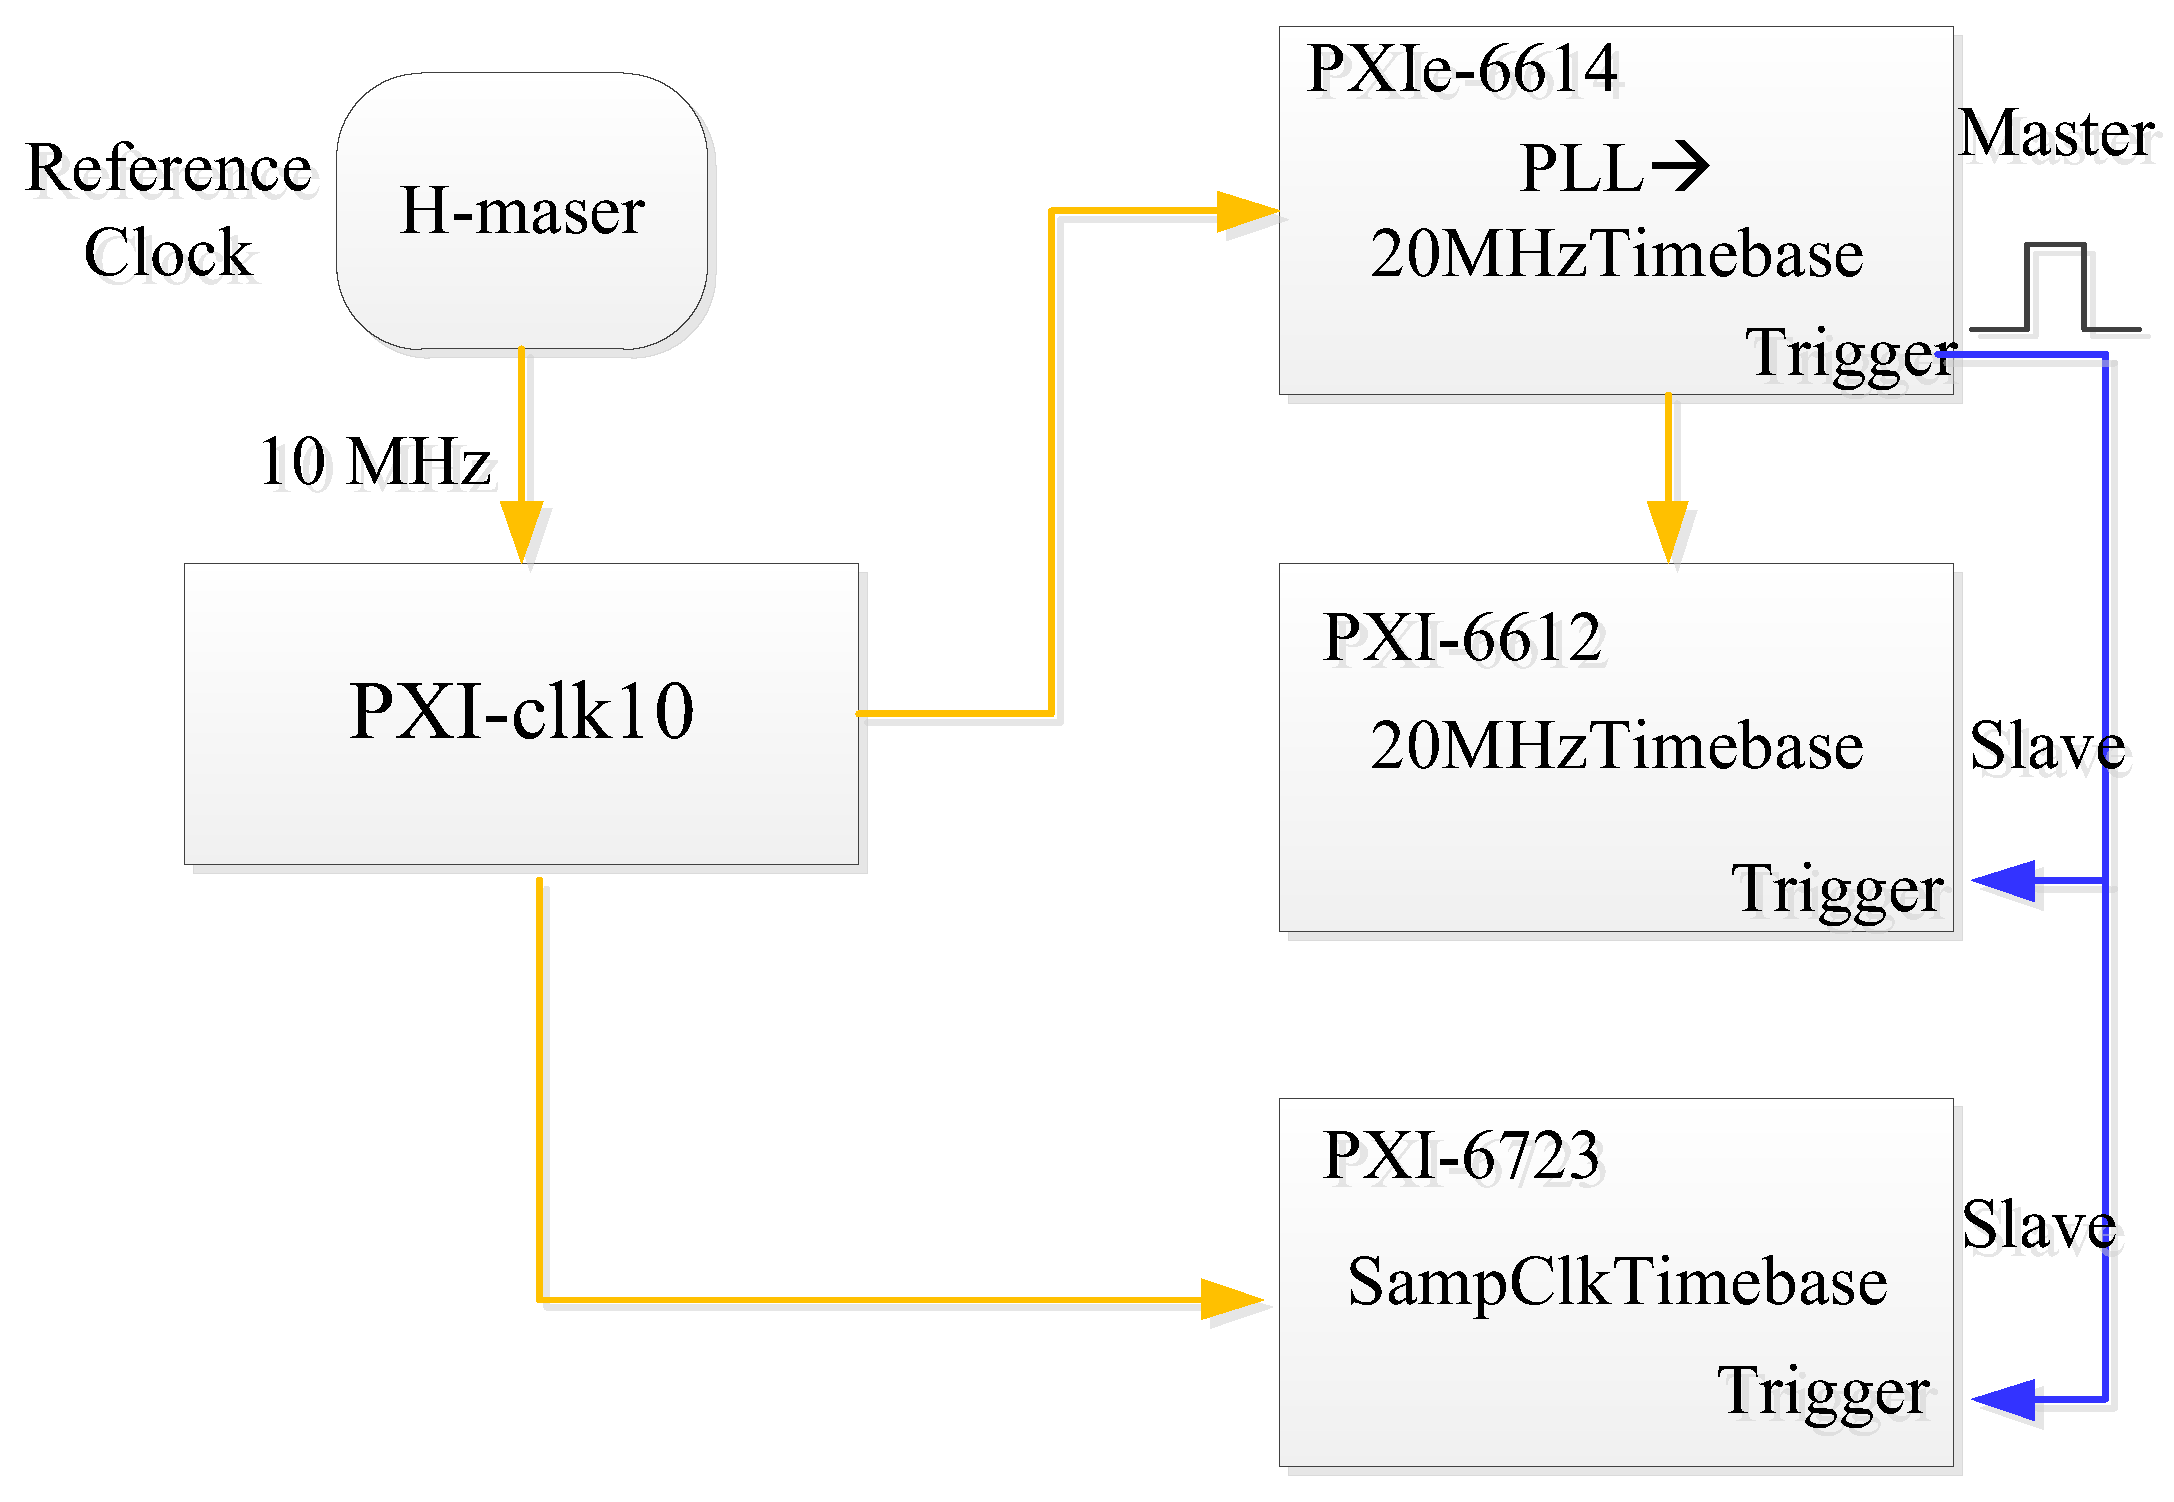
  • Timing synchronization
As each physical parameter proceeds under hardware-timed control. high precision synchronization is required between multiple devices. There is high synchronization on a single device, but the synchronization error is observed between multi-devices. Each device has its own dependent internal clock. If multiple devices generate signals directly, the synchronization accuracy requirements cannot be satisfied, which indicates that the delay of the two signals is not a fixed value. The deviation from the initial value becomes increasingly with a longer running time, resulting in the TOF signal amplitude becoming smaller and affecting the normal operation of the fountain clock. The timing control system outputs two types of signals, namely, timer output (CO) and analog output (AO) signals, which involve multi-device and multi-function synchronization. The basic components of synchronization are a clock and a trigger. The clock provides the timing for sampling or generating multiple signals, and the trigger provides the start point for synchronizing the signals. Both the master and slave devices use the clock source of the master device or the master and slave devices share the same reference clock source and the same trigger signal [21]. For more accurate synchronization, all devices use an external reference clock supplied by a dedicated high-precision clock source. A synchronization block diagram is shown in Figure 4, PXIe-6614 is designated as the master device; PXIe-6612 and PXI-6733 are designated as the slave devices. The 10 MHz signal of the hydrogen clock is connected to the “PXI_CLK10 IN” port on the rear panel of the PXI chassis. When the external clock is lost, the backplane of the PXI chassis will automatically switches back to the internal clock until the external clock is restored. The 20 MHz clock signal of PXIe-6614 is adopted as the timebase source of all counter output channels. As the default, the 20 MHz signal of PXIe-6614 comes from the internal clock, and the reference clock source and reference clock rate need to be configured to ensure that the internal 20 MHz clock is phase locked to the external 10 MHz clock. The DAQmxSetCOCtrTimebaseSrc function is used to set the clock source of each counter channel. The DAQmxSetCOCtrTimebaseRate function can be used to set the timebase rate to 20 MHz [20]. The analog output card PXI-6733 uses the DAQmxSetTimingAttribute function to set the sampling clock time base source (DAQmx_SampClk_Timebase_Src) to PXI_Clk10 and the sampling clock time base rate to 10 MHz. The output signal from one counter of PXIe-6614 is used as the trigger signal of the whole sequence and is routed to the trigger line of the PXI chassis to trigger the other two slave devices. The task of the slave is started first, but it has to wait to receive a trigger signal from the master start trigger, then, the master device task is started.
Synchronization is measured on three devices, namely, PXIe-6614, PXIe-6612 and PXI-6733, which are programmed to generate a square waveform with the same frequency respectively, and the output mode is continuous. Figure 5 shows the three signals acquired by the oscilloscope. The black box represents one CO signal output by PXIe-6614, the green dot represents one CO signal output by PXIe-6612, and the blue triangle represents one AO signal output by PXI-6733. The three signals are output simultaneously, The delay between these three outputs are 0 in theory, Practically, the delay between two CO outputs (PXIe-6614 and PXIe-6612) is 96 ns, as shown in Figure 4. The delay between CO and AO (PXIe-6614 and PXI-6733) is 380 ns during a sequence, and this delay stays stable throughout the whole running period. The maximum delay value is adopted for synchronization accuracy.

3.2.2. Data Acquisition System

The data acquisition system acquires two TOF signals for further calculation after achieving the timing control system, which can also be seen on the oscilloscope. The PXI-6358 device is adopted in the experiment. The acquisition mode is configured to retrigger acquisition, which collects a certain length of data after a trigger signal is received, and then stops to waiting for the next trigger signal. The atom number and transition probability are calculated according to the TOF signals [22]. The trigger signal is a TTL signal. The sample rate is 10 ks/s, and a total of 60 ms of data is collected. Figure 6 shows the TOF signals of F = 1 and F = 2 respectively. The integration of each curve represents the number of detected atoms. The DC bias of the two TOF signals is different, and it should be subtracted respectively when calculating the atom number [22]. To avoid the light frequency shift, the detection light is turned on 10 ms before the TOF signals arrive, and the bias time is only 20 ms to the right of the TOF.

3.2.3. Servo Control System
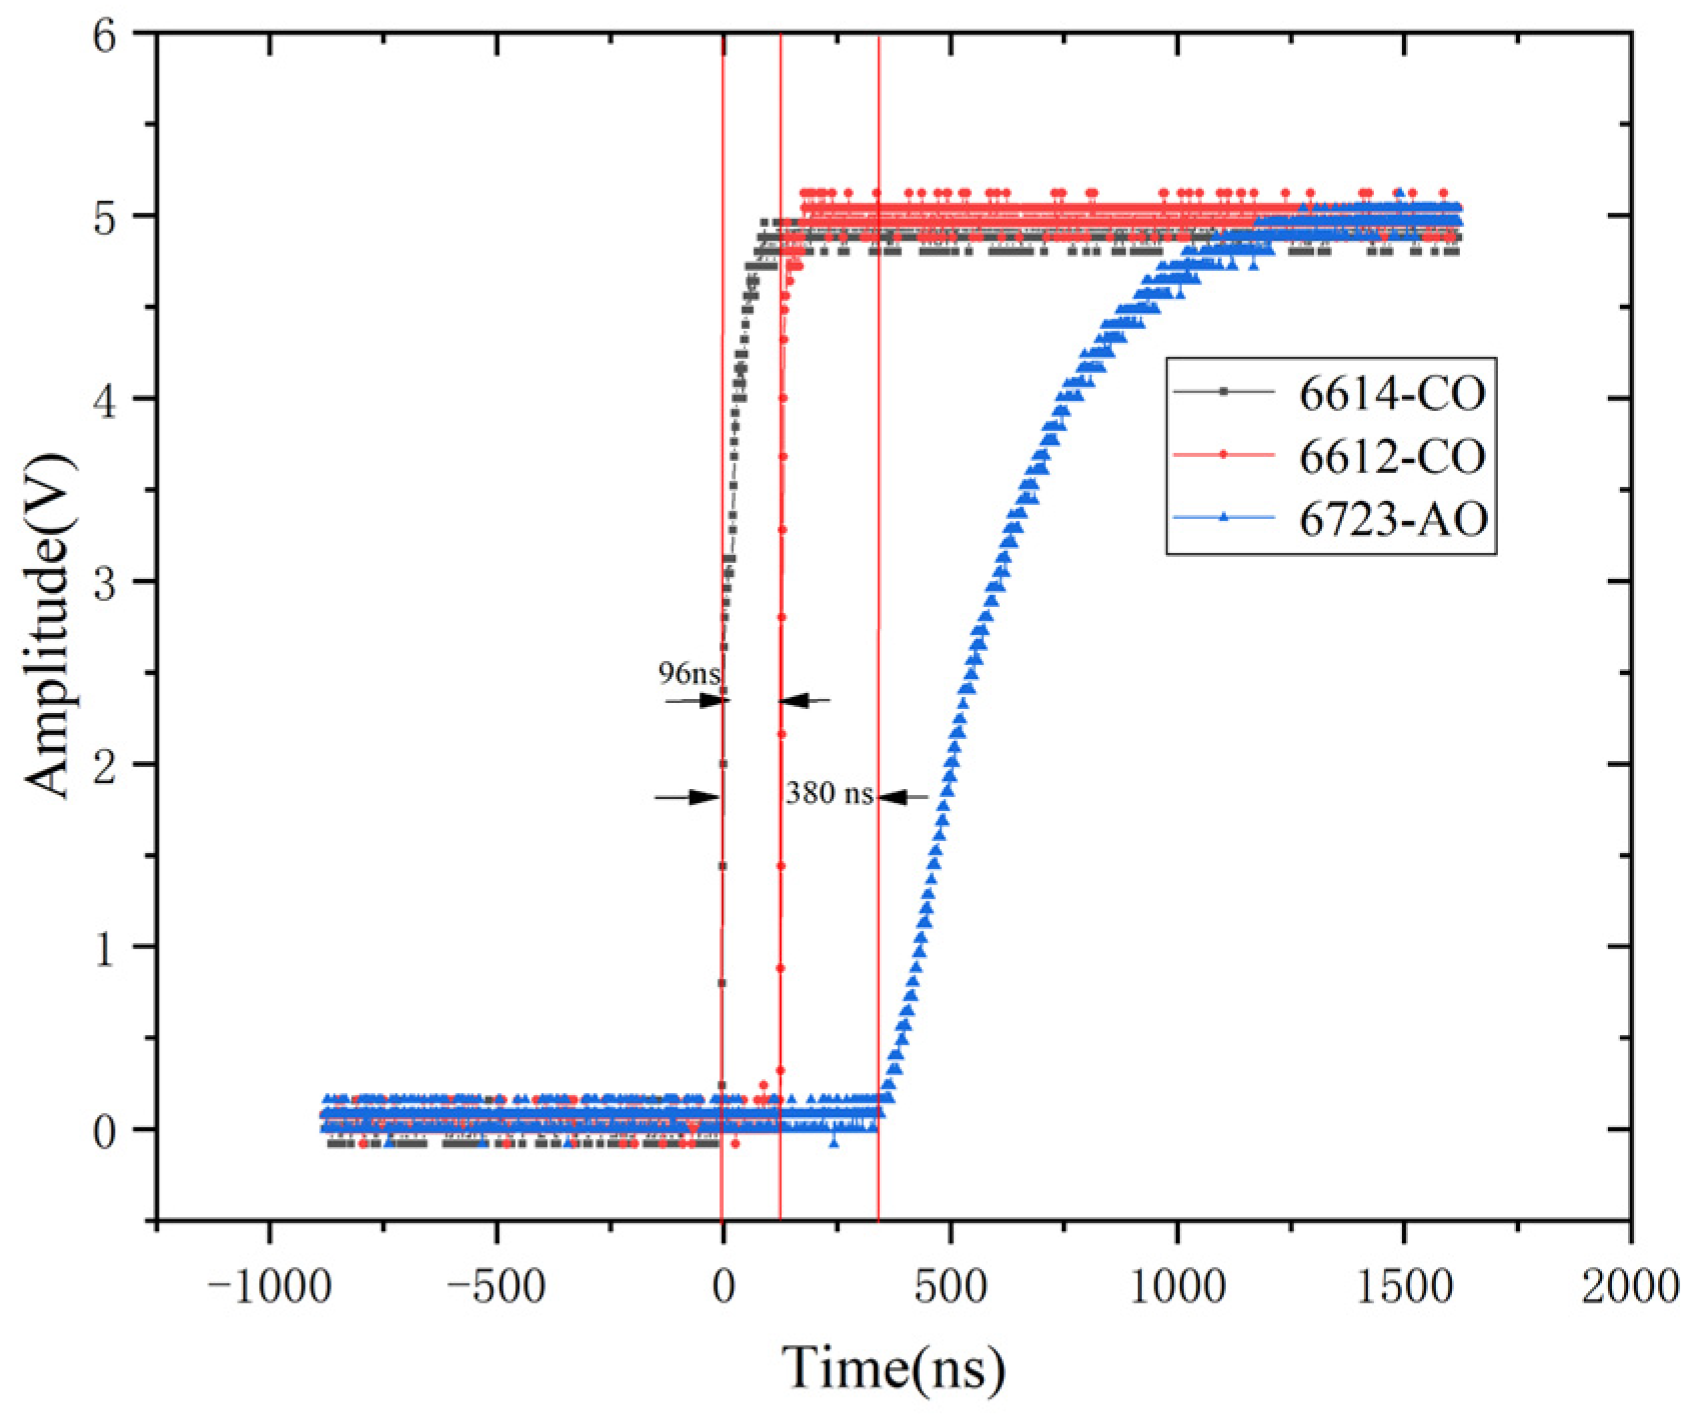
A structural diagram of servo control system is shown in Figure 7a. The hydrogen maser 085 serves as the reference for the HROG and DDS, and a mixer output at a frequency of 6834682610 Hz is applied for the Ramsey interrogation of NTSC-Rb1. The interrogation frequency is alternated between ν0 − Δν/2 and ν0 + Δν/2 respectively, where ν0 is the microwave central frequency, and Δν is the full-width at half maximum of the central fringe, as shown in Figure 7b. Then the atomic transition probabilities PL and PR are obtained. The error is calculated every two fountain cycles. Then it is feedback to the frequency synthesizer and HROG with different PI parameters to tracking the position of the fringe centre. The software calculates and displays the frequency stability in real time. The short-term frequency stability of NTSC-Rb1 is related to the atom number, the noise of the detection system, and the phase noise of the LO [23]. The long-term stability depends on the stability of the frequency shift caused by various physical effects [19].
The output of the HROG is connected to the clock comparison system in order to measure the phase difference between the UTC (NTSC) and NTSC-Rb1. In order to maintain the continuity of the rubidium atomic fountain clock, a algorithm is designed to assign a suitable feedback amount to the HROG in case of an unexpected situation such as laser unlock, so as to ensure that the signal of the rubidium atomic fountain clock is uninterrupted. Figure 8 shows the overlapping Allan variance of NTSC-Rb1 against hydrogen maser. The red points represent frequency stability calculating from a frequency comparator VCH-323, The daily stability is 7.4 × 10⁻¹⁶. The blue dashed line is fitted according to the white-frequency noise model.

4. Results

The control system has been implemented to control a rubidium atomic fountain clock, realizing closed-loop locking. It has been weighted in TAI since October 2022. Figure 9 shows the relative frequency difference of the NTSC-Rb1 with respect to the UTC (NTSC) converted from the phase difference after removing the initial phase of one month. The horizontal coordinate is Julian day MJD, one point represents one day. The line fit shows that the frequency drift is 0.00044 ns/day/day. The Bureau International des Poids et Mesures (BIPM) reports frequency drifts of the clocks monthly. The frequency drift of NTSC-Rb1 in every month since October 2022 can be found in BIPM reports [24].

5. Conclusions

In this study, the subsystems of a control system are designed and analyzed, and a synchronization method between the multiple devices is presented. The synchronization accuracy is 380 ns. By using a timing sequence control system, a wide scanning frequency range is implemented directly on the laser. The control system is applied to a rubidium atomic fountain clock to realize continuous operation for more than one year, and it outputs the standard 1 PPS and 5 MHz signal in real time. This proves that the control system works robustly and reliably. The rubidium atomic fountain clock have been participated in timekeeping. We will conduct research on effects related to long frequency stability and frequency drift in the future.

Author Contributions

Conceptualization, J.R. and H.Z.; methodology, D.L.; software, D.L.; validation, D.L., H.Z. and J.R.; formal analysis, D.L.; investigation, D.L.; data curation, S.F.; writing—original draft preparation, D.L.; writing—review and editing, J.R., Y.B. and S.F.; visualization, D.L.; supervision, J.R. and S.Z.; All authors have read and agreed to the published version of the manuscript.

Funding

This research was funded by the Natural Science Basic Research Program of Shaanxi Province, grant number 2023-JC-YB-078, and the Large Research Infrastructures Improvement Funds of Chines Academy of Sciences, grant number DSS-WXGZ-2020-0005.

Data Availability Statement

The original data presented in the study are included in the article, further inquiries can be directed to the corresponding authors.

Conflicts of Interest

The authors declare no conflicts of interest.

References

  1. Guéna, J.; Abgrall, M.; Rovera, D.; Laurent, P.; Chupin, B.; Lours, M.; Santarelli, G.; Rosenbusch, P.; Tobar, M.E.; Li, R.; et al. Progress in Atomic Fountains at LNE-SYRTE. IEEE Trans. Uitrasonics Ferroelectr. Freq. Control 2012, 59, 391–410. [Google Scholar] [CrossRef] [PubMed]
  2. Weyers, S.; Gerginov, V.; Kazda, M.; Rahm, J.; Lipphardt, B.; Dobrev, G.; Gibble, K. Advances in the accuracy, stability, and reliability of the PTB primary fountain clocks. Metrologia 2018, 55, 789–822. [Google Scholar] [CrossRef]
  3. Peil, S.; Swanson, T.B.; Hanssen, J.; Taylor, J. Microwave-clock timescale with instability on order of 10−17. Metrologia 2017, 54, 247–252. [Google Scholar] [CrossRef]
  4. Peil, S.; Hanssen, J.; Swanson, T.B.; Taylor, J.; Ekstrom, C.R. The USNO rubidium fountains. J. Phys. Conf. Ser. 2016, 723, 012004. [Google Scholar] [CrossRef]
  5. Lorini, L.; Pavlenko, K.; Bize, S.; Desruelle, B.; Stern, G.; Doronin, I.; Pavlenko, Y.; Donchenko, S. Preliminary stability analysis of Rb fountains for timescale generation. In Proceedings of the 2017 Joint Conference of the European Frequency and Time Forum and IEEE International Frequency Control Symposium (EFTF/IFCS), Besancon, France, 9–13 July 2017; pp. 317–321. [Google Scholar]
  6. Blinov, I.; Boiko, A.; Kosheliaevskii, N.; Kupalova, O.; Sokolova, O. First Experiments on Application of Rb Fountain Frequency Standards for TA(SU) Time Scale Maintenance. In Proceedings of the 2018 European Frequency and Time Forum (EFTF), Torino, Italy, 10–12 April 2018; pp. 257–262. [Google Scholar]
  7. Owen, S.F.; Hall, D.S. Fast line-based experiment timing system for LabVIEW. Rev. Sci. Instrum. 2004, 75, 259–265. [Google Scholar] [CrossRef]
  8. Agraz, J.; Grunfeld, A.; Li, D.; Cunningham, K.; Willey, C.; Pozos, R.; Wagner, S. LabVIEW-based control software for para-hydrogen induced polarization instrumentation. Rev. Sci. Instrum. 2014, 85, 044705-1–044705-6. [Google Scholar] [CrossRef] [PubMed]
  9. Keshet, A.; Ketterle, W. A distributed, graphical user interface based, computer control system for atomic physics experiments. Rev. Sci. Instrum. 2013, 84, 015105-1–01515-5. [Google Scholar] [CrossRef] [PubMed]
  10. Jie, R.; Hui, L.; Benquan, L. Program control in transition observation of strontium optical lattice clock. Opt. Precis. Eng. 2016, 24, 50–58. [Google Scholar]
  11. Liu, K.; Chen, W.; Song, W. Development of Cold Atomic Fountain Clock Control System Based on LabVIEW. Metrol. Sci. Technol. 2020, 8, 1–7. [Google Scholar]
  12. Weiliang, C.; Fang, F.; Kun, L.; Fasong, Z.; Shaoyang, D.; Yani, Z.; Tianchu, L. Development of Rb fountain clock for time keeping. Frontiers 2022, 10, 956452. [Google Scholar] [CrossRef]
  13. Chen, W.; Liu, K.; Zheng, F.; Dai, S. Engineering Highly Reliable Rb fountain clock with a long-term instability of 2.6 × 10⁻¹⁶. Chin. J. Sci. Instrum. 2023, 44, 71–78. [Google Scholar]
  14. Shi, C.; Wei, R.; Li, T. Working for a mobile high accuracy (10–15) rubidium atomic. Sci. Sin. Phys. Mech. Astron. 2011, 41, 611–619. [Google Scholar]
  15. Cheng, H.N.; Zhang, Z.; Deng, S.; Ji, J.W.; Ren, W.; Xiang, J.F.; Zhao, J.B.; Zhao, X.; Ye, M.F.; Li, L.; et al. Design and operation of a transportable 87Rb atomic 02012 clock. Rev. Sci. Instrum. 2021, 92, 054702-1–054702-7. [Google Scholar] [CrossRef] [PubMed]
  16. Huang, S. Preliminary Construction of Electronic Control System for a Cesium Fountain Clock. Master’s Thesis, Huazhong University of Science & Technology, Wuhan, China, 2020. [Google Scholar]
  17. Wang, X.-W.; Yu, M.-Y.; Bai, Q.-S.; Du, R.-C.; Liu, L.-J. Design and implementation of control system for cold atom fountain clock based on Labview. J. Time Freq. 2024, 47, 81–91. [Google Scholar]
  18. Bai, Y.; Ruan, J.; Liu, D.; Fan, S.; Guan, Y.; Lei, P. Frequency Stabilization Technology of 1560 nm Fiber Laser based on Rubidium Modulation Transfer Spectroscopy. IEEE Photonics J. 2024. accepted. [Google Scholar] [CrossRef]
  19. Zhang, H.; Ruan, J.; Liu, D.; Yang, F.; Fan, S.; Bai, Y.; Guan, Y.; Wang, X.; Shi, J.; Zhang, S. Development and Preliminary Operation of 87Rb Continuously Running Atomic Fountain Clock at NTSC. IEEE Trans. Instrum. Meas. 2022, 71, 1008312. [Google Scholar] [CrossRef]
  20. Lin, R.; Liu, D.; Ruan, J.; Zhao, W.; Wang, X.; Chen, J.; Guan, Y.; Zhang, H.; Yu, F.; Shi, J.; et al. Laser power stabilization for the detection of the populations of the atomic double levels in Cs fountain clock. In Proceedings of the 2014 IEEE International Frequency Control Symposium (FCS), Taipei, Taiwan, 19–22 May 2014; pp. 414–416. [Google Scholar]
  21. National Instruments. Available online: https://www.ni.com/zh-cn.html (accessed on 20 April 2023).
  22. Liu, D.; Wang, X.; Lin, R.; Chen, J.; Zhang, H.; Ruan, J.; Guan, Y.; Yu, F.; Shi, J.; Zhang, S. The Research of control system for Cesium atomic fountain clock. In Proceedings of the 2014 IEEE International Frequency Control Symposium (FCS), Taipei, Taiwan, 19–22 May 2014; pp. 397–400. [Google Scholar]
  23. Szymaniec, K.; Park, E.; Marra, G.; Chalupczak, W. First accuracy evaluation of the NPL-CsF2 primary frequency standard. Metrologia 2010, 47, 363–376. [Google Scholar] [CrossRef]
  24. BIPM Circular T URL. Available online: https://www.bipm.org/en/time-ftp/circular-t (accessed on 15 August 2023).
Figure 1. Photograph of NTSC-Rb1.
Electronics 13 03133 g001
Figure 2. Diagram of timing sequence.
Electronics 13 03133 g002
Figure 3. Diagram of the control system.
Electronics 13 03133 g003
Figure 4. Schematic diagram of synchronization.
Electronics 13 03133 g004
Figure 5. Synchronization accuracy result.
Electronics 13 03133 g005
Figure 6. Time-of-flight signals.
Electronics 13 03133 g006
Figure 7. (a) Diagram of the servo control system; (b) The central fringe of Ramsey fringes.
Electronics 13 03133 g007
Figure 8. Overlapping Allan standard deviation of Rb fountain clock against hydrogen maser.
Electronics 13 03133 g008
Figure 9. Drift of the Rb fountain clock relative to the UTC (NTSC).
Electronics 13 03133 g009
Table 1. Design specifications.
ChannelsSample RateRangeResolutionSynchronization Accuracy
CO1680 MS/s0–5 V<1 μs
AO3100 KS/s0–10 V16 bits
AI2100 KS/s−10–10 V16 bits
Rs2322
Disclaimer/Publisher’s Note: The statements, opinions and data contained in all publications are solely those of the individual author(s) and contributor(s) and not of MDPI and/or the editor(s). MDPI and/or the editor(s) disclaim responsibility for any injury to people or property resulting from any ideas, methods, instructions or products referred to in the content.

