Article

Characterization of Breakdown Arcs Induced by Venting Particles Generated by Thermal Runaway of Large-Capacity Ternary Lithium-Ion Batteries

1
College of Locomotive and Rolling Stock Engineering, Dalian Jiaotong University, Dalian 116028, China
2
State Key Laboratory of Intelligent Green Vehicle and Mobility, Tsinghua University, Beijing 100084, China
3
School of Electrical & Electronic Engineering, Harbin University of Science and Technology, Harbin 150080, China
*
Authors to whom correspondence should be addressed.
Electronics 2024, 13(16), 3168; https://doi.org/10.3390/electronics13163168
Submission received: 4 July 2024 / Revised: 1 August 2024 / Accepted: 8 August 2024 / Published: 10 August 2024
(This article belongs to the Special Issue Advanced Charging Technology for Electric Vehicles)

Abstract

:
In recent years, with the continuous growth in power demand, lithium-ion batteries (LIBs) have become an indispensable component of various electronic devices, transportation vehicles, and energy systems. The safety performance of LIBs is one of the most significant issues facing their continued development. In battery systems, the presence of arcs constitutes a significant safety hazard that necessitates attention; the thermal runaway (TR) of LIBs releases a large quantity of particles with elevated temperature and high velocity, probably resulting in arc failures. Changes in the insulation structure inside battery packs and the accumulation of particulate matter resulting from the TR of battery cells are potential causes of arc-induced disasters. In this study, we utilized fully charged 71 Ah ternary LIB Li (Ni0.8Co0.1Mn0.1) O2 (NCM811) pouch cell samples and collected the vented particles in an inert atmosphere after TR. All the settled particles were classified into six groups; by conducting experiments with different particle sizes, electrode spacings, and circuit loads, the patterns of the particle-induced arcs were understood. The results indicate that as the particle size increases, the critical breakdown voltage decreases. Regarding electrode spacing and circuit load resistance, larger values require higher critical breakdown voltages. The research results provide valuable guidance for the electrical protection and safety design of battery systems.

1. Introduction

LIBs are widely employed in the field of energy storage stations and new energy vehicles because of their apparent advantages, such as high specific energy density, long life cycle, and low self-discharge rate [1,2,3]. However, corresponding safety issues such as fire accidents have attracted public attention; these issues mainly result from the thermal runaway (TR) of LIBs [4,5,6]. The electrical failure (including any situation that may cause the electrical system to fail to function properly, encompassing faults caused by natural disasters, human factors, and other causes) of the LIB system, a DC electrical system, is one of the most essential problems in these fire accidents caused by battery TR.
TR is a major cause of energy failure in batteries; battery TR emissions include not only gases but also solid particles. With the increase in battery temperature, the internal chemical changes lead to the damage of the solid electrolyte interface (SEI) film. This damage prompts a reaction between the anode material and the electrolyte, causing the decomposition of the electrolyte [7,8,9]. This process may release toxic gases, such as HF and CO, as well as flammable gases, like H2 and alkane gases [10,11]. When a battery undergoes TR, the production of internal gases increases significantly. As the internal pressure rises to a certain level, different types of batteries have distinct response mechanisms: the vent valve of prismatic cells activates to release pressure, whereas the pouch cell may experience damage in areas of lower pressure, leading to battery leakage or rupture [12]. Once these gases are released, they not only release solid particles and liquid substances from within the battery but also become the primary combustion media in the event of a fire [13]. Additionally, solid particles of the battery at high temperatures could potentially serve as ignition sources for fires [14]. These ejectiles are significant fire hazards in addition to the immense energy released by failed batteries. The ejected materials can potentially cause electrical failures, particularly arc failures [15,16], which may ignite combustible mixtures or melt battery modules, directly accelerating and exacerbating fire incidents [17,18]. With the continuous increase in the voltage of electric vehicle DC battery systems, the electrical safety issues during battery TR processes, especially DC arc failures, are increasingly garnering attention.
An arc is a gas discharge phenomenon, a form of self-sustained discharge in a gas, characterized by a decrease in cathode potential and high current density, typically exhibiting a negative voltage–current characteristic [19]. Since the discovery of the electric arc in the early nineteenth century, a more comprehensive theoretical foundation has been gradually developed for the fundamental study of arcs. Under normal conditions, gases exhibit good insulating properties. However, when a sufficiently high electric field is applied across a gas gap, it can cause current to flow through the gas, a phenomenon known as a discharge [20]. An arc can be divided into three regions: the cathode potential fall region, the arc column (positive column of the arc), and the anode potential fall region. The two electrodes of the arc, the cathode and the anode, can also be considered as components of the arc [21,22,23].
Within the field of battery systems for electric vehicles and energy storage stations, DC arc faults caused by mechanical collisions, loose connections, insulation damage, and other reasons have become one of the main causes of safety accidents in battery systems [24]. Guo Lin and others have found through the analysis of a large number of new energy vehicles involved in accidents that the proportion of vehicle fires caused by arc faults is as high as 60% [25]. Typical examples from battery systems are listed below. Arc failure due to cooling liquid leakage was the root cause that led to battery TR and fire accidents of the energy storage system [26]. And during the process of TR, spark failure accompanied by smoke were also observed in new energy vehicles [27]. Typically, a DC voltage of approximately 30 V is sufficient to sustain the stable combustion of an arc. Therefore, high voltage arcs can lead to severe electrical accidents and fire hazards. And the high temperature of an arc can melt the battery pack casing and ignite combustible materials. Once an arc fault occurs within a battery pack, the additional heat source from the arc and the accelerated onset of fire due to the entry of air may also hasten the propagation of TR [28]. Therefore, whether an arc failure occurs during the TR process of a battery system and how the arc failure happens are subjects worth investigating. Current research on arc faults is mainly focused on photovoltaic systems, with relatively little research on the disaster-causing issues of DC arcs in LIB systems [29]. The electrical systems of energy storage stations and electric vehicles change different voltage levels through power electronic converters; the voltage range of the DC bus in energy storage stations is 400–1500 V, and the DC bus voltage in electric vehicles is above 300 V, all of which meet the voltage conditions for arc occurrence [30].
Paschen’s law reveals the relationship between the breakdown voltage and the gap distance, as well as factors such as gas pressure in a uniform electric field [31,32,33]. Equation (1) represents the expression for the critical breakdown voltage in a uniform electric field. Given the electrode gap and material, A, B, and γ are all known constants; therefore, the critical breakdown voltage V c can be considered a function of the product of gas pressure P and electrode gap distance d. In real-world scenarios, where the electric field distribution is non-uniform, the critical breakdown voltage obviously changes.
V c = B P d ln A P d ln ( 1 γ )
At millimeter-scale gaps and atmospheric pressure, the air breakdown voltage is close to several kilovolts and varies linearly with the gap distance. Therefore, in DC battery systems, it seems difficult to form a breakdown arc at hundreds of volts. However, during the TR eruption process of LIBs, the battery itself undergoes deformation, high temperatures, and airflow impact, which can shock the entire battery structure system, leading to changes in the battery system’s structure [34,35]. Consequently, it is highly likely to encounter arc faults caused by TR in the battery system. The TR emissions from a fully charged ternary battery mainly exist whichn gaseous and solid states. During the flow of TR emissions, the battery system’s originally sound electrical insulation design may be melted and destroyed, increasing the likelihood of arc fault occurrence [36]. During the TR eruption process of LIBs, particulate matter is dispersed throughout the surroundings as it flows with the smoke. Larger particles, influenced by gravity, deposit near the emission vent, while smaller particles float with the smoke and disperse to more distant areas [33,37]. Consequently, particles of relatively smaller size have the potential to cover a larger area within the confines of a battery system. Studies have shown that the breakdown voltage of gas–solid mixtures may be lower than that of air [38]. Additionally, particles larger than 0.1 mm are more easily broken down compared to air [39,40]. Within battery systems, the accumulation of particulate matter may facilitate the formation of arcs [36], but whether it significantly reduces the critical breakdown voltage requires further research and analysis.
For a fully charged ternary battery, over half of the mass loss during TR is due to the ejected particles, including internal materials such as graphite and metal collectors. These particles contain over 30 elements, such as Ni, Co, Mn, Li, Al, Cu, C, H, and O [41], and for a fully charged commercial 50 Ah Li (Ni0.6Mn0.2Co0.2) O2 battery, 45% of the particles are smaller than 0.85 mm in size [12]. Particles of relatively smaller size are more likely to accumulate in the gaps of the battery system, and the breakdown voltage of gas–solid mixtures may be lower than that of air [38,42]. However, previous research has primarily focused on high voltages of several kilovolts and long gap distances of hundreds of millimeters, with the associated dielectric and ventilation particles being different [43,44]. Therefore, there is an urgent need to clarify whether and how the emission of particles significantly reduces the critical breakdown voltage of the breakdown arc to improve electrical safety and prevent accidental fire incidents.
To investigate the impact of the solid particles ejected during battery TR on the formation of arcs in the battery system, settled particles of fully charged NCM811 battery samples were collected after TR in a sealed chamber filled with nitrogen and divided into five groups according to particle size; the particulate matter was characterized and analyzed, and the elemental composition of the particulate matter was obtained. Then, an arc testing system was developed to investigate the relationship between the breakdown voltage and electrode spacing, particle size, and load resistance, and the rules of their mutual influence were grasped. This research reveals a new mechanism of breakdown arc in the battery system and provides guidance to evaluate and improve electrical safety.

2. Experimental

The experimental apparatus used in this study is depicted in Figure 1, with detailed descriptions provided in the subsequent sections.

2.1. Venting Particles Collected after TR

The TR of ternary batteries is often accompanied by the ejection of a large number of high-temperature solid particles, which can potentially damage the insulating coating of the battery system, thus threatening the electrical safety design of the battery. These tiny particles may freely deposit and fill in the gaps of metal structures, subsequently increasing the probability of arc breakdown. Consequently, the risk of arc-related disasters also correspondingly increases. The experimentation plan for collecting particulate matter builds upon the foundational work of Li Cheng and his research team, among others [45], and we selected 71 Ah NCM811 LIBs for our experiments on TR. The specific parameters of the sample are presented in Table 1, and the composition of each battery structure is presented in Table 2. The sample battery was fully charged to 100%SOC with a constant current of 1/3 C and a constant voltage of 4.2 V. The TR test was conducted in a 230 L sealed chamber filled with nitrogen, as shown in Figure 1a. First, the chamber was evacuated until a vacuum of 0.8 was achieved, and after a few minutes, it was filled with fresh nitrogen to atmospheric pressure. This operation was repeated twice to reduce the oxygen concentration to below 1%. The initial temperature of the battery was 30 °C, and the initial voltage was 4.2 V. Using a fixture to secure the battery, heating was applied to one side of the battery using a heating plate, causing the temperature of the battery and the positive and negative tab temperatures to rise gradually. The critical temperature for TR was defined as a temperature change rate of 1 °C/s. The temperature of the positive tab rose to 119 °C, and the temperature of the negative tab rose to 123 °C. The voltage stabilized at 4.16 V, after whichh the TR reaction of the battery occurred violently, and the voltage quickly dropped to 0 V. Following this, the temperatures of both tabs rose rapidly. The highest temperature inside the test chamber reached 859.2 °C, and the highest pressure reached 175.3 kPa. When the exhaust process finally terminated, nearly all the emitted particles settled at the bottom of the chamber. When the temperature inside the experimental environment had dropped to an appropriate level, a soft-bristle brush was used to collect the scattered particles from various parts of the test chamber onto a weighing pan for weighing; then, they were placed into a plastic seal bag or storage bottle. After the experiment, the measured mass of the battery was 433 g, and the total mass of the particulate matter collected was 152 g (the results from different batteries are also of this order of magnitude); particles smaller than 500 μm were filtered out, and it was found that particles below 500 μm accounted for more than 90% of the total weight of the collected particles. All the settled particles were sorted by 32-mesh, 150-mesh, 200-mesh, and 270-mesh sieves, corresponding to 500 μm, 100 μm, 75 μm, and 54 μm in diameter, respectively. Additionally, a 48-mesh sieve corresponding to 300 μm in diameter was utilized to obtain particles with a larger average size; so, the particles below 500 μm were divided into five groups based on different particle sizes, with the size ranges being 0–54 μm, 54–75 μm, 75–100 μm, 100–300 μm, and 300–500 μm. Figure 2 shows the mass percentage results of particles with different sizes. Using these five groups of particles with varying sizes as the experimental subjects for arc induction can intuitively reflect the impact of particles of different sizes on arc initiation.

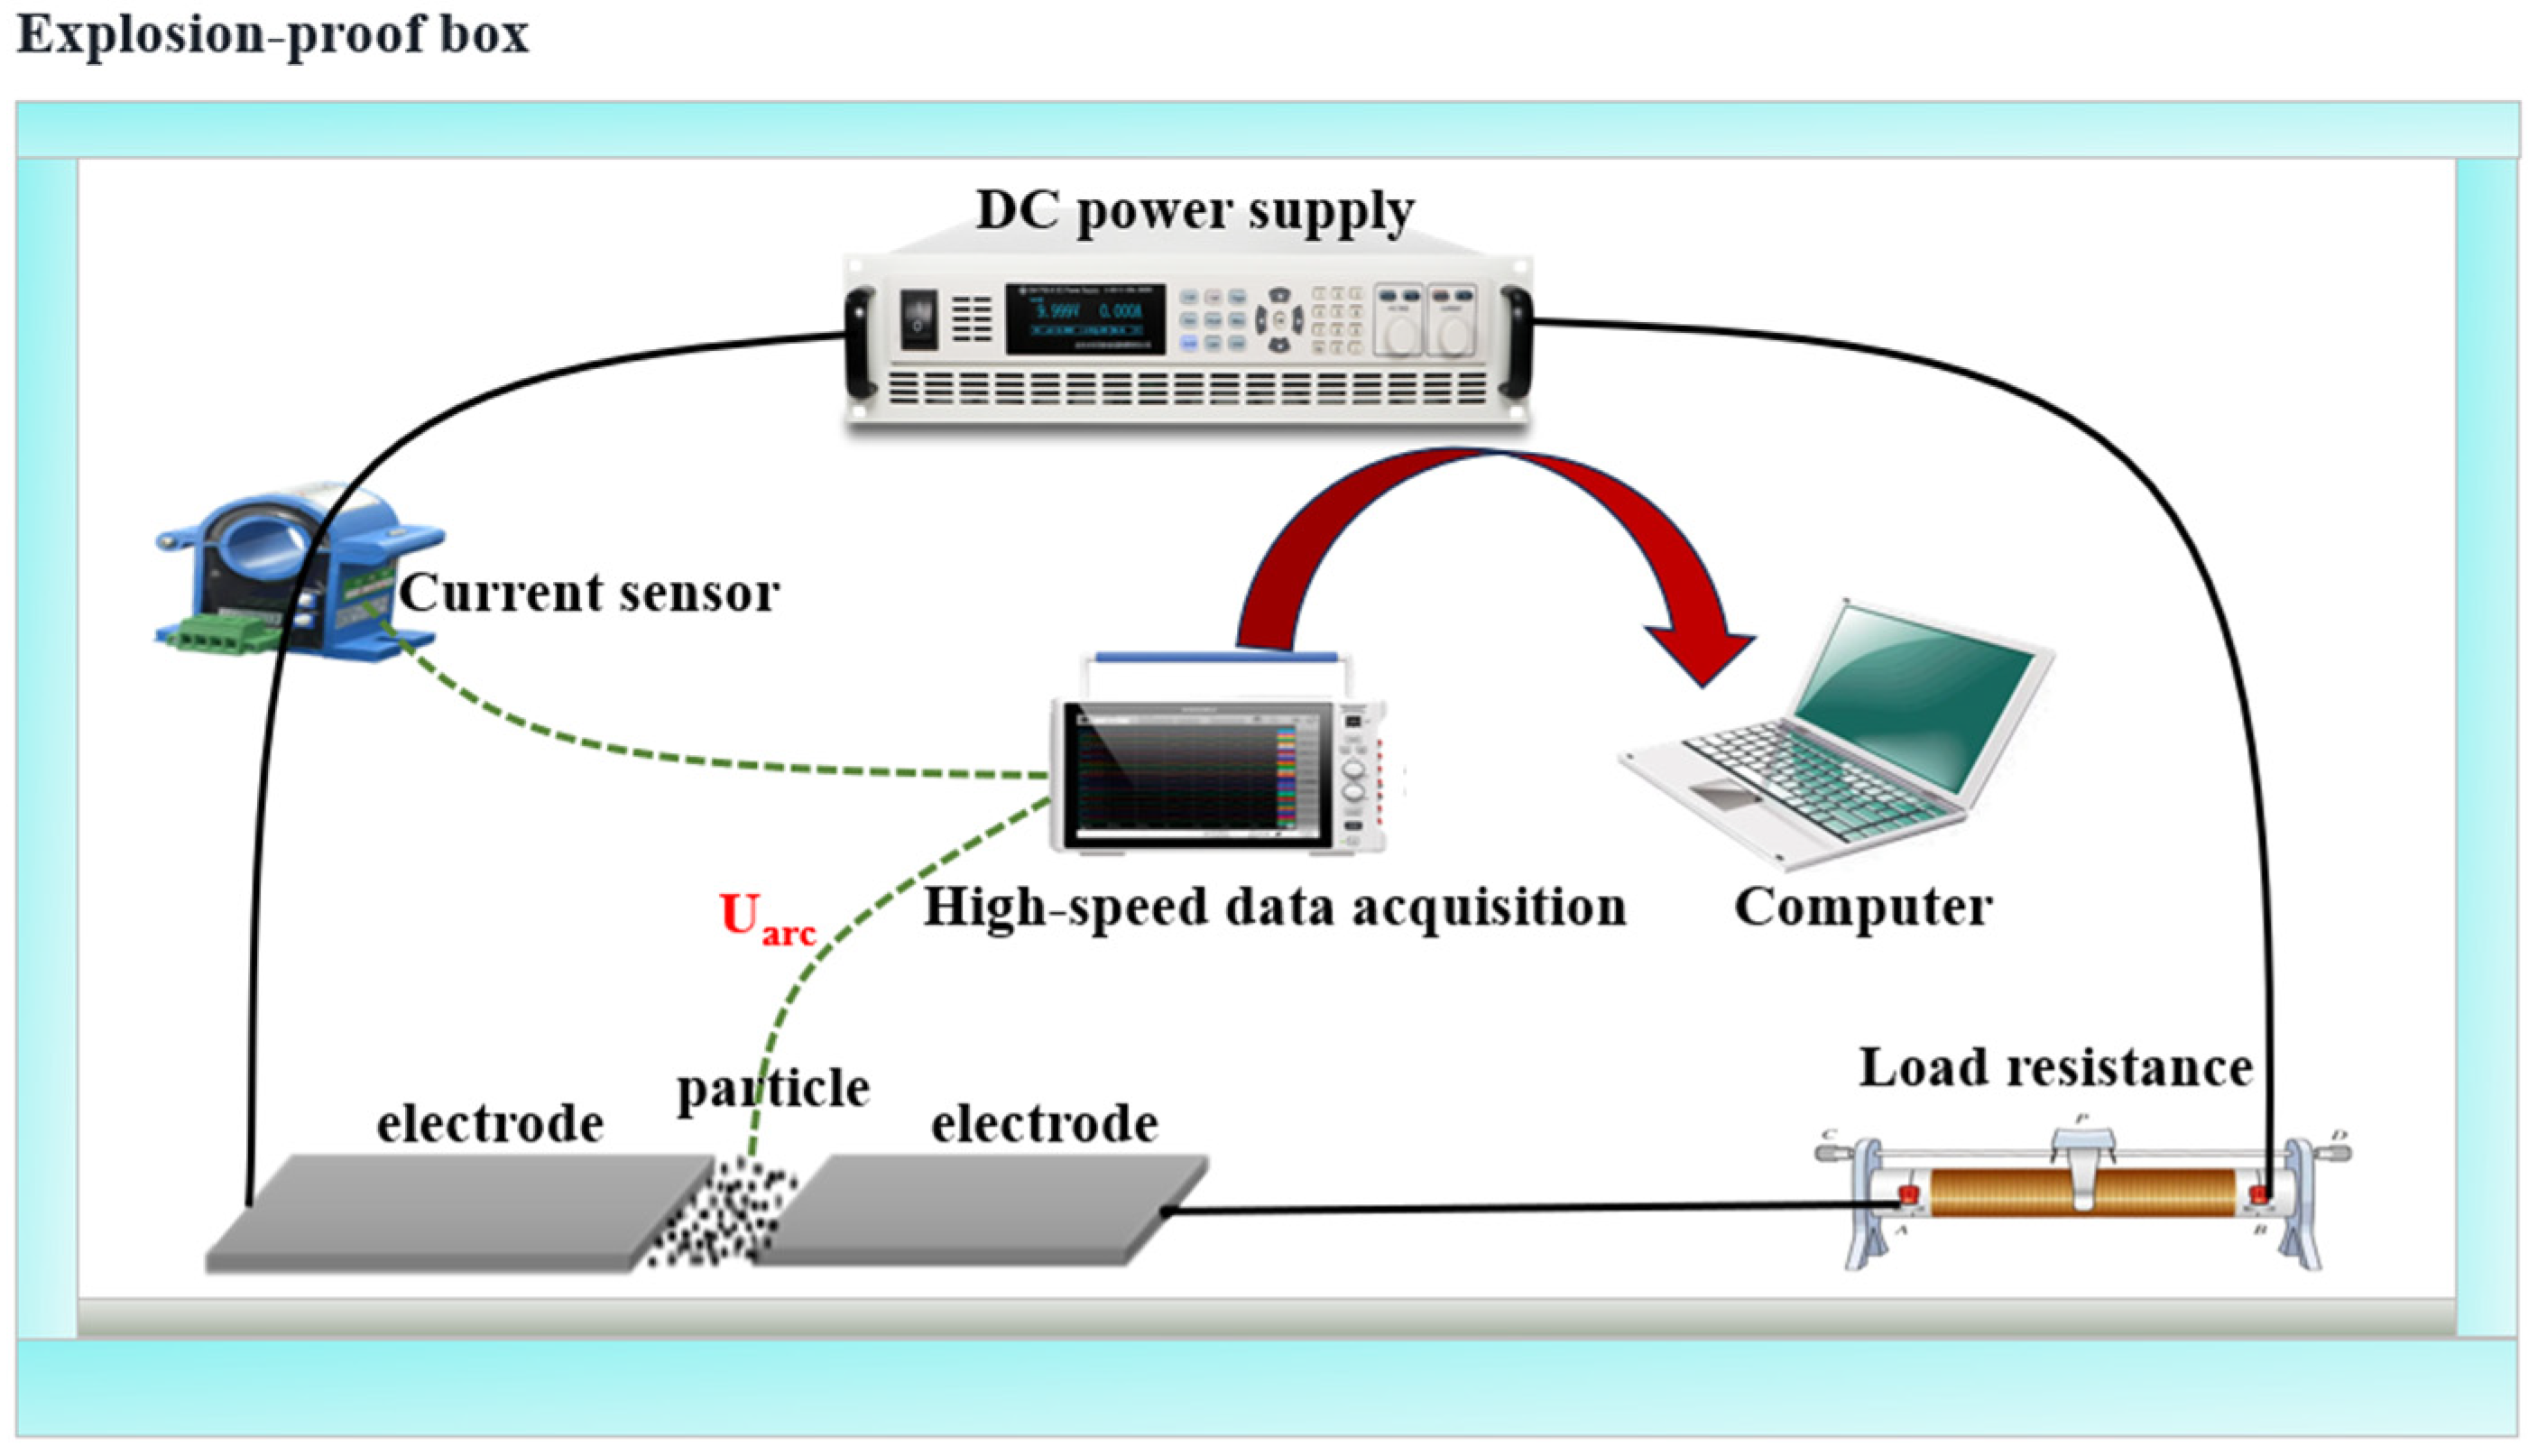
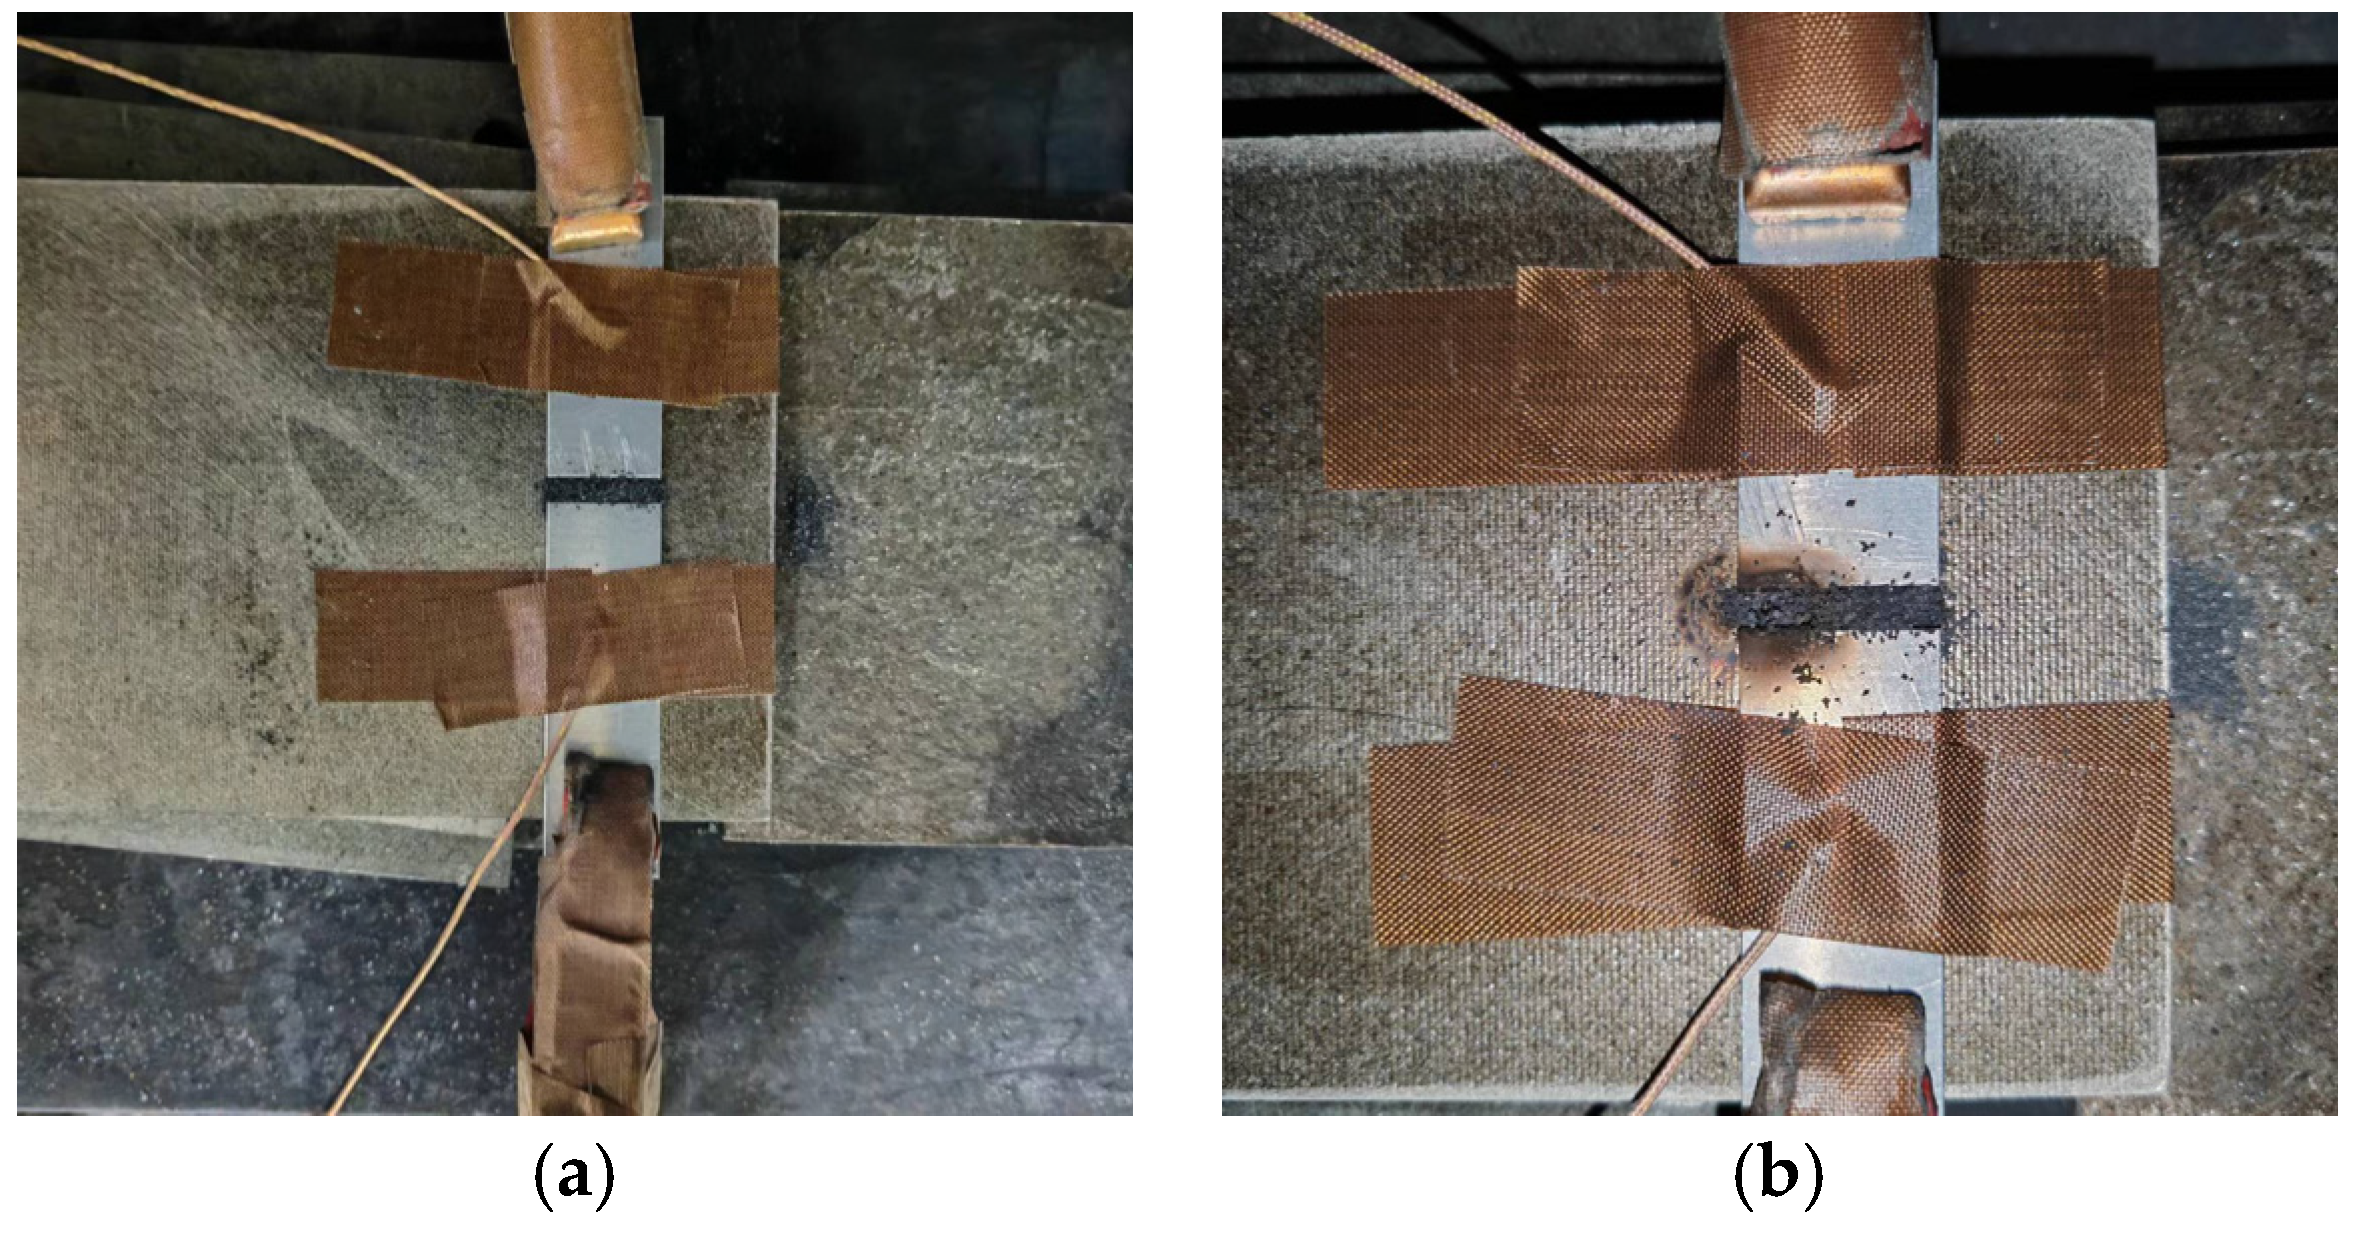
2.2. Arc Testing System

To investigate the influence of particles with different sizes on arc initiation under various electrode gaps, we established a particle-induced arc testing system, with a schematic diagram shown in Figure 3. The system primarily comprises a direct current power supply, an arc generation area, a protection resistor, a Hall current sensor, and a high-speed data acquisition device. The voltage of the DC power supply is adjustable within the range of 0–400 V, which is suitable for arc disaster analysis in electric vehicles equipped with the currently prevalent 400 V voltage platform battery systems. The arc generation area consists of two aluminum alloy electrodes and a mica board base, with a K-type thermocouple placed at the center of each electrode to record the temperature changes of the electrodes during the experiment. The exposed particulate matter was evenly filled into the electrode gap (approximately 3–5 g is needed), and a spatula was used to compact the particulate matter to minimize the gaps between particles, ensuring that the gap was completely filled. Additionally, brand new mica sheets and electrode plates were replaced between each group of experiments to minimize errors as much as possible. During the arc initiation experiments, the DC power supply voltage, series circuit current, voltage between electrodes, and temperatures of the two electrodes were recorded, with a sampling frequency of 1 kHz.
At the beginning of the experiment, the electrode gap was set and filled with particles, after which the DC power supply was turned on, applying voltage across the electrodes. The initial voltage was set to 50 V, which was increased by 10 V every 20 s until an arc breakdown occurred, at which point the power supply voltage was maintained for over 20 s. During this process, it is typically observed that the voltage increases to a final plateau value V1 just before breakdown, as well as a voltage plateau value V2 corresponding to the arc event. Based on these values, we can define the critical breakdown voltage as shown in Equation (2). Since the voltage loading mode is stepped at 10 V increments, the error range of the test results is ±5 V. The critical breakdown voltage referred to here is the externally applied voltage, not the inter-electrode voltage required to sustain stable arc combustion.
V c = V 1 + V 2 2 ( ± 5   V )
To investigate the effects of electrode spacing, particle size, and load resistance on particle-induced arc formation, these three factors were varied separately to understand their influences. The tests were conducted according to the following procedure, with each test condition replicated no less than twice. Before each experiment, a blank control group was set up without particles in the electrode gap, and no arc breakdown occurred. The specific experimental contents are as follows:
(1)
To investigate the relationship between particle size and critical breakdown voltage: The electrode gap was fixed at 4 mm, and the particle size was varied. Five groups of particles with different sizes were used as test samples, with the load resistor set to 20 Ω.
(2)
To investigate the relationship between electrode spacing and critical breakdown voltage: Particle groups with sizes ranging from 300 to 500 μm were selected, and the load resistor was set to 20 Ω. The electrode gap was adjusted to 1 mm, 2 mm, 4 mm, 6 mm, and 8 mm.
(3)
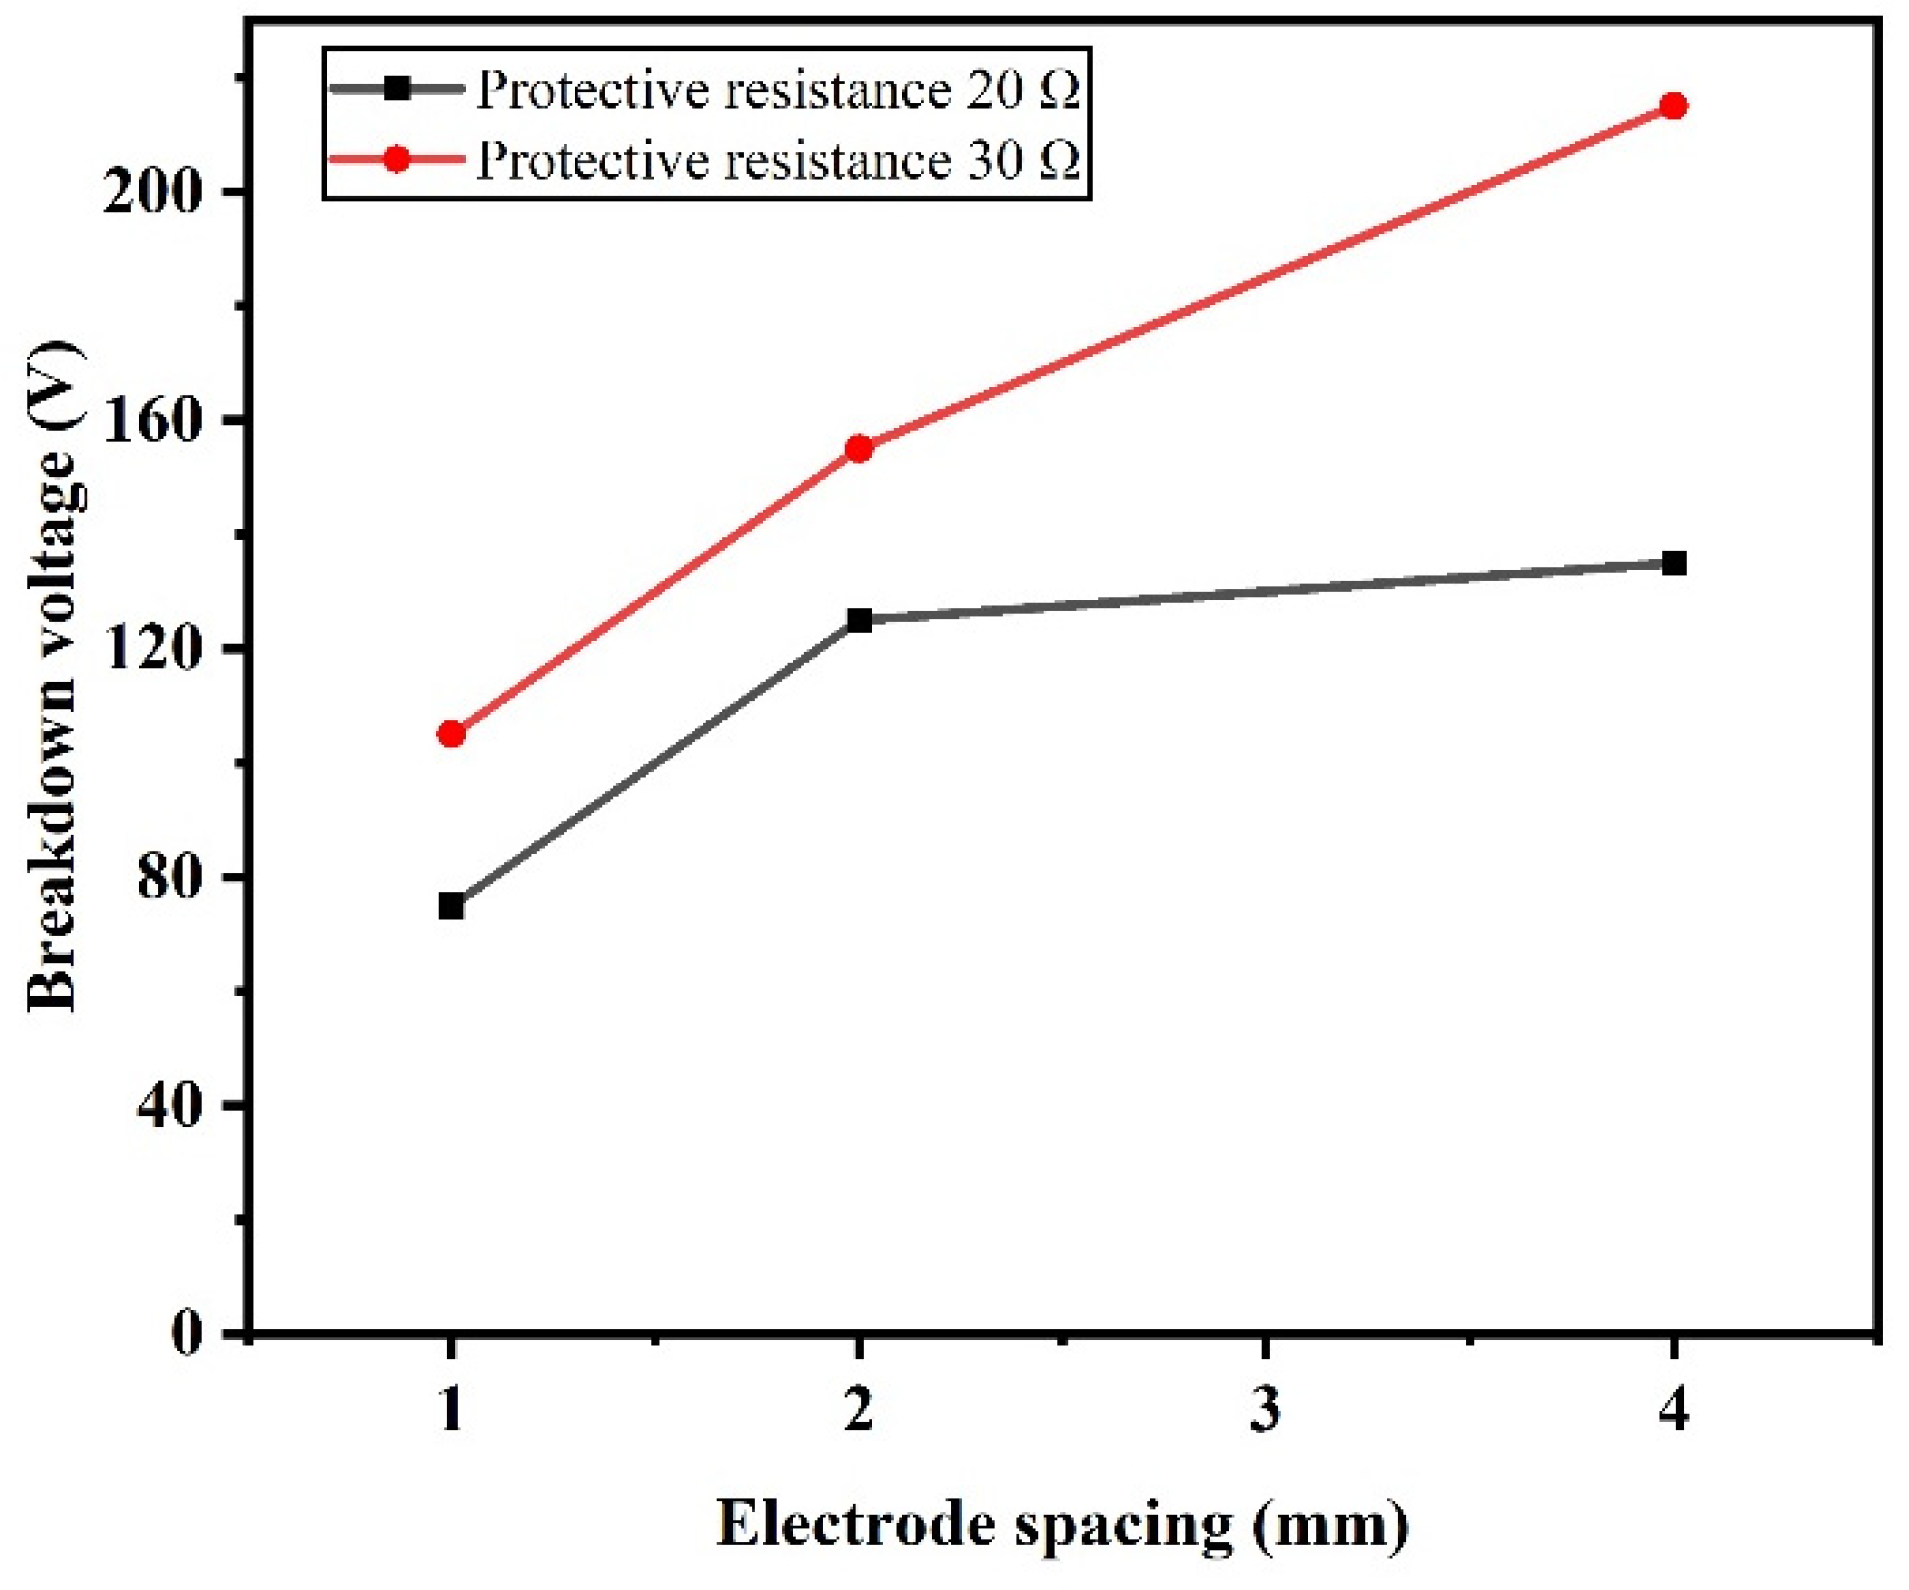
To investigate the relationship between load resistance and critical breakdown voltage: Particles with sizes ranging from 300 to 500 μm were selected, and the electrode gap was set to 1 mm, 2 mm, and 4 mm. The effects of load resistors of 20 Ω and 30 Ω on the critical breakdown voltage were compared under different electrode gaps.

3. Results and Discussion

3.1. Characterization Results

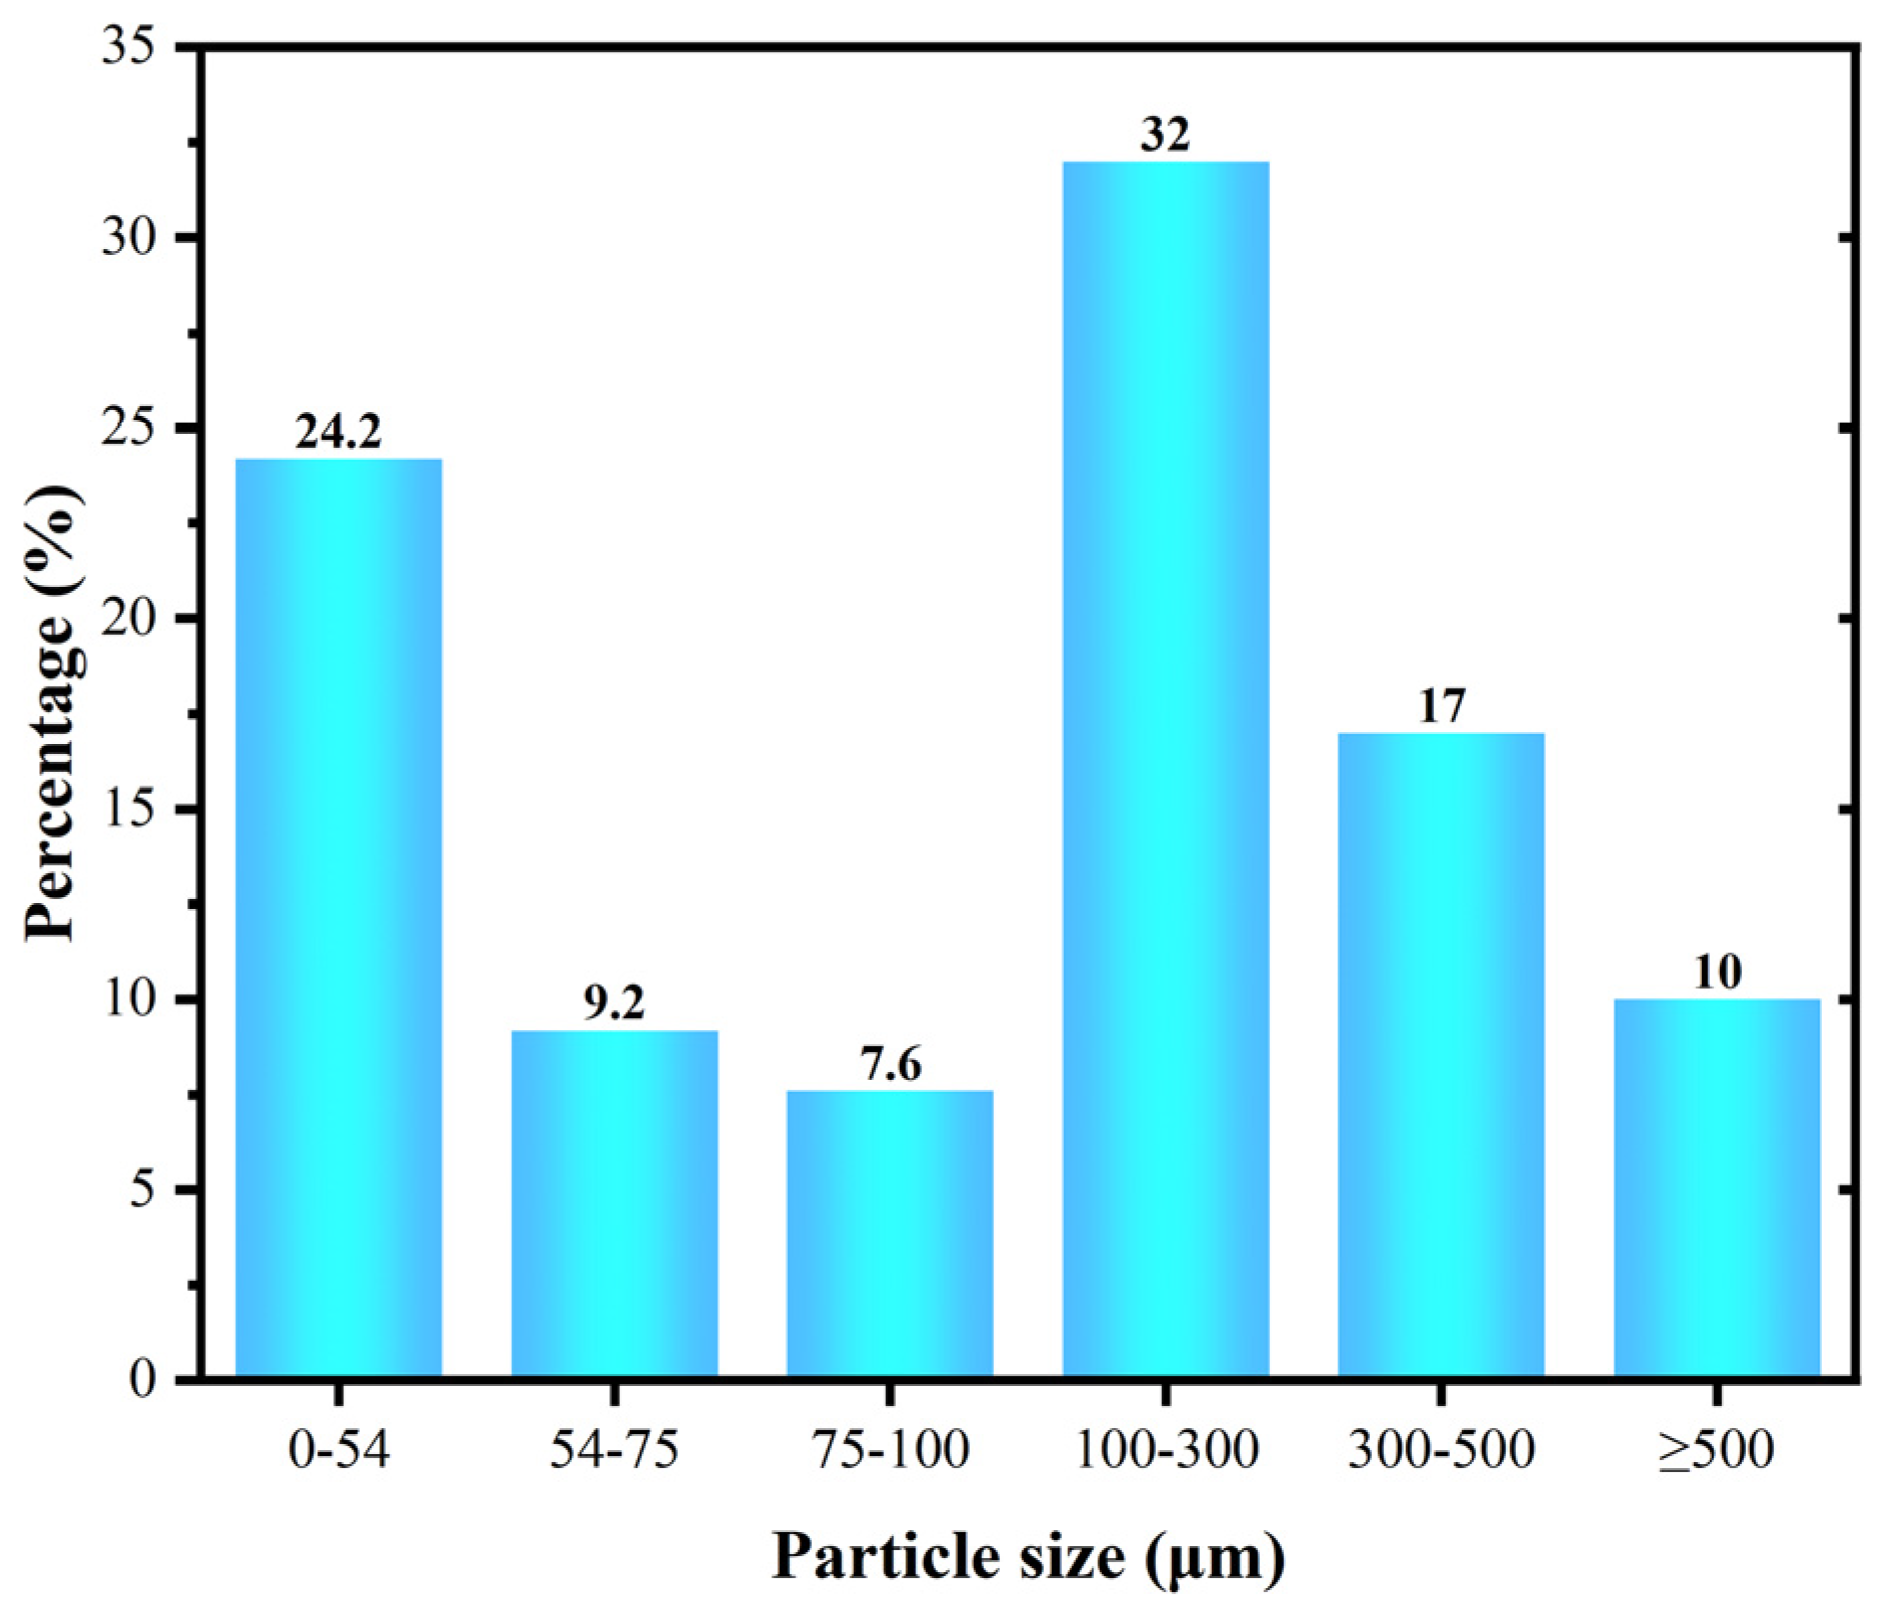
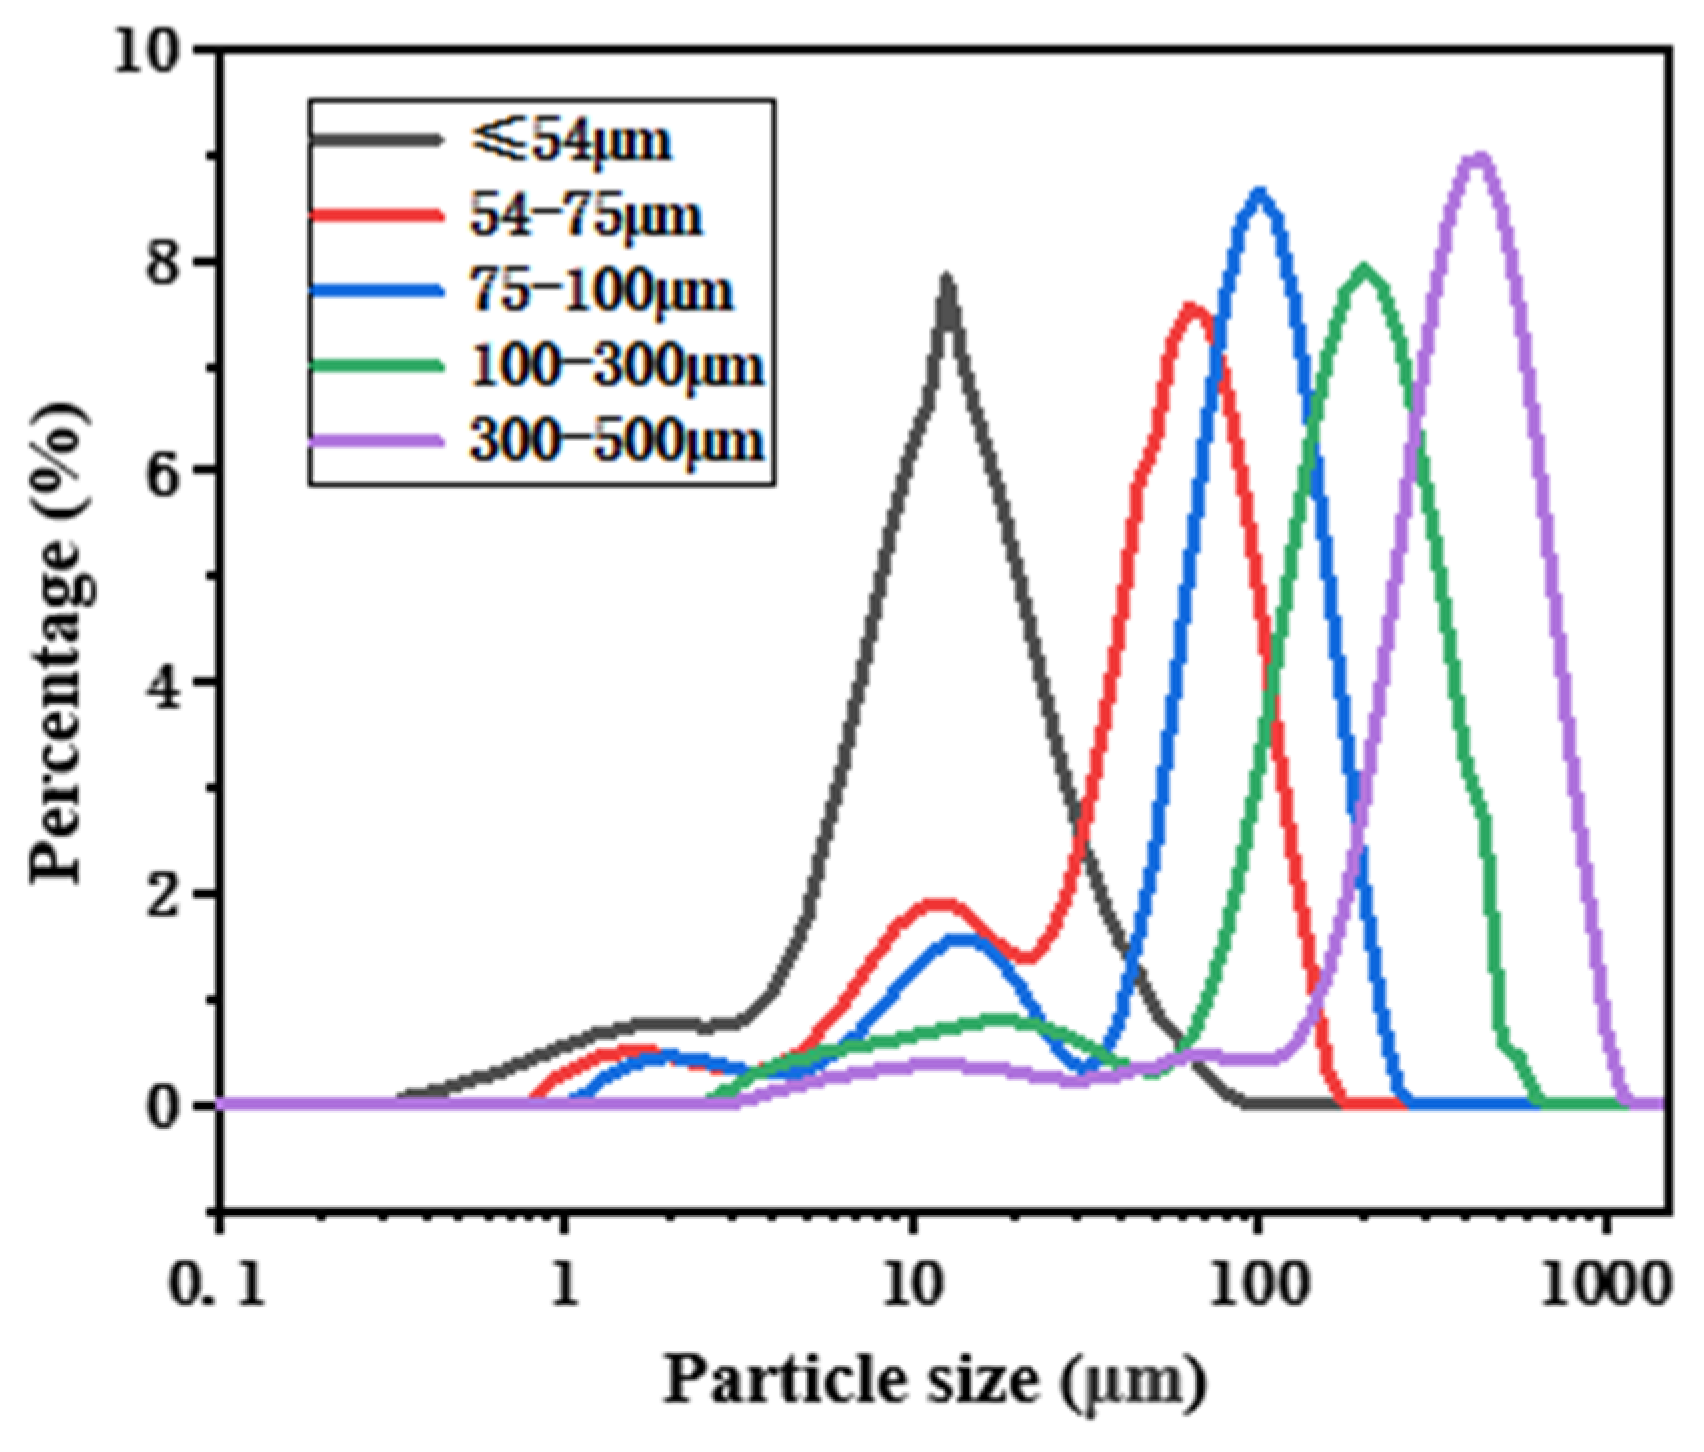
3.1.1. Particle Size Analysis

The Malvern Particle Size Analyzer was used to analyze the particle size distribution of the five groups of particles below 500 μm. Here, D (0.1), D (0.5), and D (0.9) represent the equivalent spherical diameters of the particles corresponding to cumulative volume fractions of 10%, 50%, and 90%, respectively, with the mean particle size being the mean equivalent spherical diameter. Figure 4 shows the distribution curves of the particles in the five different size ranges. Table 3 presents the key parameters of the test results.

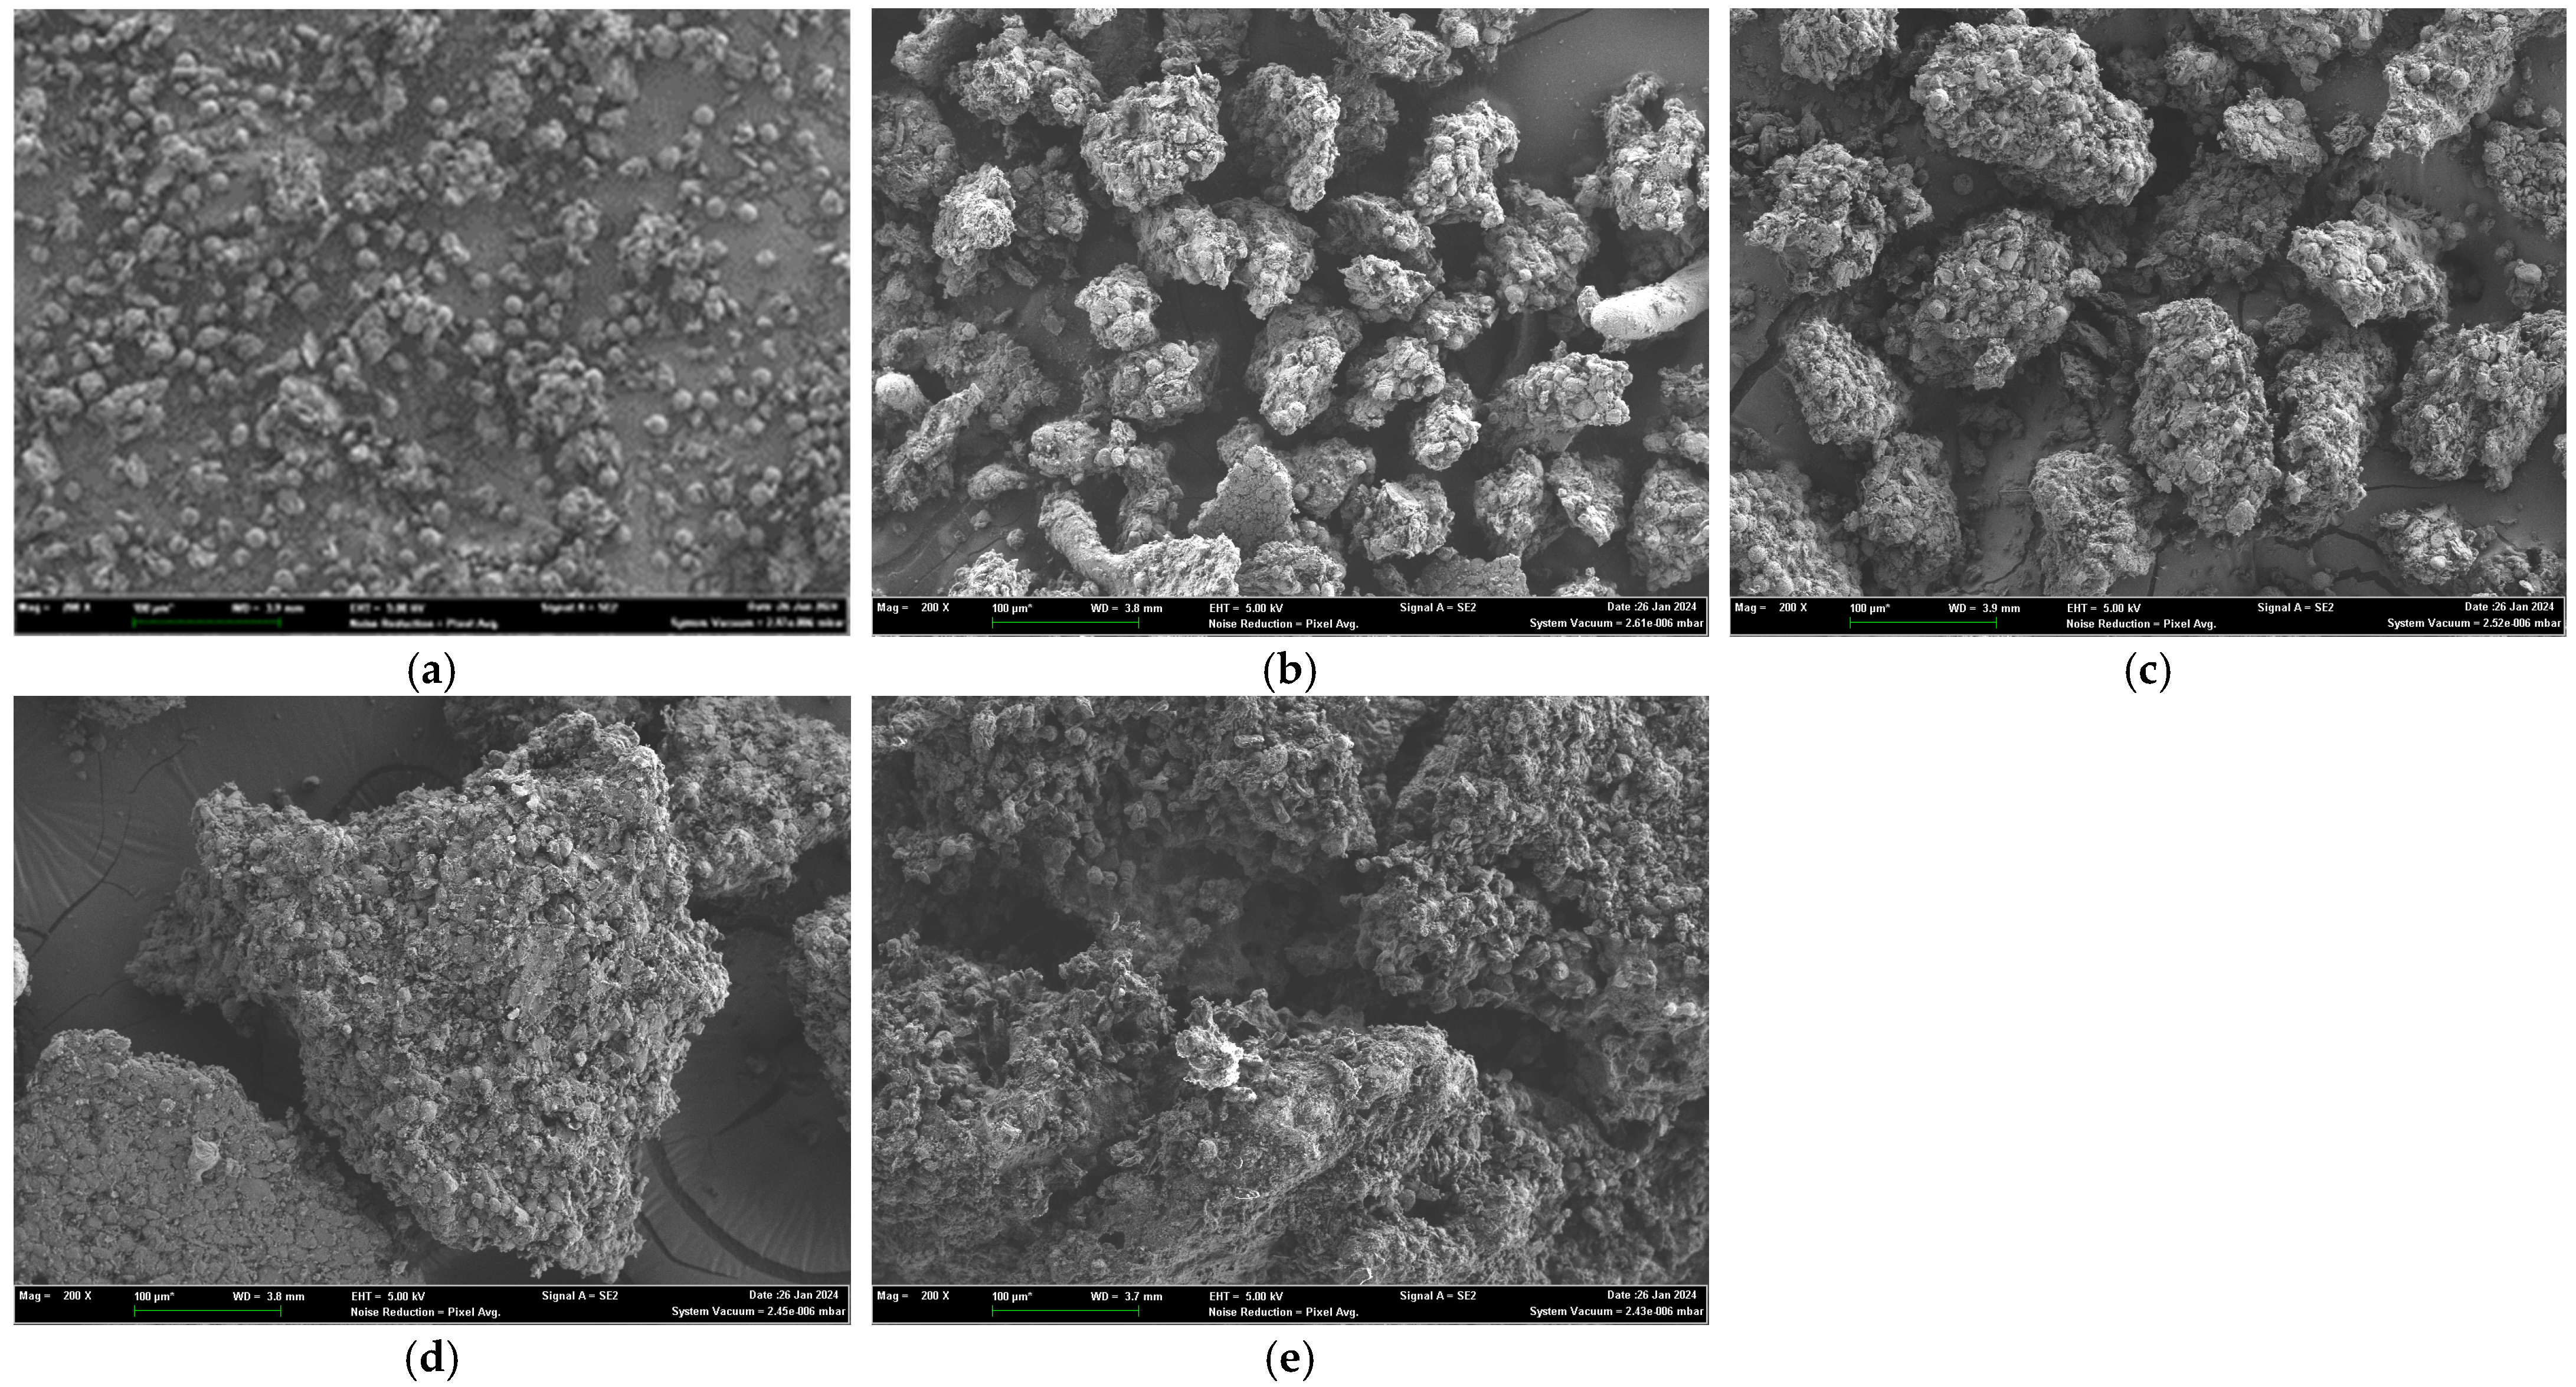
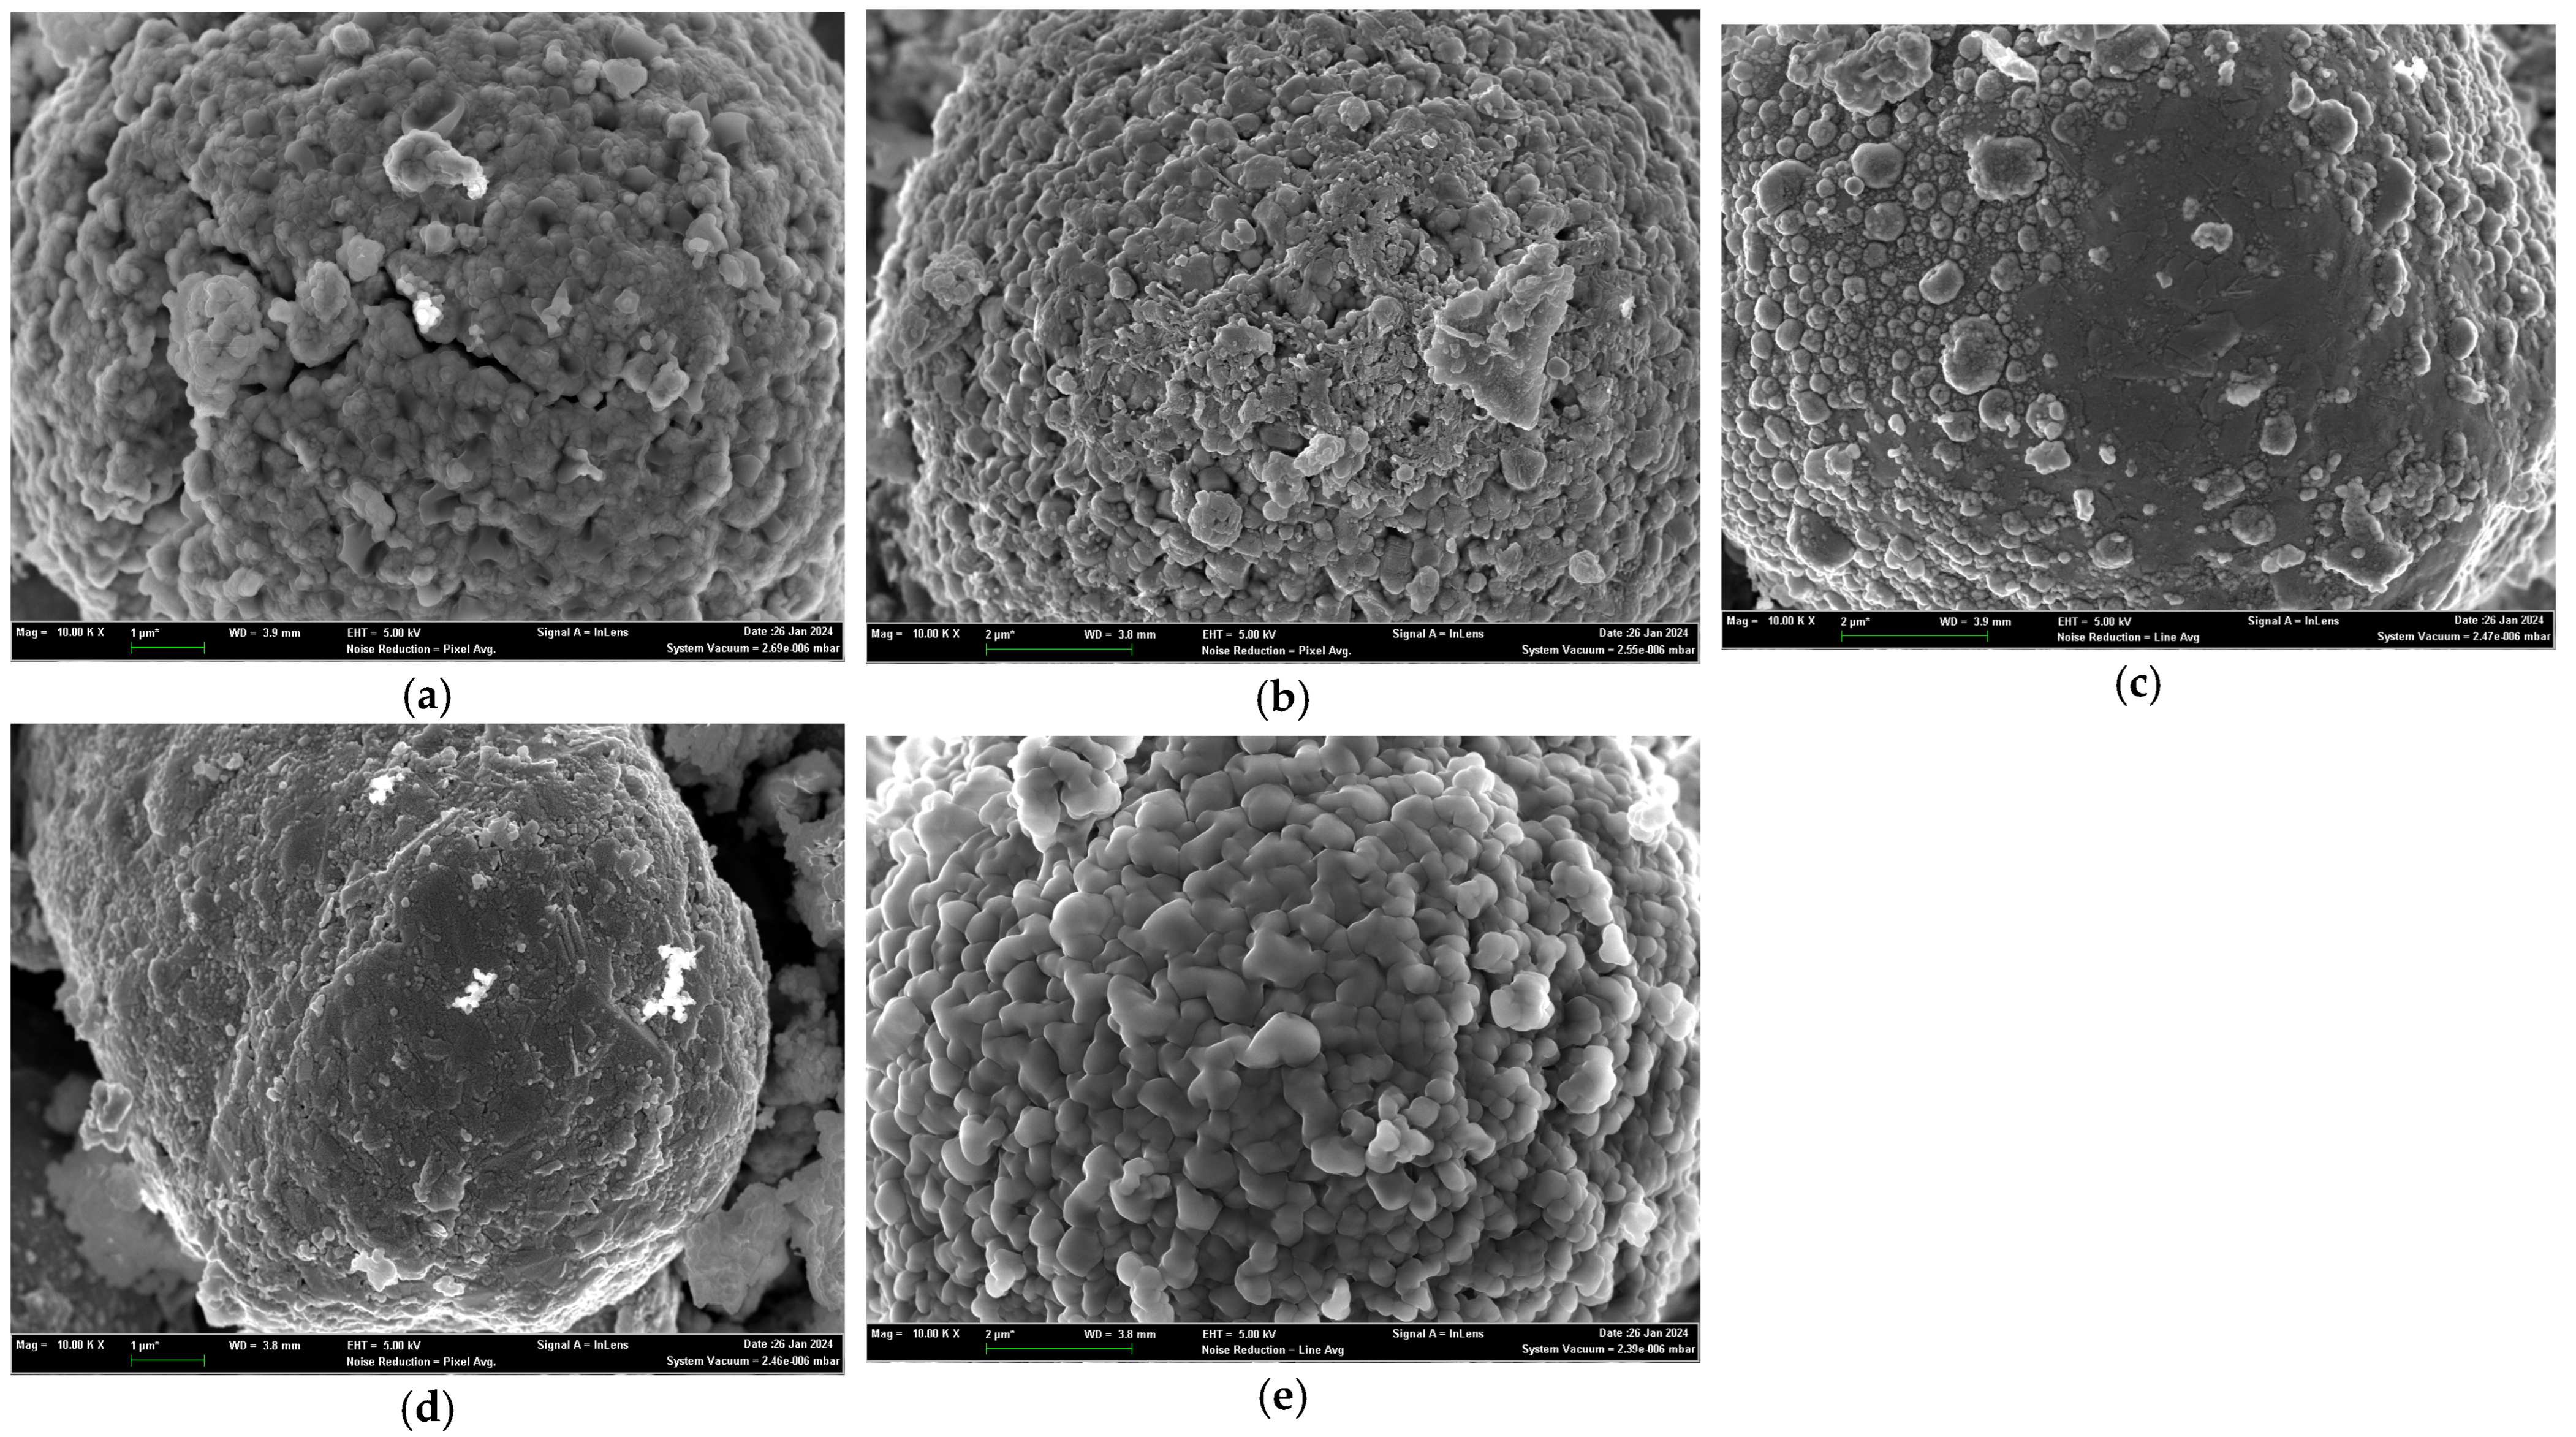
3.1.2. Scanning Electron Microscopy Results

Scanning electron microscopy (SEM) was used to conduct microscopic observations and photography of the five groups of particle samples at magnifications of 200×, 1000×, and 10,000×, respectively. It can be observed that as the particle size increases, the shape of the particles changes from spherical to flattened. Figure 5, Figure 6 and Figure 7 show the images captured at different magnifications.
EDS spectral analysis of the surface micro-regions of particles of different sizes revealed the presence of ten elements in the particles ejected during the TR of the battery: C, O, F, Al, Si, P, Mn, Co, Ni, and Cu (Li and H were not tested). Among these, Ni, Co, Mn, and O primarily originate from the cathode material, Al and Cu from the current collectors, C and Si from the anode material, and P and F likely from the electrolyte and binders. The results of the micro-regional EDS analysis are presented in Table 4; C and O are the main constituents of the ejected particles, constituting 55–90% of the elemental content of the particles. EDS analysis randomly selected the micro-surfaces of several particles, and there is measurement error associated with the equipment (see Table 4 for details). Therefore, the absence of Si and Cu elements in the 54–75 μm and 100–300 μm particles does not necessarily indicate that these elements are not present in the group of particles. All the detected elements show a non-monotonic relationship with particle size.

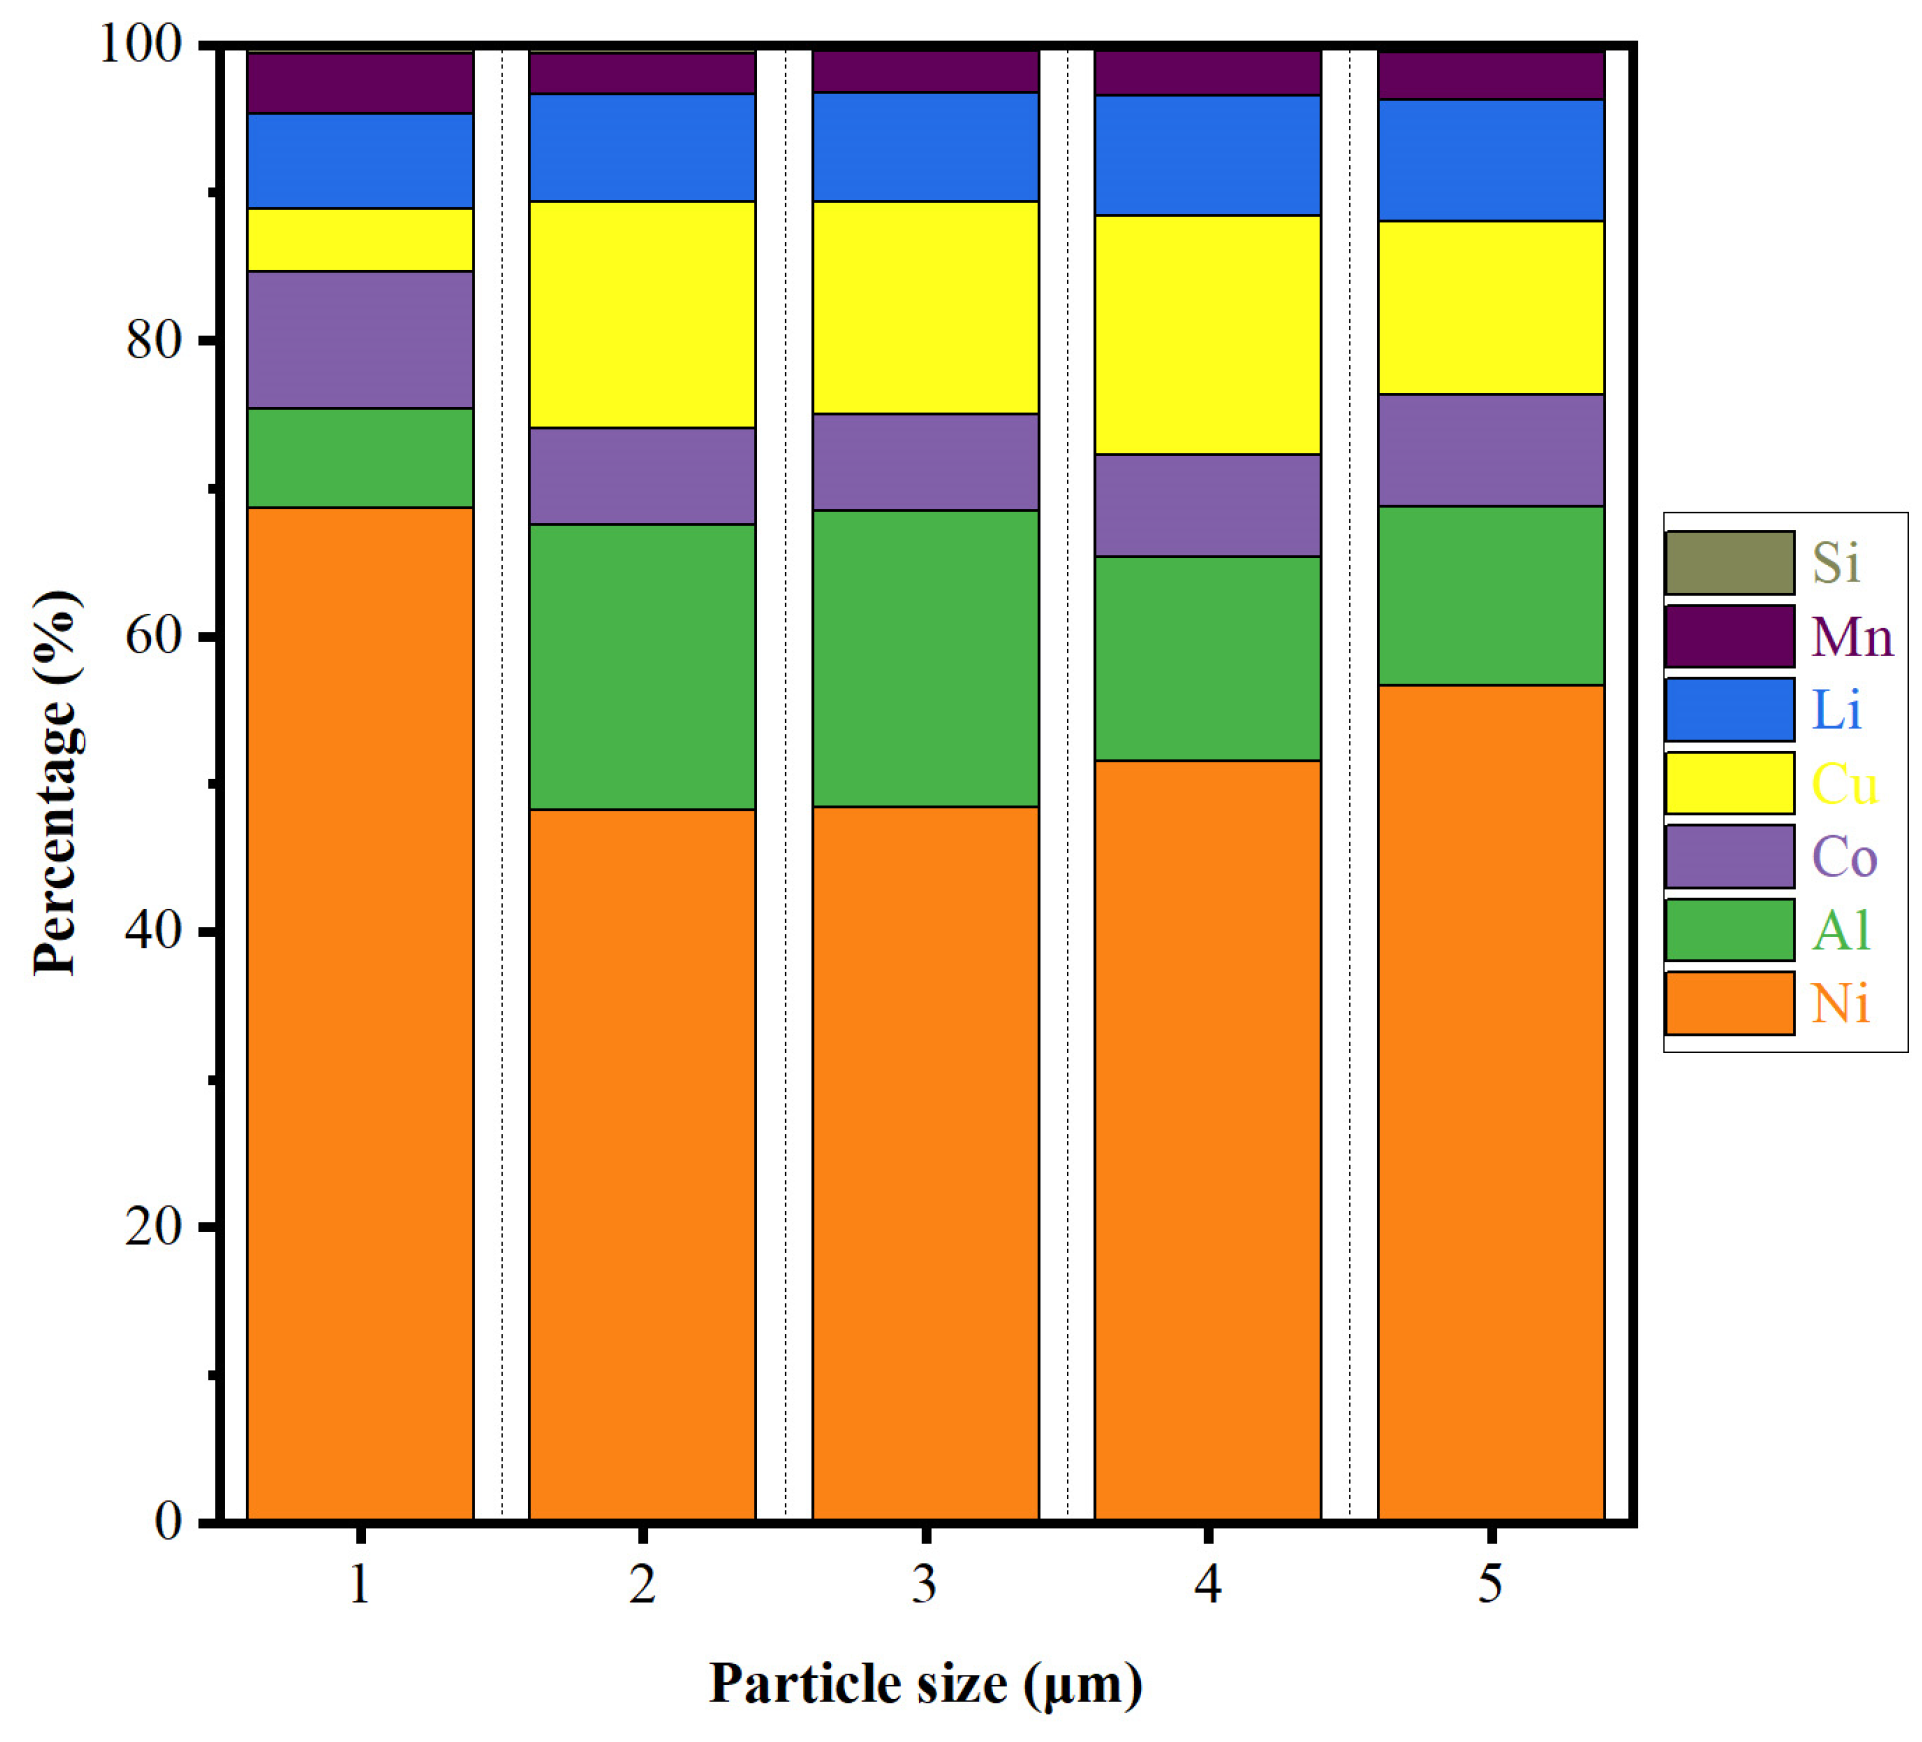
3.1.3. ICP-OES Elemental Analysis Results

The proportion of several major metal elements in the ejected particles was analyzed using an ICP plasma emission spectrometer, and the detection results are presented in Table 5. It can be observed that the most predominant metal element is Ni, and except for particles smaller than 54 μm, the composition and proportion of the major metal elements in the other particle groups are roughly the same. A histogram of the proportion of major metal elements is shown in Figure 8.

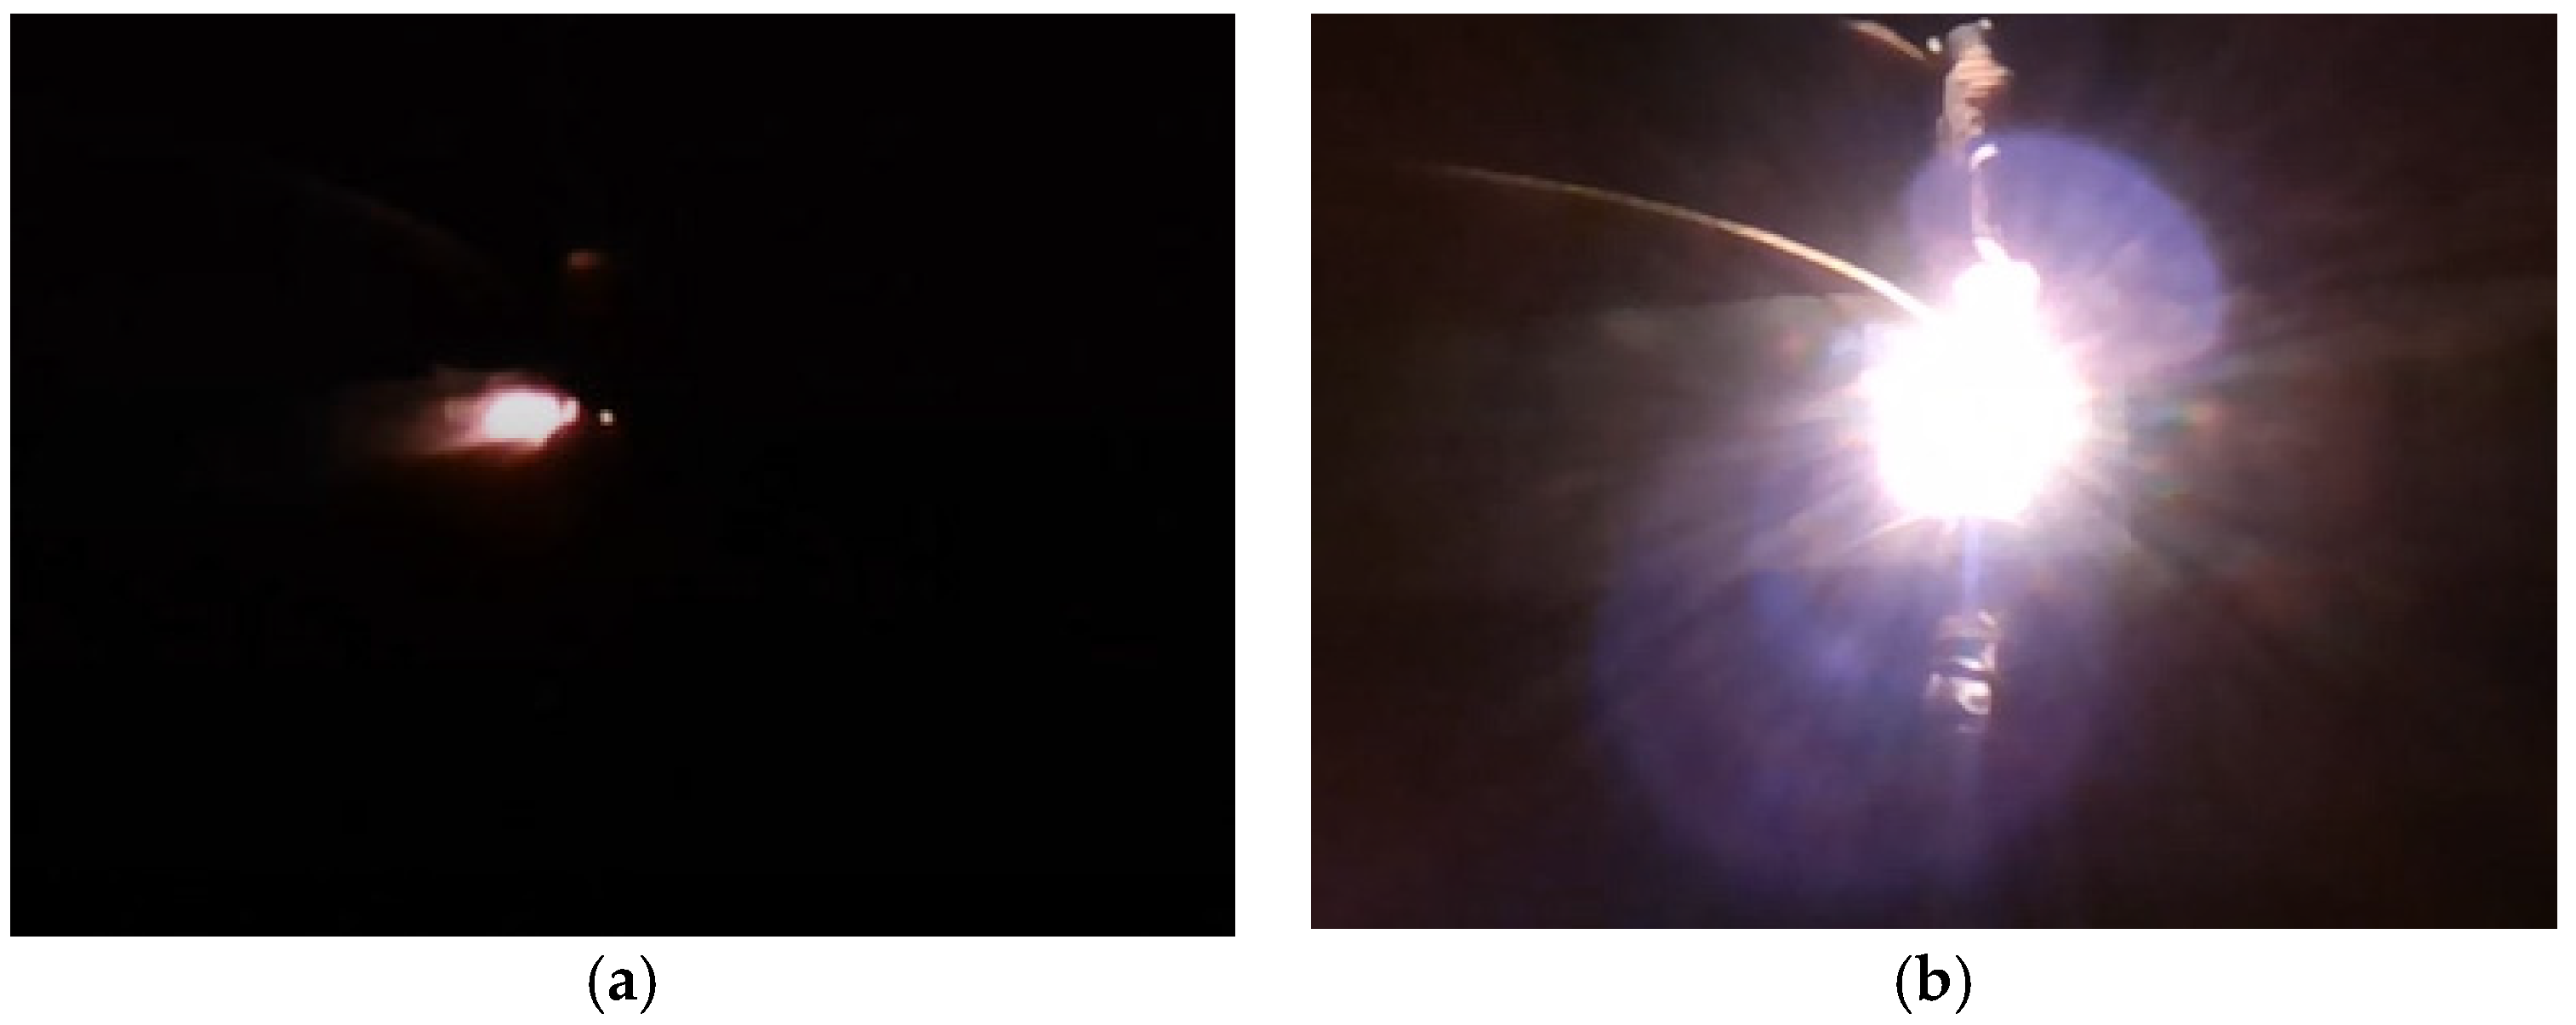
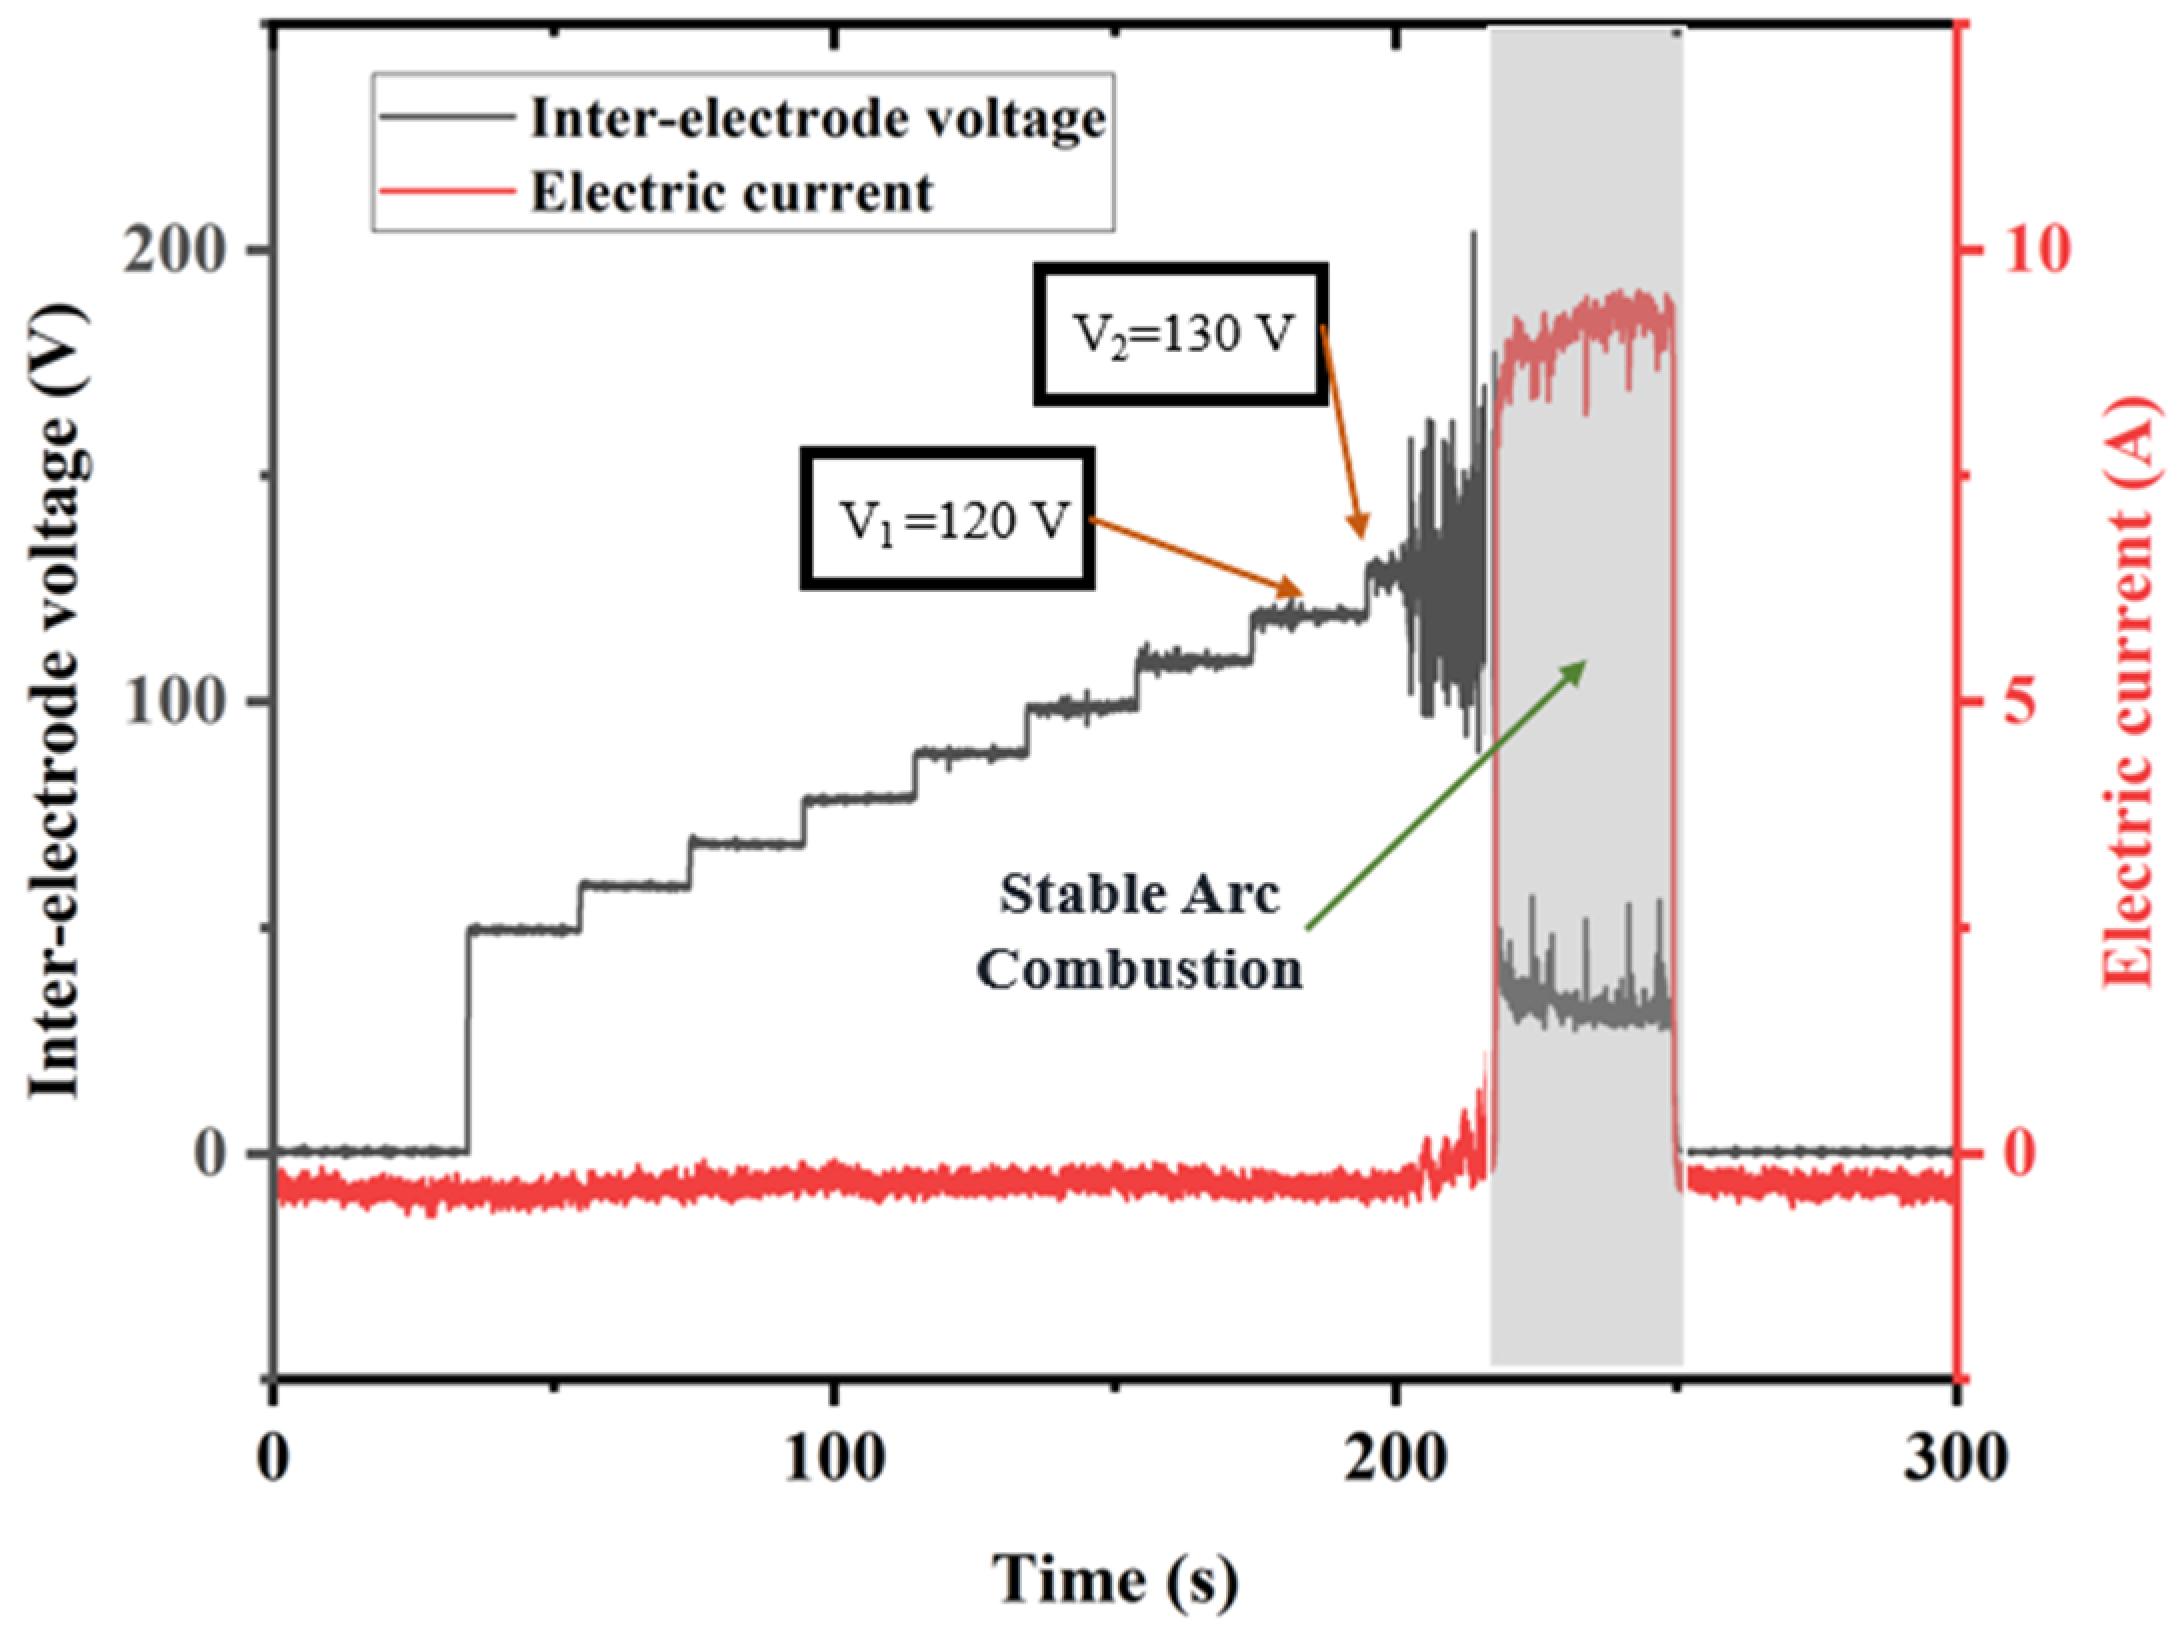
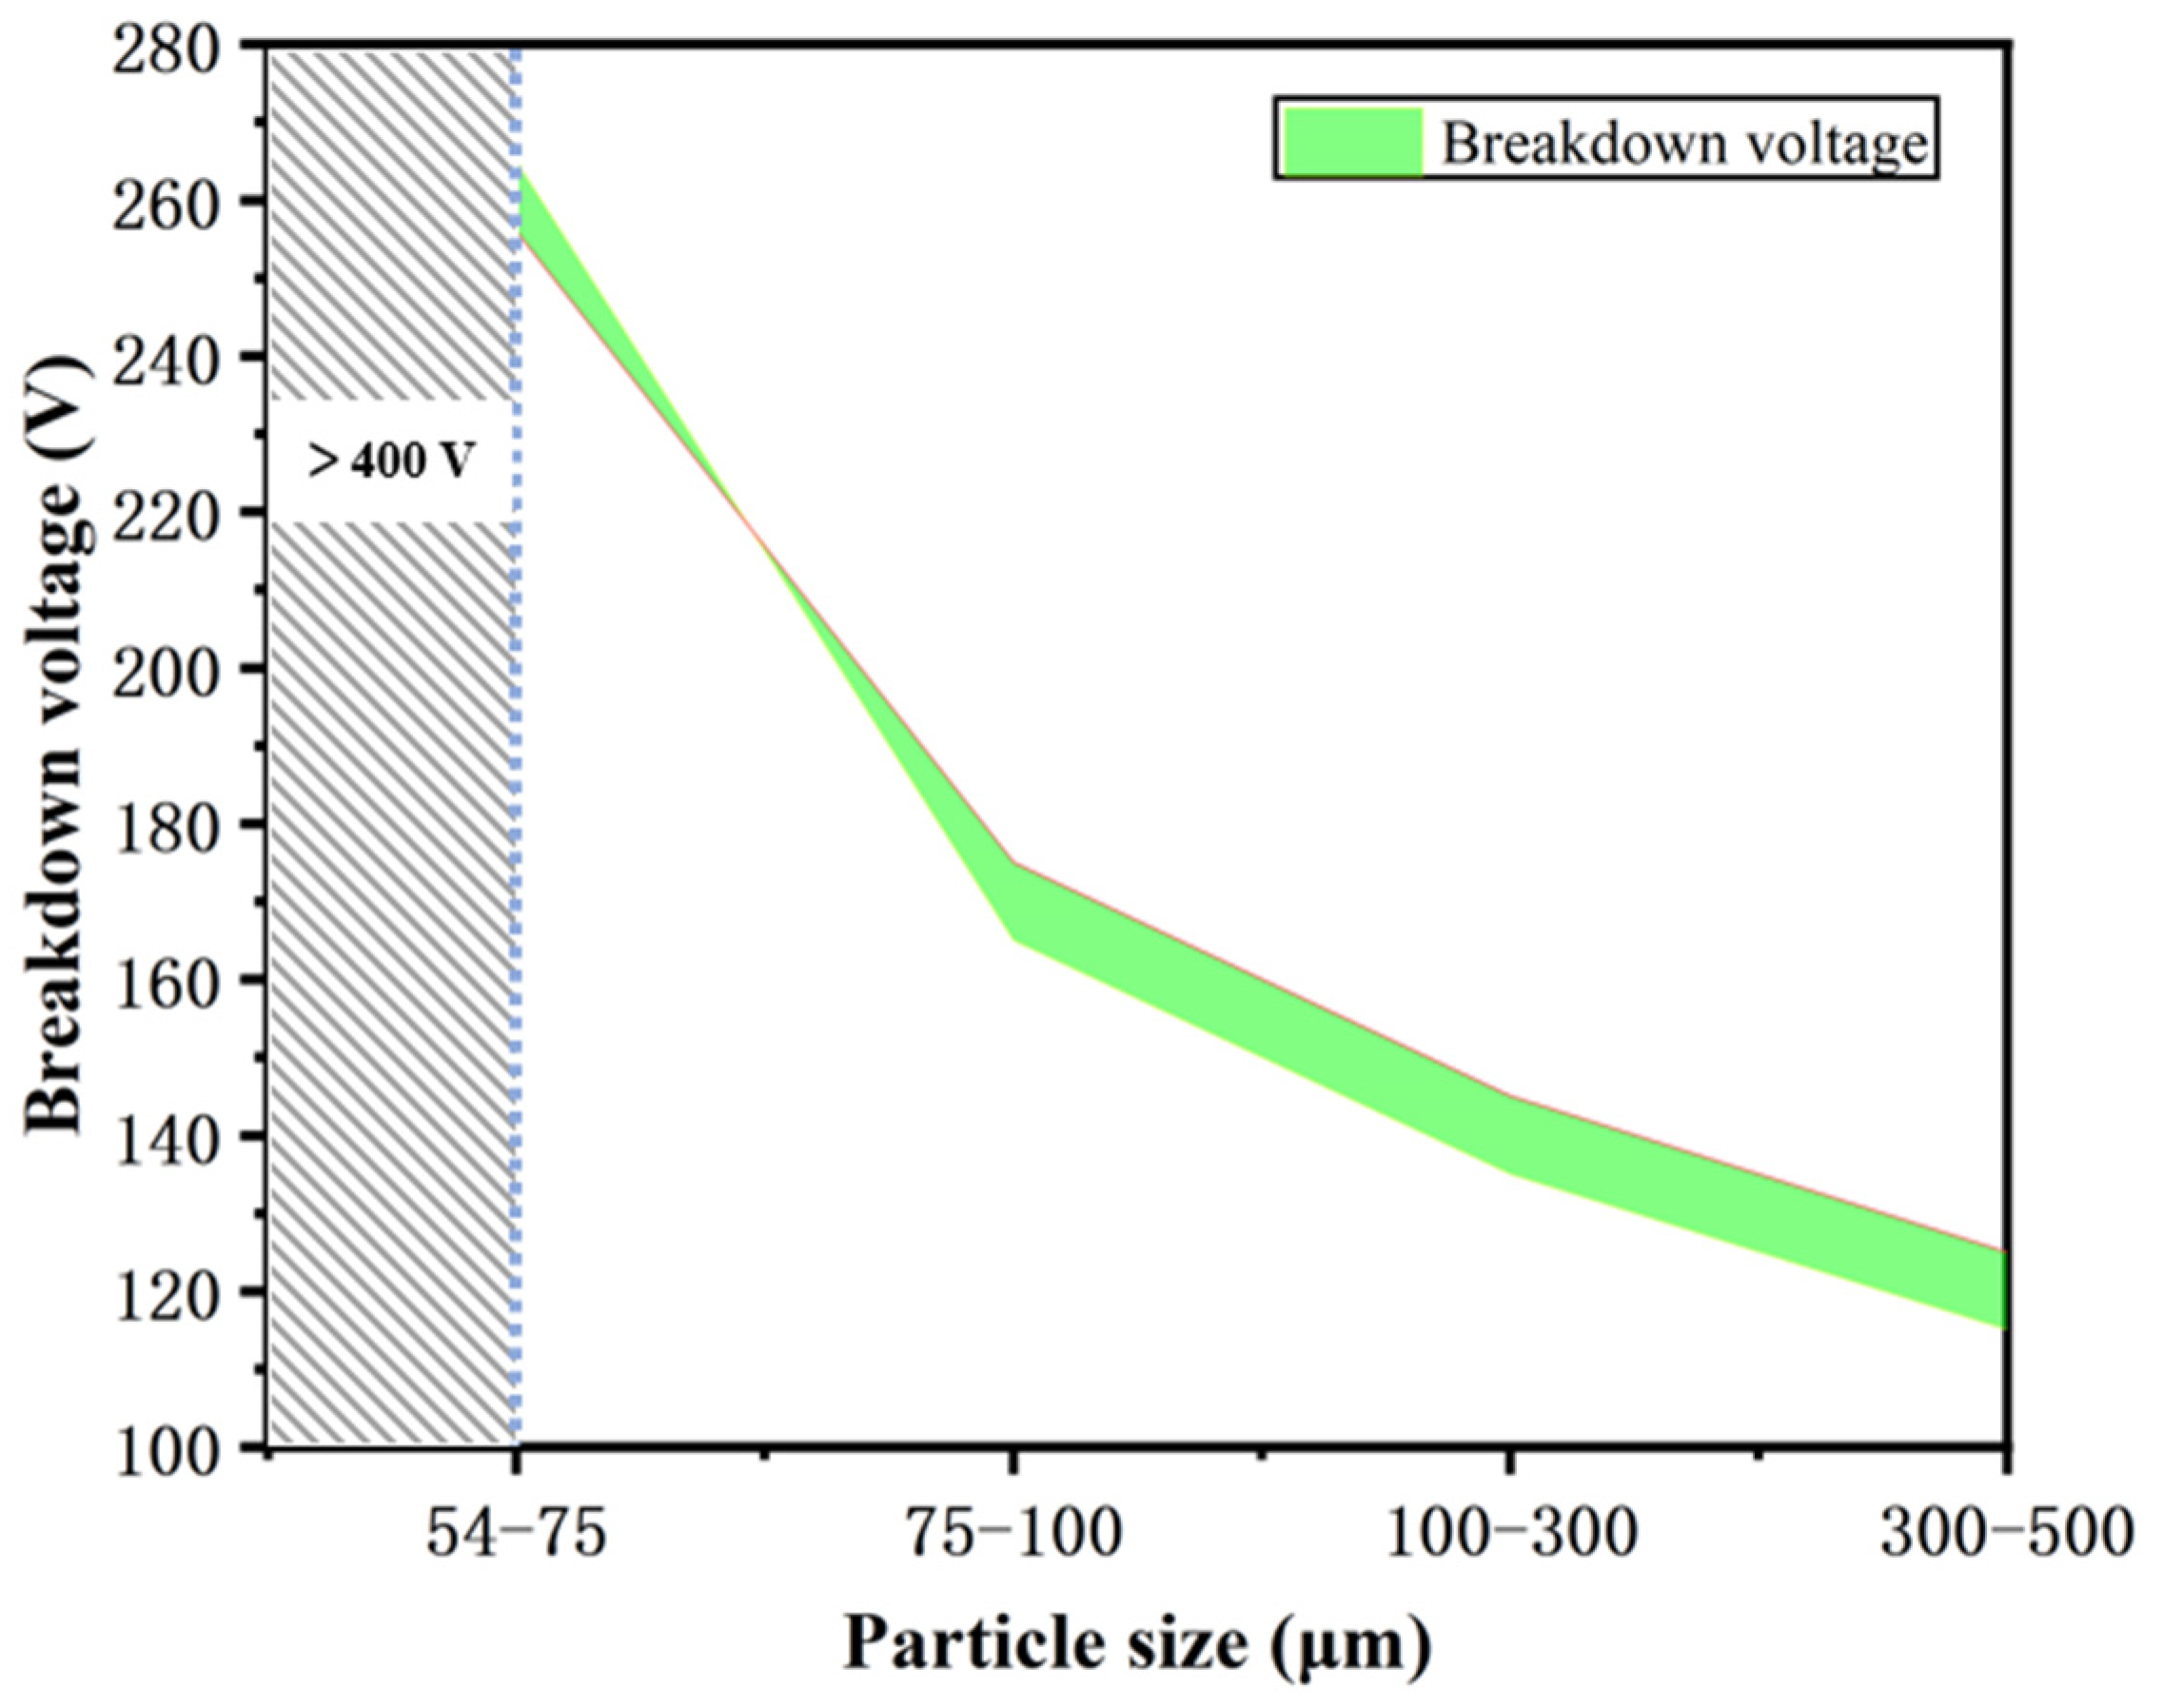
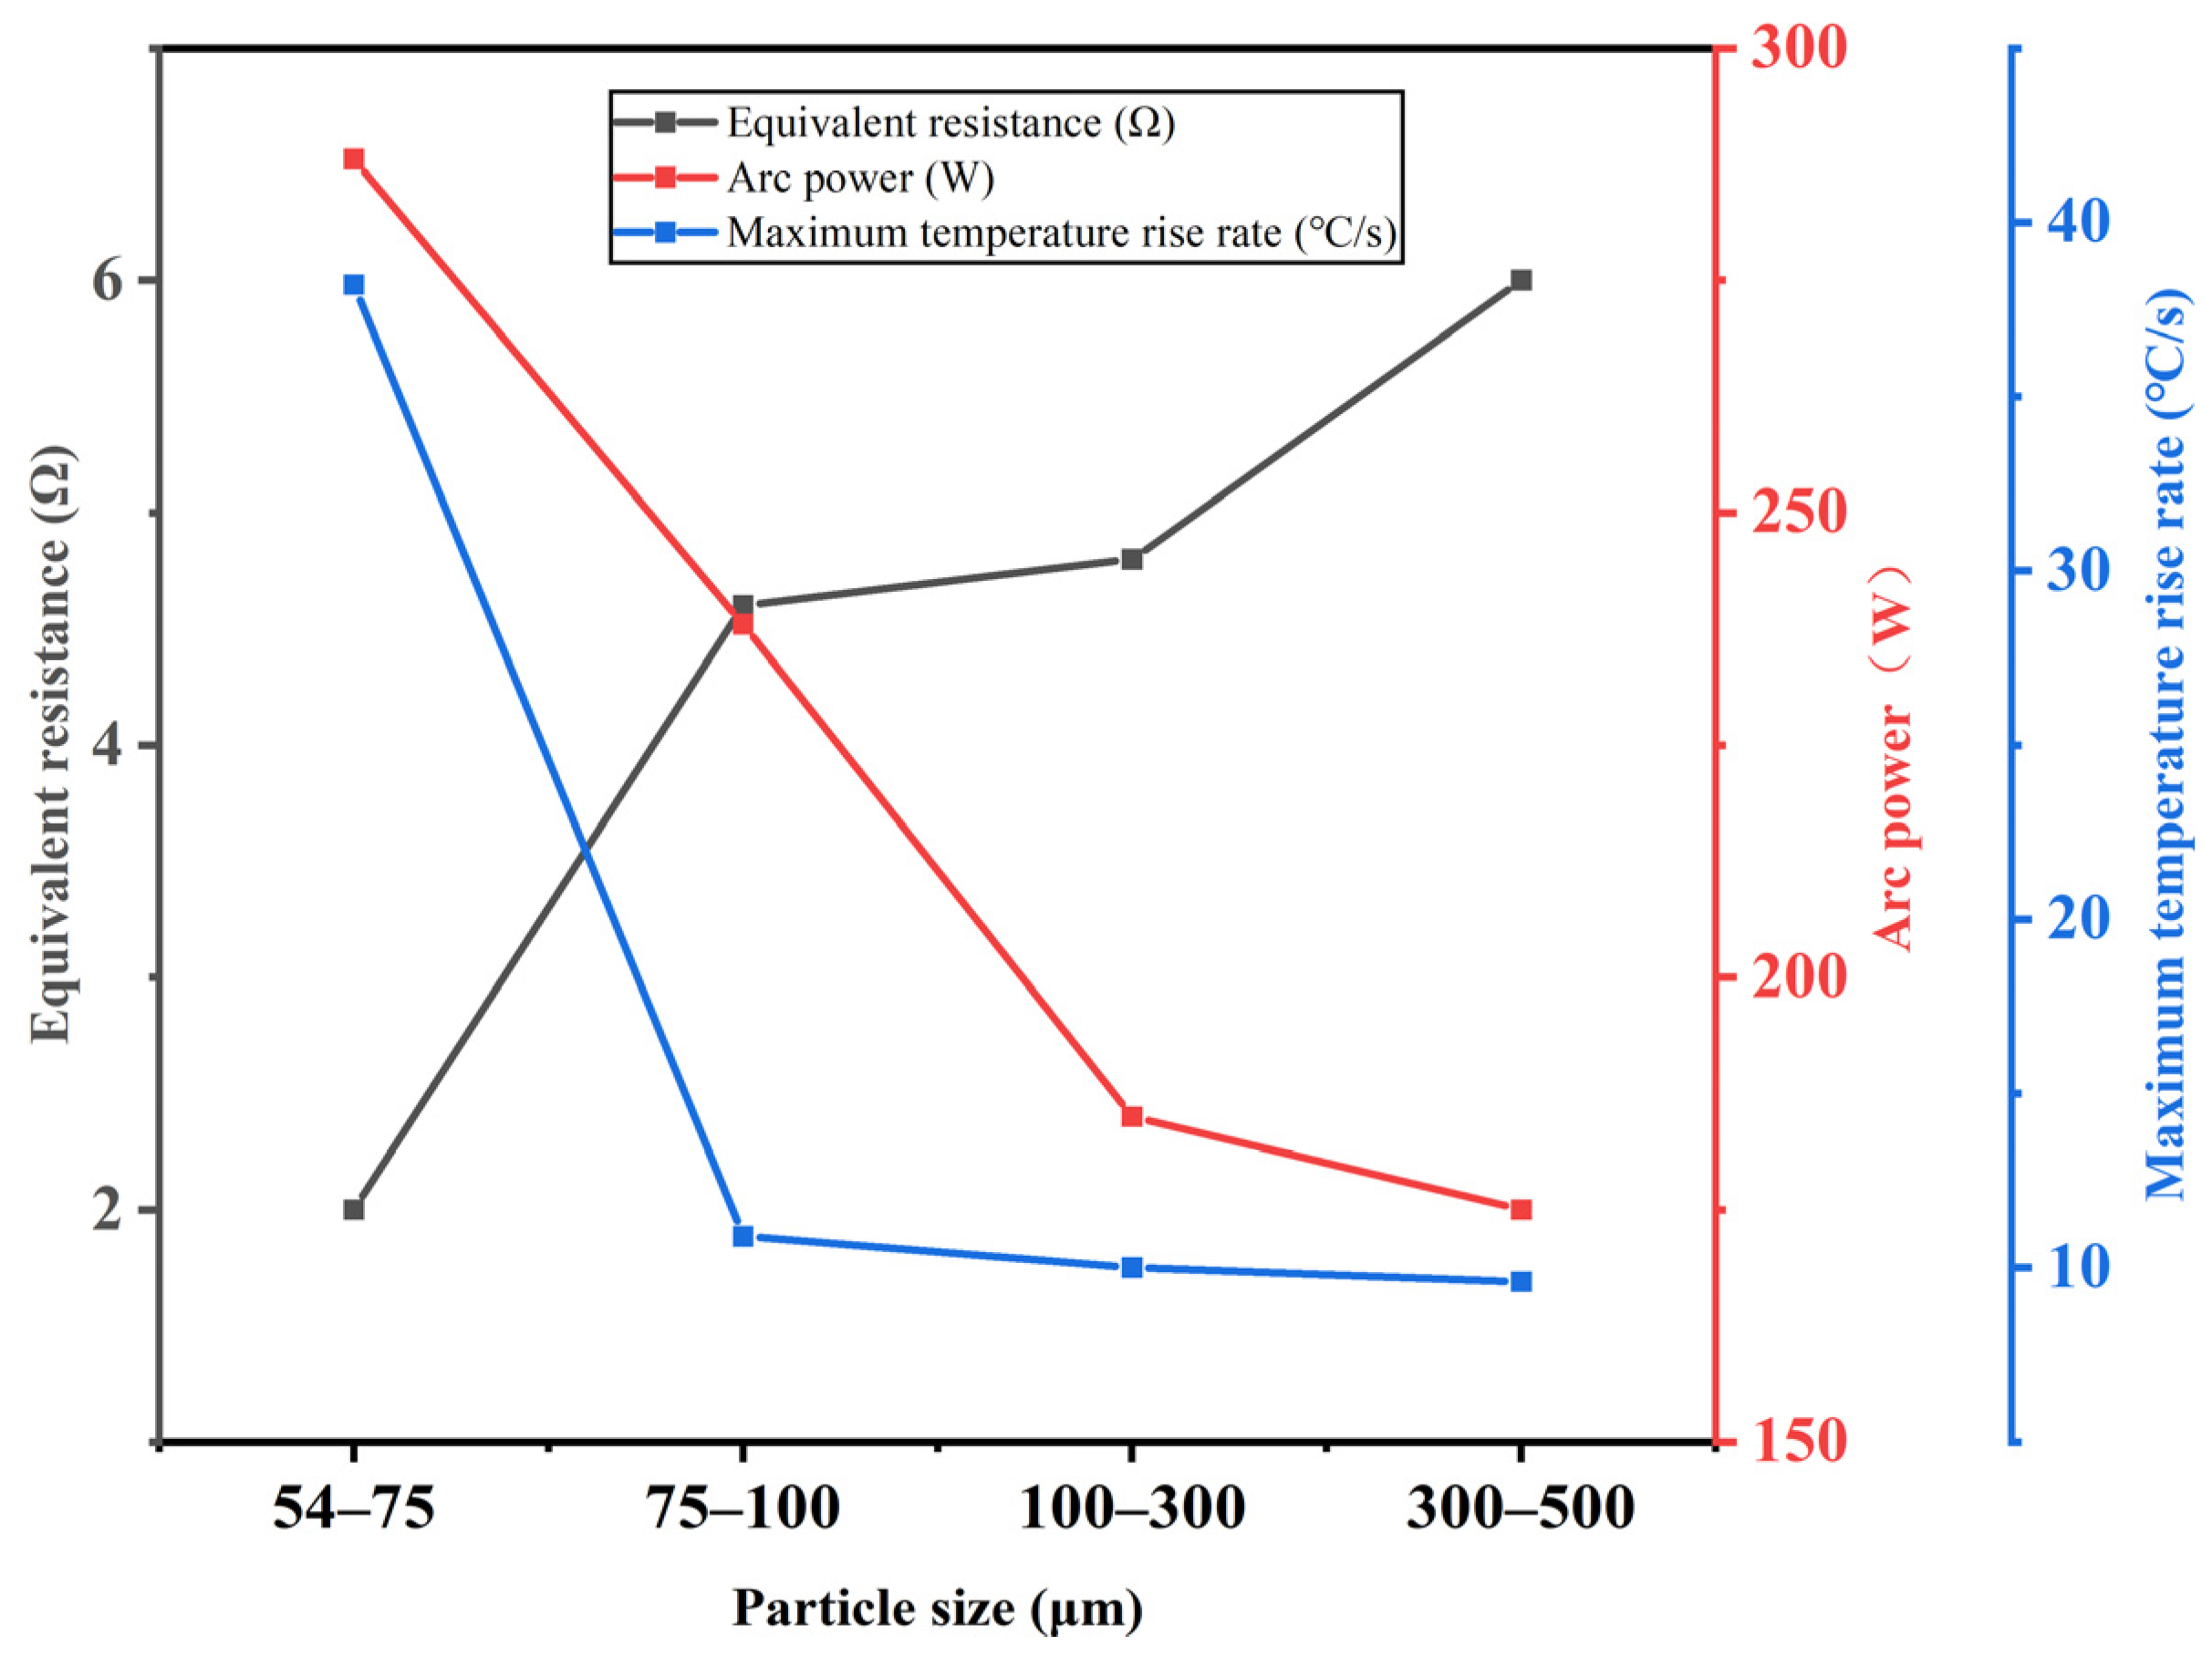
3.2. The Impact of Particles with Different Sizes on Arc Initiation

The TR of ternary LIBs can eject particles, which may trigger arc faults and is significantly more likely to form arcs than in air media. During the flow of the emitted fumes, due to the forces of gravity and buoyancy, there may be differences in the spatial distribution characteristics of particles of varying sizes, with smaller particles tending to disperse over a broader area, reaching more distant locations and thus affecting a larger region. The mechanisms by which particles of varying sizes induce arc formation between the gaps of identical or similar charged structures are expected to differ.
Selecting an electrode gap of 4 mm and a load resistance of 20 Ω, five groups of particles with different sizes were uniformly and freely filled into the electrode gap. The arc induction experiment with 300–500 μm particles was chosen as a typical case to illustrate the particle-induced arc phenomenon. As shown in Figure 9, the images before and after the experiment show the electrode gap filled with particles. It can be observed that there are distinct burn marks on the electrodes after arc combustion. Figure 10 is a video frame captured during the experiment, from which it can be seen that local corona discharge phenomena occur before the arc stabilizes; Figure 11 represents the data acquisition records of the voltage changes at the electrodes and the circuit current during the experimental process. Before the breakdown arc occurs, the voltage between the electrodes is approximately equal to the power supply voltage, with the circuit in an open state, and the series circuit current is almost zero. The power supply voltage initially increases from 50 V in steps, with a 10 V increment every 20 s. Shortly after the power supply voltage reaches 130 V, the series circuit becomes conductive, and the arc begins to stabilize combustion. According to Equation (2), the critical breakdown voltage for this case is determined to be 125 V. At this point, the arc can be considered as an equivalent resistance, and its equivalent resistance value, as well as the power of the arc itself, can be calculated based on the voltage across it and the circuit current.
Due to the uncontrollable randomness during the particle filling process, the critical breakdown voltage obtained from each experiment may also vary. Therefore, at least two replicate experiments are conducted for each particle size group. The range of critical breakdown voltages for the arc formation obtained from these experiments is shown in Figure 12; the green band indicates the critical range of voltage values that can trigger breakdown arcs corresponding to different particle sizes. It can be observed that in the experimental groups with particle sizes less than 54 μm, the required breakdown voltage exceeds the range of the adjustable DC power supply, which is 400 V. This means that when the particle size is less than 54 μm, a 400 V battery system is unlikely to produce an arc with particles of this size. As the particle size increases, the critical breakdown voltage required for arc initiation also decreases. That is, when the particle size is below 500 μm, the larger the particle size, the higher the likelihood of inducing an arc in the battery system.
According to Ohm’s law and the power calculation formula, Equations (3)–(5) can be used to approximately determine the equivalent resistance of the arc and the power during stable combustion, where Ri represents the equivalent resistance of the arc at moment i, Vai denotes the voltage across the arc at moment i, Ii represents the series circuit current at moment i, R represents the average equivalent resistance of the arc during the time it remains stable, n is the number of experimental data points taken during arc combustion, and P represents the power during arc combustion. Due to the continuous fluctuation of the voltage across the arc and the circuit current during combustion, the obtained values are only approximate averages. Figure 13 represents the changes in the approximate equivalent resistance and arc power during the arc initiation induced by different particle sizes, as well as the maximum temperature rise rate of the positive and negative electrodes during arc combustion. Since no arc was produced by particles below 54 μm, this group is not displayed in Figure 13.
R i = V a i I i
R = i = 1 n R i n
P = I 2 R
As shown in Figure 13, the thermal power of the arc decreases with the increase in particle size. This is intuitively reflected by the maximum temperature rise rate, which follows the same trend as the arc power. Moreover, the power change trend is consistent with the trend of the critical breakdown voltages required for arc initiation by particles of different sizes. The equivalent resistance of the arc, on the other hand, gradually increases with the increase in particle size.
A notable point is that after elemental analysis of the particulate matter, the compositional differences between particles of different sizes were found to be significant and could not be ignored. Further investigation is needed to determine whether this will have an impact on the experimental results.

3.3. The Impact of Different Electrode Gaps on Arc Initiation

When the battery system is functioning normally, the designed electrical gap should meet the specifications, resulting in a lower probability of arc fault occurrence. However, in the event of TR or thermal propagation within the battery system, the high-temperature smoke flow may melt the insulating layer on the surface of the charged structure after passing through the insulated coating area. Additionally, some charged structures may deform, creating conditions for a breakdown arc to occur.
As previously discussed in the section on arc induction by particles with a 4 mm electrode gap, particles in the 300–500 μm size range have the lowest critical breakdown voltage. Therefore, this section focuses on the effects of particle-induced arcs with this specific particle size group at different electrode gaps. The electrode gaps are set at 1 mm, 2 mm, 4 mm, 6 mm, and 8 mm, with the values chosen to be close to the electrical insulation gaps typically found in battery systems. Figure 14 presents the experimental results of the critical breakdown voltages required for particle-induced arcs at different electrode gaps, the blue band denotes the critical range of voltage values that can induce breakdown arcs corresponding to different electrode gap distances. As the electrode gap increases, the required critical breakdown voltage also increases. Figure 15 shows the changes in arc equivalent resistance, arc thermal power, and the maximum temperature rise rate of the electrode plates at different electrode gaps. The arc thermal power follows the same trend as the critical breakdown voltage, as does the maximum temperature rise rate, while the equivalent resistance exhibits an opposite trend.

3.4. The Impact of Different Load Resistance on Induced Arc Generation

In the particle-induced arc testing system, the circuit load acts as a protective resistor, limiting the excessive current when a breakdown arc is formed. The impact of the circuit load resistance on the critical breakdown conditions and characteristics of particle-induced arcs is not yet clear. In this experiment, particles in the 300–500 μm size range were selected, and the electrode gaps were set at 1 mm, 2 mm, and 4 mm. Under different electrode gaps, the protective resistors were set at 20 Ω and 30 Ω. The experimental results are shown in Figure 16, where, for ease of comparison, the critical breakdown voltage is selected as the minimum value from multiple repetitive experiments; this value represents the lower limit of the voltage at which a breakdown arc may occur during the experiment. It can be observed that under different electrode gaps, as the protective resistance increases, the critical breakdown voltage required for particle-induced arcs also increases. Moreover, as the electrode gap increases, the critical breakdown voltage values increase even more, indicating that when the breakdown environment itself requires a higher breakdown voltage, the circuit load resistance has a greater impact. Therefore, increasing the resistance of the circuit load can be considered as a protective measure to reduce the probability of arc fault occurrence in the circuit. As seen in the previous sections, the trends in equivalent resistance, thermal power, and the maximum temperature rise rate of the electrodes after the arc stabilizes are primarily related to the trend in required critical breakdown voltage; thus, these aspects are not further elaborated in this section.

4. Conclusions

In this study, the particles ejected after the TR of NCM811 were collected. The particles below 500 μm were screened out, accounting for over 90% of the total weight of the collected particles. The particles below 500 μm were then sorted into five groups by mesh size: 0–54 μm, 54–75 μm, 75–100 μm, 100–300 μm, and 300–500 μm. Characterization analysis was performed on these five groups of particulates. For the five groups of particles with different sizes, it was found that as the particle size decreased, the shape of the particles transitioned from flat to spherical. Through energy-dispersive X-ray spectroscopy analysis, a total of 10 elements, including C, O, F, Al, Si, P, Mn, Co, Ni, and Cu, were detected in the particles. The content of C and O was the highest, accounting for 55–90%, while among the metal elements, the content of Ni was the highest.
Subsequently, for the five groups of particles that were collected, an experiment was designed to investigate the induced arc by the particles. The effects of different particle sizes, different electrode gaps, and different load resistances on the critical breakdown voltage required for particle-induced arcs were examined. The experimental results revealed that, at the same electrode gap, the critical breakdown voltage needed for the arcs induced by the five groups of particles decreased as the particle size increased. For the same group of particles, as the electrode gap widened, the required breakdown voltage also increased. Additionally, when the load resistance in the circuit was increased, the breakdown voltage for arc induction by the same group of particles, at the same electrode gap, also increased. Therefore, the experimental results of this group can validate increasing the circuit load resistance, which could be considered as a protective measure to prevent breakdown arcs in the circuit. After the arc reached stable combustion, it could be regarded as an equivalent resistance. The power during arc combustion could be calculated based on the current and the voltage across the arc. The calculation results showed that, under experimental conditions with a single variable, the power of the arc followed the same trend as the required critical breakdown voltage.
Ultimately, a novel breakdown arc failure called the venting particle-induced arc was revealed in the battery system. The presence of particulate matter significantly reduces the breakdown voltage, which can lower the breakdown voltage from 400 V to approximately 120 V, thereby making the initiation of arcs more likely. This research can improve the electrical safety design of the LIB system. The method raised in this research for parametric evaluation and design can provide a theoretical guidance to improve the electrical safety of battery systems affected by venting particle-induced arc failure. Additionally, the influence of arc failure on battery TR also deserves great attention. However, the main work of this study focuses on collecting particulate matter from battery samples in a single system and conducting repetitive experiments. There is a lack of experimental results regarding different battery systems. Further research work is needed to address this issue.

Author Contributions

Conceptualization, Y.C. and Y.L.; methodology, Y.C. and Y.L.; software, Y.C.; validation, Y.C., W.X., and C.S.; formal analysis, Y.C. and J.W.; investigation, Y.C.; resources, Y.C. and C.L.; data curation, Y.C.; writing—original draft preparation, Y.C.; writing—review and editing, Y.L.; visualization, Y.C.; supervision, Y.L. and H.W.; project administration, Y.L. and H.W.; funding acquisition, Y.L. H.W., L.L., and M.L. All authors have read and agreed to the published version of the manuscript.

Funding

Our work is supported by the Ministry of Science and Technology of China (Grant No. 2022YFB2404800), the National Natural Science Foundation of China (Grant No. (Grant No. 52207241), and the China National Postdoctoral Program for Innovative Talents (grant no. BX20220171).

Data Availability Statement

The original contributions presented in the study are included in the article, further inquiries can be directed to the corresponding authors.

Acknowledgments

State Key Laboratory of Intelligent Green Vehicle and Mobility, Tsinghua University.

Conflicts of Interest

The authors declare no conflicts of interest.

References

  1. Li, X.Y.; Yuan, C.G.; Wang, Z.P.; He, J.T.; Yu, S.K. Lithium battery state-of-health estimation and remaining useful lifetime prediction based on non-parametric aging model and particle filter algorithm. eTransportation 2022, 11, 11. [Google Scholar] [CrossRef]
  2. Li, Y.L.; Wei, Y.F.; Zhu, F.Q.; Du, J.Y.; Zhao, Z.M.; Ouyang, M.G. The path enabling storage of renewable energy toward carbon neutralization in China. eTransportation 2023, 16, 11. [Google Scholar] [CrossRef]
  3. Steinstraeter, M.; Buberger, J.; Minnerup, K.; Trifonov, D.; Horner, P.; Weiss, B.; Lienkamp, M. Controlling cabin heating to improve range and battery lifetime of electric vehicles. eTransportation 2022, 13, 19. [Google Scholar] [CrossRef]
  4. Li, Y.L.; Feng, X.N.; Ren, D.S.; Ouyang, M.G.; Lu, L.G.; Han, X.B. Thermal Runaway Triggered by Plated Lithium on the Anode after Fast Charging. ACS Appl. Mater. Interfaces 2019, 11, 46839–46850. [Google Scholar] [CrossRef] [PubMed]
  5. Sun, P.Y.; Bisschop, R.; Niu, H.H.; Huang, X.Y. A Review of Battery Fires in Electric Vehicles. Fire Technol. 2020, 56, 1361–1410. [Google Scholar] [CrossRef]
  6. Wang, Q.S.; Ping, P.; Zhao, X.J.; Chu, G.Q.; Sun, J.H.; Chen, C.H. Thermal runaway caused fire and explosion of lithium ion battery. J. Power Sources 2012, 208, 210–224. [Google Scholar] [CrossRef]
  7. Fernandes, Y.; Bry, A.; De Persis, S. Identification and quantification of gases emitted during abuse tests by overcharge of a commercial Li-ion battery. J. Power Sources 2018, 389, 106–119. [Google Scholar] [CrossRef]
  8. Meng, X.; Li, S.; Fu, W.; Chen, Y.; Duan, Q.; Wang, Q. Experimental study of intermittent spray cooling on suppression for lithium iron phosphate battery fires. eTransportation 2022, 11, 100142. [Google Scholar] [CrossRef]
  9. Piao, N.; Gao, X.; Yang, H.; Guo, Z.; Hu, G.; Cheng, H.-M.; Li, F. Challenges and development of lithium-ion batteries for low temperature environments. eTransportation 2022, 11, 100145. [Google Scholar] [CrossRef]
  10. Finegan, D.P.; Scheel, M.; Robinson, J.B.; Tjaden, B.; Hunt, I.; Mason, T.J.; Millichamp, J.; Di Michiel, M.; Offer, G.J.; Hinds, G. In-operando high-speed tomography of lithium-ion batteries during thermal runaway. Nat. Commun. 2015, 6, 6924. [Google Scholar] [CrossRef]
  11. Sloop, S.E.; Kerr, J.B.; Kinoshita, K. The role of Li-ion battery electrolyte reactivity in performance decline and self-discharge. J. Power Sources 2003, 119, 330–337. [Google Scholar] [CrossRef]
  12. Zhang, Y.J.; Wang, H.W.; Li, W.F.; Li, C.; Ouyang, M.G. Size distribution and elemental composition of vent particles from abused prismatic Ni-rich automotive lithium-ion batteries. J. Energy Storage 2019, 26, 7. [Google Scholar] [CrossRef]
  13. Bolshova, T.; Shvartsberg, V.; Shmakov, A.G. Synergism of trimethylphosphate and carbon dioxide in extinguishing premixed flames. Fire Saf. J. 2021, 125, 103406. [Google Scholar] [CrossRef]
  14. Weiss, M.; Ruess, R.; Kasnatscheew, J.; Levartovsky, Y.; Levy, N.R.; Minnmann, P.; Stolz, L.; Waldmann, T.; Wohlfahrt-Mehrens, M.; Aurbach, D.; et al. Fast charging of lithium-ion batteries: A review of materials aspects. Adv. Energy Mater. 2021, 11, 2101126. [Google Scholar] [CrossRef]
  15. Saada, R.; Patel, D.; Saha, B. Causes and consequences of thermal runaway incidents—Will they ever be avoided? Process Saf. Environ. Prot. 2015, 97, 109–115. [Google Scholar] [CrossRef]
  16. Xu, B.; Lee, J.; Kwon, D.; Kong, L.; Pecht, M. Mitigation strategies for Li-ion battery thermal runaway: A review. Renew. Sustain. Energy Rev. 2021, 150, 111437. [Google Scholar] [CrossRef]
  17. Galushkin, N.; Yazvinskaya, N.; Galushkin, D.N. Mechanism of thermal runaway in lithium-ion cells. J. Electrochem. Soc. 2018, 165, A1303. [Google Scholar] [CrossRef]
  18. Mallick, S.; Gayen, D. Thermal behaviour and thermal runaway propagation in lithium-ion battery systems—A critical review. J. Energy Storage 2023, 62, 106894. [Google Scholar] [CrossRef]
  19. Eoker, G. Electrode-components-of-the-arc-discharge. In Ergebnisse der Exakten Naturwissenschaften; Springer: Berlin/Heidelberg, Germany, 1961; pp. 1–104. [Google Scholar]
  20. Rabie, M.; Franck, C.M. Comparison of gases for electrical insulation: Fundamental concepts. IEEE Trans. Dielectr. Electr. Insul. 2018, 25, 649–656. [Google Scholar] [CrossRef]
  21. Ammerman, R.F.; Gammon, T.; Sen, P.K.; Nelson, J.P. Dc Arc Models and Incident Energy Calculations. In Proceedings of the 56th Annual Petroleum and Chemical Industry Conference, Anaheim, CA, USA, 14–16 September 2009; p. 61. [Google Scholar]
  22. Shkol’nik, S.M. Anode phenomena in arc discharges: A review. Plasma Sources Sci. Technol. 2011, 20, 31. [Google Scholar] [CrossRef]
  23. Hoerauf, R.; Shipp, D.D. Characteristics and applications of various arc interrupting methods. IEEE Trans. Ind. Appl. 1991, 27, 849–861. [Google Scholar] [CrossRef]
  24. Dashti, R.; Daisy, M.; Mirshekali, H.; Shaker, H.R.; Aliabadi, M.H. A survey of fault prediction and location methods in electrical energy distribution networks. Measurement 2021, 184, 30. [Google Scholar] [CrossRef]
  25. Guo, L.; Ke, X.; Tang, Y.; Chen, Y.; Li, Y.; Liu, Z. Design of Arc Fault Detection Method and Test System for New Energy Automobiles. Insul. Mater. 2018, 51, 74–79. [Google Scholar] [CrossRef]
  26. New Energy Vehicles Are Suspected to Self-Ignition during Draging, with Sparks Emitting from the Bottom Accompanied by Explosive Sounds. Available online: https://tv.sohu.com/v/dXMvMzg1MjY0MzIzLzQyMzY5MzQ3Mi5zaHRtbA==.html?key=/v/dXMvMzg1MjY0MzIzLzQyMzY5MzQ3Mi5zaHRtbA==.html&vid=423693472 (accessed on 10 May 2024).
  27. Fisher Engineering, Inc. Report of Technical Findings: Victorian Big Battery Fire; 2021. Available online: https://infrastructure.planninginspectorate.gov.uk/wp-content/ipc/uploads/projects/EN010106/EN010106-004097-DL2%20-%20Edmund%20Fordham%20EF20.pdf (accessed on 7 August 2024).
  28. Shen, H.; Wang, H.; Li, M.; Li, C.; Zhang, Y.; Li, Y.; Yang, X.; Feng, X.; Ouyang, M. Thermal runaway characteristics and gas composition analysis of lithium-ion batteries with different LFP and NCM cathode materials under inert atmosphere. Electronics 2023, 12, 1603. [Google Scholar] [CrossRef]
  29. Lu, S.; Phung, B.; Zhang, D. A comprehensive review on DC arc faults and their diagnosis methods in photovoltaic systems. Renew. Sustain. Energy Rev. 2018, 89, 88–98. [Google Scholar] [CrossRef]
  30. Xu, W.Q.; Wu, X.G.; Li, Y.L.; Wang, H.W.; Lu, L.G.; Ouyang, M.G. A comprehensive review of DC arc faults and their mechanisms, detection, early warning strategies, and protection in battery systems. Renew. Sust. Energ. Rev. 2023, 186, 21. [Google Scholar] [CrossRef]
  31. Wang, J. Simulation of gas discharge in tube and Paschen’s law. Opt. Photonics J. 2013, 3, 313–317. [Google Scholar] [CrossRef]
  32. Wang, R.G.; Ji, Q.Z.; Zhang, T.K.; Xia, Q.; Zhang, Y.; Ouyang, J.T. Discharge characteristics of a needle-to-plate electrode at a micro-scale gap. Plasma Sci. Technol. 2018, 20, 5. [Google Scholar] [CrossRef]
  33. Wang, G.Q.; Kong, D.P.; Ping, P.; Wen, J.; He, X.Q.; Zhao, H.L.; He, X.; Peng, R.Q.; Zhang, Y.; Dai, X.Y. Revealing particle venting of lithium-ion batteries during thermal runaway: A multi-scale model toward multiphase process. eTransportation 2023, 16, 20. [Google Scholar] [CrossRef]
  34. Börger, A.; Mertens, J.; Wenzl, H. Thermal runaway and thermal runaway propagation in batteries: What do we talk about? J. Energy Storage 2019, 24, 100649. [Google Scholar] [CrossRef]
  35. Liao, Z.; Zhang, S.; Li, K.; Zhang, G.; Habetler, T.G. A survey of methods for monitoring and detecting thermal runaway of lithium-ion batteries. J. Power Sources 2019, 436, 226879. [Google Scholar] [CrossRef]
  36. Ledinski, T.; Golubkov, A.W.; Schweighofer, O.; Erker, S. Arcing in Li-Ion Batteries. Batteries 2023, 9, 21. [Google Scholar] [CrossRef]
  37. Shahid, S.; Agelin-Chaab, M. A review of thermal runaway prevention and mitigation strategies for lithium-ion batteries. Energy Convers. Manag. X 2022, 16, 100310. [Google Scholar] [CrossRef]
  38. Shi, Z.; Kang, Y.; Zhang, J.; Li, S.; Li, H. A novel theoretical model of gas–solid two-phase flow mixed dielectric discharge. Phys. Fluids 2022, 34, 113309. [Google Scholar] [CrossRef]
  39. Kong, L.; Li, Y.; Feng, W. Strategies to solve lithium battery thermal runaway: From mechanism to modification. Electrochem. Energy Rev. 2021, 4, 633–679. [Google Scholar] [CrossRef]
  40. Yao, W.; He, Z.; Deng, H.; Wang, G.; Zhang, M.; Ma, J.; Li, J.; Ye, Q.; Hu, H. Effects of Macroparticle Sizes on Two-phase Mixture Discharge Under DC Voltage. Proc. CSEE 2012, 32, 144–151. [Google Scholar]
  41. Li, W.F.; Xue, Y.; Feng, X.B.; Rao, S.; Zhang, T.Y.; Gao, Z.H.; Guo, Y.M.; Zhou, H.Y.; Zhao, H.Y.; Song, Z.L.; et al. Characteristics of particle emissions from lithium-ion batteries during thermal runaway: A review. J. Energy Storage 2024, 78, 17. [Google Scholar] [CrossRef]
  42. Yao, W.J.; He, Z.H.; Deng, H.M.; Li, J.; Ma, J. Experimental Investigation of Two-Phase Mixture Discharges Under DC Voltage From Effects of Macroparticle Sizes. IEEE Trans. Plasma Sci. 2011, 39, 856–864. [Google Scholar] [CrossRef]
  43. Fukuoka, Y.; Yasuoka, T.; Kato, K.; Okubo, H. Breakdown conditioning characteristics of long gap electrodes in a vacuum. IEEE Trans. Dielectr. Electr. Insul. 2007, 14, 577–582. [Google Scholar] [CrossRef]
  44. Pilan, N.; Deambrosis, S.M.; De Lorenzi, A.; Fincato, M.; Fontana, C.; Gobbo, R.; Lotto, L.; Martines, E.; Mc Cormack, O.; Pasqualotto, R.; et al. Study of high DC voltage breakdown between stainless steel electrodes separated by long vacuum gaps. Nucl. Fusion 2020, 60, 17. [Google Scholar] [CrossRef]
  45. Li, C.; Wang, H.; Li, Y.; Lu, L. Venting Particle-induced Arc of Lithium-ion Batteries During the Thermal Runaway. eTransportation 2024, 22, 100350. [Google Scholar] [CrossRef]
Figure 1. Experimental system. (a) The schematic diagram of venting particle collection; (b) the collection process of particulate matter; (c) Malvern Particle Size Analyzer 2000 and field emission scanning electron microscope analysis yielded size distribution curves and average particle size within the range of 0.02–2000 μm and the composition of metallic elements contained in particle; (d) the schematic diagram of breakdown arc tests, and the images of arc generating area before the test.
Electronics 13 03168 g001
Figure 2. Mass fraction of particles with different particle sizes.
Electronics 13 03168 g002
Figure 3. Particle-induced arc testing system.
Electronics 13 03168 g003
Figure 4. Cumulative distribution curves for different particle size groups.
Electronics 13 03168 g004
Figure 5. Scanning electron microscopy image of ejected particles magnified by 0.2×10³×: (a) 0–54 μm; (b) 54–75 μm; (c) 75–100 μm; (d) 100–300 μm; (e) 300–500 μm.
Electronics 13 03168 g005
Figure 6. Scanning electron microscopy image of ejected particles magnified by 1×10³×: (a) 0–54 μm; (b) 54–75 μm; (c) 75–100 μm; (d) 100–300 μm; (e) 300–500 μm.
Electronics 13 03168 g006
Figure 7. Scanning electron microscopy image of ejected particles magnified by 1×10⁴×: (a) 0–54 μm; (b) 54–75 μm; (c) 75–100 μm; (d) 100–300 μm; (e) 300–500 μm.
Electronics 13 03168 g007
Figure 8. Metal elemental composition ratio of different particle groups.
Electronics 13 03168 g008
Figure 9. (a) Before the test; (b) after the test. Comparison images before and after particle-induced arc testing.
Electronics 13 03168 g009
Figure 10. (a) Partial corona discharge; (b) stable arc combustion. Phenomenon of particle-induced arc testing.
Electronics 13 03168 g010
Figure 11. Particle-induced arc testing curve.
Electronics 13 03168 g011
Figure 12. Different particle sizes critical arc-induced breakdown voltage.
Electronics 13 03168 g012
Figure 13. Arc-induced characteristics parameters of particles with different particle sizes.
Electronics 13 03168 g013
Figure 14. Critical breakdown voltage of particle-induced arc with different electrode gaps.
Electronics 13 03168 g014
Figure 15. Arc-induced characteristics parameters of particles with different electrode gaps.
Electronics 13 03168 g015
Figure 16. Breakdown voltage of particle-induced arc with different protective resistance.
Electronics 13 03168 g016
Table 1. Parameter information of the sample battery.
CategoryNCM811
ShapePouch cell
Capacity (Ah)71
Voltage ceiling (V)4.25
Voltage floor (V)2.8
Specific energy (Wh/Kg)331.6
Battery weight (g)910
State of charge (SOC)100%
Table 2. Information on the structural composition of the sample battery.
CategoryComposition
AnodeGraphite
Cathode current collectorCu
Anode current collectorAl
SeparatorPolyethylene (PE)
SaltLiPF6
Table 3. Particle size analysis of battery ejection particles.
Particle Size (μm)D (0.1) 1D (0.5)D (0.9)Average Particle Size (μm)Highest Proportion (μm)
0–543.05411.53827.84614.18512.619
54–757.45268.10974.06955.663.246
75–10010.34681.093116.90181.38490.237
100–30020.496168.775326.968178.776200
300–500113.876361.002644.56375.681447.744
1 D (0.1), D (0.5), and D (0.9) represent the equivalent spherical diameters of the particles corresponding to cumulative volume fractions of 10%, 50%, and 90%, respectively. (The error range is ±1%–±5%.)
Table 4. EDS micro-area composition analysis of ejected particles weight% (wt%).
Particle Size (μm)0–5454–7575–100100–300300–500
C59.544.86060.771.9
O11.410.9141518.3
F3.83.13.23.53
Al1.712.66.71.90.6
Si0.300.100.2
P1.10.81.11.10.8
Mn1.21.40.71.30.4
Co2.63.41.62.50.7
Ni18.22312.5143.8
Cu0.200.100.3
For major elements (>20 wt%), the allowable relative error is ≤±5%. Similarly, (±3 wt% ≤ content ≤ 20 wt%)—≤10%; (±1 wt% ≤ content ≤ 3 wt%)—≤30%; ±0.5 wt% ≤ content ≤ 1 wt%—≤50%.
Table 5. ICP metal elemental composition analysis of ejected particles (wt%).
Particle Size (μm)0–5454–7575–100100–300300–500
Al3.3810.110.66.76.15
Co4.633.423.443.383.86
Cu2.138.057.577.95.94
Li3.233.813.913.924.16
Mn2.031.481.481.481.68
Ni34.425.325.525.128.8
Si0.290.290.220.210.23
The error range for Ni is <15%; for Si, it is <2%; and for the other elements, it is <10%.
Disclaimer/Publisher’s Note: The statements, opinions and data contained in all publications are solely those of the individual author(s) and contributor(s) and not of MDPI and/or the editor(s). MDPI and/or the editor(s) disclaim responsibility for any injury to people or property resulting from any ideas, methods, instructions or products referred to in the content.

