Article

Integrated Mixed Attention U-Net Mechanisms with Multi-Stage Division Strategy Customized for Accurate Estimation of Lithium-Ion Battery State of Health

School of Automation, Central South University, Changsha 410083, China
*
Author to whom correspondence should be addressed.
Electronics 2024, 13(16), 3244; https://doi.org/10.3390/electronics13163244
Submission received: 18 July 2024 / Revised: 11 August 2024 / Accepted: 12 August 2024 / Published: 15 August 2024

Abstract

:
As a core component of electric vehicles, the state of health (SOH) of lithium-ion battery has a direct impact on vehicle performance and safety. Existing data-driven models primarily focus on feature extraction, often overlooking the processing of multi-level redundant information and the utilization of multi-stage battery features. To address the issues, this paper proposes a novel data-driven method, named multi-stage mixed attention U-Net (MMAU-Net), for SOH estimation, which is based on both the phased learning and an encoder–decoder structure. First, the geometric knee-point division method is proposed to divide the battery life cycle into multiple stages, which allows the model to learn the distinctive features of battery degradation at each stage. Second, to adeptly capture degraded features and reduce redundant information, we propose a mixed attention U-Net model for the SOH prediction task, which is constructed upon the fundamental U-Net backbone and is enhanced with time step attention and feature attention modules. The experimental results validate the proposed method’s feasibility and efficacy, demonstrating an acceptable performance across a spectrum of evaluative metrics. Consequently, this study offers a research within the domain of battery health management.

1. Introduction

With increasing global attention on sustainable energy and environmental protection, the new energy automobile industry has ushered in rapid development. As the core component of an electric vehicle, the performance and safety of the power battery are directly related to the overall performance of the vehicle. Lithium-ion batteries are widely used because of their small size, high energy density, long cycle life, and low self-discharge rate [1]. Battery state of health (SOH) is a metric that characterizes available or remaining life. However, due to the inherent aging mechanism of the battery, its performance will decrease, resulting in the decrease in available capacity and the increase in internal resistance [2]. These changes will deteriorate the battery SOH and seriously affect the efficiency and safety of the battery. Therefore, an accurate assessment of the battery SOH is crucial to ensure the performance and safety of electric vehicles.
In recent years, researchers have developed various methods, which are mainly divided into two categories: model-based methods and data-driven methods [3]. In the model-based method, SOH estimation is achieved by using different physical or empirical models to describe the aging behavior or degradation process of the battery. According to different theoretical principles, model-based methods are mainly divided into the equivalent circuit model [4], electrochemical model [5,6], or empirical model [7,8,9]. However, while the model-based approach is physically meaningful and helpful in understanding battery health, it is limited by high model complexity, high computational cost, difficulty in parameter identification, and poor adaptability to unknown or changing operating conditions.
In contrast, the data-driven methods do not need to consider the complex inherent aging mechanism of the battery, and SOH prediction is based on the external measurable physical quantities such as voltage and current under battery working conditions [10,11,12]. Data-driven methods include traditional machine learning and deep learning methods. Traditional machine learning refers to the process of using traditional statistical and mathematical methods to represent data by manually designing features that are used to train machine learning models. Richardson et al. [13] proposed a method based on Gaussian process regression to predict battery SOH. A Bayesian nonparametric model was constructed by selecting a kernel function and incorporating prior knowledge. Klass et al. [14] input the actual vehicle battery data into the support vector machine for training and obtained the estimated capacity of the battery through a virtual standard performance test. Li et al. [15] performed incremental capacity (IC) analysis on data recorded in voltage intervals, selected characteristic inputs, and established a random forest regression model to realize battery SOH estimation. However, traditional machine learning relied on artificial feature engineering for feature extraction, and the expressive power of its learning model was relatively limited, making it difficult to solve complex pattern recognition problems. In contrast, deep learning-based methods used deep neural networks to automatically learn the data feature representation, without the need to extract features and training models step by step, which enabled deep learning to deal with complex high-dimensional data and improve analysis accuracy [16,17]. Zhang et al. [18] used IC curve information as a feature, and used a long short-term memory (LSTM) network to estimate SOH based on health feature variables. Hong et al. [19] extracted the operating data of real vehicles, cleaned and sliced them, and used a gated recurrent unit (GRU) network to predict battery SOH. Chen et al. [20] used partial constant voltage (CV) charging data and differential current data as input, and used a convolutional neural network (CNN) model to predict SOH. Liu et al. [21] performed principal component and empirical analysis on the charging and discharging experimental curves of lithium-ion batteries, and used the improved temporal convolutional network to train and process these multi-features. Ma et al. [22] used the Bacon–Watts model to determine the inflection point in the capacity degradation curve as the starting point of SOH prediction, and established the bi-directional long short-term memory (BiLSTM) model to predict battery SOH. Lee et al. [23] transformed capacity degradation data into two-dimensional images using recurrence plots and Gramian angular fields, and developed five types of CNN model to estimate the SOH value of lithium-ion batteries in a certain cycle. Although the recurrent neural network (RNN) and CNN have the ability to automatically extract time or spatial features in battery SOH prediction, when facing complex feature extraction, they may generate more feature redundancy information, which affects the efficiency of feature extraction and prediction accuracy.
To address the above issues, scholars have added an attention module to the base model that can capture key information and dependencies in a timely manner and overcome the effects of long-term trends, short-term fluctuations, cyclical patterns, and random noise. Zou et al. [24] integrated the attention mechanism into a deep recurrent attention network model and proposed a method for SOH estimation of lithium-ion batteries based on time decay feature extraction and deep recurrent attention network. Lin et al. [25] proposed an attentional LSTM network for estimating battery SOH. The network incorporated local attention into the LSTM model and calculated the attentional weight coefficients using a fixed window center. Although a single attention can capture key information and dependencies in timing data, its ability to characterize the attention was limited, focusing on only one specific aspect or region of the input, which limited its ability to capture global and complex dependencies. He et al. [26] proposed a multi-scale convolutional attention module consisting of channel attention and spatial attention and a hybrid neural network model integrated with a residual module for battery SOH estimation. Hong et al. [27] proposed a new attention-based two-stage RNN for battery SOH estimation by combining a multi-head attention mechanism and a scaling dot product attention mechanism with an LSTM network. However, it was necessary to select the attention mechanism suitable for the input data format and dimension in combination with specific tasks.
To solve the mentioned problem, this paper proposes a multi-stage mixed attention U-Net (MMAU-Net) method for battery SOH estimation. Its framework is shown in Figure 1. The main contributions of this paper are as follows:
  • An MMAU-Net method using a multi-stage strategy and a mixed-attention mechanism is proposed to accurately estimate battery SOH, which is more effective in extracting the aging information of batteries at multiple stages.
  • A multi-stage division method based on geometric knee point segmentation is proposed to divide the battery’s multi-level degradation feature stages to enable the network to extract and recognize features more efficiently.
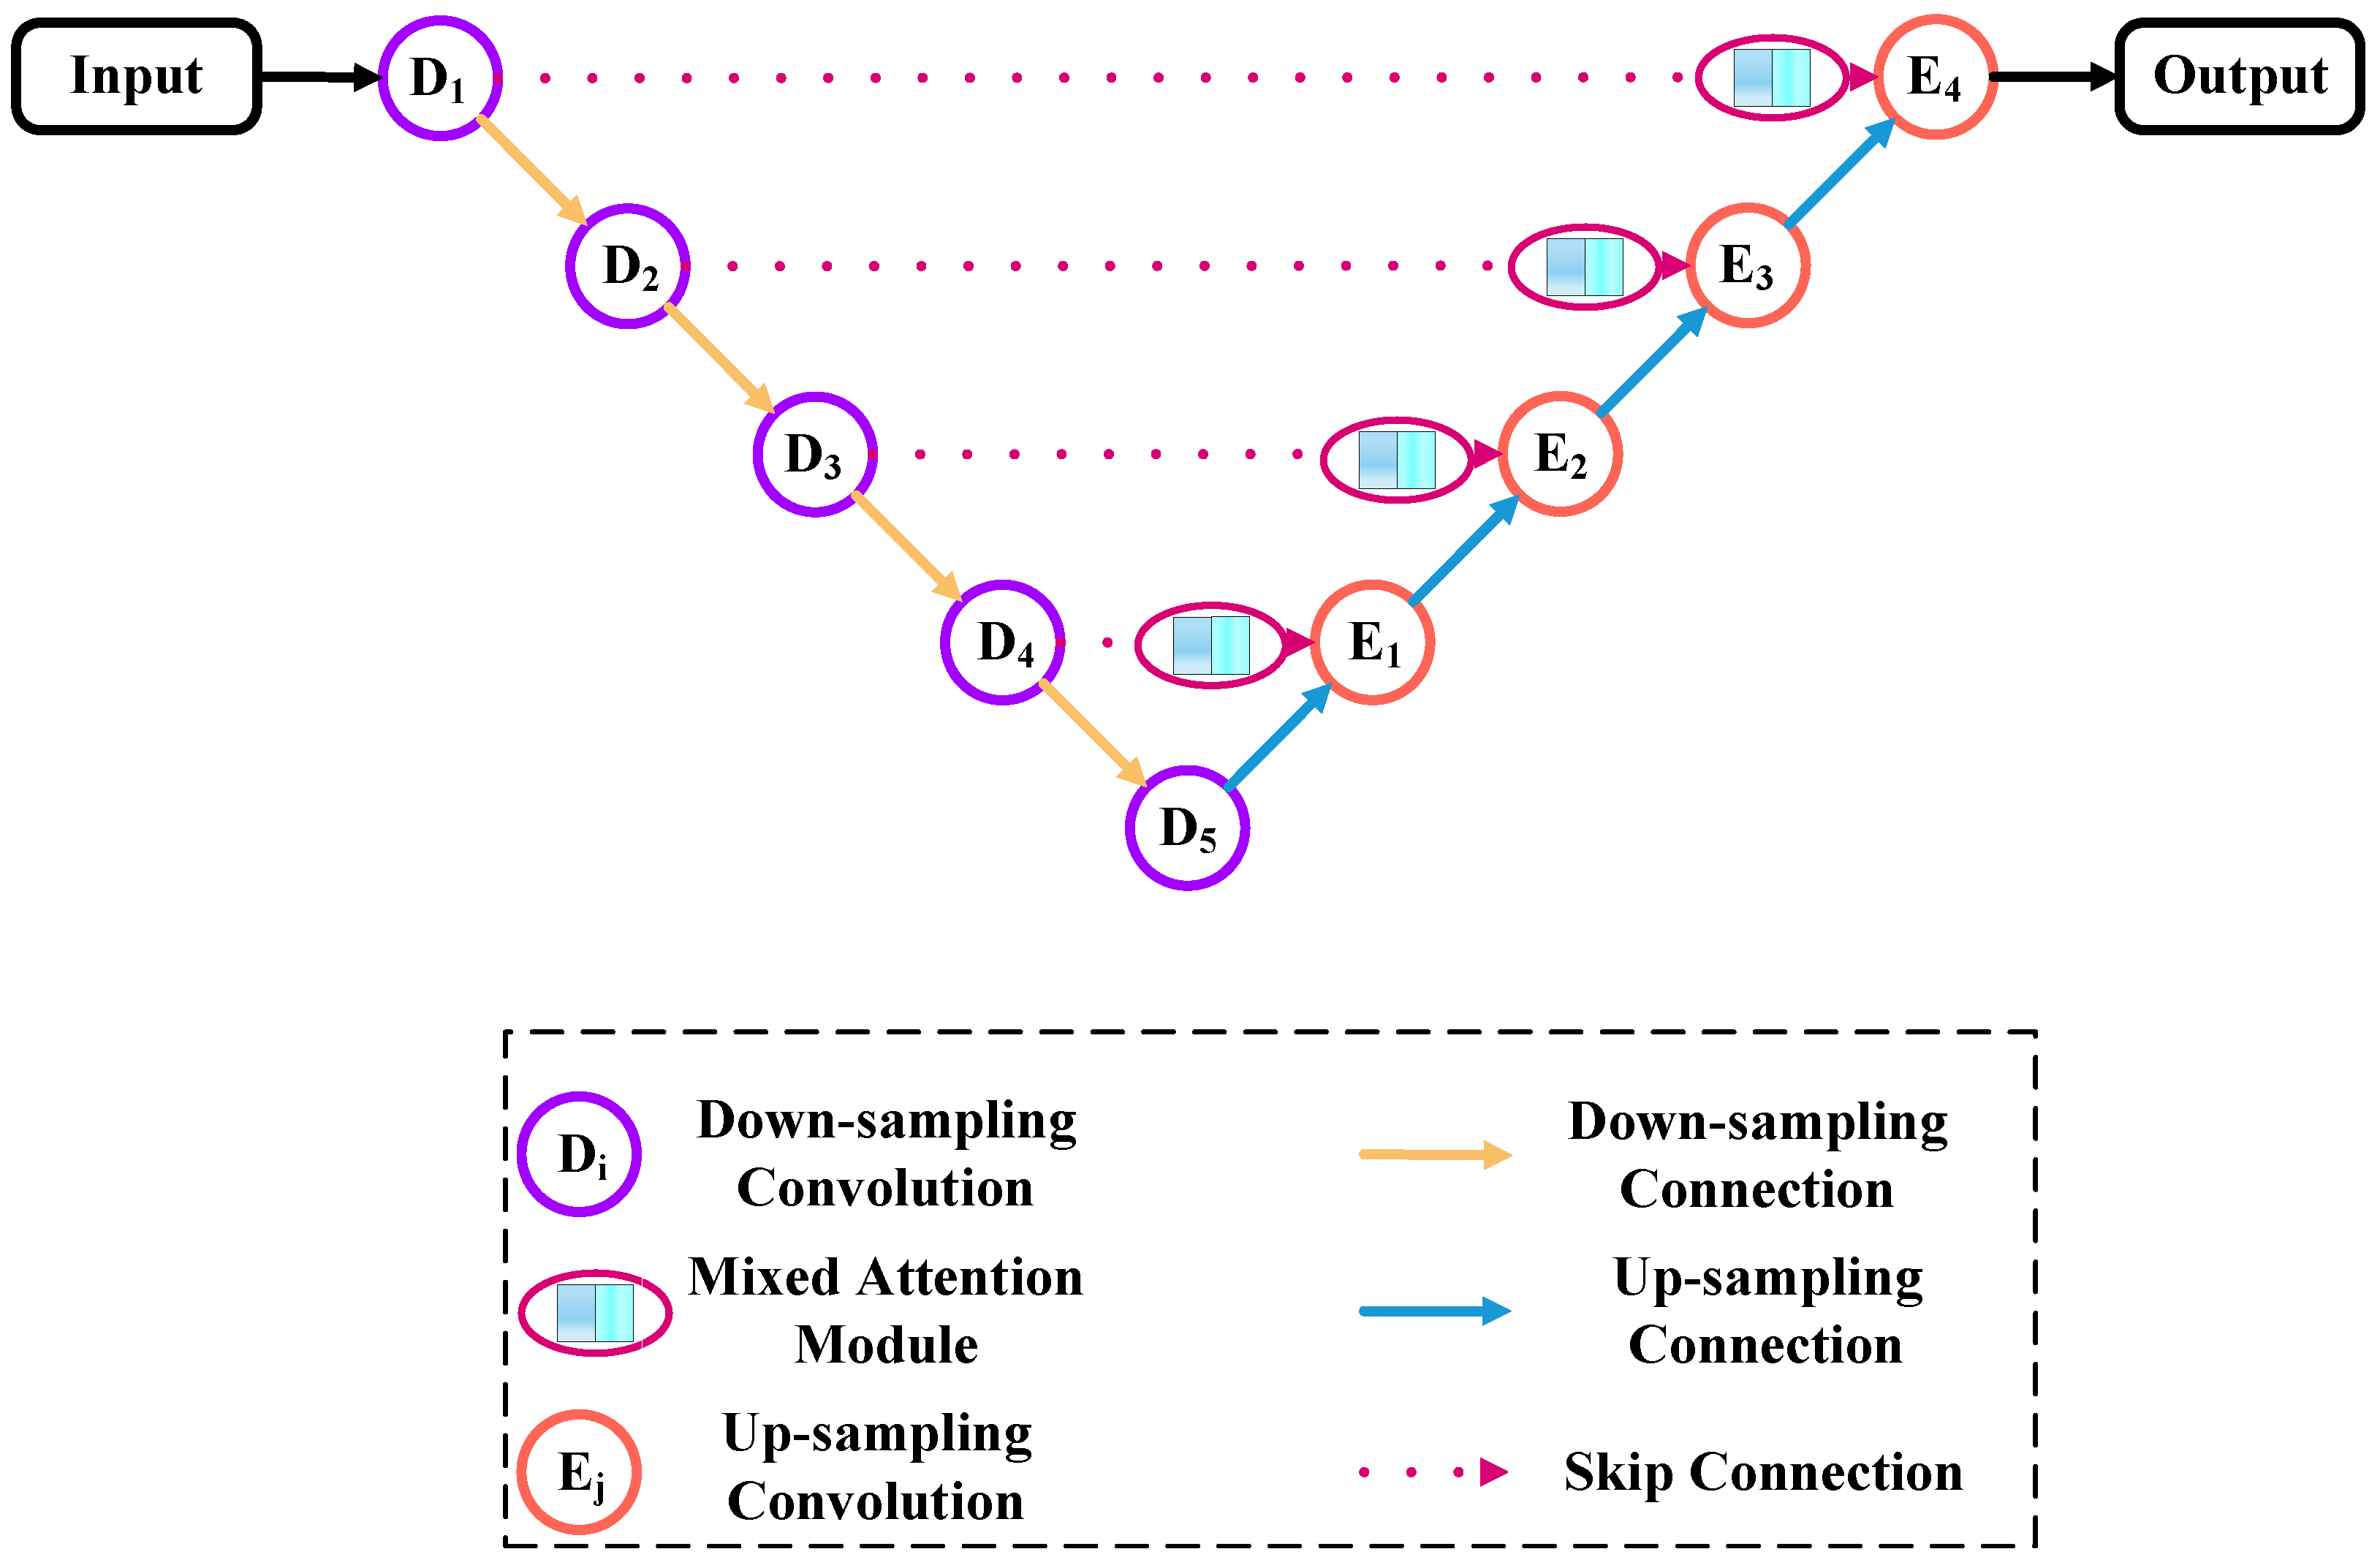
  • A mixed attention U-Net model for degradation feature extraction is proposed. Using a one-dimensional (1D) operating module to accommodate battery degradation data inputs. The incorporation of a hybrid attention module into U-Net reduces the redundant information generated during feature extraction and improves the ability to focus on multi-level features.

2. Multi-Stage Division Method for Battery Degradation Performance Estimation

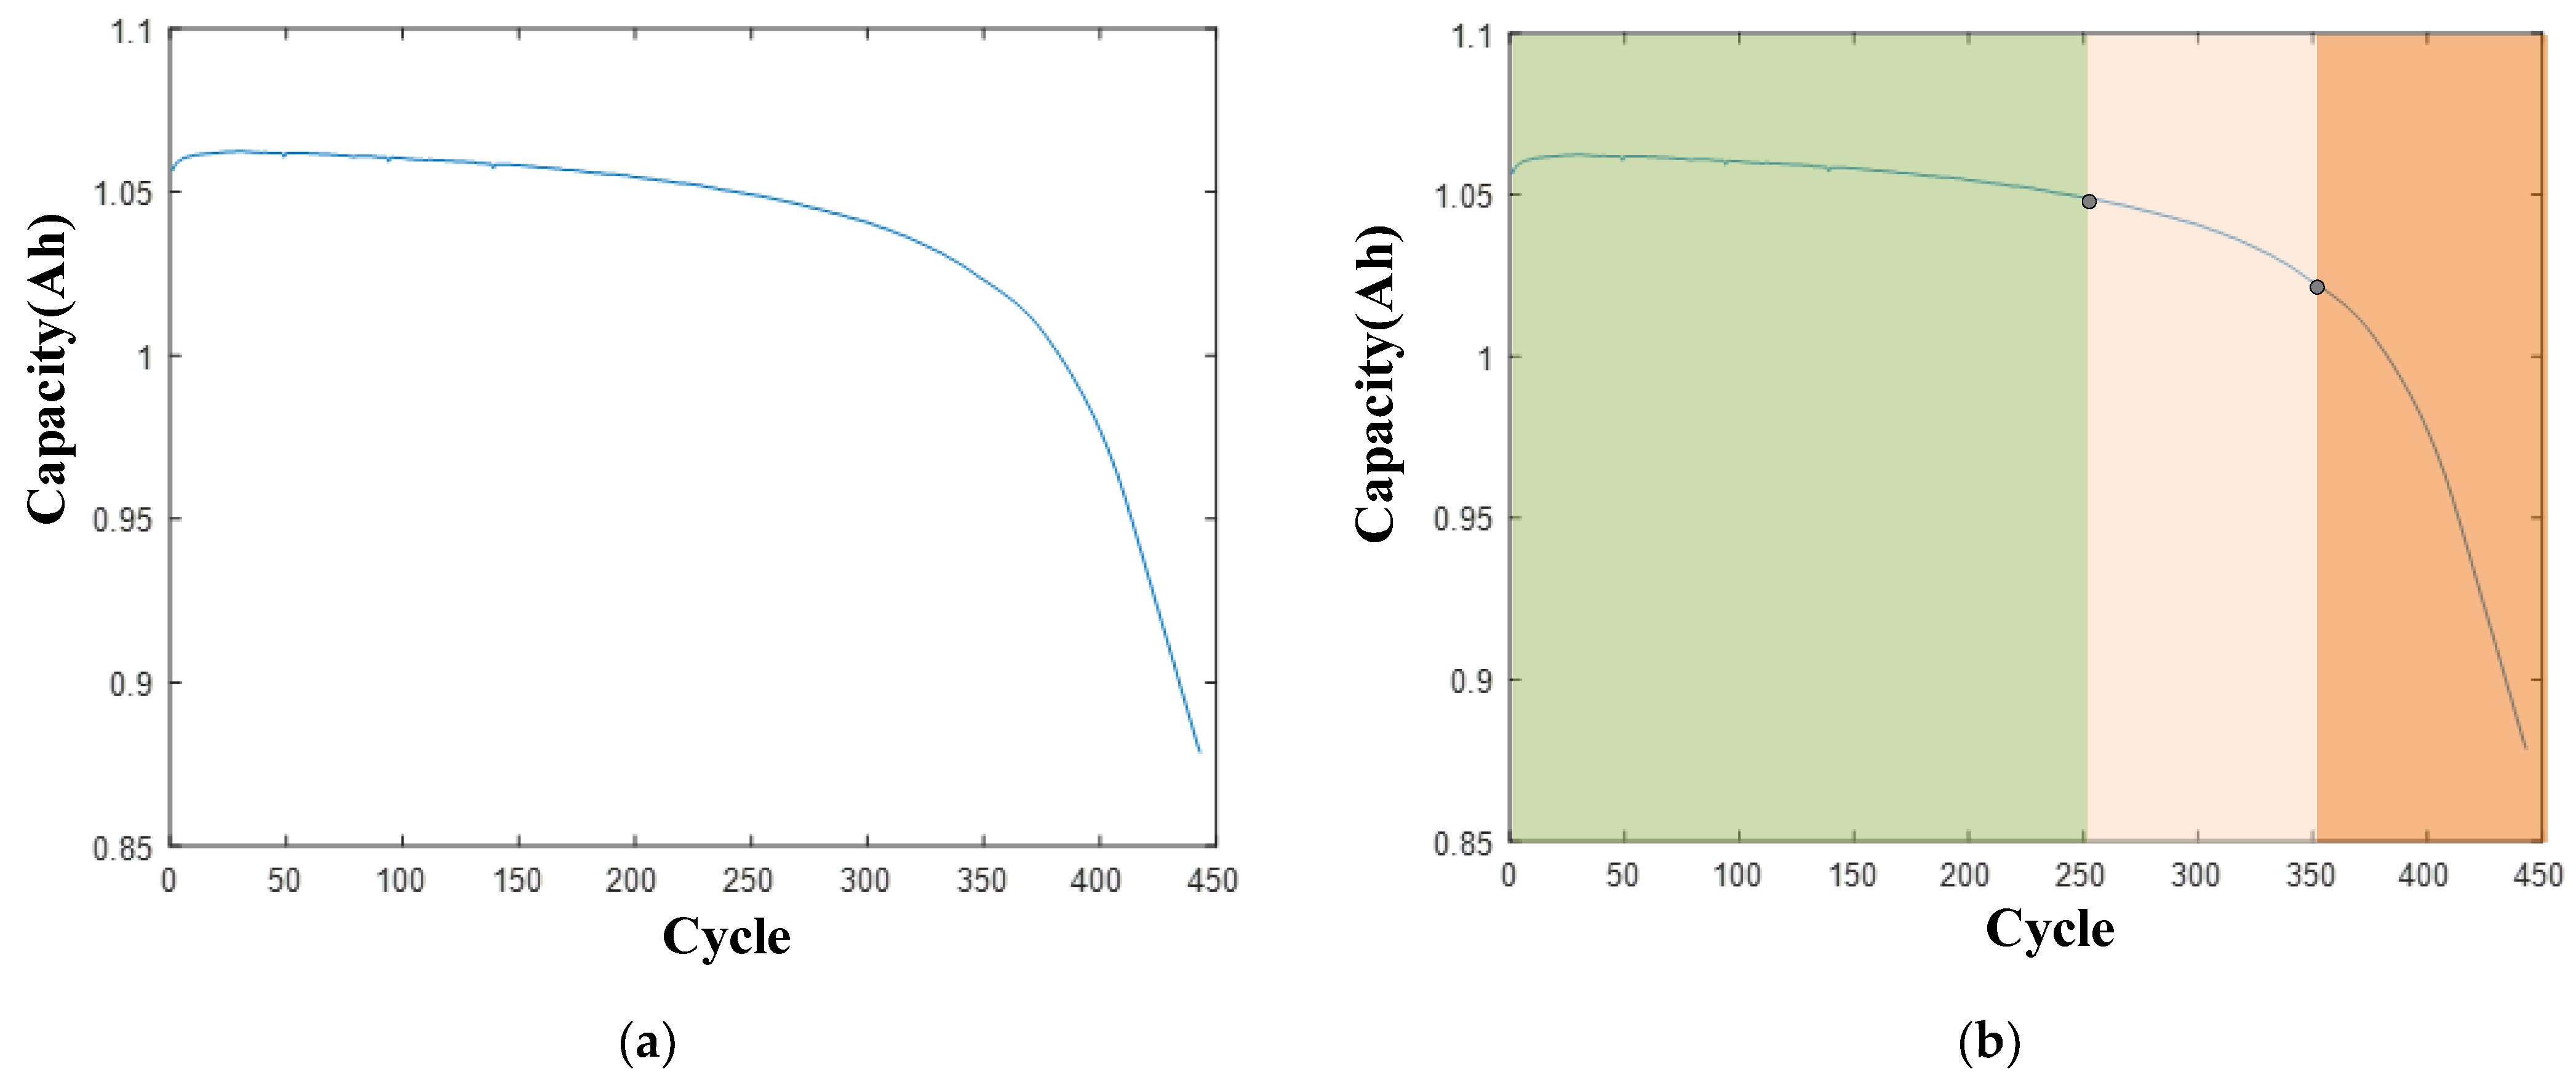
2.1. Overview of Battery Degradation Cycle

The capacity of a battery will inevitably decline over time due to the inevitable effects of battery aging. The precise mechanisms underlying this performance degradation are complex and multi-faceted, involving various physical and chemical processes. Battery capacity is used as an indicator to show the health status of the battery by the available quantity. Changes in the battery maximum dischargeable capacity can reflect the details of battery degradation.
Figure 2a shows the battery capacity decay curve under general conditions, where the horizontal axis is the charge–discharge cycles and the vertical axis is the maximum dischargeable capacity. From the curve, it can be seen that the decay rate of the battery is not static, there is a difference in the decay rate at each stage, and the cause of its multi-stage performance is the decay mechanism of the battery itself. When the charge–discharge cycles are less than 250, the battery performance is close to the nominal value, the solid electrolyte interface (SEI) layer is formed and stable, the electrolyte decomposition and lithium-ion loss are less, and the battery efficiency is higher. After the charge and discharge cycles are greater than 250, the capacity of the battery begins to decrease gradually, the structure of the electrode material changes, the SEI layer thickens, the electrolyte decomposition intensifies, the lithium-ion loss increases, and the internal resistance begins to rise. After 350 charge–discharge cycles, the battery capacity decreases rapidly, and the electrode material degrades significantly. The lithium-ion transmission efficiency also decreases significantly, and the internal resistance of the battery increases notably. These changes eventually lead to a serious decline in battery performance, which may necessitate replacement due to safety concerns or insufficient performance.

2.2. Battery Multi-Stage Characteristics

Through the multi-stage analysis of battery degradation, it has been determined that effectively utilizing multi-stage features during training can enhance the estimation of the remaining life of the battery. For example, in the remaining useful life prediction, it is advisable not to train the network with discharge characteristic data under the battery’s healthy condition. This is because the model training primarily focuses on extracting degradation features based on data from the battery’s degraded state. Battery data under healthy discharge conditions contain little or no degradation information Including them in model training may introduce additional noise. Regarding the SOH prediction task, the data-driven approach based on the data possesses a strong feature extraction capability. Although directly putting the data of the entire cycle together for training can indeed extract more global features, the network’s attention to local features may diminish. Since the data from a healthy SOH state contain very little information about the degradation process, the trained network may incur a significant error when predicting the initial healthy SOH state. Therefore, it is reasonable to divide the battery degradation data into several stages. Yu [28] proposes a decay stage identification method based on a distribution-based correlation index, which manually divides the degradation stage of the battery into healthy, slightly degraded, and severely degraded states according to the defined index value. Dubarry et al. [29] analyze the battery discharge data using IC and close-to-equilibrium open-circuit voltage. Through the change of the Peukert coefficient with the number of cycles, the capacity retention mode is described, and the attenuation of the battery is analyzed in three cases of coefficient change. These studies refer to the multi-stage degradation characteristics of batteries but do not propose specific stage characterization methods that can be applied to battery-related estimation tasks.

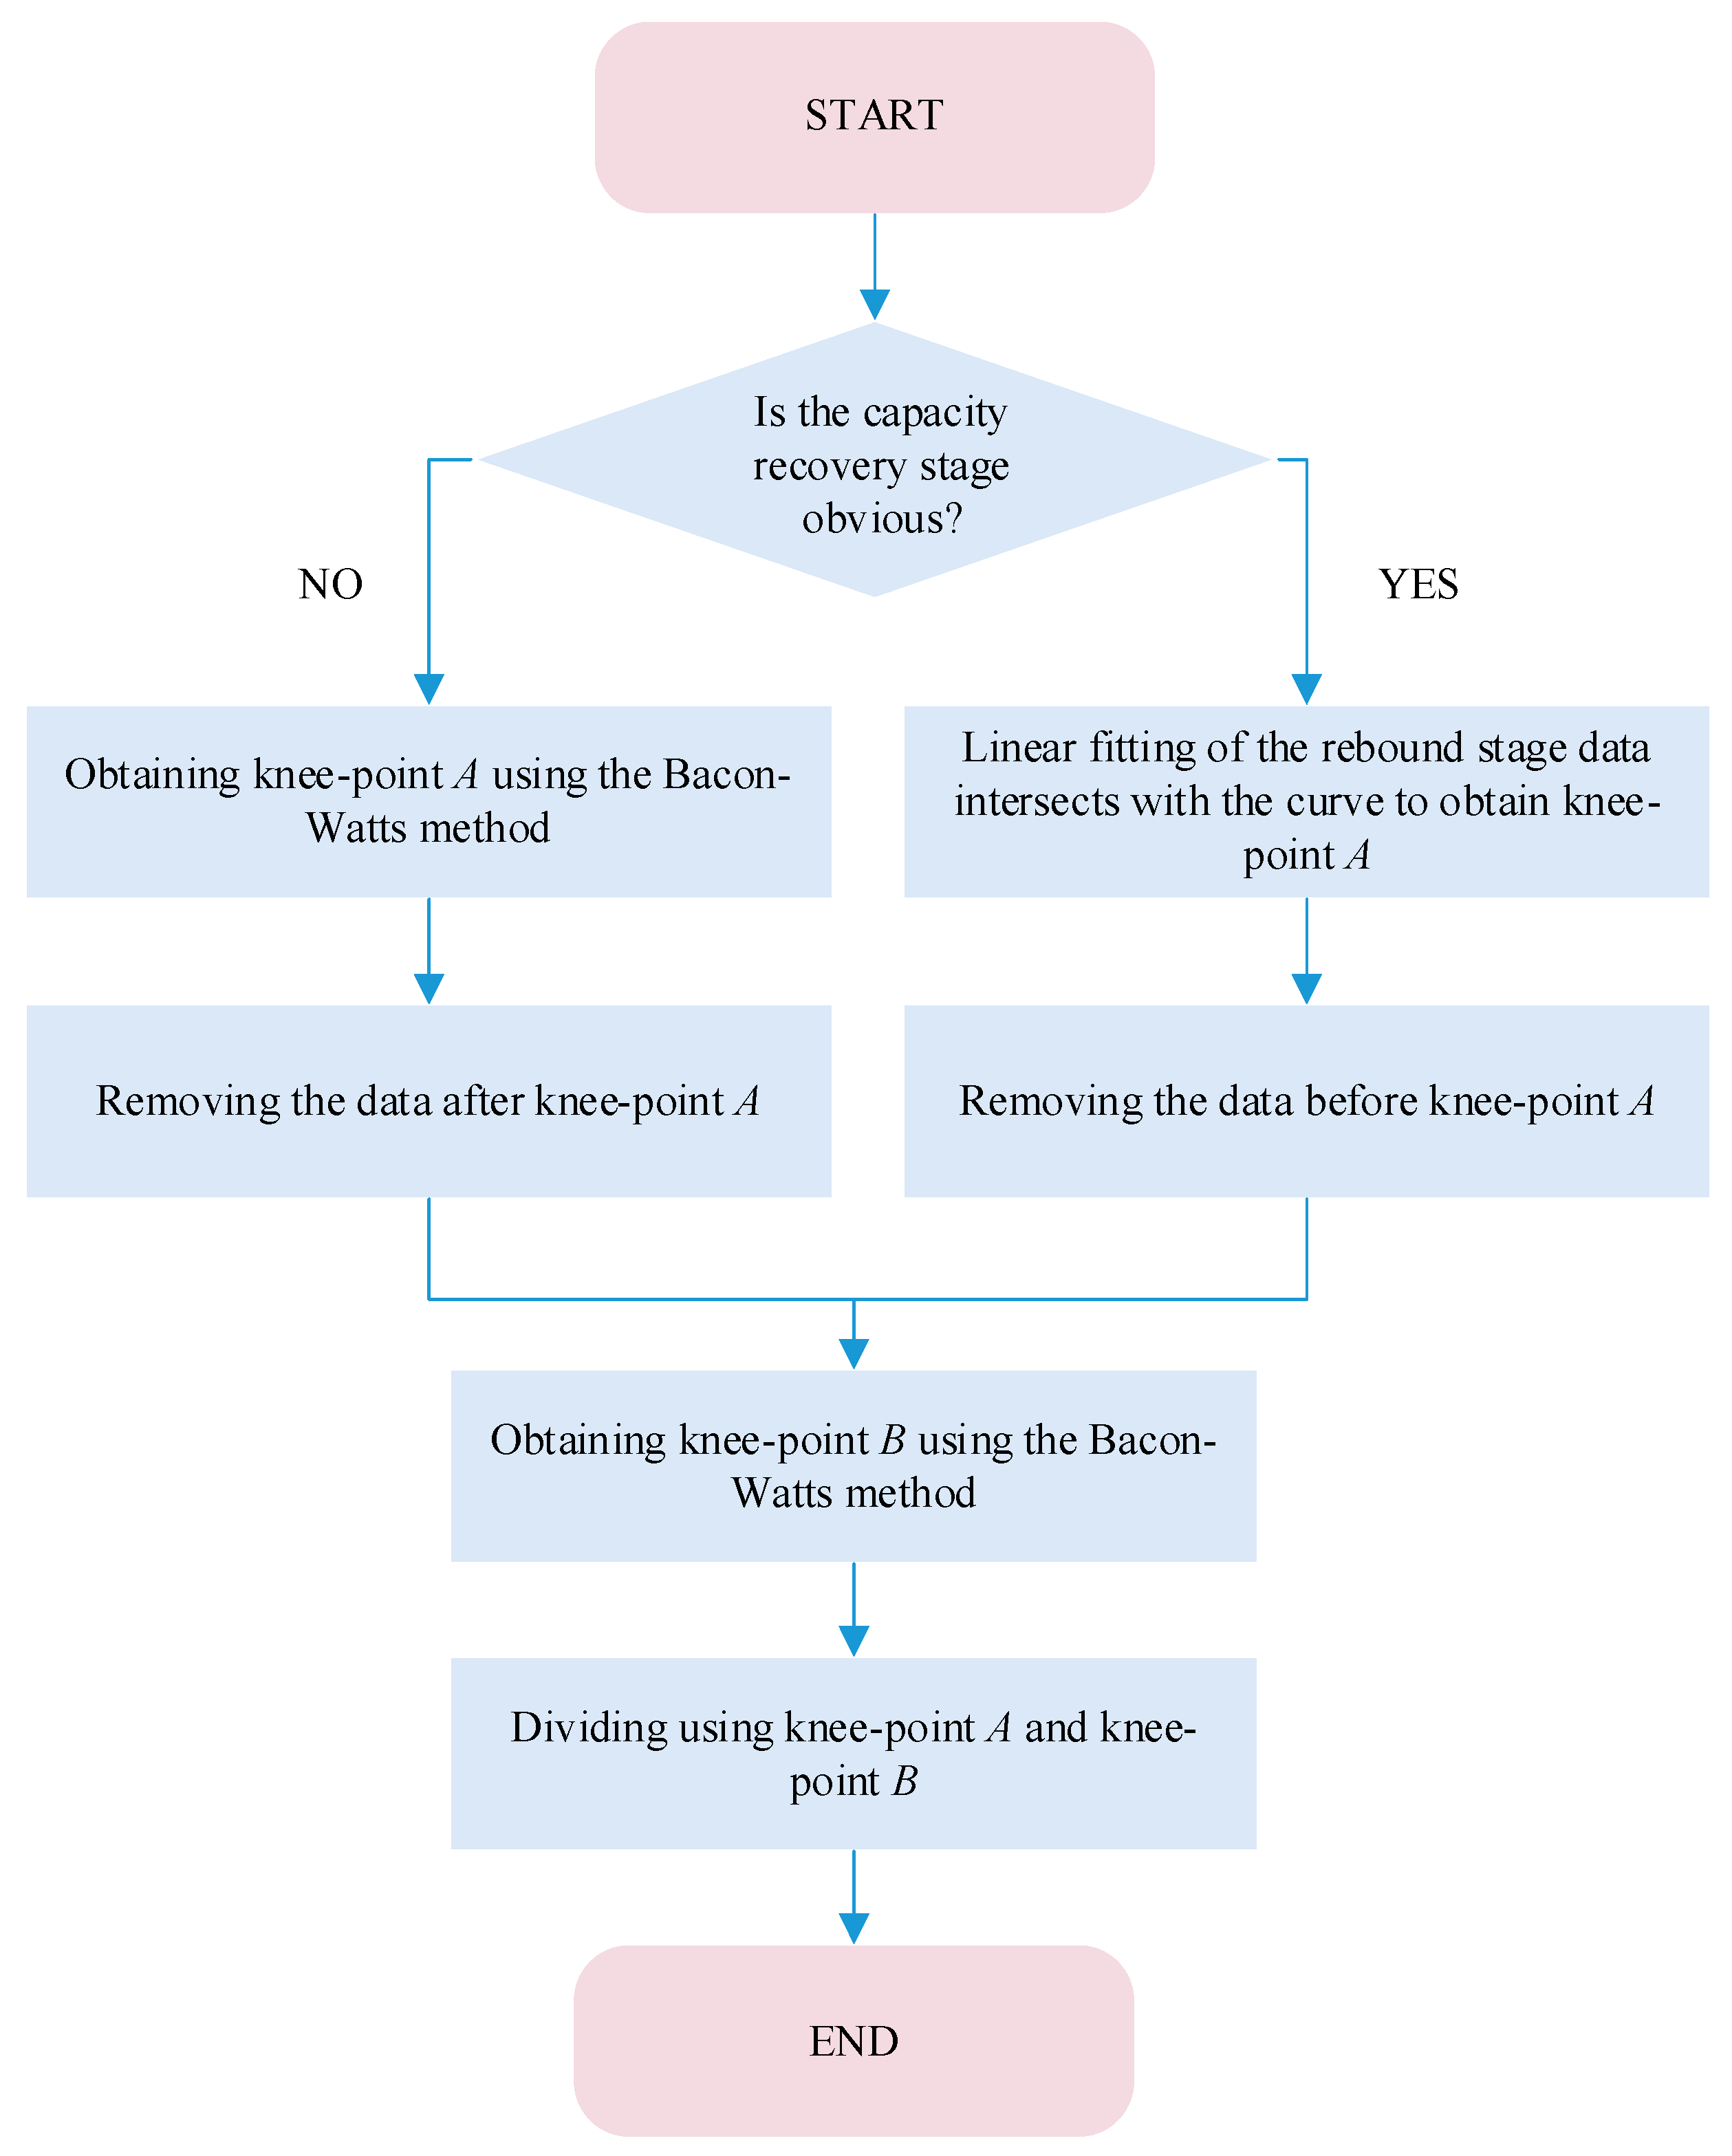
2.3. Multi-Stage Geometric Knee Point Division Method

In battery degradation, the knee point refers to the point where the battery transitions from a relatively gentle degradation stage to a rapid degradation stage. There are also many scholars studying the application of the knee point [30,31,32]. As shown in Figure 2b, green represents the healthy stage, pink represents the slow degradation stage, and orange represents the rapid degradation stage. There are such similar points at different decay rate stages of the battery, which divide the degradation process into multiple stages, and thus the multi-stage division problem can be transformed into a multiple knee point division problem. The following knee points are all referred to as critical points between stages in this paper.
Due to the influence of different dominant degradation factors of lithium-ion batteries, the degradation curve can show linear, sub-linear, or super-linear aging trajectories [30]. For linear degradation trajectories, since their multi-stage characteristics are not prominent, the entire degradation curve can be considered as a single stage. In contrast, sub-linear or super-linear degradation curves exhibit distinct multi-stage characteristics, and they can be transformed into each other through coordinated transformations. In this paper, the super-linear degradation curve data are used as examples to illustrate the proposed method. The overall process of dividing stages using knee points is shown in Figure 3.
The division details are shown in Figure 4. The capacity recovery stage of the curve is not obvious, so the left branch division process shown in Figure 3 is adopted. Based on the bisector method [33], the starting and ending data of the degradation curve are linearly fitted, respectively. Figure 4a shows that the intersection of the bisector of the angle between the two straight lines and the degradation curve is knee point A, and then the latter part is removed. By taking the same operation, we obtain another knee point B, as shown in Figure 4b. The two knee points, designated A and B, divide the degradation curve of the battery into three distinct stages. The core idea of the stage division method proposed in this paper is to transform the multi-stage division into the division of the knee point. The geometric method used in the division of the knee point is not unique; also used are the Bacon–Watts method, tangent ratio method, quantile regression method, and so on [34,35,36]. Knee points identified through distinct methodologies may not coincide exactly, but they all reside within the knee region.
The verification data used in this paper are from the Xi’an Jiaotong University (XJTU) battery dataset. The overall stage division steps are shown in Figure 5, where it can be seen that there is a clear capacity recovery stage in the early stage of the degradation curve, which may be related to the material properties and activation process of the battery itself. This capacity recovery information is inversely related to the entire degradation trend of the battery. Regarding this problem, as shown in Figure 5a, this paper first performs linear fitting on the data of the initial recovery part, and the intersection of the fitted straight line and the degradation curve is taken as knee point A. As shown in Figure 5b, the capacity recovery part is removed, and knee point B is obtained according to the division method mentioned in the graph. In order to maintain the unity of the number of division stages, the degradation curve after removing the capacity recovery is only divided once again.

3. The Proposed Encoder–Decoder Prediction Model

3.1. Review and Analysis of the Existing U-Net Model

While RNNs and their variants, such as LSTM and GRU, are capable of handling time series data for battery SOH estimation, they face challenges such as long sequence gradient problems, low computational efficiency, and difficulty in the parallel processing of large amounts of data. Based on this, we introduce the encoder–decoder structure-based U-Net model to improve the accuracy and efficiency of SOH estimation by utilizing its powerful feature extraction and parallel processing capabilities. The encoder–decoder structure is widely used in various deep learning tasks due to its efficient data processing capabilities, long-term tracking capabilities, powerful feature extraction capabilities, and its scalability and flexibility. U-Net is a CNN designed for image segmentation tasks [37]. It uses an encoder and decoder structure and introduces skip connections that fuse the feature maps of the frontal encoder and decoder parts of the corresponding depths to retain more feature information. U-Net has been extended with many variants. In terms of model improvement, it is mainly improved in the skip connection or network layer, and the overall structure remains as an encoder–decoder structure. For example, Ozan et al. [38] proposed a new attention gate (AG) model for medical imaging, which can automatically learn to focus on target structures of different shapes and sizes. By adding AG gates to the jump structure, the U-Net model can implicitly learn to suppress irrelevant regions in the input image while highlighting salient features that are useful for specific tasks. Zhou et al. [39] linked U-Net to densely connected networks, and UNet++ redesigned skip connections, allowing each node in the decoder to be connected to multiple nodes in the encoder, achieving flexible feature fusion. This improvement breaks the limitation of jump connection in U-Net, enables the model to integrate feature information from different levels, and improves the segmentation accuracy.
In battery SOH prediction, it is necessary to consider data dimensions and the redundancy of sequence and spatial features in the network’s feature extraction process. Therefore, applying it directly to this task will lead to the model’s inability to effectively capture temporal dependencies, and may introduce unnecessary complexity due to spatial feature redundancy.

3.2. Mixed Attention U-Net Network Architecture

In view of this, this paper proposes an encoder–decoder network based on a one-dimensional (1D) U-Net structure suitable for time series data input. The network structure is shown in Figure 6. By mixing attention modules in the network, the redundant information in the feature extraction process is reduced, and the network’s attention to multi-level important features is strengthened.

3.2.1. Improved U-Net for SOH Estimation

Firstly, this paper replaces the convolution, pooling, up-sampling, and other basic components of the encoder part of the original U-Net structure decoder with an operation form suitable for one-dimensional data to form a U-Net structure suitable for battery SOH prediction tasks.
The U-Net adopts a unique U-shaped structure, which consists of an encoder and a decoder. The overall structure is shown in Figure 7. This structure enables the network to gradually capture the multi-level features of the input sequence during the encoding process and gradually recover the feature information during the decoding process. The encoder part consists of multiple convolutional blocks, each of which usually contains a convolutional layer, a batch normalization, and an activation function. The decoder part consists of multiple deconvolution blocks, each of which contains a deconvolution layer (also known as transposed convolution), a batch normalization, and an activation function. After each deconvolution block, an up-sampling layer can be added to increase the size of the feature map, corresponding to the pooling layer in the encoder. The core feature of U-Net is skip connection, which connects each layer in the encoder with the corresponding layer in the decoder. Since the input of the battery SOH prediction task is the data format of voltage (V), current (I), temperature (T), and other features at a certain time step, the U-Net used in this paper is composed of 1D convolution, pooling, and so on.

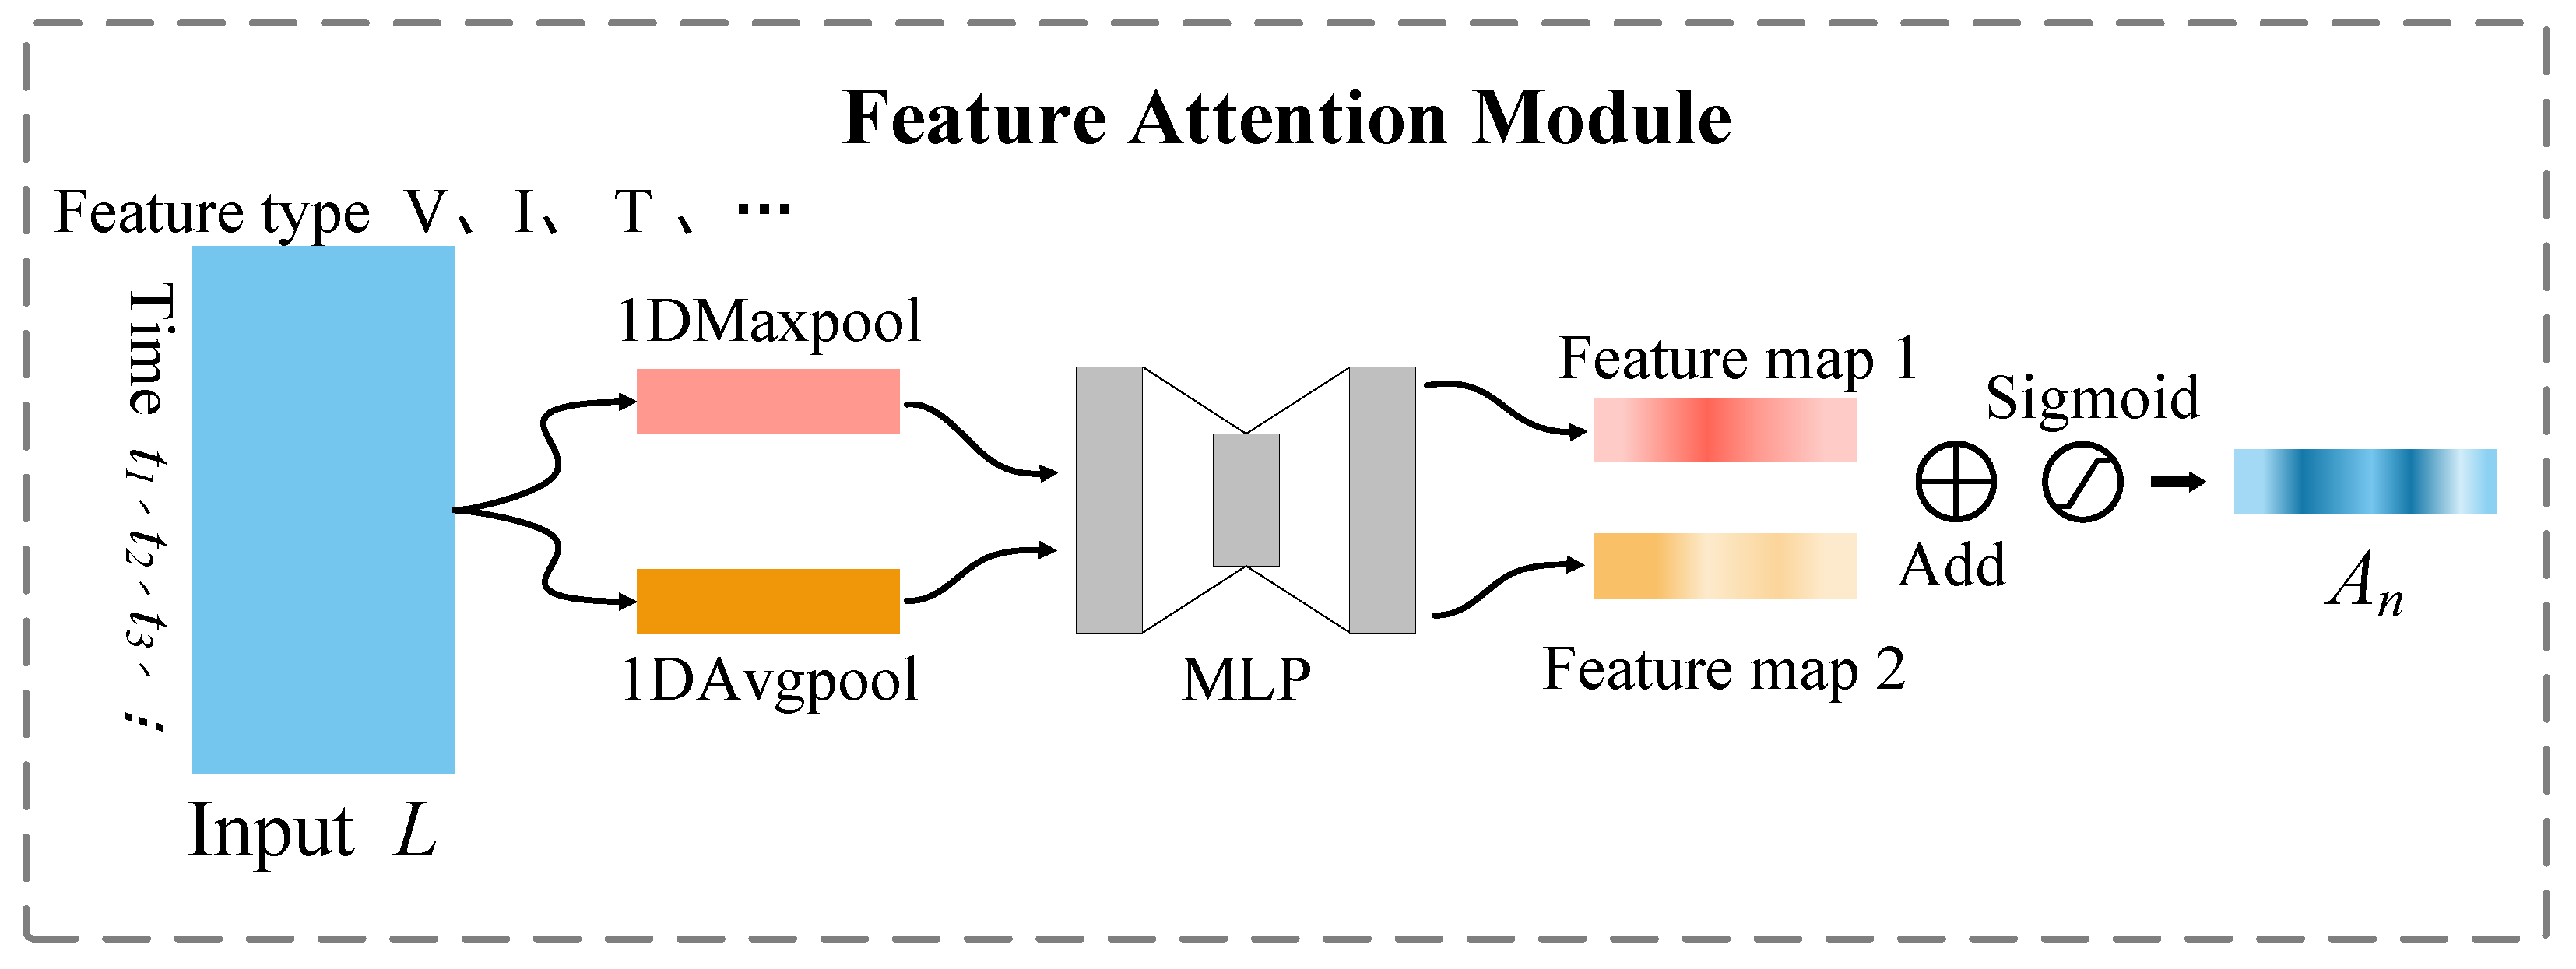
3.2.2. Mixed Attention Module

Inspired by the convolutional block attention module (CBAM) [40], the feature attention and time step attention are obtained by 1D transformation of spatial attention and channel attention, and integrated into the skip connection of U-Net, so that the network can pay more attention to the importance of input time series data in different features and time steps in SOH prediction. At the same time, it also reduces the redundant information that is invalid for the prediction task generated in the decoding layer to the encoding link process. The attention module reduces redundant information by assigning different weights to input features during the feature extraction process. Key features are assigned higher weights, while redundant or irrelevant features are suppressed.
The CBAM module is applied to image processing tasks and can focus on important features at multiple levels of time and space. In view of this, we build a hybrid attention module suitable for SOH prediction tasks. The structure is shown in Figure 8. The module consists of feature attention and time step attention, and the attention of different levels of features is realized through the connection of the two. Given an intermediate feature graph L R N × T   as input, where N represents the number of input features. T represents the time step of sampling here. The whole attention process can be summarized as (1) and (2).
L = A n ( L ) L
L = A t ( L ) L
where   A n represents the attention operation of the feature, represents matrix multiplication,   A t represents the attention of the time step, L represents the input feature map, L   represents the feature map after feature focusing, and   L is the final output.
Feature attention module. The feature attention module is shown in Figure 9, where the global information of input data is aggregated by using 1D global pooling, then the weights of each feature are learned by a small multi-layer perceptron (MLP). Finally, the feature attention is obtained by using summation and activation function. Feature attention occurs by calculating the weights that adapt to the direction of the feature axis; these weights represent the importance of each feature in the model, so that the model can better focus on the strong correlation features that reflect the actual SOH. The whole attention process can be summarized as (3).
A n L = σ MLP AvgPool 1 D L + MLP MaxPool 1 D L
where σ represents the sigmoid function, L represents the input feature map, AvgPool1D is the 1D average pooling, MaxPool1D is the 1D maximum pooling, and MLP is the multi-layer perceptron.
Time step attention module. The time step attention module is shown in Figure 10. Firstly, the 1D average pooling and 1D maximum pooling operations are carried out along the direction of the feature axis, and they are spliced together along the direction of the feature axis. Then, the information obtained from the pooling part is fused through a convolutional layer. Ultimately, the final weight layer is obtained through a corresponding activation function. Similar to the spatial position in two-dimensional images, the time steps in one-dimensional data also contain different amounts of information and importance. Time step attention can learn the importance of these time steps in a specific task and assign different weights to them. In battery SOH prediction, the model can focus on the key stages or time points in the battery charge and discharge process, so as to better predict the health status of the battery. The whole attention process can be summarized as (4).
A t L   = σ f AvgPool 1 D L ; MaxPool 1 D L
where σ represents the sigmoid function, f represents the convolution operation, L represents the input feature map, AvgPool1D is the 1D average pooling, and MaxPool1D is the 1D maximum pooling.

4. Experimental Results

4.1. Datasets

The dataset used to validate the performance of the proposed method is the XJTU battery degradation dataset [41], which contains 55 lithium-ion batteries that have been subjected to six charging and discharging strategies, and their operation-to-failure data have been recorded.
The entire dataset is divided into six batches, with Batch1 through Batch6 representing six charging and discharging strategies, respectively. All batches except Batch2 contain 8 batteries, while Batch2 contains 15 batteries. Figure 11 shows the lifetime curves of the batteries in some batches of the XJTU battery dataset. Figure 11a, Figure 11b, and Figure 11c show the battery degradation curves for Batch1, Batch2, and Batch3, respectively.
Batch1 is recycled under a fixed charge–discharge strategy. All batteries are charged to 4.2 V at 2 C in constant voltage and constant current (CC-CV) mode, and then discharged to 2.5 V at 1 C. Batch2 contains 15 batteries, and its charging and discharging strategy is similar to that of the first batch. All batteries are charged to 4.2 V at 3 C in CC-CV mode, and then discharged to 2.5 V at 1 C. Batch3 is more complicated than the first two. All batteries are charged in CC-CV mode at a temperature of 2 C. Then, they are discharged to 2.5 V, and the current value is x   C, where x     { 0.5 , 1 , 2 , 3 , 5 } . Since we utilize data from three batches in the dataset, we only list the experimental strategies of Batch1 to Batch3. The basic quantities in the dataset include V, I, T, and capacity. During the discharge process, V, I, and T change with the discharge time, and the time sequence composed of these characteristics contains the degradation information of the battery. The “capacity” in the battery life curve refers to the amount of electrical energy that a battery can store, which reflects the maximum amount of charge that the battery can release under specific conditions. The maximum dischargeable capacity of a battery can be obtained by integrating the current over the discharge time from full charge discharge to the cut-off voltage.

4.2. Experiment Setting and Evaluation Metrics

This experiment is conducted based on CPU (Intel Core i5-12600k 3.2GHz), GPU (NVIDIA GeForce RTX 4070 Ti SUPER 16GB), RAM memory (32GB), Python 3.8, and Pytorch-GPU environments. Due to the different scales of input data such as current, temperature, and voltage, directly splitting the data and converting them into model input will reduce training efficiency and model performance. Therefore, the data should be normalized. This paper adopts the normalized form of [−1, 1], and the calculation formula is shown in (5).
x norm = x x min x max x min × 2 1
where x represents raw data, x norm represents normalized data, and x min and x max are the minimum and maximum values of the raw data, respectively.
In the selection of hyperparameters, this paper sets the learning rate as 2 × 10⁻³, the weight attenuation as 5 × 10⁻⁴, the batch size as 128, and uses the early stopping strategy to prevent the model from overfitting the training data during the training process. The network verification is carried out by leave-one-out cross validation. There are eight samples in each batch of the battery dataset, and eight training and verification sets are needed. Each time, one battery is selected as the validation set, and the remaining N-1 batteries are used as the training set. The visualization is shown in Figure 12. In the comparative experiment, all models use the same set of hyperparameters, the data input adopts the same normalization method, and the comparability between different models is ensured by strict control variables.
In order to evaluate the performance of the model, this paper adopts MAE and RMSE indicators as evaluation criteria. The calculation formulas are as follows:
M A E = 1 N i = 1 N s o h i s o h i ^
where s o h i represents the estimated SOH value, s o h i ^ represents the true SOH value, and N represents sample num.
R M S E = 1 N i = 1 N s o h i s o h i ^ 2
where s o h i represents the estimated SOH value, s o h i ^ represents the true SOH value, and N represents sample num.

4.3. Experimental Results and Analysis

4.3.1. Performance Evaluation of Multi-Stage Partitioning Strategy

The dataset is segmented using the proposed geometric knee point division method. Table 1 presents the division results for Batch1.
To validate the effectiveness of the multi-stage division strategy, the battery degradation data are divided into two sets of inputs using multi-stage and non-stage strategies, which are input to the model for training, respectively. In order to ensure the accuracy of the experimental results, the whole process only differs in the division strategy and conducts validation experiments with multiple groups. Table 2, Table 3 and Table 4 show the SOH prediction results for different division strategies under LSTM [42], U-Net, and mixed attention U-Net models, respectively, where the results in bold indicate the optimal results for comparison under the same batch. From Table 2, LSTM with the multi-stage strategy outperforms the non-stage strategy in terms of MAE and RMSE metrics, and the enhancement is more obvious, especially in Batch3. From Table 3 and Table 4, it can be seen that using the multi-stage strategy has better performance metrics overall in U-Net and mixed attention U-Net compared with using the non-stage strategy. Although there is an effect improvement only in MAE metrics in Batch2, there is a very obvious optimization in both RMSE and MAE in Batch1 and Batch3.

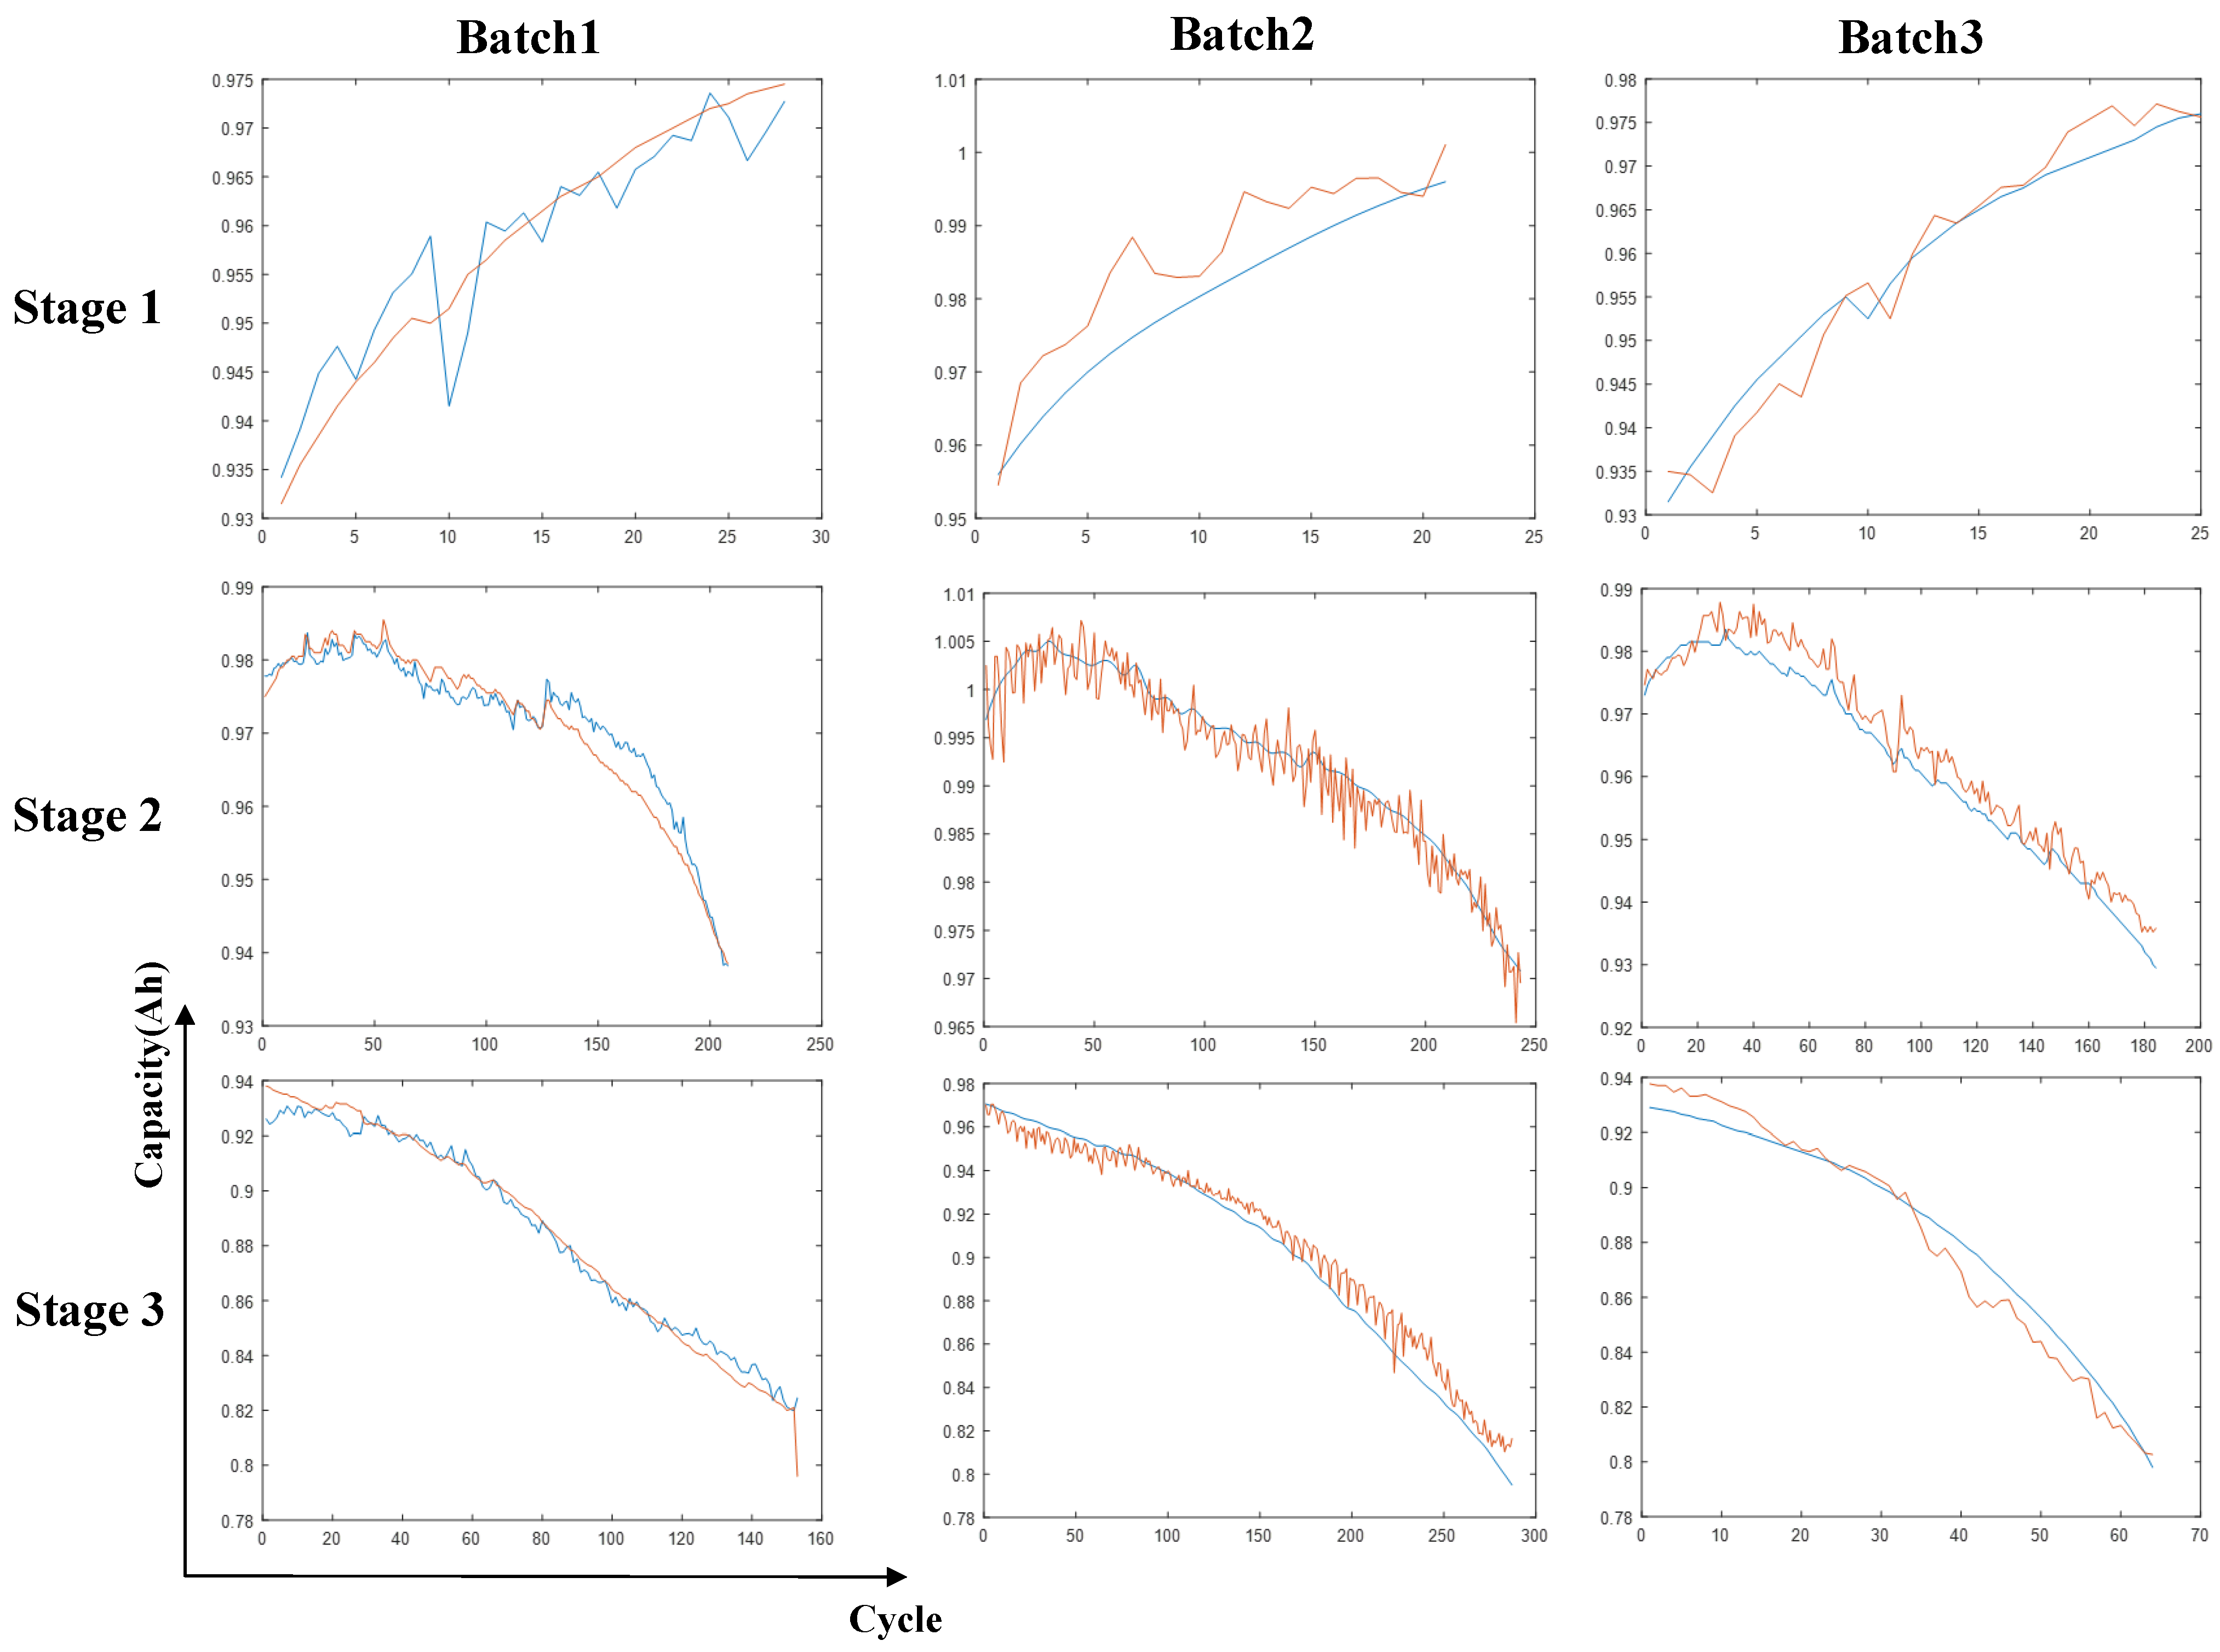
4.3.2. Performance Evaluation of the Proposed SOH Estimation Method

In this section, we compare the proposed method with data-driven methods such as U-Net, LSTM, GRU [43], and MLP [44] on the SOH prediction task. We use three batches of data under each model for the experiments, and Table 5 shows the experimental results under different models or methods, where the results in bold indicate the optimal results for comparison under the same batch.
Battery SOH typically represents the current health and performance of a battery in terms of percentage relative to its initial state. Consequently, the unit of measurement for the assessment indicators in the following experimental results is percentage.
From Table 5, it is evident that the proposed mixed attention U-Net has achieved better performance compared with other models. This performance comes from the U-Net architecture’s efficient contextual information fusion and mixed attention for different levels of attention to key features and redundant information filtering. When the multi-step strategy is used, the mixed attention U-Net experiences further performance improvements in terms of RMSE and MAE across the three data batches. This improvement is attributed to the fact that the network better captures the intricate patterns and nuances of stage-degraded information when using the multi-stage strategy. Experimental results prove the effectiveness and accuracy of the proposed method.
Figure 13 shows the visualization of the SOH prediction results under the multi-stage division strategy, where three stages are obtained through the two knee points of the division. The blue line represents the true value, while the red line represents the predicted value. The vertical coordinate represents capacity and the horizontal coordinate represents cycle. Stage 1 is the activation stage of the battery, where the battery capacity is gradually rebounding and the data amount is small. The prediction results in this stage show better realization. Stage 2 is the healthy state of the battery and the slow degradation stage, containing a certain amount of degradation information. Due to the characteristics of the battery, the degradation process is not always linear, with occasional capacity rebounds, but the predicted value still represents the actual capacity trend. Stage 3 is the rapid degradation stage of the battery, rich in degradation information and with a faster capacity degradation speed. The prediction results in this stage match the actual value curve well. Combining the visualization results of the three stages, it can be obtained that adopting a multi-stage strategy improves the network’s ability to extract key information, leading to better prediction results compared toa non-stage strategy.
Figure 14 shows the visualization results of SOH prediction using different models. From the visualization results, it can be seen that the models used are generally able to respond to the actual trend of SOH of the battery, but the different methods have more obvious local differences. At the beginning of the curve, the battery is in the capacity recovery phase. Due to the small amount of input timing data at the beginning stage, LSTM and GRU can utilize less timing information, resulting in a large deviation from the true value at the beginning. The deviation of the results obtained by the MLP is slightly smaller for LSTM and GRU but there is still a large error. In contrast, mixed attention U-net and MMAU are close to the true values with smaller errors. The deviation of U-Net is small, but there is an anomaly in the prediction of the beginning endpoints, which is related to its omission of the important timing information. In the stage of slow battery degradation, the predicted SOH values of LSTM, GRU, MLP, and U-Net, which adopt the non-stage strategy, are more in line with the actual values. In the slow degradation stage, the SOH values predicted by LSTM, GRU, MLP, and U-Net have larger prediction errors in the second half of the stage, which is caused by their extraction of less information about the stage degradation. Both mixed attention U-net and MMAU are able to approximate the true values well, but the MMAU method performs better in terms of details. The MMAU method employs the multi-stage strategy to drive the model, extracting more information about the degradation details at each stage. In the rapid degradation stage of the battery, GRU and LSTM show a large error, which is related to the anomalous jump values of the data at the end part. U-NET, MLP, mixed attention U-net, and MMAU are all in better agreement with the true value curves, but only mixed attention U-net and the MMAU method are not affected by the large impacts of the anomalous jump values in this phase. From this, it can be seen that the proposed mixed attention U-net and MMAU method have good prediction performances at each stage of battery degradation, but MMAU is superior in terms of localized details. This also matches the comparison of data metrics obtained from Table 5.

5. Conclusions

This study proposes a novel MMAU-Net method for battery SOH estimation. The main conclusions of the proposed method are as follows:
(1)
Considering the lack of specific stage division methods that incorporate multi-stage degradation performance of batteries, this paper transforms the multi-stage division task into the use of geometric division of multiple knee points by incorporating the practical significance of the knee point in battery degradation. The method is not only capable of categorizing battery degradation data based on degradation trends but is also simple to apply and interpretive.
(2)
In order to reduce the feature redundant information in the feature extraction process and improve the depth of degraded information extraction, this paper proposes an enhanced U-Net model with a hybrid attention mechanism. The mixed attention U-Net performs deep extraction of aging features through the encoder–decoder structure of U-Nets and reduces redundant feature information by incorporating hybrid attention. The mixed attention U-Net model, evaluated in Bach3 as MAE 0.86 and RMSE 1.08, performs well in the other batches, and also outperforms the LSTM, GRU, and MLP models in the remaining batches. The experimental results demonstrate the feasibility and validity of the proposed model.
Future work will continue to explore the role of multi-stage methods in SOH estimation and further optimize the model, providing better integration with contextualization and increased flexibility of models to deal with datasets of different sizes.

Author Contributions

Conceptualization, X.F.; methodology, X.F. and F.H.; software, X.Y.; validation, X.Y.; formal analysis, X.F.; investigation, X.F.; resources, X.F.; writing—original draft, X.Y.; writing—review and editing, F.H.; visualization, X.Y.; supervision, F.H.; project administration, F.H.; funding acquisition, X.F. All authors have read and agreed to the published version of the manuscript.

Funding

This study was supported by the National Natural Science Foundation of China (nos. 62203475) and the Natural Science Foundation of Hunan Province (nos. 2023JJ40766).

Data Availability Statement

Data will be made available on request.

Conflicts of Interest

The authors declare no conflicts of interest.

References

  1. Chen, J.; Hu, Y.; Zhu, Q.; Rashid, H.; Li, H. A novel battery health indicator and PSO-LSSVR for LiFePO4 battery SOH estimation during constant current charging. Energy 2023, 282, 128782. [Google Scholar] [CrossRef]
  2. Sayfutdinov, T.; Vorobev, P. Optimal utilization strategy of the LiFePO4 battery storage. Appl. Energy 2022, 316, 119080. [Google Scholar] [CrossRef]
  3. Wang, R.; Li, J.; Wang, X.; Wang, S.; Pecht, M. Deep learning model for state of health estimation of lithium batteries based on relaxation voltage. J. Energy Storage 2024, 79, 110189. [Google Scholar] [CrossRef]
  4. Li, C.; Yang, L.; Li, Q.; Zhang, Q.; Zhou, Z.; Meng, Y.; Zhao, X.; Wang, L.; Zhang, S.; Li, Y.; et al. SOH estimation method for lithium-ion batteries based on an improved equivalent circuit model via electrochemical impedance spectroscopy. J. Energy Storage 2024, 86, 111167. [Google Scholar] [CrossRef]
  5. Fu, J.; Wu, C.; Wang, J.; Haque, M.; Geng, L.; Meng, J. Lithium-ion battery SOH prediction based on VMD-PE and improved DBO optimized temporal convolutional network model. J. Energy Storage 2024, 87, 111392. [Google Scholar] [CrossRef]
  6. Xiong, R.; Li, L.; Li, Z.; Yu, Q.; Mu, H. An electrochemical model based degradation state identification method of Lithium-ion battery for all-climate electric vehicles application. Appl. Energy 2018, 219, 264–275. [Google Scholar] [CrossRef]
  7. Tran, M.-K.; Mathew, M.; Janhunen, S.; Panchal, S.; Raahemifar, K.; Fraser, R.; Fowler, M. A comprehensive equivalent circuit model for lithium-ion batteries, incorporating the effects of state of health, state of charge, and temperature on model parameters. J. Energy Storage 2021, 43, 103252. [Google Scholar] [CrossRef]
  8. Chang, Y.; Fang, H.; Zhang, Y. A new hybrid method for the prediction of the remaining useful life of a lithium-ion battery. Appl. Energy 2017, 206, 1564–1578. [Google Scholar] [CrossRef]
  9. Zhang, C.; Luo, L.; Yang, Z.; Du, B.; Zhou, Z.; Wu, J.; Chen, L. Flexible method for estimating the state of health of lithium-ion batteries using partial charging segments. Energy 2024, 295, 131009. [Google Scholar] [CrossRef]
  10. Liu, X.; Liu, X.; Fang, L.; Wu, M.; Wu, J. Dual particle swarm optimization based data-driven state of health estimation method for lithium-ion battery. J. Energy Storage 2022, 56, 105908. [Google Scholar] [CrossRef]
  11. Guo, F.; Lv, H.; Wu, X.; Yuan, X.; Liu, L.; Ye, J.; Wang, T.; Fu, L.; Wu, Y. A machine learning method for prediction of remaining useful life of supercapacitors with multi-stage modification. J. Energy Storage 2023, 73, 109160. [Google Scholar] [CrossRef]
  12. Guo, F.; Wu, X.; Liu, L.; Ye, J.; Wang, T.; Fu, L.; Wu, Y. Prediction of remaining useful life and state of health of lithium batteries based on time series feature and Savitzky-Golay filter combined with gated recurrent unit neural network. Energy 2023, 270, 126880. [Google Scholar] [CrossRef]
  13. Richardson, R.R.; Osborne, M.A.; Howey, D.A. Gaussian process regression for forecasting battery state of health. J. Power Sources 2017, 357, 209–219. [Google Scholar] [CrossRef]
  14. Klass, V.; Behm, M.; Lindbergh, G. A support vector machine-based state-of-health estimation method for lithium-ion batteries under electric vehicle operation. J. Power Sources 2014, 270, 262–272. [Google Scholar] [CrossRef]
  15. Li, Y.; Zou, C.; Berecibar, M.; Nanini-Maury, E.; Chan, J.C.-W.; Bossche, P.v.D.; Van Mierlo, J.; Omar, N. Random forest regression for online capacity estimation of lithium-ion batteries. Appl. Energy 2018, 232, 197–210. [Google Scholar] [CrossRef]
  16. Li, Y.; Liu, K.; Foley, A.M.; Zülke, A.; Berecibar, M.; Nanini-Maury, E.; Van Mierlo, J.; Hoster, H.E. Data-driven health estimation and lifetime prediction of lithium-ion batteries: A review. Renew. Sustain. Energy Rev. 2019, 113, 109254. [Google Scholar] [CrossRef]
  17. Acar, Z.; Nguyen, P.; Cui, X.; Lau, K.C. Room temperature ionic liquids viscosity prediction from deep-learning models. Energy Mater. 2023, 3, 300039. [Google Scholar] [CrossRef]
  18. Zhang, Z.; Min, H.; Guo, H.; Yu, Y.; Sun, W.; Jiang, J.; Zhao, H. State of health estimation method for lithium-ion batteries using incremental capacity and long short-term memory network. J. Energy Storage 2023, 64, 107063. [Google Scholar] [CrossRef]
  19. Hong, J.; Li, K.; Liang, F.; Yang, H.; Zhang, C.; Yang, Q.; Wang, J. A novel state of health prediction method for battery system in real-world vehicles based on gated recurrent unit neural networks. Energy 2024, 289, 129918. [Google Scholar] [CrossRef]
  20. Chen, S.-Z.; Liang, Z.; Yuan, H.; Yang, L.; Xu, F.; Fan, Y. A novel state of health estimation method for lithium-ion batteries based on constant-voltage charging partial data and convolutional neural network. Energy 2023, 283, 129103. [Google Scholar] [CrossRef]
  21. Liu, S.; Chen, Z.; Yuan, L.; Xu, Z.; Jin, L.; Zhang, C. State of health estimation of lithium-ion batteries based on multi-feature extraction and temporal convolutional network. J. Energy Storage 2024, 75, 109658. [Google Scholar] [CrossRef]
  22. Ma, Y.; Li, J.; Gao, J.; Chen, H. State of health prediction of lithium-ion batteries under early partial data based on IWOA-BiLSTM with single feature. Energy 2024, 295, 131085. [Google Scholar] [CrossRef]
  23. Lee, G.; Kwon, D.; Lee, C. A convolutional neural network model for SOH estimation of Li-ion batteries with physical interpretability. Mech. Syst. Signal Process. 2023, 188, 110004. [Google Scholar] [CrossRef]
  24. Zou, C.; Chen, X.; Zhang, Y. State of Health prediction of lithium-ion batteries based on temporal degeneration feature extraction with Deep Cycle Attention Network. J. Energy Storage 2023, 65, 107367. [Google Scholar] [CrossRef]
  25. Lin, M.; Wu, J.; Meng, J.; Wang, W.; Wu, J. State of health estimation with attentional long short-term memory network for lithium-ion batteries. Energy 2023, 268, 126706. [Google Scholar] [CrossRef]
  26. He, T.; Gong, Z. State of health estimation for lithium-ion batteries using a hybrid neural network model with Multi-scale Convolutional Attention Mechanism. J. Power Sources 2024, 609, 234680. [Google Scholar] [CrossRef]
  27. Hong, J.; Chen, Y.; Chai, Q.; Lin, Q.; Wang, W. State-of-health estimation of lithium-ion batteries using a novel dual-stage attention mechanism based recurrent neural network. J. Energy Storage 2023, 72, 109297. [Google Scholar] [CrossRef]
  28. Yu, J. Health Degradation Detection and Monitoring of Lithium-Ion Battery Based on Adaptive Learning Method. IEEE Trans. Instrum. Meas. 2013, 63, 1709–1721. [Google Scholar] [CrossRef]
  29. Dubarry, M.; Liaw, B.Y. Identify capacity fading mechanism in a commercial LiFePO4 cell. J. Power Sources 2009, 194, 541–549. [Google Scholar] [CrossRef]
  30. Attia, P.M.; Bills, A.; Planella, F.B.; Dechent, P.; dos Reis, G.; Dubarry, M.; Gasper, P.; Gilchrist, R.; Greenbank, S.; Howey, D.; et al. Review—“Knees” in Lithium-Ion Battery Aging Trajectories. J. Electrochem. Soc. 2022, 169, 060517. [Google Scholar] [CrossRef]
  31. Hasan, M.N.; Qin, S. Degradation Curve Prediction of Lithium-Ion Batteries Based on Knee Point Detection Algorithm and Convolutional Neural Network. IEEE Trans. Instrum. Meas. 2022, 71, 3514810. [Google Scholar] [CrossRef]
  32. Baptista, M.L.; Henriques, E.M.; Goebel, K. More effective prognostics with elbow point detection and deep learning. Mech. Syst. Signal Process. 2020, 146, 106987. [Google Scholar] [CrossRef]
  33. Greenbank, S.; Howey, D. Automated Feature Extraction and Selection for Data-Driven Models of Rapid Battery Capacity Fade and End of Life. IEEE Trans. Ind. Inform. 2021, 18, 2965–2973. [Google Scholar] [CrossRef]
  34. Fermín-Cueto, P.; McTurk, E.; Allerhand, M.; Medina-Lopez, E.; Anjos, M.F.; Sylvester, J.; dos Reis, G. Identification and machine learning prediction of knee-point and knee-onset in capacity degradation curves of lithium-ion cells. Energy AI 2020, 1, 100006. [Google Scholar] [CrossRef]
  35. Diao, W.; Saxena, S.; Han, B.; Pecht, M. Algorithm to Determine the Knee Point on Capacity Fade Curves of Lithium-Ion Cells. Energies 2019, 12, 2910. [Google Scholar] [CrossRef]
  36. Zhang, C.; Wang, Y.; Gao, Y.; Wang, F.; Mu, B.; Zhang, W. Accelerated fading recognition for lithium-ion batteries with Nickel-Cobalt-Manganese cathode using quantile regression method. Appl. Energy 2019, 256, 113841. [Google Scholar] [CrossRef]
  37. Ronneberger, O.; Fischer, P.; Brox, T. U-Net: Convolutional Networks for Biomedical Image Segmentation (Version 1). arXiv 2015. [Google Scholar] [CrossRef]
  38. Oktay, O.; Schlemper, J.; Folgoc, L.L.; Lee, M.; Heinrich, M.; Misawa, K.; Mori, K.; McDonagh, S.; Hammerla, N.Y.; Kainz, B.; et al. Attention U-Net: Learning Where to Look for the Pancreas (Version 3). arXiv 2018. [Google Scholar] [CrossRef]
  39. Zhou, Z.; Siddiquee, M.M.R.; Tajbakhsh, N.; Liang, J. UNet++: A Nested U-Net Architecture for Medical Image Segmentation (Version 1). arXiv 2018. [Google Scholar] [CrossRef]
  40. Woo, S.; Park, J.; Lee, J.-Y.; Kweon, I.S. CBAM: Convolutional Block Attention Module (Version 2). arXiv 2018. [Google Scholar] [CrossRef]
  41. Wang, F.; Zhai, Z.; Liu, B.; Zheng, S.; Zhao, Z.; Chen, X. Open access dataset, code library and benchmarking deep learning approaches for state-of-health estimation of lithium-ion batteries. J. Energy Storage 2024, 77, 109884. [Google Scholar] [CrossRef]
  42. Hochreiter, S.; Schmidhuber, J. Long short-term memory. Neural Comput. 1997, 9, 1735–1780. [Google Scholar] [CrossRef] [PubMed]
  43. Cho, K.; van Merriënboer, B.; Gulcehre, C.; Bahdanau, D.; Bougares, F.; Schwenk, H.; Bengio, Y. Learning Phrase Representations Using RNN Encoder-Decoder for Statistical Machine Translation. In Proceedings of the 2014 Conference on Empirical Methods in Natural Language Processing (EMNLP), Doha, Qatar, 25–29 October 2014; pp. 1724–1734. [Google Scholar]
  44. Rumelhart, D.E.; Hinton, G.E.; Williams, R.J. Learning Internal Representations by Error Propagation; Technical Report; California Univ San Diego La Jolla Inst for Cognitive Science: La Jolla, CA, USA, 1985. [Google Scholar]
Figure 1. Illustration of the proposed battery SOH estimation method.
Electronics 13 03244 g001
Figure 2. (a) Battery capacity degradation curve. (b) Multi-stage performance degradation and knee point between stages.
Electronics 13 03244 g002
Figure 3. Multi-stage geometric knee point division process.
Electronics 13 03244 g003
Figure 4. General division process: (a) knee point A is used to delineate stage 3, and (b) knee point B is used to delineate stage 1 and stage 2.
Electronics 13 03244 g004
Figure 5. Dividing process in XJTU battery dataset: (a) knee point A is used to delineate stage 1, and (b) knee point B is used to delineate stage 2 and stage 3.
Electronics 13 03244 g005
Figure 6. Proposed network structure.
Electronics 13 03244 g006
Figure 7. U-Net structure for battery degradation data input.
Electronics 13 03244 g007
Figure 8. Mixed attention module.
Electronics 13 03244 g008
Figure 9. Feature attention module.
Electronics 13 03244 g009
Figure 10. Time step attention module.
Electronics 13 03244 g010
Figure 11. Capacity degradation curve based on dataset of (a) Batch1, (b) Batch2, and (c) Batch3.
Electronics 13 03244 g011
Figure 12. Leave-one-out cross validation visualization.
Electronics 13 03244 g012
Figure 13. Proposed SOH prediction framework visualizes the results of Batch1, Batch2, and Batch3 (The blue line represents the true value, while the red line represents the predicted value).
Electronics 13 03244 g013
Figure 14. Battery SOH estimation comparison results among different methods under Batch1.
Electronics 13 03244 g014
Table 1. Results of the stage division under Batch1.
Battery IDMulti-Stage (Cycle)
11~2829~236237~389
21~2627~229230~406
31~2627~221222~392
41~2728~230231~395
51~2425~234235~402
61~2829~245246~407
71~1920~233234~401
81~2829~278279~419
Table 2. Prediction results using LSTM model under two different data processing strategies.
LSTM
Multi-StageNon-Stage
MAE (%)RMSE (%)MAE (%)RMSE (%)
Batch11.932.682.012.79
Batch21.491.821.551.92
Batch31.752.552.483.25
Bold represents the best result in the same Batch.
Table 3. Prediction results using U-Net model under two different data processing strategies.
U-Net
Multi-StageNon-Stage
MAE (%)RMSE (%)MAE (%)RMSE (%)
Batch11.141.651.461.67
Batch21.271.851.281.62
Batch30.811.211.481.71
Bold represents the best result in the same Batch.
Table 4. Prediction results using mixed attention U-Net model under two different data processing strategies.
Mixed Attention U-Net
Multi-StageNon-Stage
MAE (%)RMSE (%)MAE (%)RMSE (%)
Batch11.021.401.281.5
Batch21.041.501.161.42
Batch30.661.040.861.08
Bold represents the best result in the same Batch.
Table 5. Comparison results of SOH prediction performance among different methods.
TypeMethodSource BatteryRMSE (%)MAE (%)
Non-stageLSTMBatch 12.792.01
Batch 21.921.55
Batch 33.252.48
GRUBatch 12.782.13
Batch 22.191.79
Batch 33.612.89
U-NetBatch 11.671.46
Batch 21.621.28
Batch 31.711.48
MLPBatch 11.761.49
Batch 21.581.24
Batch 31.521.32
Mixed Attention U-NetBatch 11.501.28
Batch 21.421.16
Batch 31.080.86
Multi-stageMixed Attention U-NetBatch 11.401.02
Batch 21.501.04
Batch 31.040.66
Bold represents the best result in the same Batch.
Disclaimer/Publisher’s Note: The statements, opinions and data contained in all publications are solely those of the individual author(s) and contributor(s) and not of MDPI and/or the editor(s). MDPI and/or the editor(s) disclaim responsibility for any injury to people or property resulting from any ideas, methods, instructions or products referred to in the content.

