Abstract
Co-resident attacks are serious security threats in multi-tenant public cloud platforms. They are often implemented by building side channels between virtual machines (VMs) hosted on the same cloud server. Traditional defense methods are troubled by the deployment cost. The existing tenant classification methods can hardly cope with the real dataset that is quite large and extremely unevenly distributed, and may have problems in the processing speed considering the computation complexity of the DBSCAN algorithm. In this paper, we propose a novel co-resident attack defense strategy which solve these problems through an improved and efficient multi-level clustering algorithm and semi-supervised classification method. We propose a novel multi-level clustering algorithm which can efficiently reduce the complexity, since only a few parameter adjustments are required. Built on the proposed clustering algorithm, a semi-supervised classification model is designed. The experimental results of the classification effect and training speed show that our model achieves F-scores of over 85% and is significantly faster than traditional SVM classification methods. Based on the classification of unlabeled tenants into different security groups, the cloud service provider may modify the VM placement policy to achieve physical isolation among different groups, reducing the co-residency probability between attackers and target tenants. Experiments are conducted on a large-scale dataset collected from Azure Cloud Platform. The results show that the proposed model achieves 97.86% accuracy and an average 96.06% F-score, proving the effectiveness and feasibility of the proposed defense strategy.
1. Introduction
The virtualization technique [1] allows multiple virtual machines (VMs) to be deployed on the same physical server to achieve logical isolation. This service model significantly improves the utilization of cloud resources, but also brings new security challenges to cloud computing systems [2]. Since tenants are not physically isolated and forced to share resources, malicious attackers have the opportunity to attack other tenants on the same physical server by building side channels. This kind of attack is called a co-resident attack in cloud environments. The concept of co-resident attack was first proposed in [3]. Thomas et al. conducted experiments on Amazon’s EC2 cloud platform, proving that a co-resident rate of up to 40% can be achieved by traditional side-channel attacks at very little cost. It means that attackers can easily steal sensitive data of other tenants by initiating a large-scale co-resident attack, which poses a significant threat to the cloud platform’s security.
To defend against co-resident attacks, researchers have come up with solutions in several ways (as detailed in Section 2). Most works focus on the elimination of side channels. However, these methods usually require the modification of the hardware structure, which is too costly and time-consuming to be accepted by cloud service providers.
Considering these problems, the co-resident attack defense strategy based on tenant classification was proposed in [4,5]. The main idea is to classify tenants into different security groups. Then, by adjusting the VM placement policy, these different security groups are allowed to be placed in different physical server groups to reduce the co-residency probability between malicious VMs and normal VMs. The whole tenant classification is built on the unlabeled tenants’ behavior dataset and includes two tasks (i.e., clustering and semi-supervised classification). The NeCTAR dataset used in [4] is collected from a cloud platform that is created for scientific research. Since the data scale is small and the platform is non-commercial, the result is limited in explaining the real commercial cloud environment. In [5], they used an Azure real-world dataset, which includes more than 12,000 service subscribers to conduct their experiment. As discussed in [5], models based on DBSCAN clustering and neural network classification have problems in dealing with unbalanced datasets. Also, it is difficult in parameter regulation, especially performing suboptimally on minority classes (the F-scores are 60.9% and 77.3%, respectively) that are usually more important. Another problem is that in the studies of [4,5], one-time DBSCAN clustering was implemented to group all tenants. Although some optimizations were adopted, it may be difficult to achieve the desired outcomes when considering the real dataset that is quite large and extremely unevenly distributed. The existing methods can hardly cope with it and may have problems in the processing speed considering the computation complexity of the DBSCAN algorithm. This paper aims to address these problems through an improved and efficient multi-level clustering algorithm and semi-supervised classification method.
To implement the proposed defense strategy, we perform data preprocessing first. Then, for the clustering, we propose a new multi-level clustering algorithm based on HDBSCAN to cope with the difficulties of skew distribution and the new algorithm can efficiently reduce the complexity since only a few parameter adjustments are required. We accordingly design a multi-level support vector machine (SVM) classification method based on a decision tree (referred to as MSVMT) to improve the clustering and classification performance. The idea is to train multiple SVMs for different tenant groups. When a new VM request arrives, the corresponding SVM is called to classify the tenant. Finally, the classified tenants’ VMs are placed in the predetermined physical server groups. Since attackers must carefully disguise themselves as target tenants, the cost is greatly increased, therefore effectively disincentivizing the co-resident attacks. Moreover, we choose a large-scale real-world dataset, i.e., the Azure Trace for Packing 2020 [6], for this research. It contains more than a million tenants with over 5.5 million VM records, more practical than the datasets adopted in [4,5] to simulate the real cloud environment. More specific contributions made in this work are as follows:
- An improved co-resident attack defense strategy based on multi-level tenant classification is introduced. The strategy is able to classify tenants with different security levels, so the cloud providers are allowed to physically isolate them to reduce the co-residency probability.
- A multi-level clustering algorithm is proposed, which can deal with the problem of unevenly distributed datasets.
- Built on the proposed clustering algorithm, a semi-supervised classification model named MSVMT is designed.
- Based on the real-world and large-scale dataset collected from the commercial cloud platform, we profile the behavior patterns of tenants with different security levels and extract proper features to represent their behaviors. It provides a new idea for processing totally unlabeled data.
The rest of this paper is managed as follows: In Section 2, we discuss the related work. The behavior patterns of attackers are analyzed and the proposed defense strategy is outlined in Section 3. The proposed defense method is described in detail in Section 4. The experimental evaluation is presented in Section 5. Our work is further discussed and concluded in Section 6.
2. Related Work
VMs deployed on the same physical server can launch co-resident attacks, posing serious threats to tenants in the cloud. The study of co-resident attack defense methods can roughly be categorized into the following aspects.
2.1. Traditional Defense Strategy
In multi-tenant cloud environments, side channels have been used to bypass virtual machine isolation. Attackers may monitor performance characteristics of shared infrastructure (e.g., CPU utilization, memory access patterns) to infer activities of other tenants. This leakage of information can lead to privacy breaches or security vulnerabilities. The most frequently used method is the elimination of side channels. Some researchers have found that side channels in cloud environments rely on high-resolution clocks. Therefore, in the studies of [7,8], clock removal methods were proposed. Vattikonda et al. [7] considered a new approach: weakening malicious virtual machines’ ability to receive a signal by eliminating fine-grained timers. Aviram et al. [8] proposed a new approach to timing channel control, using provider-enforced deterministic execution instead of resource partitioning to eliminate timing channels within a shared cloud domain. Yu et al. [9] designed a zero-knowledge deduplication response framework to limit deduplication-based side channels. All these methods require changes to the existing cloud architecture (incurring vast cost) and are hardly supported by cloud service providers.
Other strategies such as VM migration [10], abnormal behavior detection [11], and network measurements [3] also suffer from a high implementation cost. VM migration involves using the Vickrey–Clarke–Groves (VCG) technique to periodically move VMs to different hosts to reduce the likelihood of co-residence. Abnormal behavior detection involves detecting abnormalities in system calls, CPU and RAM consumption, and cache miss behavior that may indicate an attacker using the Prime + Probe [12,13] approach to steal information. Network measurements involve utilizing network measurements to identify whether two VMs are on the same server.
Another acceptable defense method is the modification of the VM placement policy. Azar et al. [14] designed a Co-Location-Resistant (CLR) algorithm to mark all physical servers as either “open” or “close”. Only servers in an “open” state can accept new VMs. Qiu et al. [15] proposed a co-residency-resistant VM placement strategy that diffuses first and concentrates later. When the number of VMs started by one user exceeds the threshold, the excess should be concentrated on special hosts until the security is confirmed. Despite lower cost, such methods are underperformed with small and medium-sized platforms since only a few physical machines exist there.
2.2. Partition- and Replication-Based Defense Strategy
Recently, a series of research has been conducted to defend against co-resident attacks using techniques that are more easily implemented. In terms of improving the data security, the data partition technique was applied to prevent malicious attackers from sensitive data. Only when a full co-residence coverage (FCC) is achieved can the data theft succeed. Considering that partitioning may also increase the probability of data corruption and reduce the data reliability, the optimal data partition policy was investigated in [16] to balance the data reliability and security. The authors of [16] made original contributions by formulating and solving constrained optimization problems to balance the data theft and data corruption probabilities.
In terms of improving the service reliability, the replication technique has gradually become a popular direction, which benefits from the low-cost replication in cloud systems. In [17], the replication technique and the task cancelation mechanism were combined to reduce the theft probability, where the remaining task executions are canceled as long as one task is successfully performed.
Another interesting and novel direction is the N-version programming (NVP) approach. Compared with the traditional replication, it uses both the redundancy technique and the voting/election algorithm to ensure high reliability. In [18], the NVP approach-based service component success probability and service corruption attack success probability were evaluated.
2.3. Machine Learning-Based Tenant Classification
Both partition and replication address the co-resident attacks from the user’s perspective. They provide a flexible solution, but their feasibility in the general cloud systems still remains to be evaluated. Along these efforts, another promising research direction is the application of machine learning (ML) techniques in tenant classifications. It also concentrates on the aspect of users’ service requests but avoids the subtle problem of balancing data reliability and data security, providing a simpler solution that can be quickly deployed in most kinds of cloud systems.
Tenant classification refers to a process that divides tenants into different groups according to the analysis of their VMs’ usage records. These different groups are then assigned to isolate physical machine groups by adjusting the VM placement policy, which radically reduces the probability of co-residency. Han et al. [4] divided tenants into three security levels by using the DBSCAN clustering algorithm and semi-supervised learning model, and proved its effectiveness through game theory analysis. Based on the work of [4], Han et al. [5] presented a fine-grained model to quantify the risk level caused by co-residency and carried out further experiments on a large-scale and real-world dataset collected from the Azure Platform. The deep learning model they trained performed excellently in the classification of the majority class but poorly in the minority class. However, in the real environment, malicious tenants only take up a very small portion, so the dataset tends to be extremely imbalanced.
3. Attack Model and Behavior Analysis
In this section, we describe the scenarios in which co-resident attacks occur, and analyze the behavior patterns of malicious attackers.
3.1. Attack Model
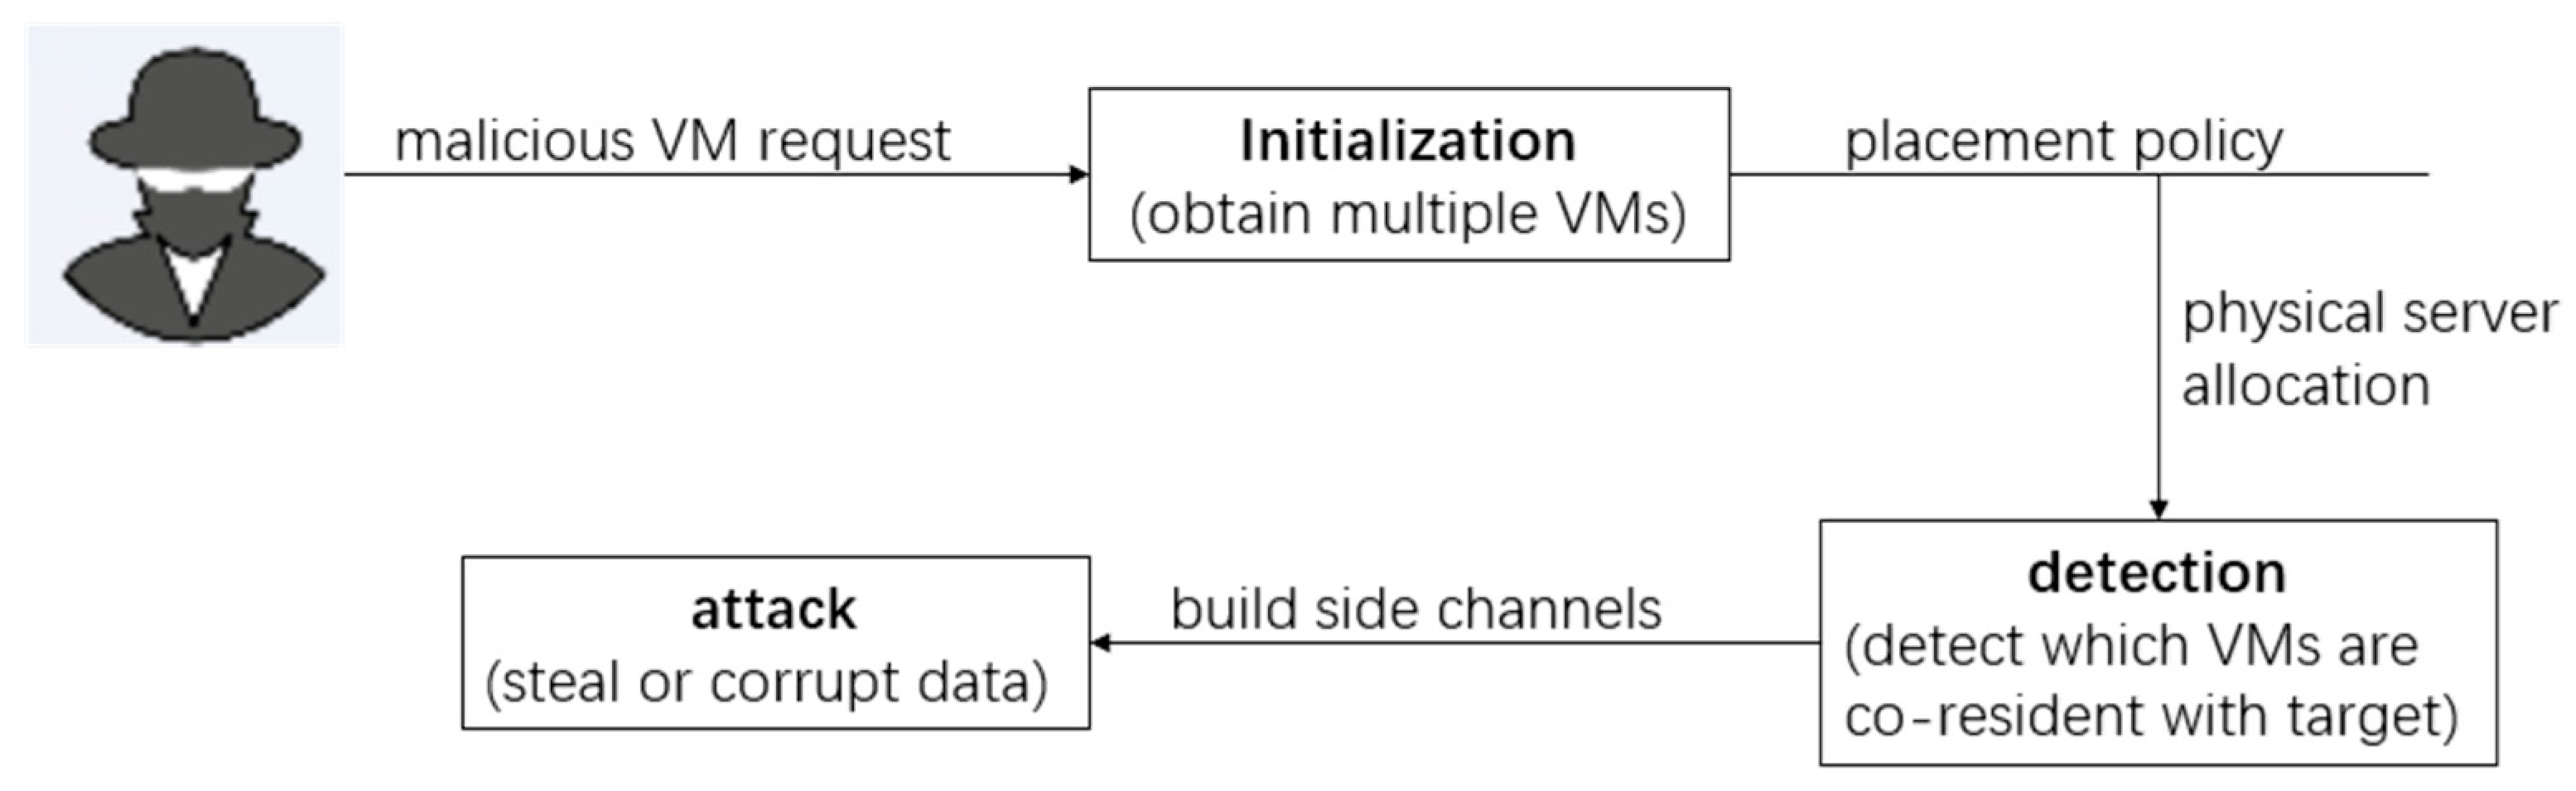
The co-resident attack discussed in this paper is implemented with the following steps. First, the attacker has a clear target, and their target tenant has maintained one or several VMs in the cloud. The attacker’s goal is to keep as many of their malicious VMs as possible on the same physical server where the target VMs exist. Therefore, after the attacker starts their VMs under the VM placement policy applied in the cloud system, they should detect whether the co-residency is successful. Once co-resident VMs are detected, the attacker builds side channels to steal sensitive information or disrupt the task execution of the target tenant. The process of a co-resident attack is shown in Figure 1.

Figure 1.
The process of a co-resident attack.
It should be noticed that before the attacker starts acting, they must make sure that their malicious VMs can co-reside successfully with the target VMs. In general, an attacker can use a brute-force strategy that initiates a large number of VMs and expects some of them to be co-resident with the target’s VMs. In September 2017, the McAfee Labs quarterly report estimated that brute-force attacks represent 20% of total network attacks, making them the most prevalent type of attack ex aequo with browser-based vulnerabilities [19]. These attacks have sometimes catastrophic consequences. Therefore, co-residency detection may play an important role in the design of the co-resident attack defense strategy.
The simplest way to detect co-residency is by using network measurement. For example, an attacker can obtain the Dom0 IP address of the target VM by starting a TCP route tracking operation. Two identical Dom0 IP addresses indicate that the VMs are co-residing on the same server. Although such detection technique is banned in many cloud platforms, attackers still can develop some specific methods to achieve their goals, as pointed out in [20], even if these methods are now lacking reliability and universality. Since new attack techniques are continuously emerging, a long-standing and more general defense method is desired.
Under the co-resident attack model described above, we make the following security assumptions: (1) Cloud service providers and malicious attackers are hostile. Cloud service providers want to avoid attackers’ damage as much as possible. That is, attackers cannot gain access to the details of the VM placement policy in the cloud environment. (2) Cloud computing resources are limited, so costs and performance degradation are expected to be as small as possible. (3) The price that attackers can accept is also limited. So, some measures are adopted to reduce the costs, such as shutting down VMs that fail to co-reside with the target. (4) To conduct co-resident attacks, malicious tenants behave differently from normal tenants.
The defense strategy proposed is applicable to most multi-tenant cloud platforms. Since part of the tenants can be labeled by tracking and analyzing their VM usage records, we can train our classification model in a semi-supervised manner. When tenants are classified into different security levels by our model, achieving co-residency becomes more costly for attackers.
3.2. Analysis of Attackers’ Behavior
According to the attack model description and studies in [4,5,20], the potential attackers tend to request a large number of VMs in a very short time. To be specific, compared with normal tenants, they appear to behave as follows:
More VMs are started to increase the probability of co-residency.
The time interval between starting two VMs is considerably short. In other words, attackers are likely to start lots of malicious VMs at about the same time.
Most malicious VMs have a short running time because VMs that fail to co-reside should be shut down immediately to save cost.
In fact, real-world cloud environments are likely to have very few attackers. Most of the tenants are normal users, and among them, inactive tenants account for the majority. We aim to provide a feasible solution to classify tenants effectively, especially isolating the dangerous ones.
4. Proposed Defense Strategy
The proposed co-resident attack defense strategy includes two tasks: clustering and semi-supervised classification.
4.1. Overall Design
In real-world scenarios, most datasets are often unlabeled. Labeled datasets are difficult to acquire. The public dataset used in this paper (i.e., the Azure Trace for Packing 2020) is one of the unlabeled datasets. A feasible solution to deal with the unlabeled dataset is to manually label part of the data by adopting a clustering method and then use semi-supervised learning methods to classify the rest. A few researchers have experimented with similar approaches in previous works, and some results have been achieved [4,5], as reviewed in Section II.C. In this section, we present an improved defense strategy based on an efficient multi-level clustering algorithm and semi-supervised classification method.
- (1)
- Clustering Task: To implement the proposed defense strategy, we perform data preprocessing first, including noise removal, feature extraction, and data normalization. Then, for the clustering task, we propose a multi-level clustering algorithm based on HDBSCAN to cope with the difficulties of skew distribution and parameter adjustment problems. The algorithm helps to capture local details of the data and avoid the complicated parameter adjustment process. Eventually, the partially labeled data we manually select from the clustering results are used for the subsequent classification task.
- (2)
- Classification Task: We design a multi-level SVM classification model based on a decision tree (MSVMT) to perform the classification task. The idea is to train multiple SVMs for different tenant groups. When a new VM request arrives, the corresponding SVM is called to classify the tenant who initiated this request. The experiment shows that our model performs effectively on the classification and possesses a good generalization ability.
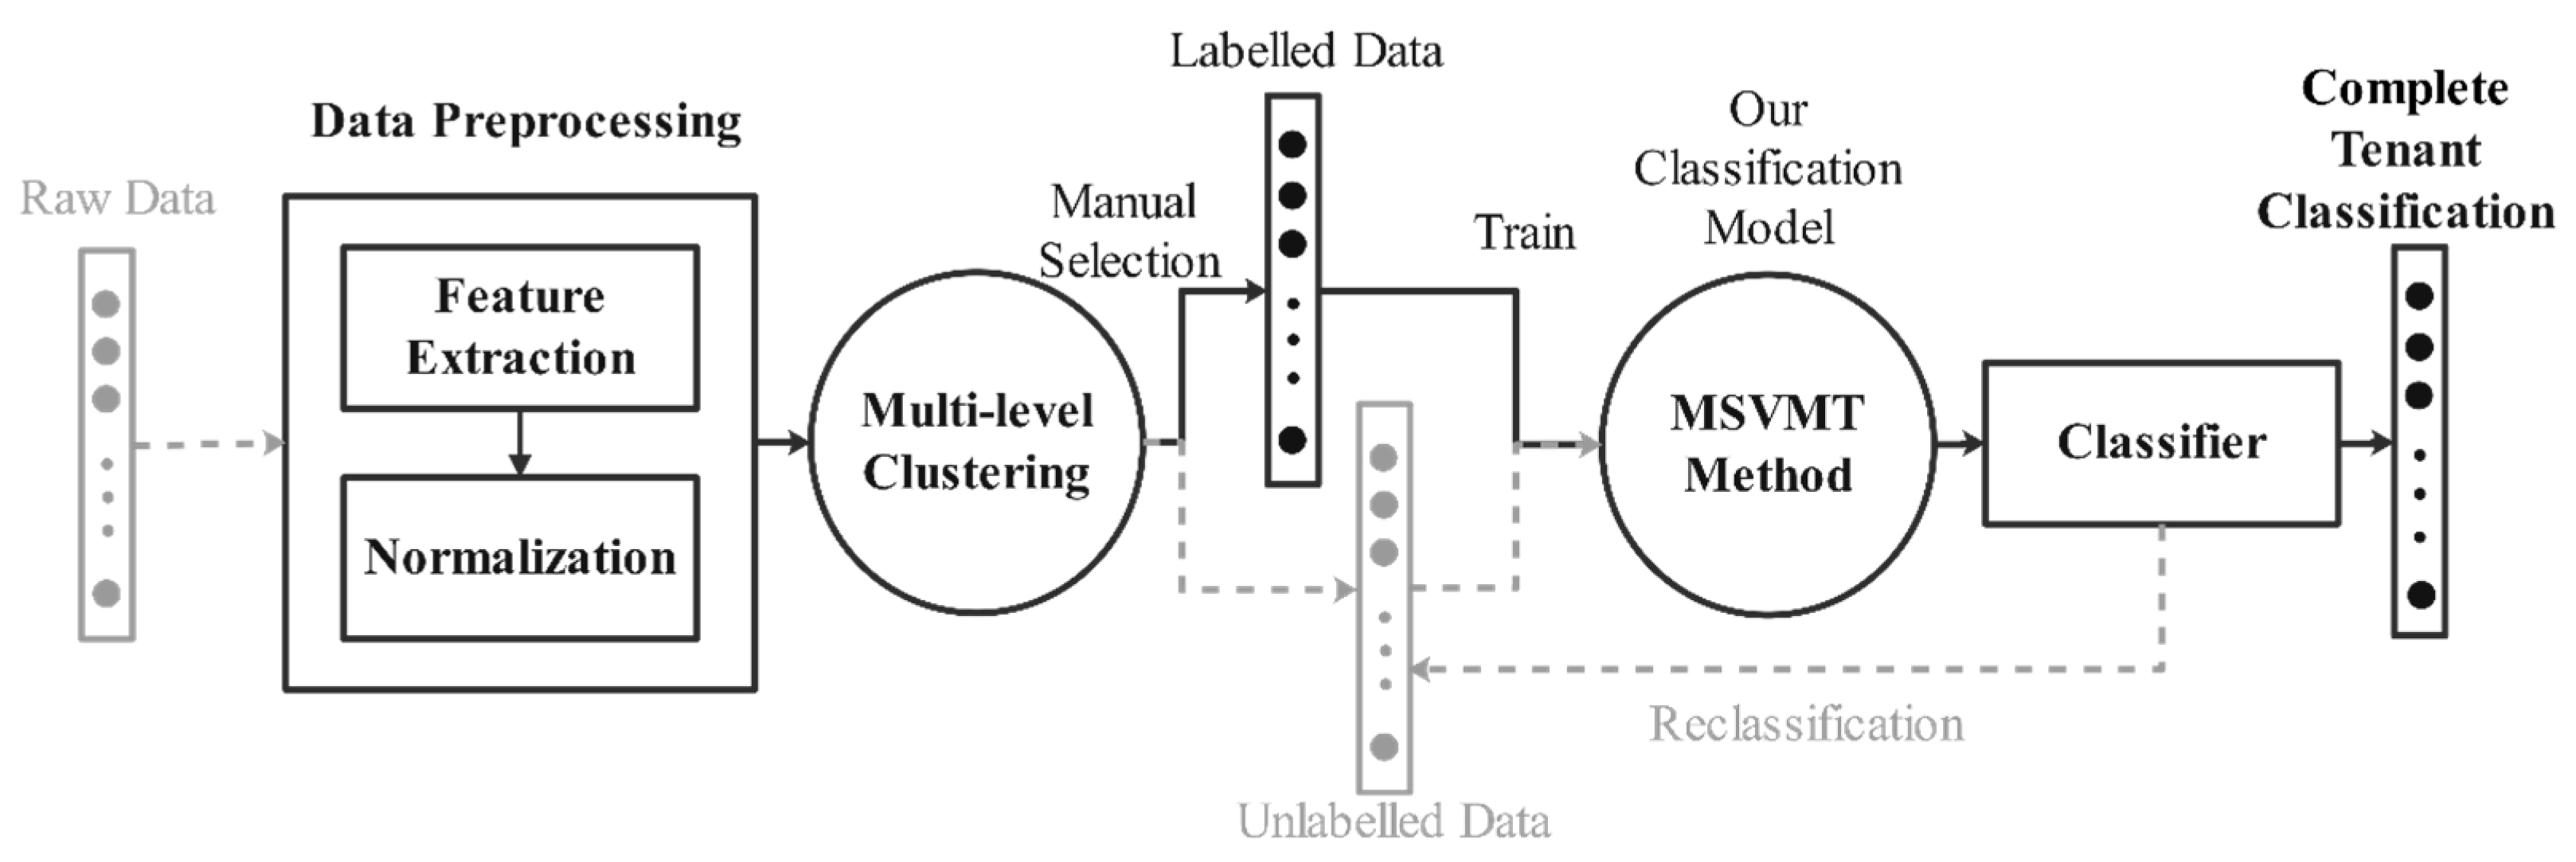
Figure 2 shows the overall design of the proposed defense strategy. The strategy implementation can be divided into two phases, training a classifier and classifying tenants. Based on clustering and classification, a MSVMT classifier using both unlabeled and labeled tenants is trained. The training process is an offline process and runs only once. When a new VM request arrives, the proposed classifier can quickly and accurately classify the tenant. Finally, the classified tenants’ VMs are placed in the predetermined physical server groups.
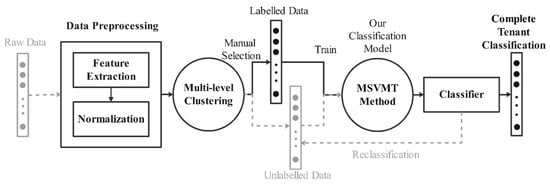
Figure 2.
Overall design.
Section 4.2 introduces our dataset and the extracted features. Section 4.3 elaborates on the clustering algorithm. Section 4.4 describes the classification model in detail.
4.2. Dataset and Feature Extraction
Commercial cloud platforms do not easily disclose the VM usage records of their tenants, but the real datasets of such records are of great significance for research. The dataset used in this paper is called the Azure Trace for Packing 2020, a dataset published by the Azure cloud platform (to the best of our knowledge, it is the latest dataset up until now). It tracks the information of VMs initiated by tenants from a certain area within 14 days, including 5.5 million VMs and more than 1 million tenants, thus offering us a very large amount of real tenant data.
As shown in Table 1, each VM possesses six attributes in the provided dataset. Considering that most tenants’ vmTypeId and priority are identical and that they exert little effect on distinguishing tenants, we mainly use the remaining attributes. Similar assumptions can also be found in [3] with a more detailed description.

Table 1.
Azure dataset schema.
We extract three features to represent the VM usage behavior of a tenant. These features are described below and summarized in Table 2:
Table 2.
Three-dimensional features and their descriptions.
- N—the total number of VMs started by the tenant. The greater this value is, the more VMs the tenant has started.
- —the median value of a tenant’s VMs’ running time. The total time or average time is not adopted because we have to consider that some tenants, like potential attackers, keep most of their VMs running for a very short time, and only a small part can last longer. So the median value can better reflect this malicious behavior pattern.
- —the average interval time between two consecutive VMs started by the same tenant. This feature is rather important for attackers because when a co-resident attack is launched, the attacker tends to start many VMs in a short time. So, should be relatively small for attackers.
Considering the large scale of the original dataset, we only use a part of it for research in this paper. We select the tenants appearing on the first day, which includes 141,336 tenants. This selection is informative and acceptable considering that the size of the selected data is large enough to support our experiments and presents a similar distribution with the whole data.
The dataset is expressed as data = {U1, U2, U3, …, UN}, where Ui represents a single tenant whose behavior pattern is described as Ui = {N, , }.
4.3. Multi-Level Clustering
We propose a tenant partitioning method by implementing a multi-level clustering algorithm based on HDBSCAN. Aside from capturing the malicious tenant group, it can divide the remaining tenants layer by layer into multi-level low-risk groups. Similar assumptions (high-risk, medium-risk and low-risk) can also be found in [4] with a more detailed description. The details are described as follows.
HBDSCAN Algorithm: We choose HDBSCAN [21], an improved version of DBSCAN, as our clustering algorithm. It not only retains the original advantages of DBSCAN (like the ability to deal with outliers and obtain unbiased clustering results), but also solves the problems that DBSCAN relies heavily on parameter adjustment and fails to find clusters of varying densities. That is, only with little or no parameter tuning can HDBSCAN return a stable clustering result, which exactly meets the needs of our experiments.
There is only one main parameter named min-cluster-size in the HDBSCAN algorithm, which defines the minimum cluster size. The value of this parameter exerts an insignificant effect on the clustering result. Compared with the DBSCAN-based method in [5], the parameter tuning in the HDBSCAN algorithm is more intuitive and easier.
Problems in One-Time Clustering: In the previous work, the clustering algorithm is executed only once to complete the clustering task. Based on the analysis of the tenant features and the clustering results, we reveal the following problems with the one-time clustering.
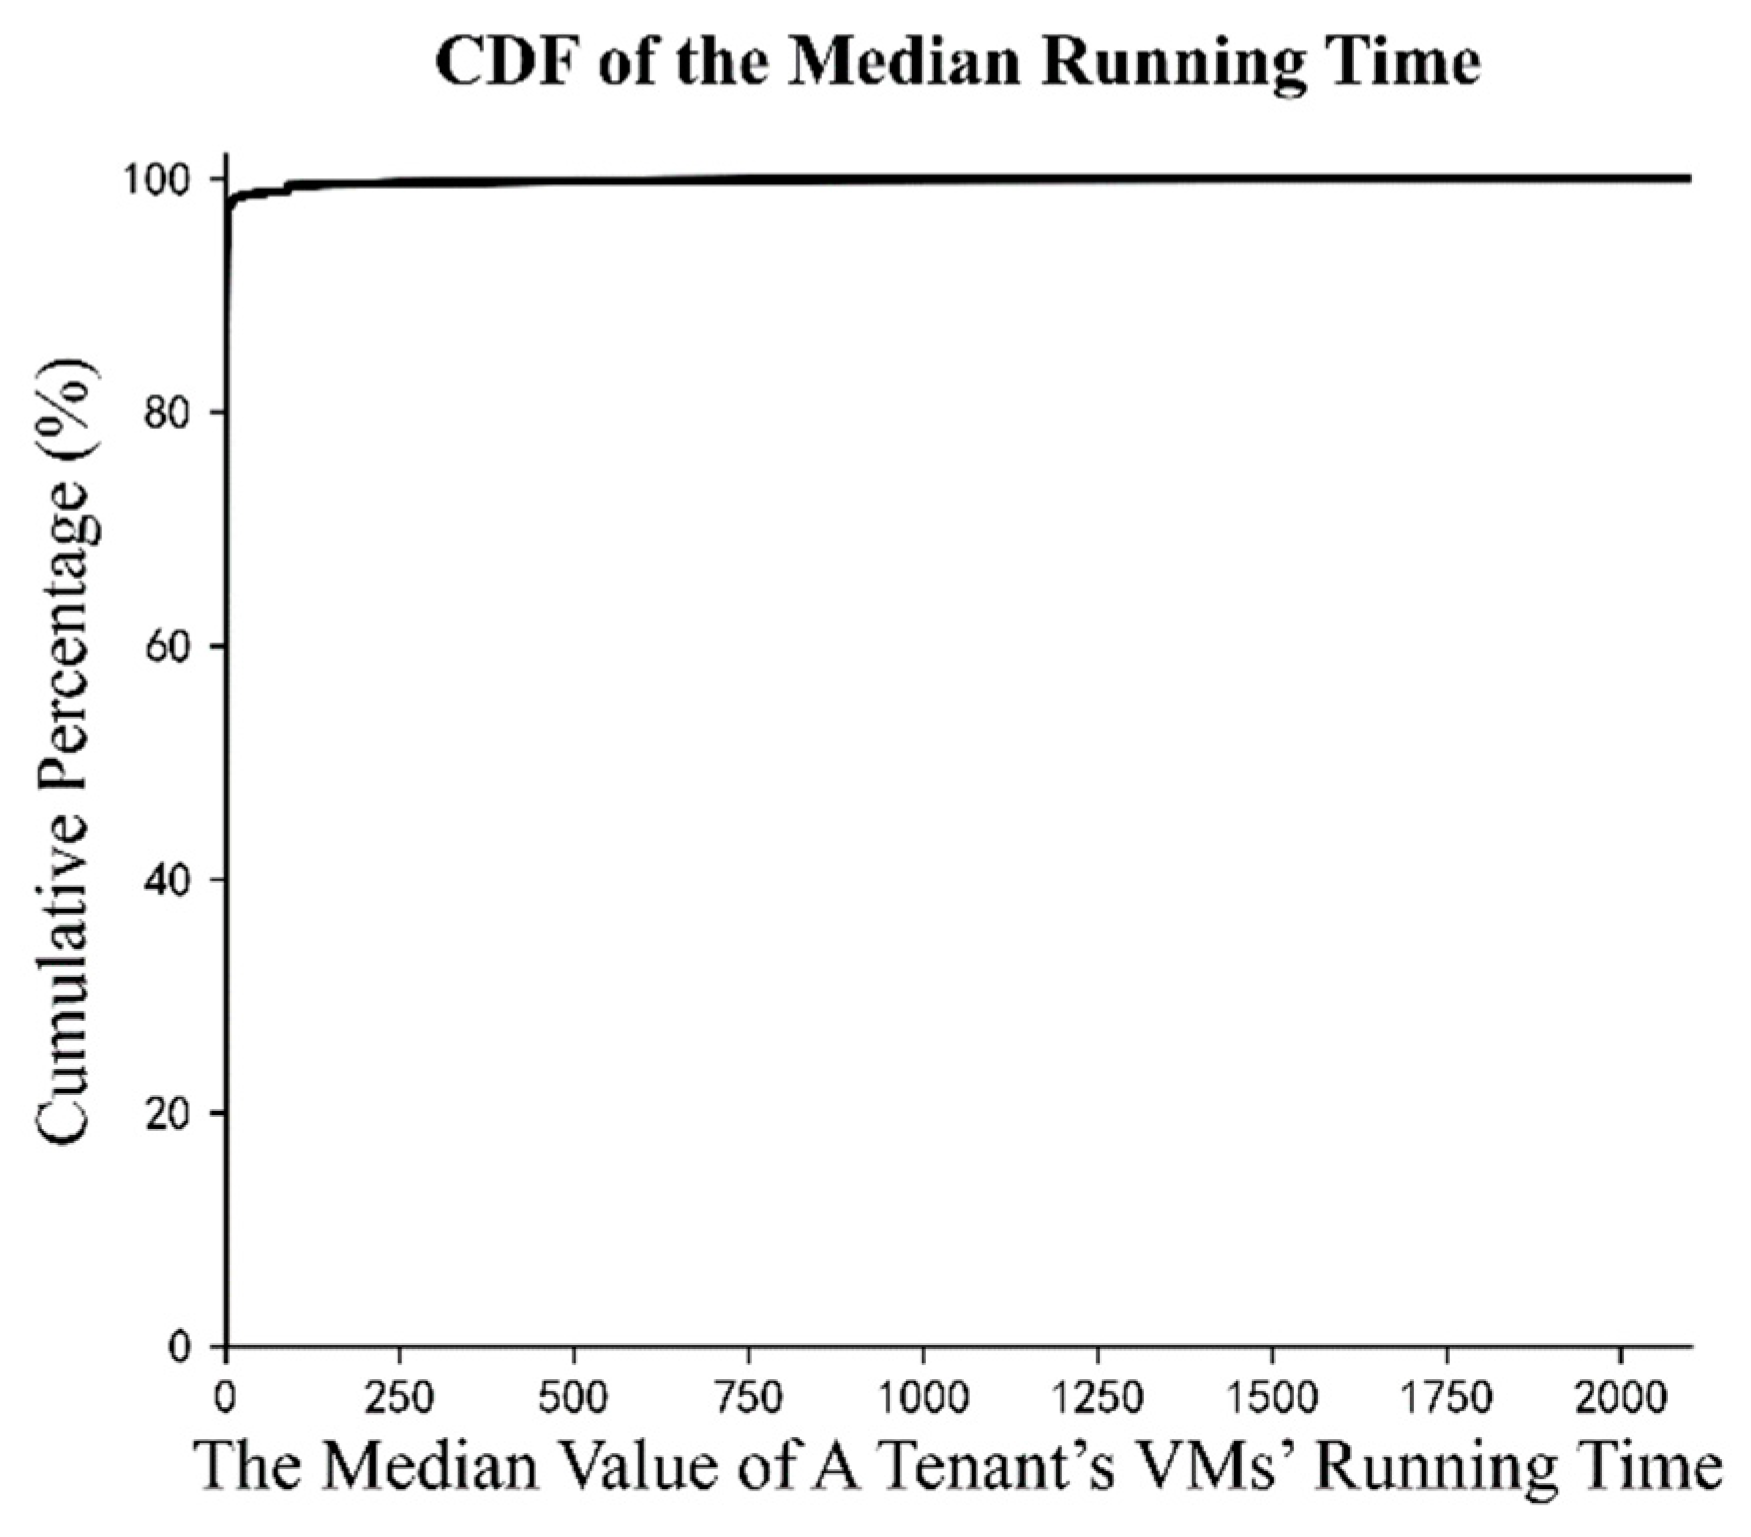
As mentioned above, we extract three features to represent the behavior patterns of tenants. The problem is that all features possess uneven distributions. Take for example. Figure 3 shows the cumulative distribution of the median value of the running time of a tenant’s VMs. It suggests that when discussing the median running time, a tiny number of the tenants can reach up to more than 2000 days, while the large majority, accounting for over 95 percent of the tenants, are finished in only a few days. Not only with the median running time, but the other two features also present a similar skewed distribution. This results in a considerable number of tenants being compressed together after normalization. Therefore, it is hard or even impossible to obtain satisfactory clustering results through the one-time clustering method.
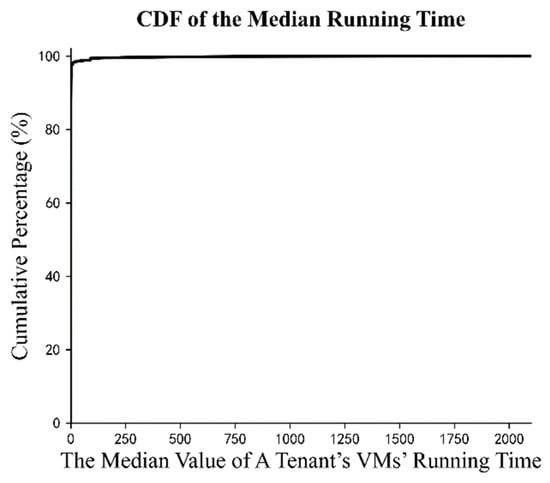
Figure 3.
Cumulative distribution function of feature .
This problem can also be observed in the experiments we have tried when completing the clustering task. Regardless of the parameter value, most tenants are concentrated in one area where all three features are relatively small, which we regard as an inactive area. The reason is the existence of extreme data, which prevents us from obtaining more detailed classification. Considering that those extreme data tend to offer more values when analyzing the tenants’ behaviors, we cannot simply abandon them.
The Multi-Level Clustering Algorithm Based on HDBSCAN: Since the one-time clustering fails to return expected results on the unevenly distributed data that exist in most cloud platforms, we suggest a new feasible solution. Caused by the extreme data distribution, one-time clustering always separates tenants into two areas. Based on this observation, we develop a multi-level clustering method accordingly. For every clustering, we selectively pick up the clusters that are separated from the majority, and after several times, the multiple recommended tenant groups will be returned. The multi-level clustering is terminated until the data range is small enough. Note that the malicious tenants should be labeled in the first clustering; only normal tenants are grouped layer by layer in the subsequent clusterings. With this algorithm, the low-risk tenants are divided into multiple sub-areas, making it more difficult for attackers to achieve co-residency with target tenants.
In addition, we take increasing parameter values for each clustering to control the number of generated clusters. The closer we get to the majority of the tenants, the more upward the trend in the distribution density, and the larger the number of tenants.
The specific process of the multi-level HDBSCAN clustering is shown in Algorithm 1, which can be summarized as follows:
| Algorithm 1 Multi-Level HDBSCAN Clustering |
| Input: Azure Trace for Packing 2020 Dataset S |
| Output: Labelled groups G; Unlabelled groups U 1: S = FeatureExtraction (S) 2: G = {}; 3: U = {}; 4: k = 1 5: repeat 6: N = Normalized (S) 7: clusters = HDBSCAN(N); 8: low_risk_group_k = LabelGroupLow (clusters) 9: G = G ∪ low_risk_group_k 10: if k = 1 then 11: high_risk_group = LabelGroupHigh (clusters) 12: G = G ∪ high_risk_group 13: end if 14: k = k + 1 15: S = S − G 16: until len (clusters) < 1 17: U = S − G; 18: return Labelled groups G; Unlabelled groups U |
In the first HDBSCAN clustering, a smaller minimum cluster size is adopted. We choose target tenant groups manually from the clustering result, including the high-risk group representing potential attackers and low-risk group 1, representing the safest tenants.
In the next clusterings, we gradually increase the minimum cluster size and pick only low-risk tenant clusters that are separated from most tenants each time. For example, we increase the parameter value in the second clustering and pick low-risk group 2 from the clustering result. Therefore, after the k-th clustering is completed, we have the low-risk group k.
Termination rules: The multi-level clustering method aims to separate groups from ordinary tenants who make up the vast majority. When no groups can be separated, that is, only one (generally representing the ordinary group) or probably no group is returned, we assume that the algorithm has reached its bottleneck and the multi-level clustering terminates.
Result: Both labeled and unlabeled tenants are used to train our classification model together, while the trained classifier will again classify the latter. Those tenants who cannot fall into any groups after both the clustering and classification are considered as having medium risk.
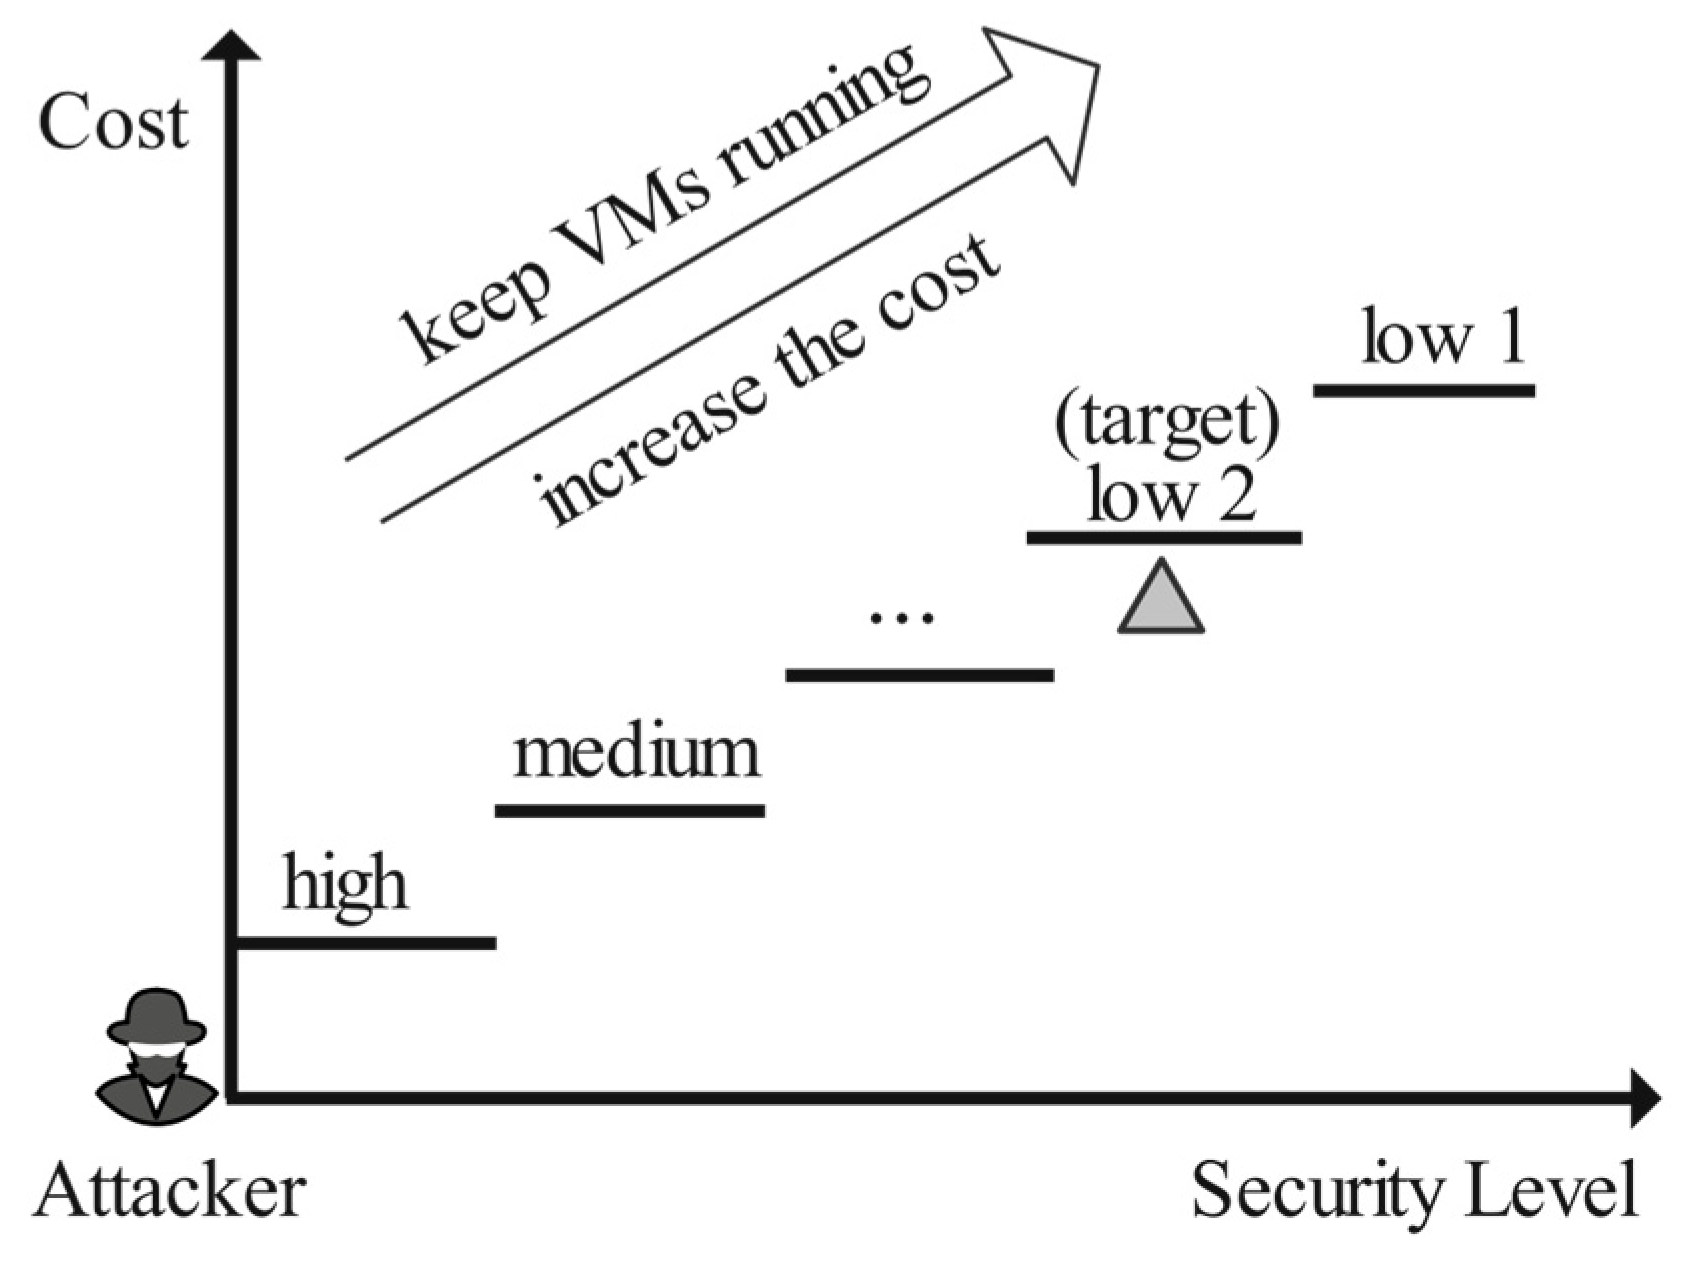
By adopting the multi-level clustering method, an attacker must carefully disguise themself to match the corresponding behavior patterns and may need to cross multiple levels to finally enter the group where the target tenant is located. Considering the difficulty and the cost of launching co-resident attacks under the proposed method, the tenants in cloud environments may be protected. The multi-level risk division strategy is shown in Figure 4.
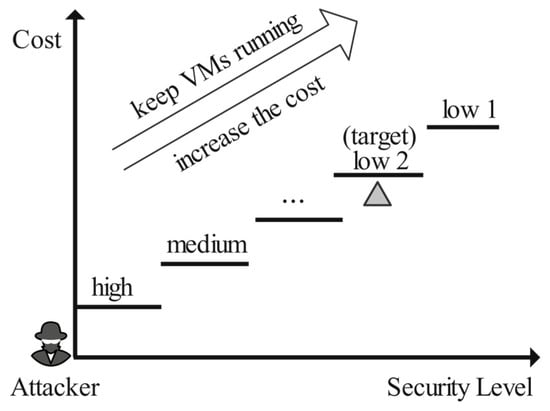
Figure 4.
Multi-level risk division strategy.
4.4. Tenant Classification
Using the proposed multi-level clustering method, we obtain partially labeled tenants that can be used to train our classification model. This section introduces a multi-level SVM classification model based on a decision tree (MSVMT) to complete the classification work.
MSVMT Classification Model: SVM is a binary classifier, but its excellent classification effect attracts the interest of researchers in exploring its usage in multi-classification problems. A common solution is the “decomposition–reconstruction” approach, which decomposes a multi-classification problem into a series of binary classification problems, like in the Decision Directed Acyclic Graph (DDAG) method proposed in [22]. The proposed MSVMT model adopts a similar idea.
Specifically, for every tenant group returned from the clustering task, we choose the group itself as the positive class and the remaining groups together with the unlabeled tenants as the negative class. We then train an SVM classifier for it accordingly, assuming there are a total of n tenant groups obtained from the clustering step. Every tenant waiting to be classified should go through the classifiers representing different risk groups in turn until it falls into a certain group.
The model needs to be further optimized to classify tenants into proper groups. That is, classifiers with larger thresholds should be placed at the front of the decision tree.
In the previous analysis, we observed that the area where malicious tenants are located has more abnormal behavior patterns. So, the high-risk classifier should be set as SVM1. The placement of the other SVMs follows the same rule. Figure 5 shows the classification model in the circumstance of limited tenant groups. SVM1, representing the high-risk classifier, determines whether a tenant belongs to the high-risk group, and SVM2, representing the low-risk group 1 classifier, determines whether a tenant belongs to low-risk group 1. Tenants who cannot be successfully classified into any groups are labeled as the medium-risk group, an area with greater uncertainty.
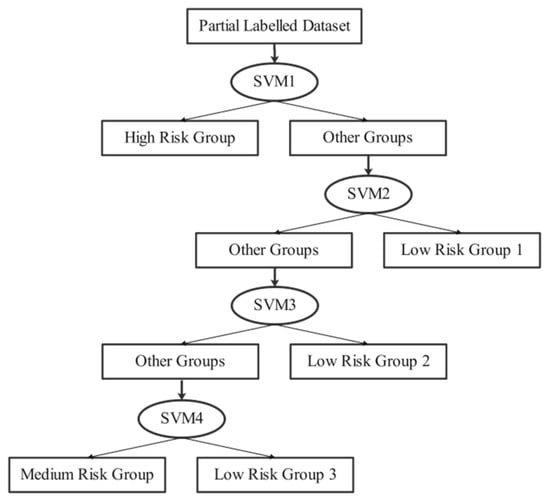
Figure 5.
MSVMT classification while taking four levels as example.
Compared with other classification methods, the proposed MSVMT model can achieve the following.
The model can transform the multi-classification problem into a series of progressive binary classification problems, fitting well with our multi-level clustering method.
The model presents an excellent generalization ability. One main problem is that the initial groups are obtained by clustering. Aside from the selected groups, a relatively large part is scattered as “noise” tenants. They cannot be classified as a group by general classification models since there are no obvious behavior patterns. The general classification models will impose them into one of the labeled groups, resulting in reduced classification capacity and weak generalization ability. However, the improved MSVMT model is able to label these “noise” tenants as another medium-risk group to avoid this problem.
The model possesses faster execution speed and excellent classification performance, which is discussed in Section 5.
In summary, the clustering task of the proposed defense strategy aims to offer a feasible solution to group tenants according to their behavior patterns. The purpose of the classification task is to classify unknown tenants as accurately as possible based on the clustering solution. The two tasks constitute the co-resident attack defense strategy proposed in this paper. In the following, we describe the rules of level changes for a tenant in the proposed defense strategy.
The rule of finite security level change: When a tenant, who has already been labeled, applies for new VMs, their security level may remain unchanged, move to a higher secure level, or move to a lower secure level. In practice, a tenant’s security level is more likely to change in adjacent levels. Crossing multiple security levels simultaneously is very rare and most probably happens when moving from a higher security level to a lower security level. That is, if a tenant in a high security level starts a large number of VMs in a short period of time, the three behavior features of the tenant will change and make the tenant closer to the malicious area. But for normal tenants, dramatic changes in behavior patterns are rarely observed. Even if it does occur, the restriction on crossing multiple security levels does not affect them much. Therefore, it can be assumed that the security level only changes in adjacent levels when a tenant is reclassified after requesting new VMs. Under the rule of finite security level change, the reclassification of an old tenant only needs three SVM classifiers, including two adjacent SVMs and its own SVM, rather than going through all classifiers, which increases the speed of reclassification. It also further restricts attackers from launching attacks, preventing them from accessing high-security tenants.
5. Experimental Evaluation
In this section, we present our experimental results in detail to demonstrate the performance of the proposed defense strategy.
5.1. Dataset
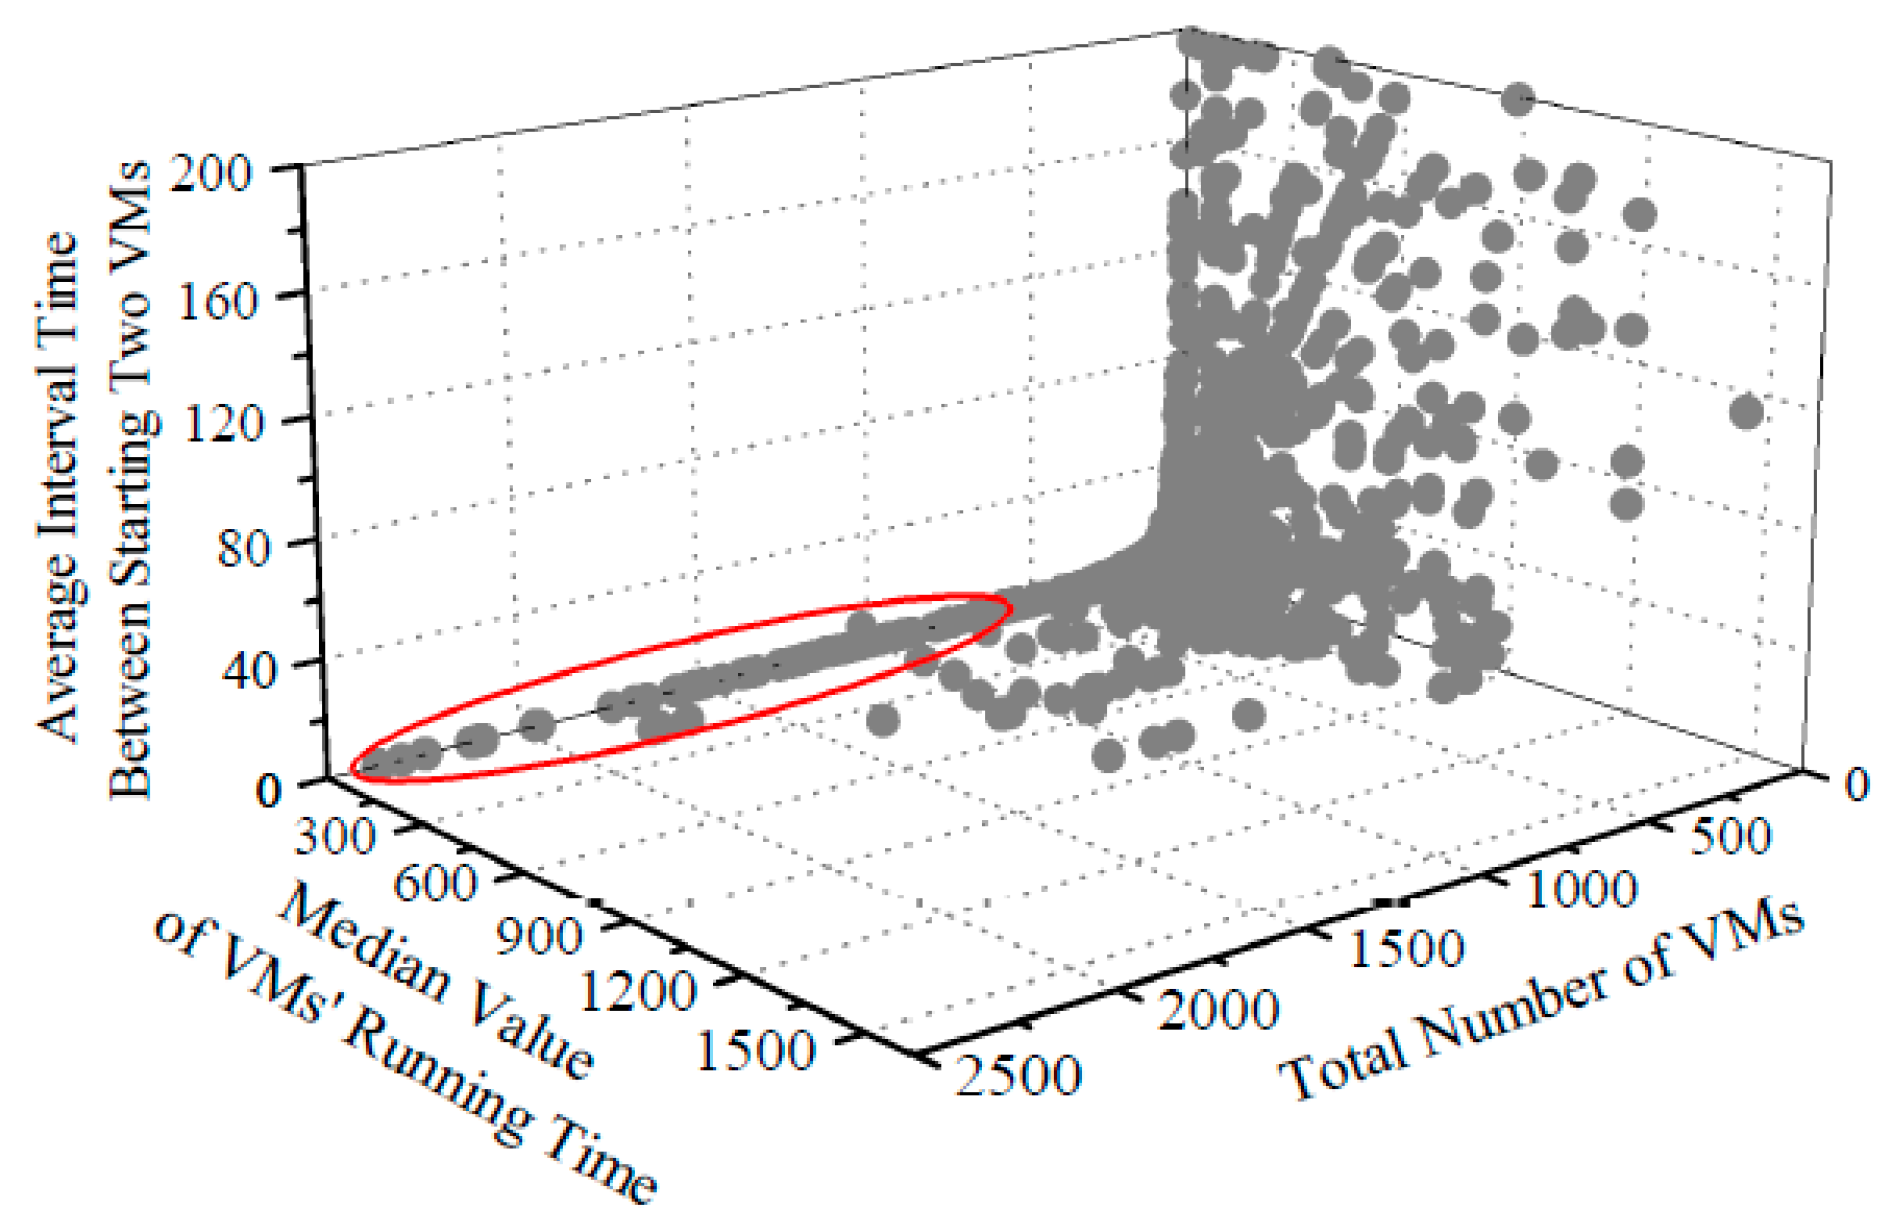
As mentioned before, we use Azure Trace for Packing 2020 as our dataset and compute three features to represent a tenant’s behavior patterns. Figure 6 shows the distribution of the processed dataset. As seen, the distribution is extremely uneven. The rough area circled in red hosts the tenants who start a large number of VMs but only keep a small median value of VMs’ running time and a short average interval between starting two VMs. It shows exactly the malicious tenant behavior patterns as described earlier.
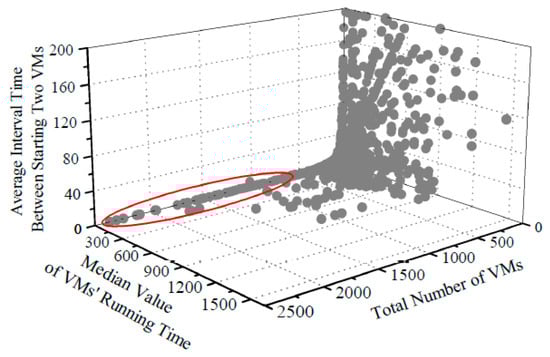
Figure 6.
Distribution of the processed dataset (388 extreme points are not shown in this figure for display needs).
5.2. Normalization
All three features should be normalized to eliminate the influence of dimension. To be pointed out is that we take the 99th percentile as defined in (1) for normalization rather than the maximum value.
The idea of feature selection and normalization is inspired by [4]. We follow the main design and make some improvements according to our dataset. The reason is that the characteristic values of some tenants are far greater than those of most tenants. If taking the maximum value for calculation, the three features of most points would come close to zero after normalization. Considering that extreme tenants such as potential attackers often carry a more important message, it is not wise to abandon them. Therefore, choosing the 99th percentile would be more proper.
5.3. Clustering Results
We use the proposed multi-level clustering algorithm based on HDBSCAN to conduct our experiments. As emphasized, the main parameter needed in the algorithm is the minimum cluster size, which exerts an insignificant effect on the clustering result. After several tests, especially considering the size of the high-risk group, we choose 500 as the minimum cluster size for the first time. Then, taking 500 as an interval, we increase the parameter value for the subsequent clusterings. Experiments show that this parameter setting achieves good results.
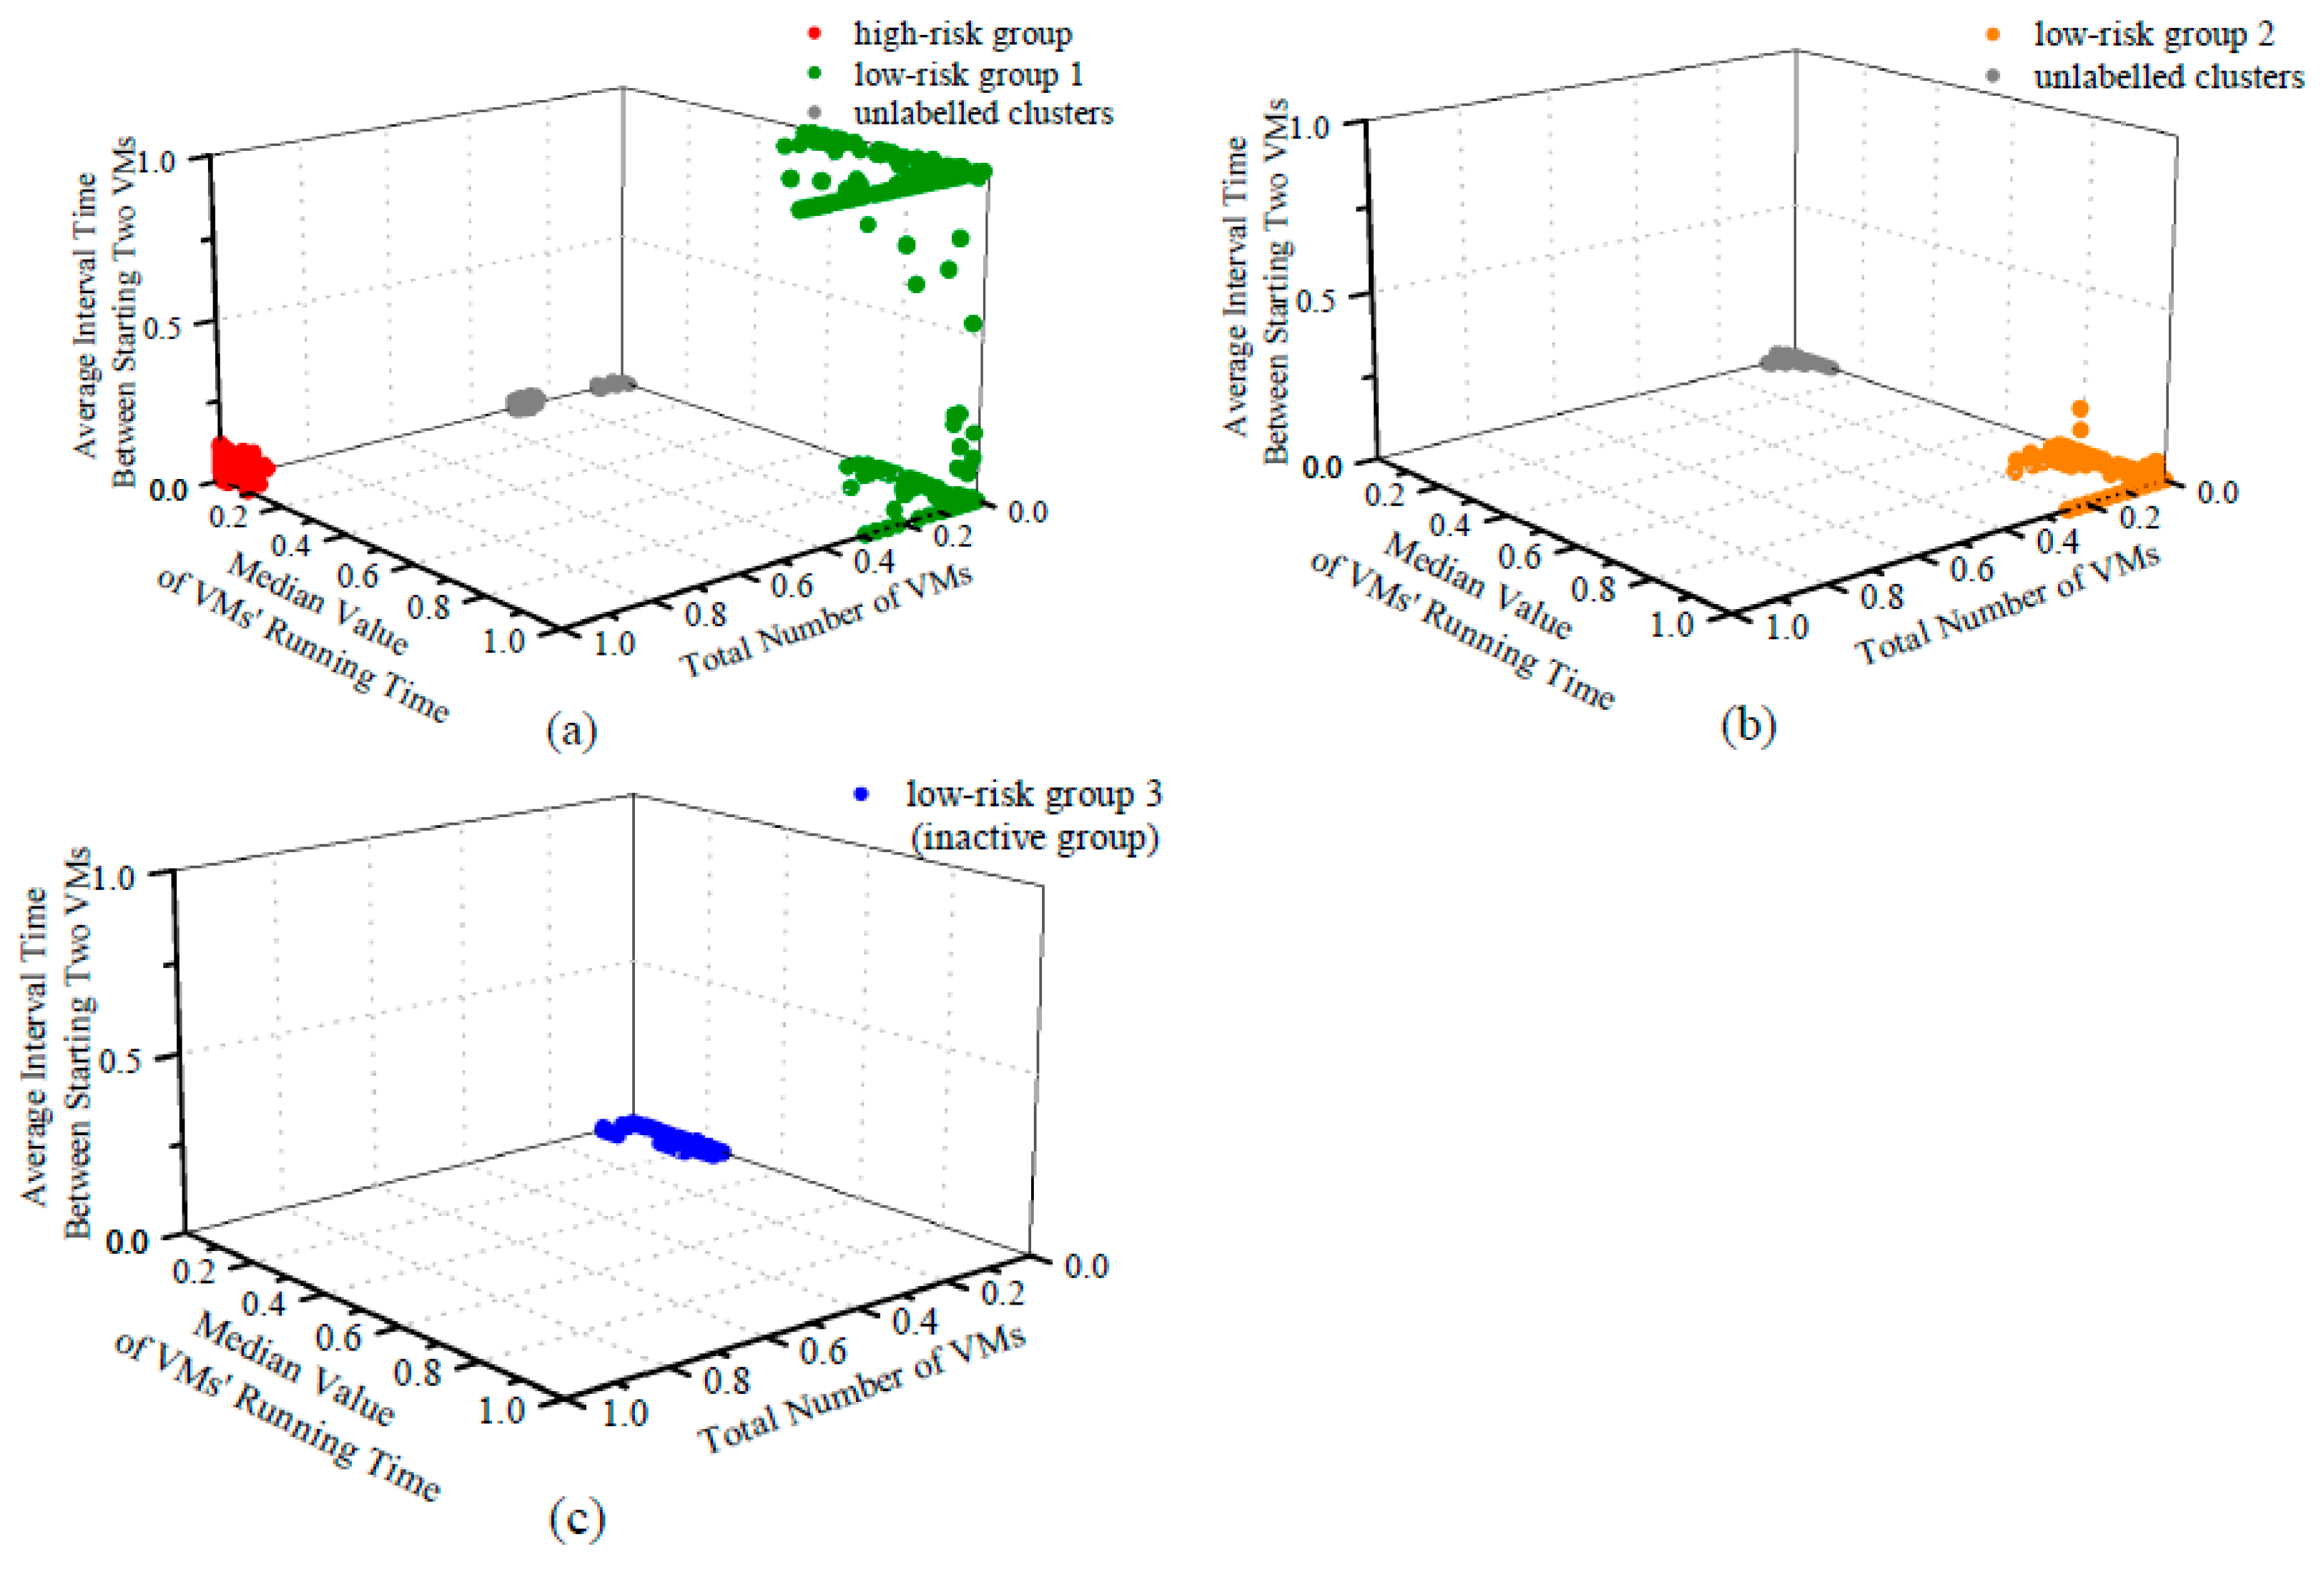
After three rounds of clustering, the range of features (measured by the 99th percentile) could not be further reduced, and all clusters are concentrated in one area. At this time, we believe that a relatively ideal effect has been achieved, and the clustering should be terminated. Figure 7 shows each clustering result. Figure 8 shows the overall results after three rounds.
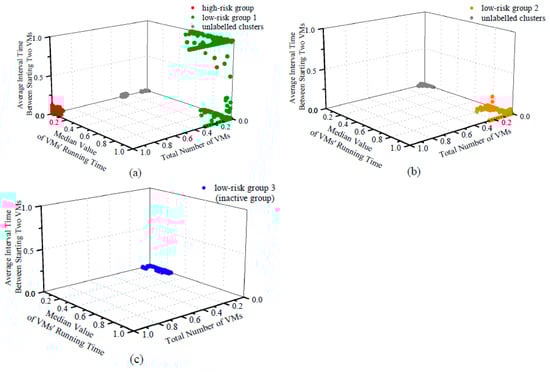
Figure 7.
Results of three clusterings: (a) the first clustering; (b) the second clustering; (c) the third clustering.
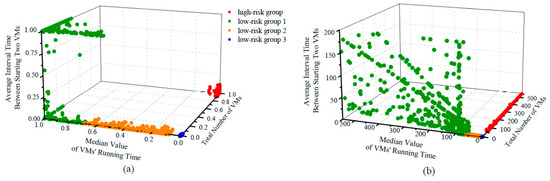
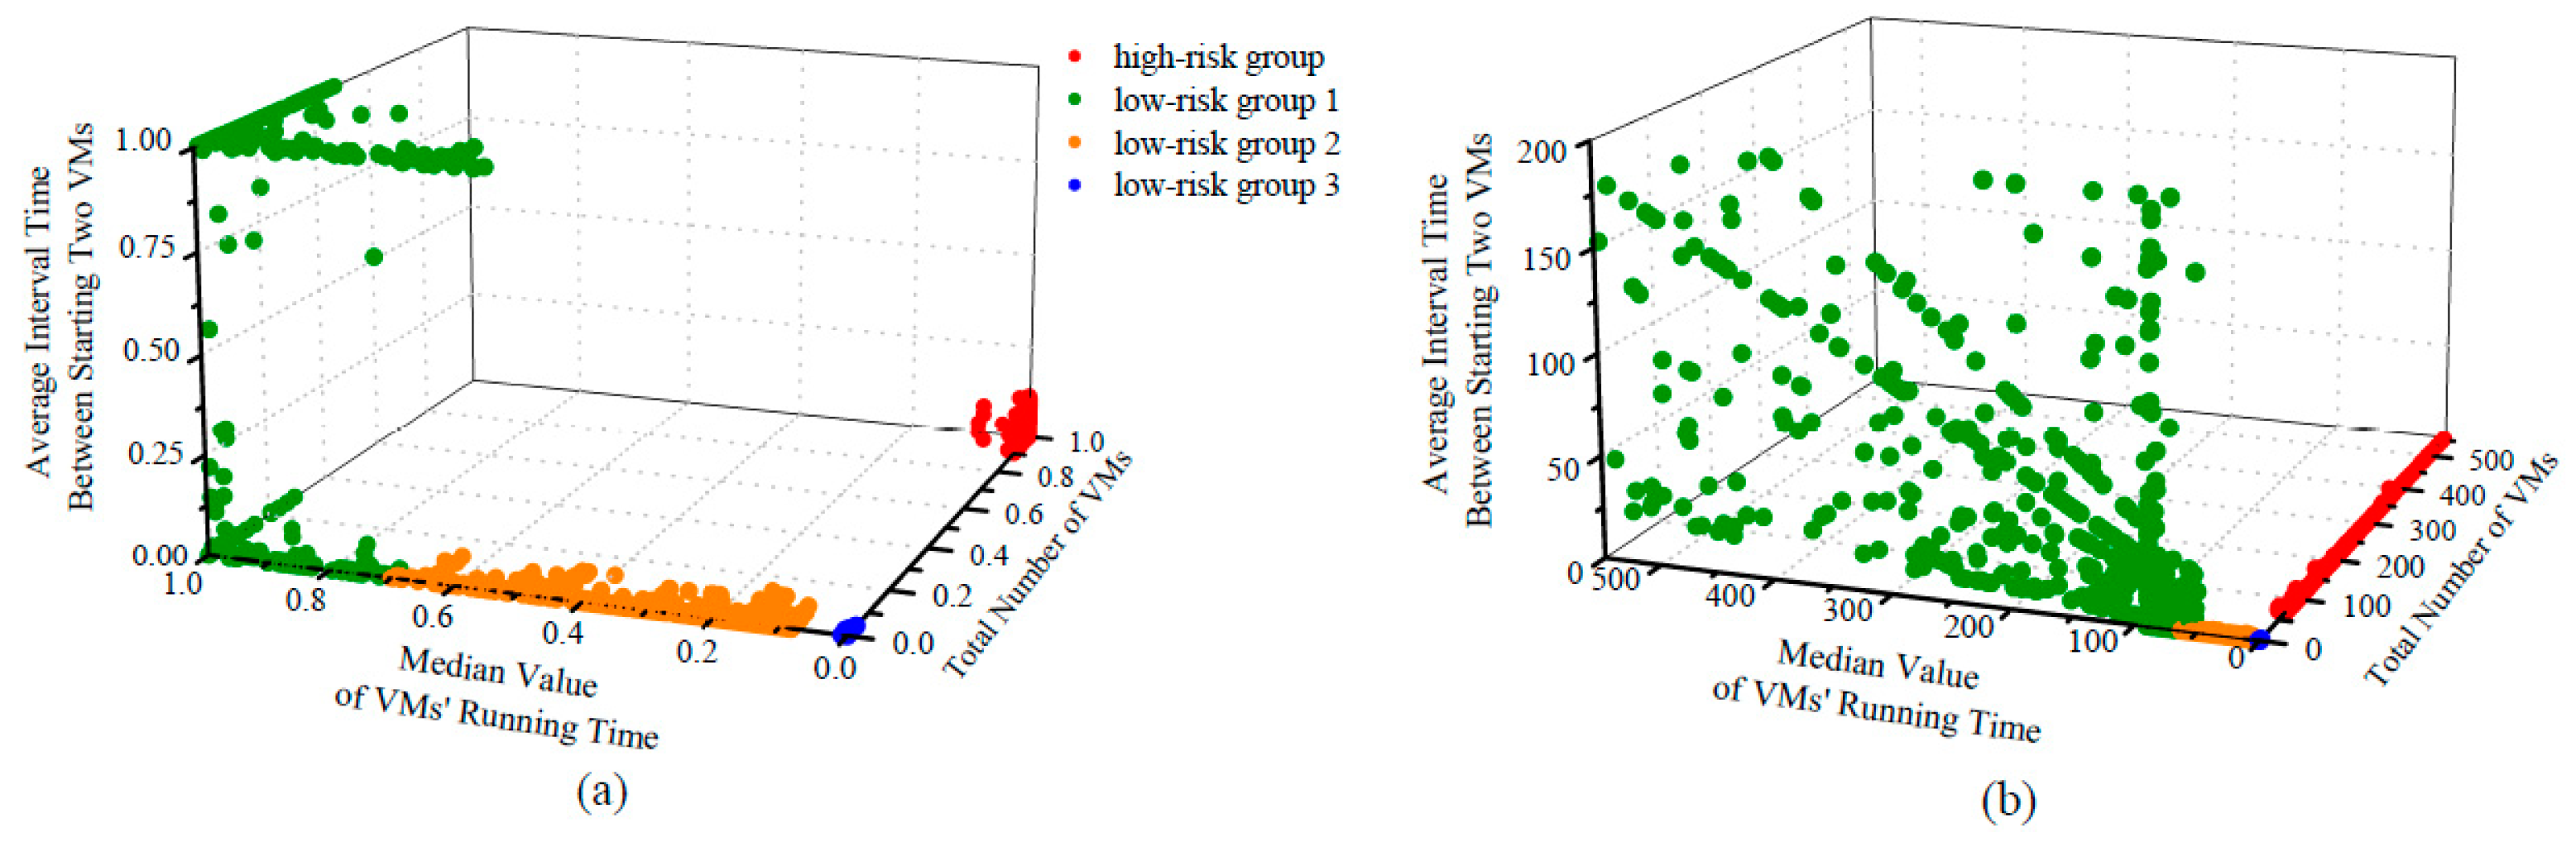
Figure 8.
Overall clustering result: (a) after normalization; (b) before normalization.
The First Clustering: The parameter value of the minimum cluster size is 500, and the 99th percentile values of N, , are 73.00, 89.08, and 2.29, respectively. As shown in Figure 7a, we mainly obtain three areas:
- The area colored in red includes 1024 tenants, and each of them starts a large number of VMs in a short period of time while most VMs keep a short running time. Since they match the behavior patterns of malicious attackers exactly, we label them as high-risk.
- The area colored in green includes 1405 tenants. These tenants start less than 30 VMs, and more importantly, the median value of their VMs’ running time is over 60 days. We label this area as the safest low-risk group 1. It is worth noting that for normal tenants, since the number of VMs is quite small, the feature of the average interval time between starting two VMs becomes relatively less important.
- The area colored in gray includes the remaining clusters that contain more than 100,000 tenants. These tenants will be put into the next clustering with the “noise” tenants.
It can be observed from the clustering result that, except for the obvious high-risk and low-risk groups, the majority of tenants gathered together are caused by data compression after normalization. For further grouping of tenants, we start the next clusterings.
The Second Clustering: The parameter value of minimum cluster size is 1000, and the 99th percentile values of N, , are 42.00, 9.98, and 0.39, respectively. As shown in Figure 7b, we mainly obtain two areas.
The area colored in orange includes 1103 tenants. Most of them keep VMs running for over 7 days while starting less than 20 VMs. They are also considered secure tenants, but at a lower level, so we label them low-risk group 2.
The area colored in gray will again be put into the next clustering.
As expected, we successfully narrow the data range down and discover a new group that could not be obtained in the first clustering.
The Third Clustering: The parameter value of minimum cluster size is 1500, and the 99th percentile values of N, , are 42, 3.09, and 0.39, respectively. As shown in Figure 7c, in this clustering, we only obtain one area that contains a large number of tenants.
The area colored in blue contains 99,782 tenants. We label them as low-risk group 3, but more properly, we call them the inactive group. This area presents interesting behavior patterns that match most tenants in cloud computing platforms. Generally, these inactive tenants start less than five VMs with an average interval of less than one hour and a median running time of less than one day.
In the third clustering, no new group can be separated from the vast majority of normal tenants, and the clustering process terminates.
Overall Clustering Result: We use three features to represent the VM usage behavior of a tenant. These features are summarized in Table 2. We use the proposed multi-level clustering algorithm to conduct our experiments. The main parameter needed in the algorithm is the minimum cluster size, which exerts an insignificant effect on the clustering result. We choose 500, 1000, and 1500 as the minimum cluster size for the first clustering, the second clustering, and the third clustering, respectively.
After the three clusterings, we successfully obtain four groups: high-risk group, low-risk group 1, low-risk group 2, and low-risk group 3 (inactive group). The high-risk group hosts the potential attackers, and the low-risk tenants are divided into three groups with increasing security levels. Low-risk group 3, also named the inactive group, represents the vast majority part of tenants existing on cloud platforms. Low-risk group 1 and low-risk group 2 are also normal tenants but possess different behavior patterns from the majority, so they are considered to have higher security levels. Note that in the clustering task, we do not simply classify the unlabeled tenants as medium-risk since such action will roughly put tenants who present other groups’ patterns into the medium-risk group. Consequently, we allow them to enter the classifier just like any tenant who newly arrives. Only when they still fail to be classified into any groups the second time can they be labeled as medium-risk.
The overall clustering result is shown in Figure 8 and Table 3. Figure 8a shows the result after normalization and Figure 8b shows the result before normalization. Table 3 shows the number of tenants in each group. The total number of tenants is 141,336, and the number of labeled tenants is 103,314. The percentage of the labeled tenants is 73.10%. Compared with the traditional one-time clustering, the proposed multi-level clustering method is capable of discovering more detailed groups under the unevenly distributed dataset. Cloud providers are allowed to flexibly group tenants by adjusting the minimum cluster size of each clustering.
Table 3.
The number of tenants in each group.
5.4. Semi-Supervised Classification Performance
We use both labeled and unlabeled tenants to train our MSVMT classification model. To be specific, we train four SVMs for classifying these four different tenant groups, respectively. Taking the high-risk group with 1024 tenants as an example, the 1024 tenants are regarded as one class, and the remaining three tenant groups and unlabeled tenants, which include 140,312 tenants, are regarded as another class. The two classes are used to train the SVM that represents the high-risk group. The other three groups adopt the same process. After that, we have all four SVMs to be trained.
The unlabeled tenants also undergo training to preserve each group’s special behavior patterns. Assuming that only the four labeled groups participate in the training process, the SVM classifier can hardly handle the classification of two groups that are far from each other. In this scenario, the hyperplane learned by the SVM tends to divide them from the middle position, which causes lots of tenants to be misclassified.
Additionally, we combine linear SVMs and nonlinear SVMs to complete the classification work to improve the training speed. For linear separable groups such as the high-risk group, low-risk group 1, and low-risk group 3, we adopt linear SVMs. Also, for linear non-separable groups such as low-risk group 3 (inactive group), we adopt RBF kernel SVMs. Such a combination is a highly rewarding design, especially for classifying large groups like low-risk group 3. It shortens the training time from minutes to seconds while keeping equally excellent classification performance.
There are two main parameters for SVMs.
Penalty coefficient C: We test C ranging from 1 to 5 and finally confirm it as 3.
Parameter gamma: To avoid the problem of overfitting, we choose the reciprocal of the number of features to be the gamma value. In our experiments, the number of features is three.
To better evaluate our MSVMT model, we keep 70 percent of the total dataset as the training set and the remaining 30 percent as the testing set. In addition, the 99th percentile of the training set is applied in normalizing both the training set and the testing set.
Considering that we are dealing with an extremely imbalanced dataset, although the impact of imbalanced datasets on our MSVMT model is not as significant as other classification models, we compute the confusion matrix to evaluate the classification performance rather than relying on the accuracy rate. The confusion matrix is shown in Figure 9.
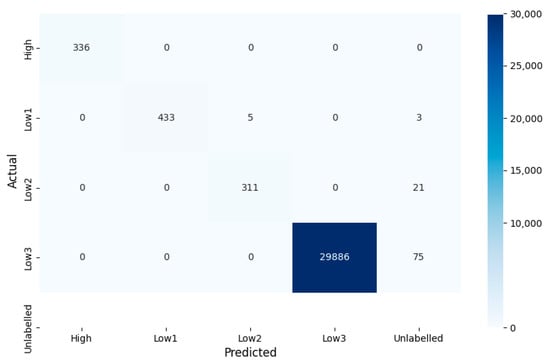
Figure 9.
Special confusion matrix for classification using MSVMT on the test set.
As shown in Table 4, our MSVMT classification model performs excellently on all four selected tenant groups. It must be emphasized that in this paper, only the four specific groups are considered when discussing the model performance. Since a fairly large part of these unlabeled tenants should be classified into other groups, we do not regard them as a group yet. In the semi-supervised classification process, they would be waiting to be classified again and will be used in the model training next time.
Table 4.
Performance of MSVMT on different groups.
Table 4 demonstrates the F-score for the test set under the MSVMT model. To further assess the effectiveness of MSVMT, we compare it with the traditional SVM multi-classification models. There are two main parameters for our MSVMT model: Penalty coefficient C and Parameter gamma. They are the same as the parameters for traditional SVMs. One subtle difference is that the traditional SVM multi-classification models regard the unlabeled tenants as an independent group just like other groups, while our model considers them as tenants who are unable to get into any groups. Table 5 shows the F-score of each group for methods with different kernels and SVM design strategies.
Table 5.
Comparison with different methods.
Although the dataset is extremely imbalanced, our MSVMT model still achieves excellent classification performance on the minority classes compared to the existing methods of [4,5].
Our combined kernel MSVMT model effectively improves the training speed, processing more than 100,000 samples in seconds. This is because SVM can be very time-consuming when it comes to training large classes, and choosing the right kernel can precisely address this critical problem.
According to our strategy, tenants who fail to get into any groups should be placed in a special and temporary group. This special group accommodates more tenants with no obvious behavior patterns, presenting a complex distribution. It is unsuitable for training an SVM for the group to keep its inclusiveness for more scattered tenants. The general SVM methods can hardly meet this requirement.
The performance penalty caused by MSVMT is very small and exists only in low-risk groups with fewer stringent requirements. Such loss is relatively acceptable.
5.5. Reclassification of Unlabelled Tenants
Recall that the unlabeled tenants originate from the rough clustering task. In the semi-supervised classification task, they should be classified again by the proposed MSVMT model that has already been trained as above. The remaining tenants who still fail to get into any groups after reclassification are finally labeled medium-risk. We have 38,022 unlabeled tenants, and the reclassification result is shown in Table 6.
Table 6.
Reclassification result of unlabeled tenants.
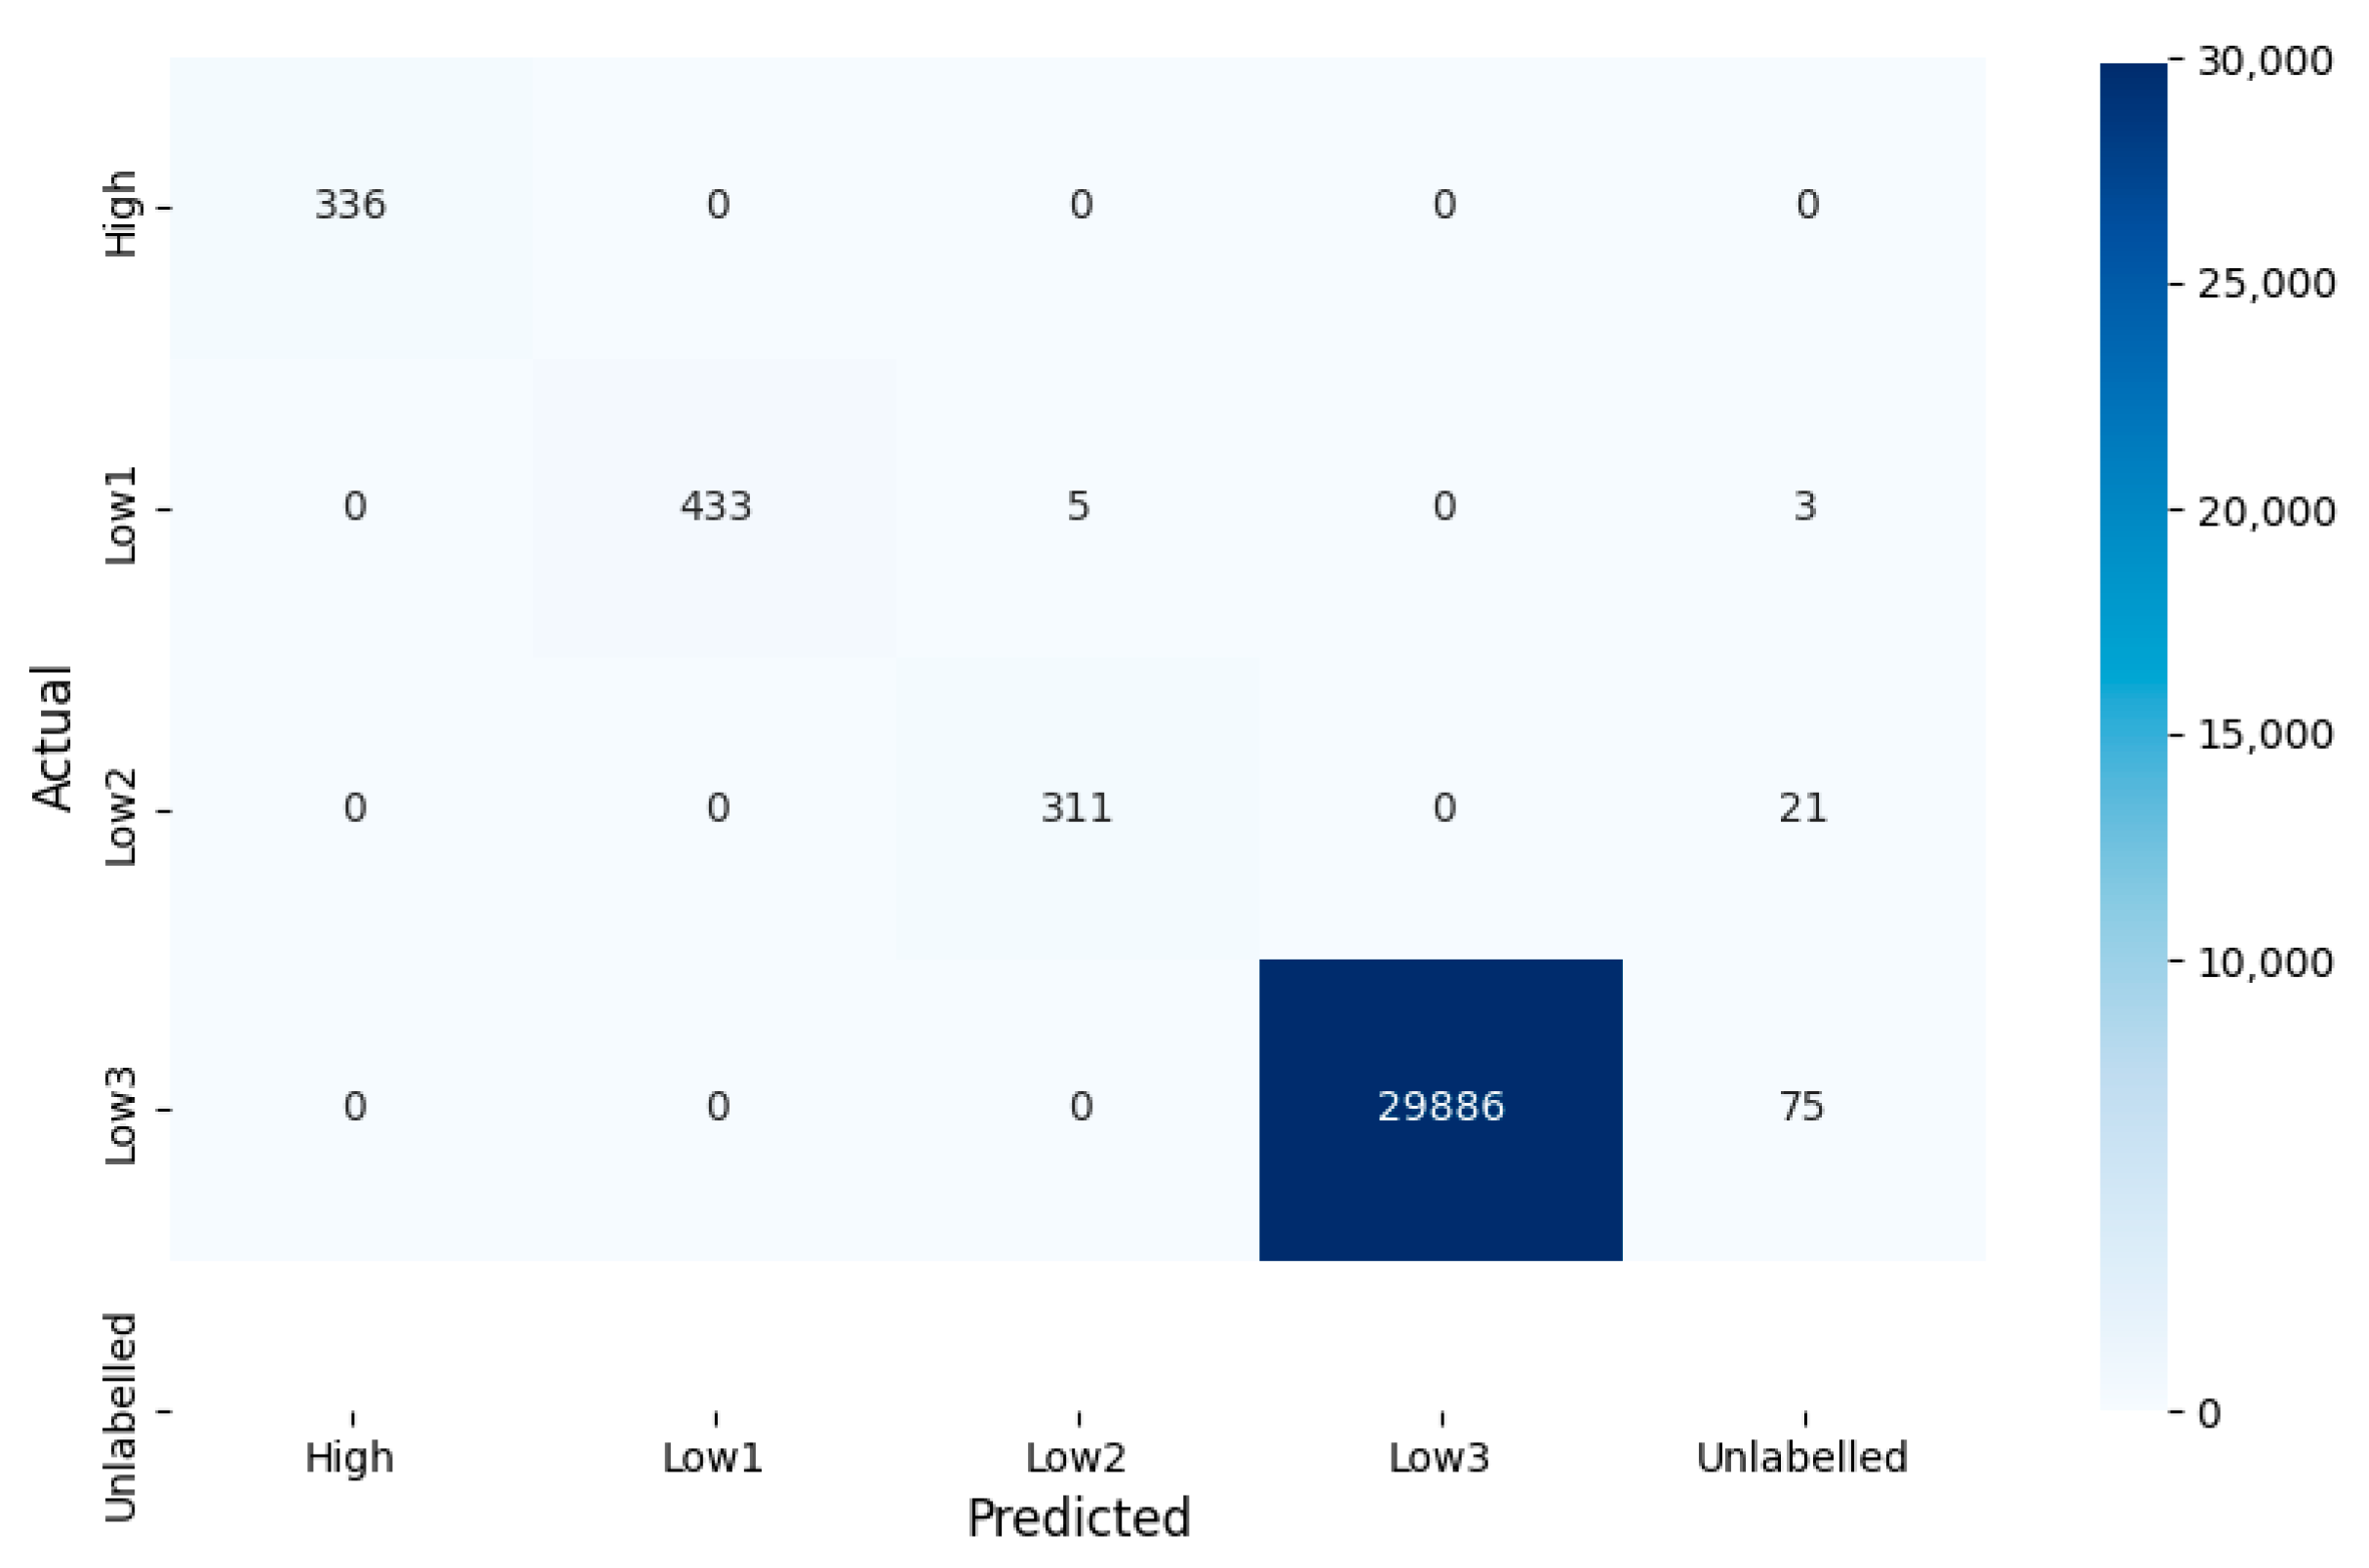
After all tenants have been labeled, the final step in the classification is to retrain the MSVMT model with the all the labeled tenants. We also keep 70% of the dataset as the training set and 30% as the test set. As a result, the MSVMT model achieves an accuracy of 97.98% on the training set and 97.86% on the test set. Figure 10 shows the confusion matrix for the retrained MSVMT model, and Table 7 presents the F-score for each group.
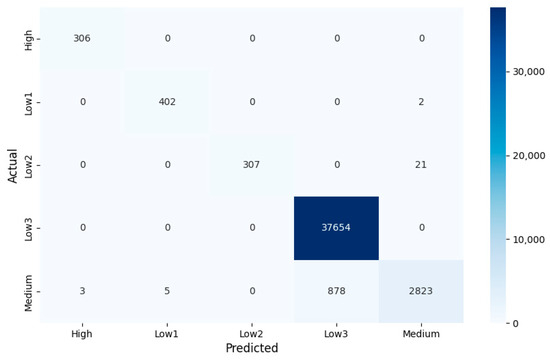
Figure 10.
Confusion matrix for classification using retrained MSVMT on the test set.
Table 7.
Performance of retrained MSVMT on test set.
After the classification of retrained MSVMT, tenants who remain unlabeled are labeled as medium-risk. Judging from the final classification performance, only the medium-risk group with a complex distribution is less superior. Among them, most misclassifications of medium-risk tenants are due to incorrectly classifying them into low-risk group 3, also named the inactive group. The most likely cause is that tenants are densely distributed in the area where the inactive group resides, so any small movement of the hyperplane can lead to a change for many tenants. But more significantly, the model achieves quite excellent performance in other marginal minority groups, especially the more important high-risk group. Reviewing the whole tenant classification process, we always pay more attention to the four manually labeled groups returned from the clustering task. These groups account for more than 90 percent of the total tenants.
The strategy implementation can be divided into two phases, training and testing. In the worst case, the computation complexity of clustering is O(n2), where n indicates the size of the dataset. The semi-supervised classification trains an MSVMT classifier using both unlabeled and labeled tenants. The computation complexity of training an MSVMT classifier is O(m), where m indicates the number of SVMs. The total computation complexity of the training process is O(n2) + O(m). However, the training process is an offline process and runs only once. In the testing phase, the computation complexity is O(n), where n indicates the number of new VMs.
6. Conclusions and Future Directions
This paper proposes a co-resident attack defense strategy based on multi-level tenant classification. The design relies on two components, clustering and semi-supervised classification. The clustering component provides the initial grouping criterion and partially labels tenants. The semi-supervised classification trains an MSVMT classifier using both unlabeled and labeled tenants based on the grouping result obtained in the clustering component. Through extensive experiments, we demonstrate that the proposed classifier can quickly and accurately classify each tenant group on a large-scale and real-world dataset, which confirms the effectiveness and feasibility of the proposed defense strategy.
The strategy is built on totally unlabeled data. Although it provides a novel idea for designing the co-resident attack defense strategy, we find it difficult to select appropriate features for clustering and classification. The three behavioral features used in this work (N, , and ) were suggested by [4]. However, other features such as CPU and memory resource allocation may also be valuable to consider. In other words, the behavior analysis of malicious tenants and normal tenants should be further investigated for pursuing better classification effects. Another problem is that although we have conducted experiments on a real-world dataset and obtained quite good results, the performances (especially the effectiveness and feasibility) of the proposed strategy in real cloud environments still need to be evaluated.
Author Contributions
Conceptualization, Y.P. and S.W.; Methodology, Y.P. and X.J.; Software, S.W. and X.J.; Writing—original draft, X.J.; Writing—review and editing, Y.X. and L.X.; Supervision, Y.X. and L.X. All authors have read and agreed to the published version of the manuscript.
Funding
This research received no external funding.
Data Availability Statement
Data are contained within the article.
Conflicts of Interest
The authors declare no conflict of interest.
References
- Lee, J. A view of cloud computing. Int. J. Networked Distrib. Comput. 2013, 1, 2–8. [Google Scholar] [CrossRef]
- Singh, A.; Chatterjee, K. Cloud security issues and challenges: A survey. J. Netw. Comput. Appl. 2017, 79, 88–115. [Google Scholar] [CrossRef]
- Ristenpart, T.; Tromer, E.; Shacham, H.; Savage, S. Hey, you, get off of my cloud: Exploring information leakage in third-party compute clouds. In Proceedings of the 16th ACM Conference on Computer and Communications Security, Chicago, IL, USA, 9–13 November 2009; pp. 199–212. [Google Scholar]
- Han, Y.; Alpcan, T.; Chan, J.; Leckie, C.; Rubinstein, B.I.P. A game theoretical approach to defend against co-resident attacks in cloud computing: Preventing co-residence using semi-supervised learning. IEEE Trans. Inf. Forensics Secur. 2016, 11, 556–570. [Google Scholar] [CrossRef]
- Han, J.; Zang, W.; Yu, M.; Sandhu, R. Quantify co-residency risks in the cloud through deep learning. IEEE Trans. Dependable Secur. Comput. 2021, 18, 1568–1579. [Google Scholar] [CrossRef]
- Hadary, O.; Marshall, L.; Menache, I.; Pan, A.; Greeff, E.E.; Dion, D.; Dorminey, S.; Joshi, S.; Chen, Y.; Russinovich, M.; et al. Protean: VM allocation service at scale. In Proceedings of the 14th USENIX Symposium on Operating Systems Design and Implementation, Online, 4–6 November 2020; pp. 845–861. [Google Scholar]
- Vattikonda, B.C.; Das, S.; Shacham, H. Eliminating fine grained timers in xen. In Proceedings of the 3rd ACM Workshop on Cloud Computing Security Workshop, Chicago, IL, USA, 17–21 October 2011; pp. 41–46. [Google Scholar]
- Aviram, A.; Hu, S.; Ford, B.; Gummadi, R. Determinating timing channels in compute clouds. In Proceedings of the 2010 ACM Workshop on Cloud Computing Security Workshop, Chicago, IL, USA, 8 October 2010; pp. 103–108. [Google Scholar]
- Yu, C.M.; Gochhayat, S.P.; Conti, M.; Lu, C.S. Privacy aware data deduplication for side channel in cloud storage. IEEE Trans. Cloud Comput. 2020, 8, 597–609. [Google Scholar] [CrossRef]
- Zhang, Y.; Li, M.; Bai, K.; Yu, M.; Zang, W. Incentive compatible moving target defense against vm-colocation attacks in clouds. In Proceedings of the 27th Information Security and Privacy Conference, Crete, Greece, 4–6 June 2012; pp. 388–399. [Google Scholar]
- Bates, A.; Mood, B.; Pletcher, J.; Pruse, H.; Valafar, M.; Butler, K. On detecting co-resident cloud instances using network flow watermarking techniques. Int. J. Inf. Secur. 2014, 13, 171–189. [Google Scholar] [CrossRef]
- Sundareswaran, S.; Squcciarini, A.C. Detecting malicious co-resident virtual machines indulging in load-based attacks. In Proceedings of the 15th International Conferencethe on Information and Communications Security, Beijing, China, 20–22 November 2013; pp. 113–124. [Google Scholar]
- Yu, S.; Gui, X.; Lin, J. An approach with two-stage mode to detect cache-based side channel attacks. In Proceedings of the 27th International Conference on Information Networking, Barcelona, Spain, 25–28 March 2013; pp. 186–191. [Google Scholar]
- Azar, Y.; Kamara, S.; Menache, I.; Raykova, M.; Shepard, B. Co-location-resistant clouds. In Proceedings of the 6th Edition of the ACM Workshop on Cloud Computing Security, Scottsdale, AZ, USA, 7 November 2014; pp. 9–20. [Google Scholar]
- Qiu, Y.; Shen, Q.; Luo, Y.; Li, C.; Wu, Z. A secure virtual machine deployment strategy to reduce co-residency in cloud. In Proceedings of the 2017 IEEE Trustcom/BigDataSE/ICESS, Sydney, Australia, 1–4 August 2017; pp. 347–354. [Google Scholar]
- Xing, L.; Levitin, G. Balancing theft and corruption threats by data partition in cloud system with independent server protection. Reliab. Eng. Syst. Saf. 2017, 167, 248–254. [Google Scholar] [CrossRef]
- Levitin, G.; Xing, L.; Dai, Y. Co-residence based data theft game in cloud system with virtual machine replication and cancellation. Reliab. Eng. Syst. Saf. 2022, 222, 108415. [Google Scholar] [CrossRef]
- Levitin, G.; Xing, L.; Xiang, Y. Reliability vs. vulnerability of N-Version programming cloud service component with dynamic decision time under co-resident attacks. IEEE Trans. Serv. Comput. 2022, 15, 1774–1784. [Google Scholar] [CrossRef]
- Salman, S.; Wasim, H.; Ahmad, B.B.; Asaf, C. Muriel médard: Why botnets work: Distributed Brute-Force attacks need no synchronization. IEEE Trans. Inf. Forensics Secur. 2019, 14, 2288–2299. [Google Scholar]
- Varadarajan, V.; Zhang, Y.Q.; Ristenpart, T.; Swift, M. A placement vulnerability study in multi-tenant public clouds. In Proceedings of the 24th USENIX Conference on Security Symposium, Washington, DC, USA, 12–14 August 2015; pp. 913–928. [Google Scholar]
- Campello, R.J.G.B.; Moulavi, D.; Sander, J. Density-based clustering based on hierarchical density estimates. In Proceedings of the 17th Pacific-Asia Conference on Knowledge Discovery and Data Mining, Gold Coast, Australia, 14–17 April 2013; pp. 160–172. [Google Scholar]
- Platt, J.; Cristianini, N.; Shawe-Taylor, J. Large margin dags for multiclass classification. In Proceedings of the 12th International Conference on Neural Information Processing Systems, Denver, CO, USA, 29 November–4 December 1999; pp. 547–553. [Google Scholar]


Disclaimer/Publisher’s Note: The statements, opinions and data contained in all publications are solely those of the individual author(s) and contributor(s) and not of MDPI and/or the editor(s). MDPI and/or the editor(s) disclaim responsibility for any injury to people or property resulting from any ideas, methods, instructions or products referred to in the content. |
© 2024 by the authors. Licensee MDPI, Basel, Switzerland. This article is an open access article distributed under the terms and conditions of the Creative Commons Attribution (CC BY) license (https://creativecommons.org/licenses/by/4.0/).