Practical Verification of Diagnostic Capabilities of Methods for the Recreation of Voltage Fluctuations
Abstract
1. Introduction
- Experimental laboratory tests using a model of a real power grid, in which there were only single sources of voltage fluctuations in a specific power supply circuit [43].
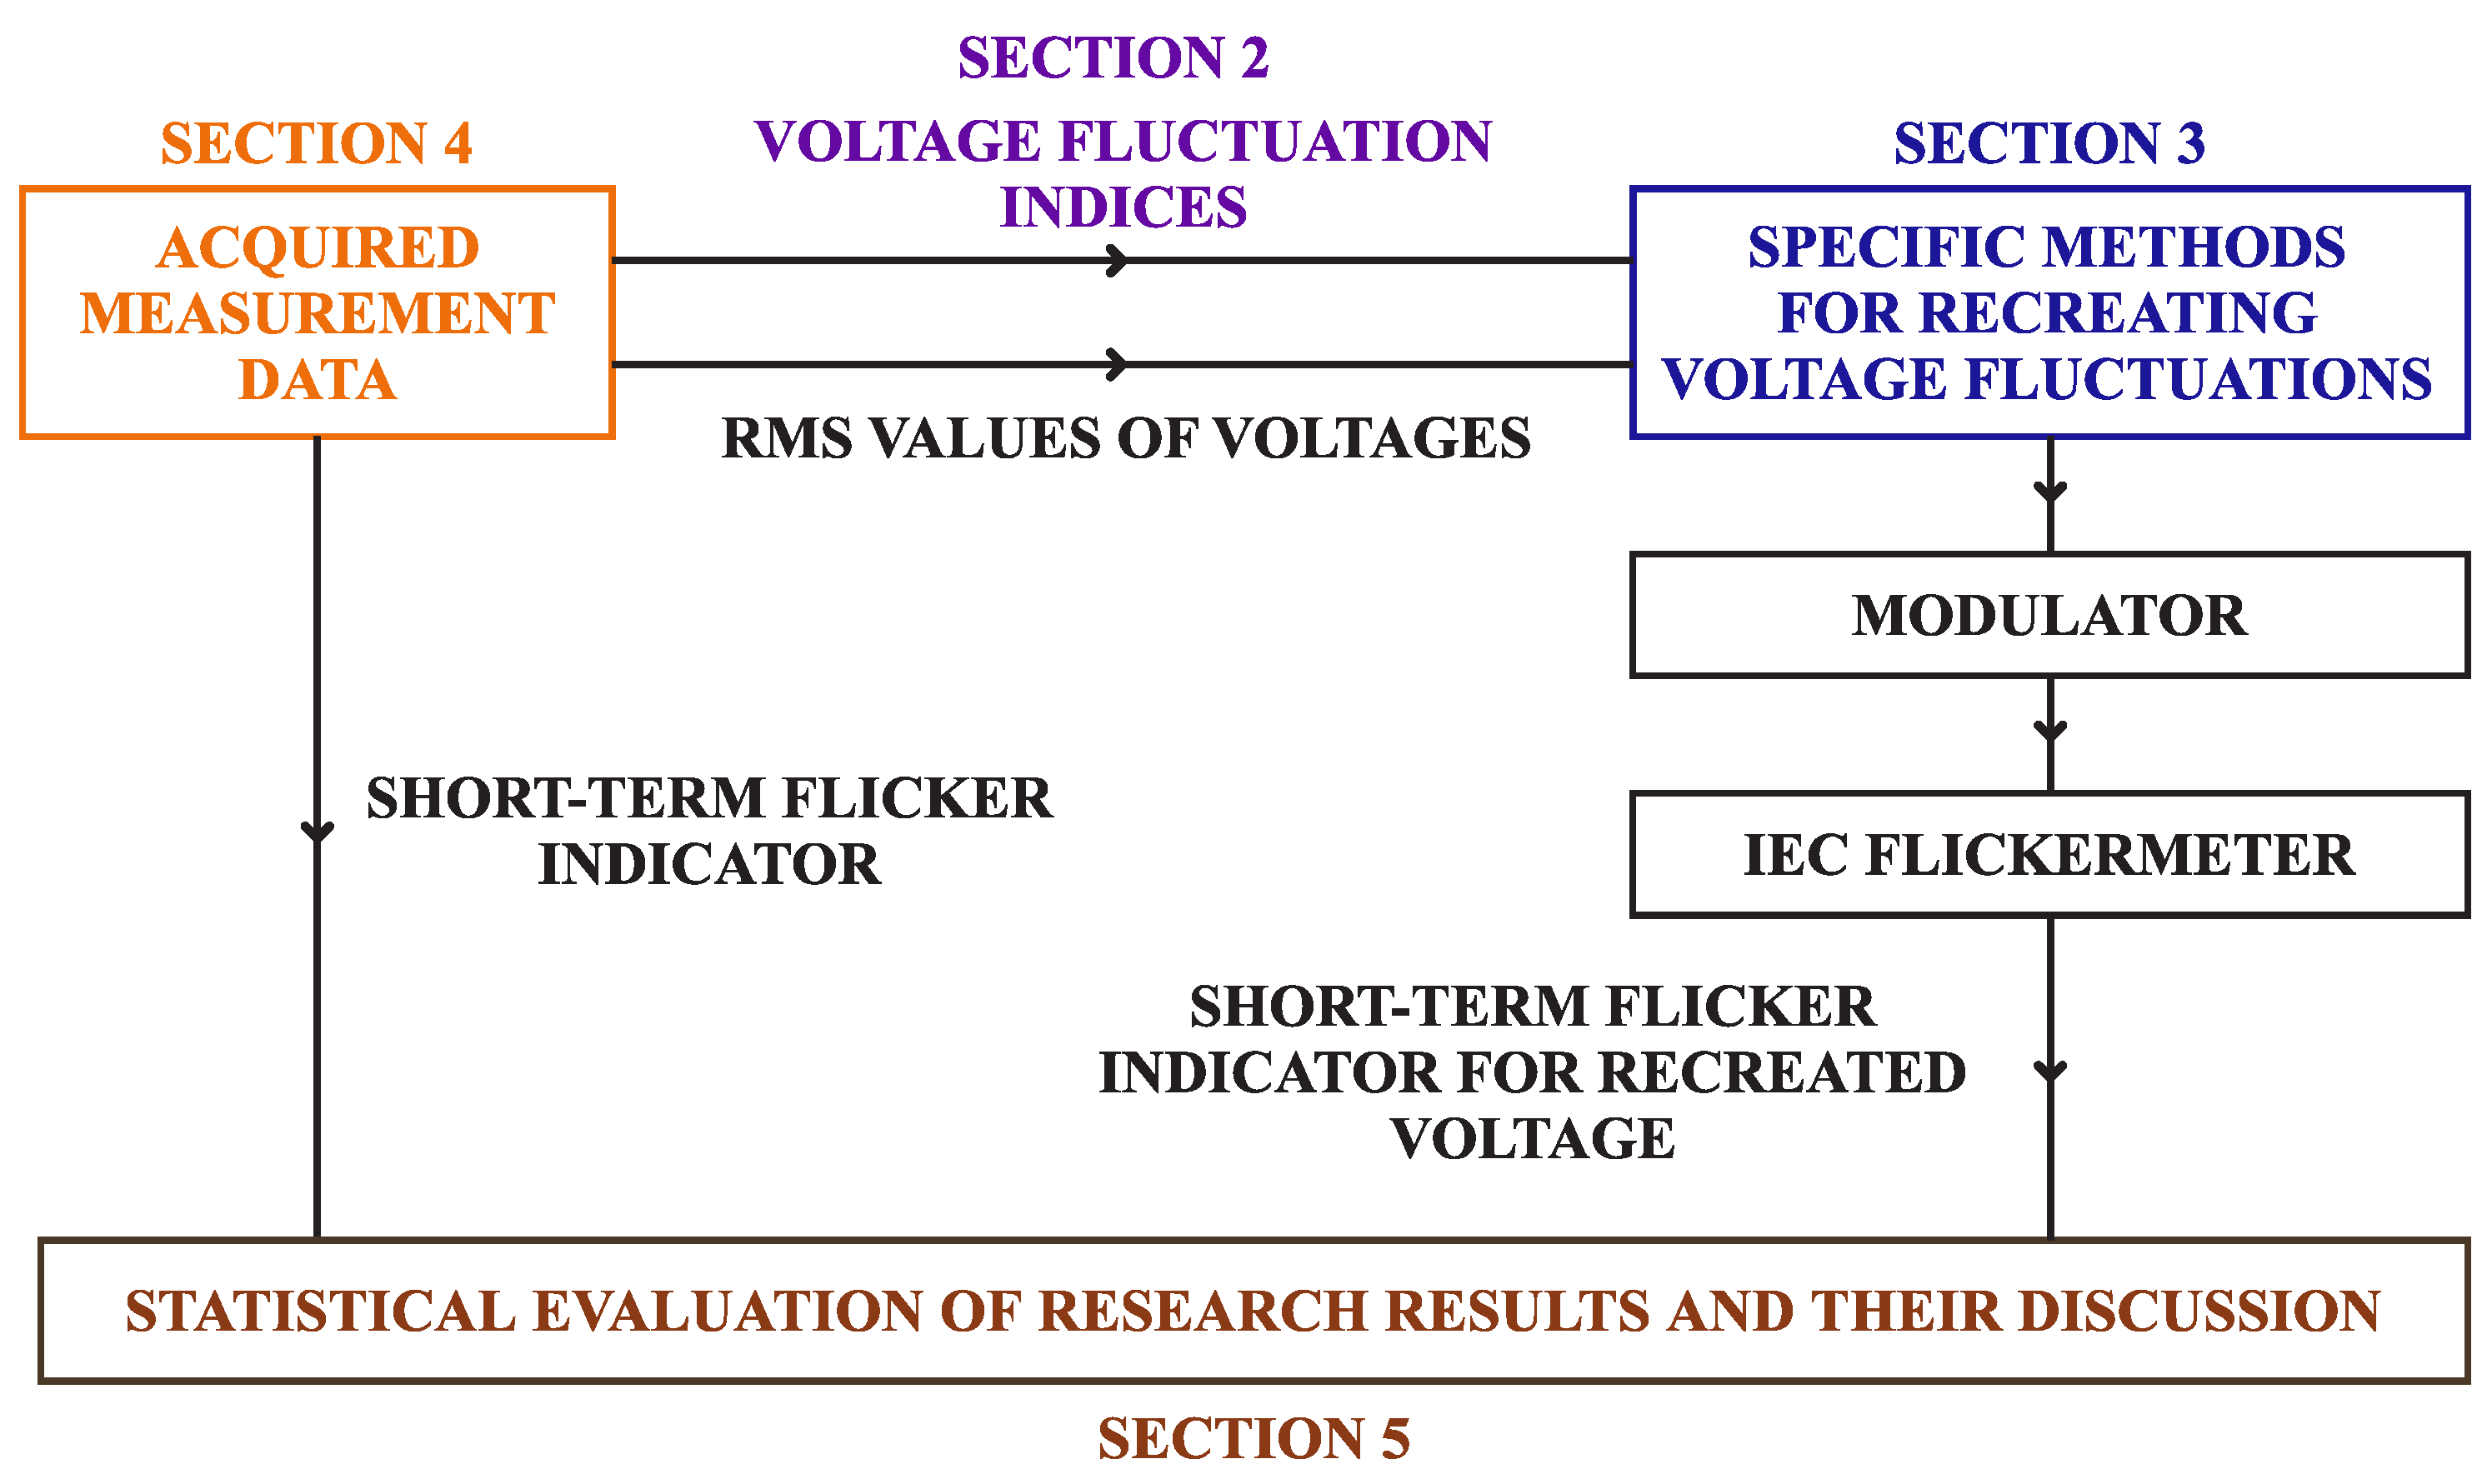
2. Brief Description of Voltage Fluctuation Indices
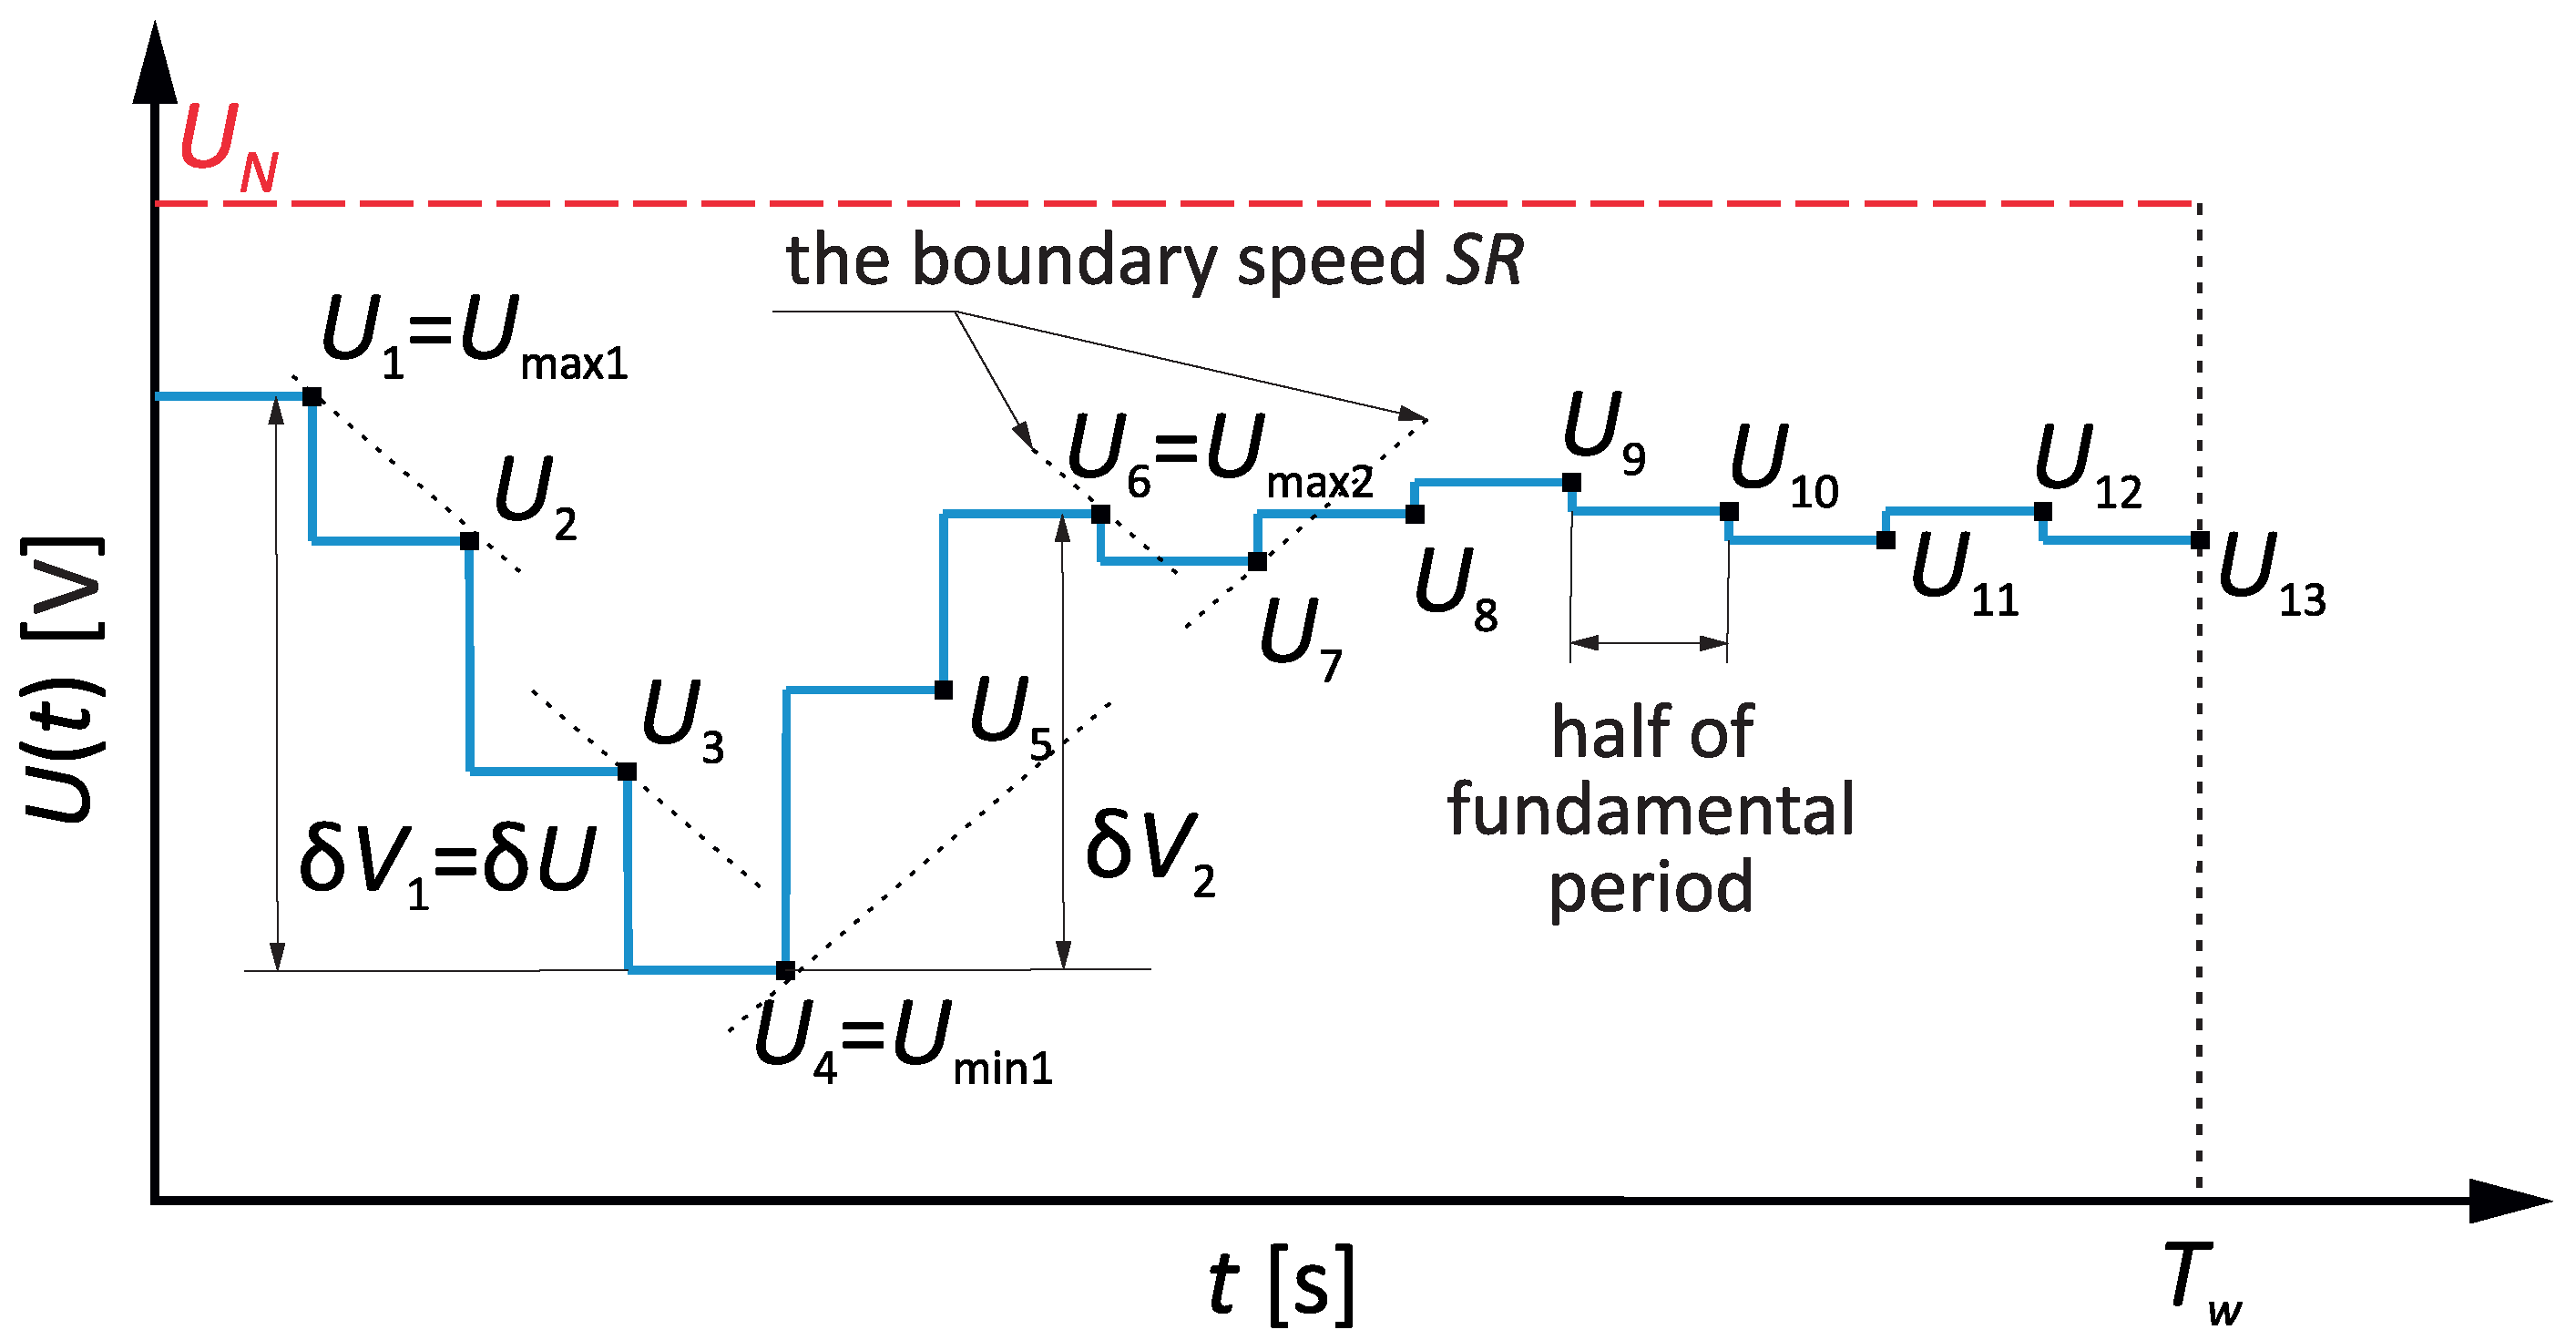
- The detection of the amplitudes of subsequent changes in the rms values of voltage in a given discrimination period ;
- The statistical assessment of the amplitudes of subsequent changes recorded during the period of discrimination , allowing for the determination of the final form of voltage fluctuation indices: the amplitude and the rate fx−y of voltage fluctuations.
3. Description of Selected Methods for Recreating Voltage Fluctuations
- The minimum rms value of voltage in ;
- The maximum rms value of voltage in ;
- The average rms value of voltage in ;
- The amplitude of voltage fluctuations ;
- The rate fx−y of voltage fluctuations for individual sub-ranges : , , , , , , .
- in the sub-range ;
- 0.85 in the sub-range ;
- 0.75 in the sub-range ;
- 0.65 in the sub-range ;
- 0.55 in the sub-range ;
- 0.45 in the sub-range ;
- 0.39/0.3/0.2/0.1/0.01 in the sub-range (the number of changes in the sub-range is divided into five equal sets, and the rest falls on the central value).
- M1:
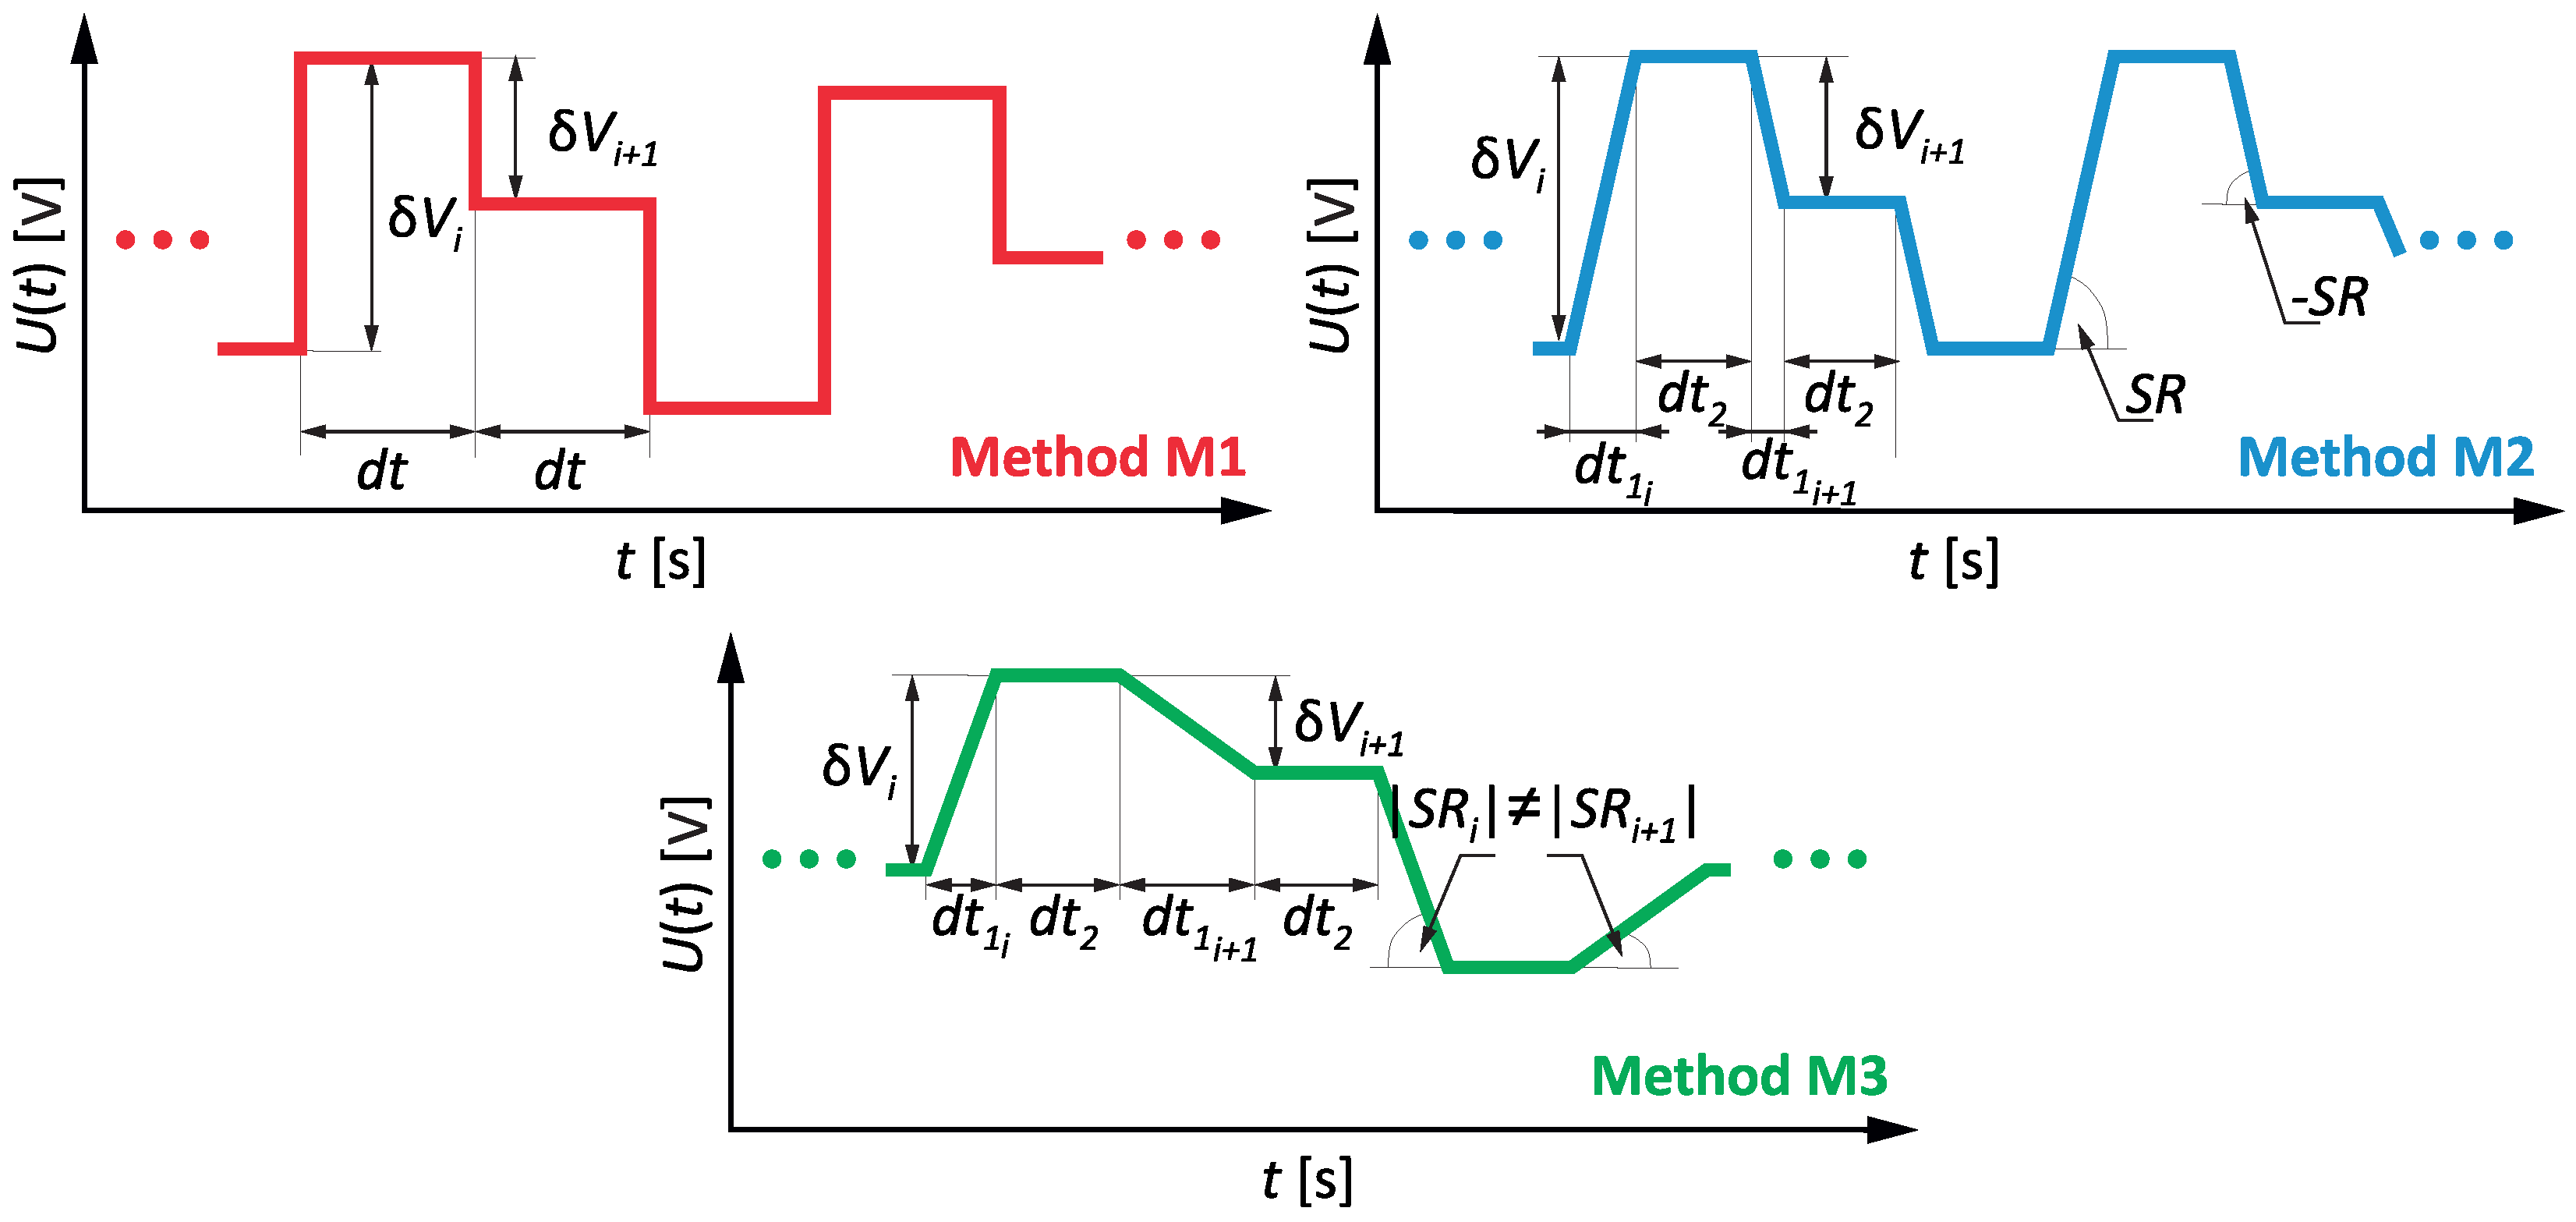
- This method recreates voltage fluctuations as step changes in the rms values of voltage , which correspond to the amplitude modulation with a square wave. The individual adopted amplitudes of voltage changes are distributed evenly throughout the considered discrimination period , and the order of their occurrence is random according to a uniform distribution. The subsequent assumed amplitudes of voltage changes are distributed in such a way (by considering the sign of the voltage change) that they oscillate around the measured average rms value and that the recreated values within the range can be defined by the measured minimum and maximum rms values of voltage. An example fragment of the voltage fluctuations recreated using the M1 method is shown in Figure 3, where the time is constant during the discrimination period and depends on the number of subsequent changes .
- M2:
- This method recreates voltage fluctuations as trapezoidal changes in the rms values of the voltage , assuming a constant speed of voltage fluctuations equal to . The individual adopted amplitudes of voltage changes are evenly distributed throughout considered discrimination time considered, and the order of their occurrence is random according to a uniform distribution. The subsequently adopted amplitudes of voltage changes in the rms values are distributed in such a way (by considering the sign of the voltage change) that they oscillate around the measured average rms value and that the recreated values fall within the range defined by the measured minimum and maximum rms values of voltage. An example fragment of the voltage fluctuations recreated using the M2 method is shown in Figure 3, where the time is constant during the discrimination period and depends on the number of subsequent changes , and the time is variable and depends on the adopted constant value of the speed .
- M3:
- This method recreates voltage fluctuations as trapezoidal changes in the rms values of voltage , assuming a variable speed for recreation of voltage fluctuations. The individual speed for the subsequent introduced amplitudes of the voltage changes are randomized within a gamma distribution with a shape parameter of 1 and a scale parameter of 300. The individual adopted amplitudes of voltage changes are evenly distributed throughout the considered discrimination time , and the order of their occurrence is random, according to a uniform distribution. The subsequently assumed amplitudes of voltage changes are distributed in such a way (by considering the sign of the change) that they oscillate around the measured average rms value and that the recreated values are within the range defined by the measured minimum and maximum rms values of voltage. An example fragment of the voltage fluctuations recreated using the M3 method is shown in Figure 3, where the time is constant during the discrimination period and depends on the number of subsequent changes and the time is variable and depends on the random value of the speed .
4. Description of Data Used for Verification
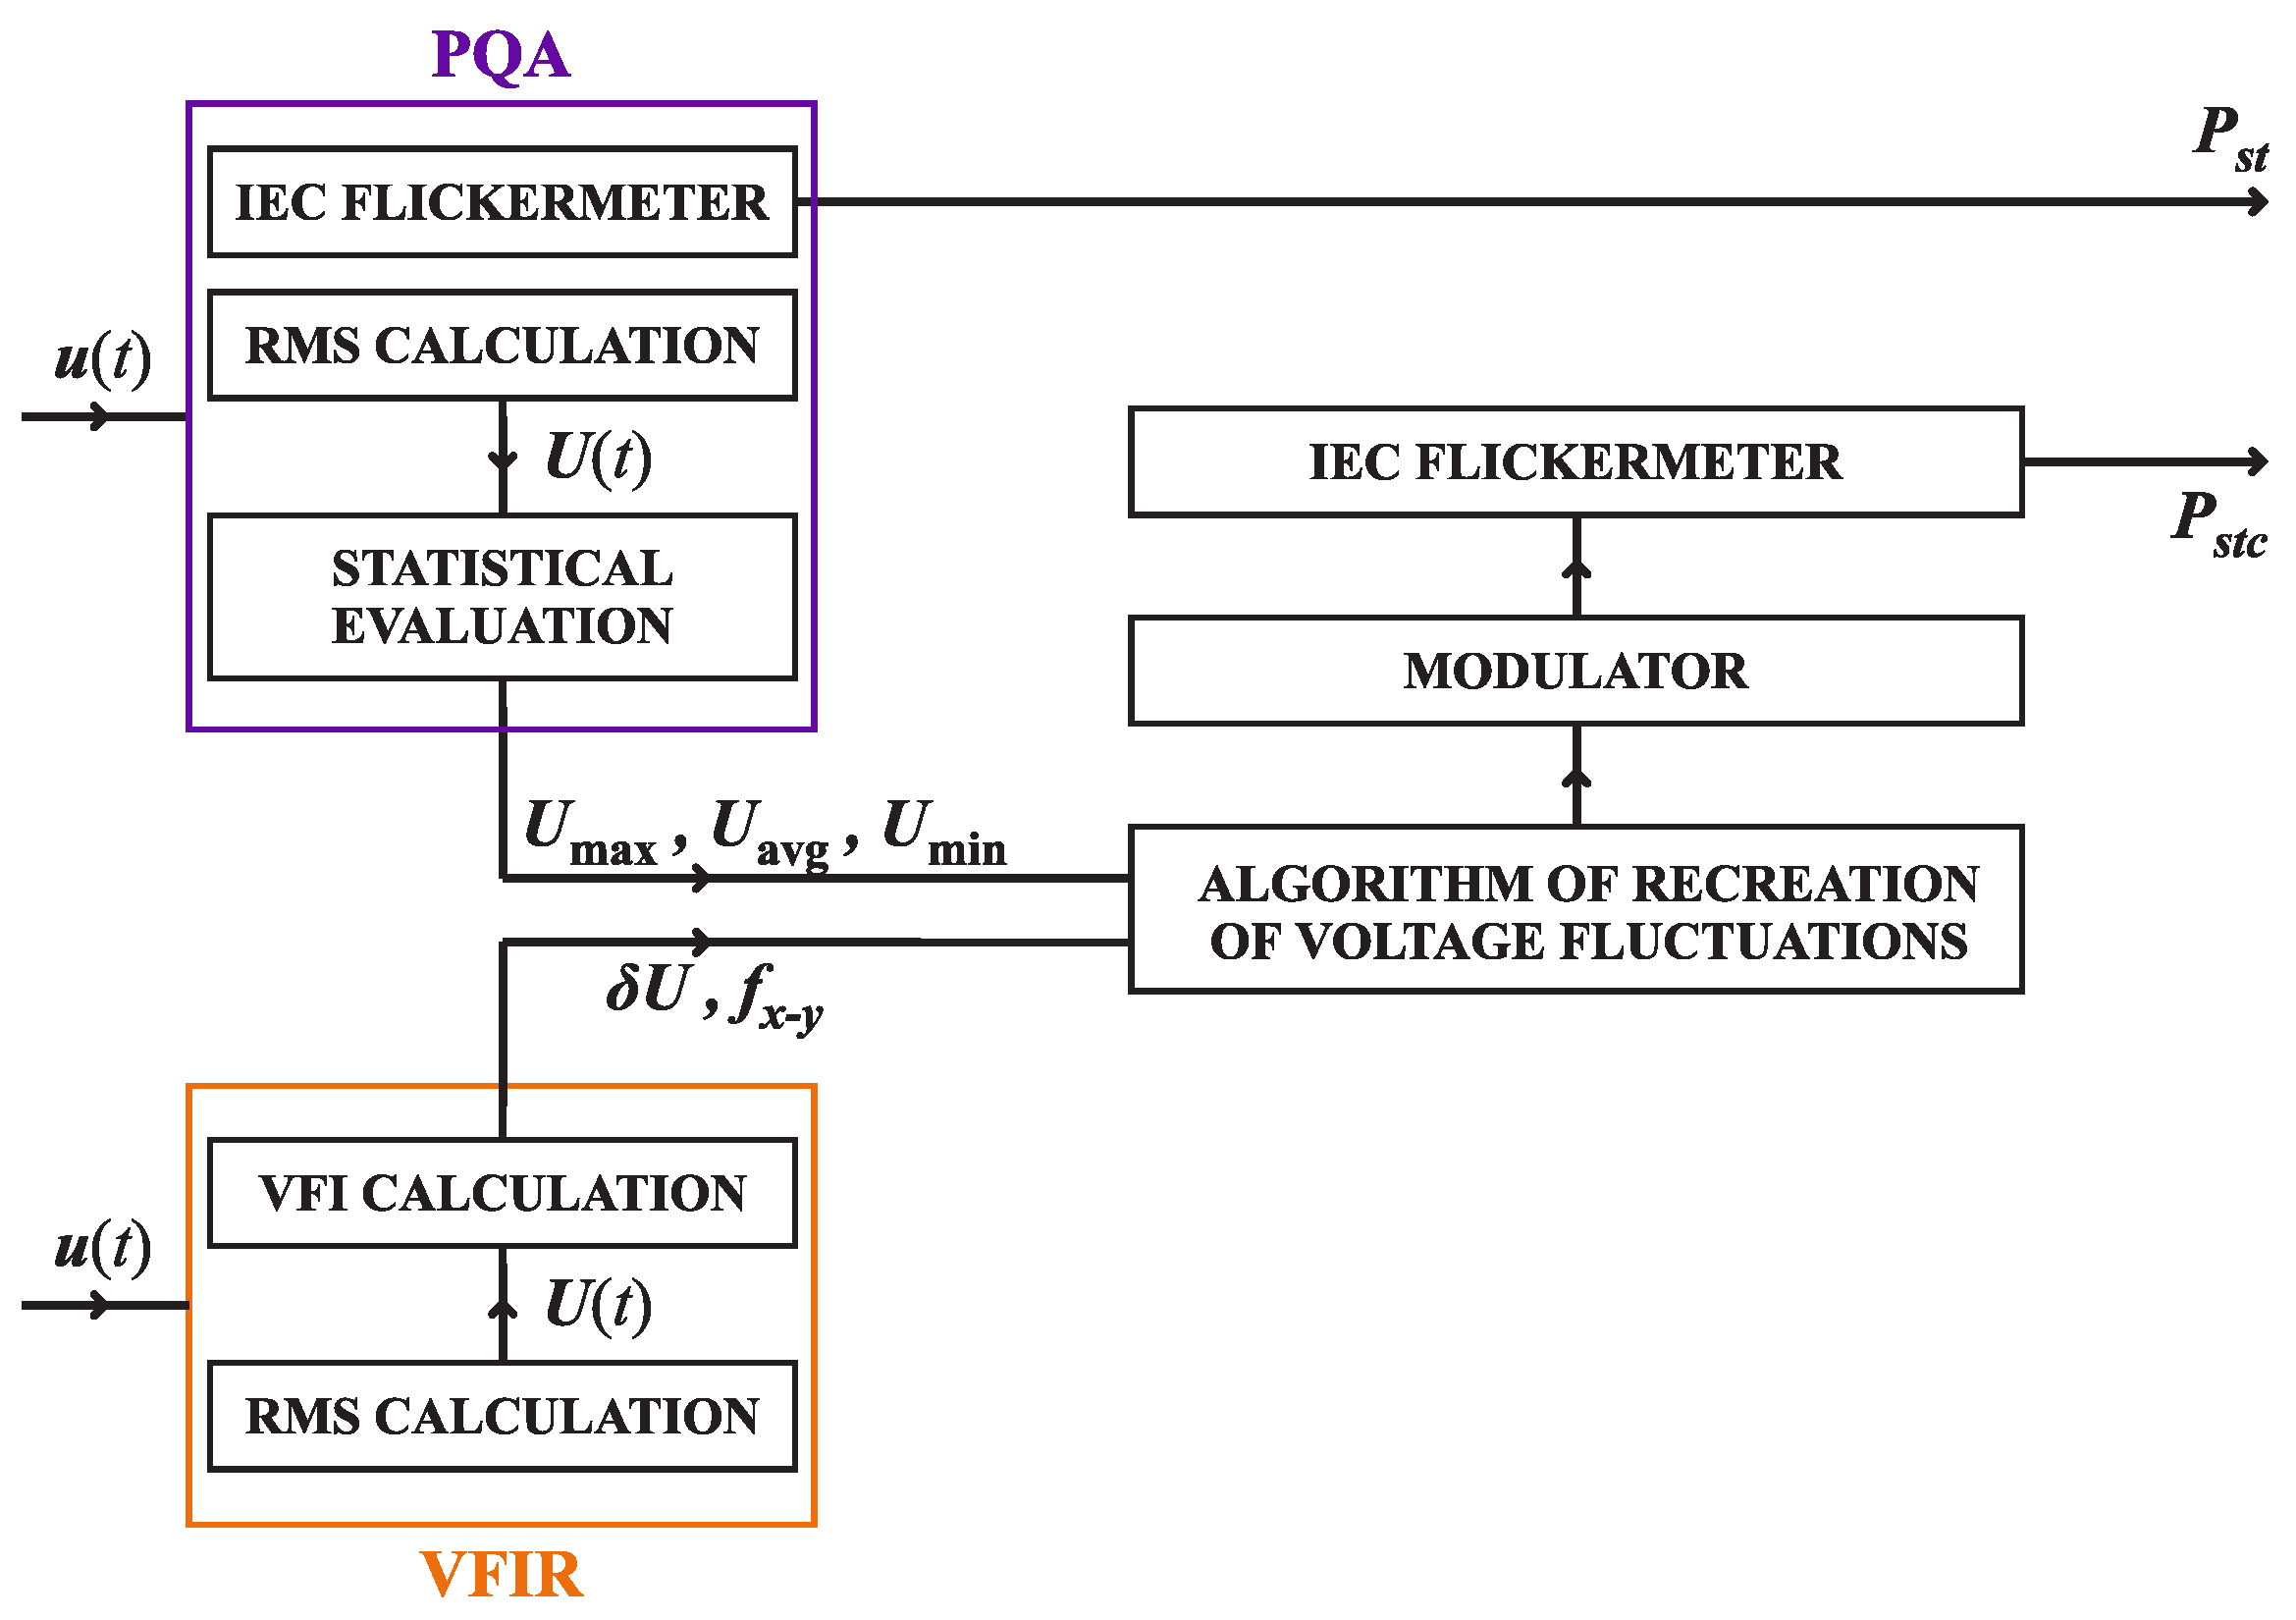
- The short-time and long-time flicker indicator;
- The minimum rms value of voltage in ;
- The maximum rms value of voltage in ;
- The average rms value of voltage in ;
- The amplitude of voltage fluctuations ;
- The rate fx−y of voltage fluctuations for individual sub-ranges : , , , , , , and .
- Case 1. Measurements taken over a period of 5 days, with the following settings:
- –
- The discrimination period of voltage fluctuation indices is 5 min;
- –
- values vary in the range from 0.29 to 2.14 (the average value of in this period is 1.19);
- –
- The maximum variability varies in the range from 0.40 to 41.27 (the average value of in this period is 6.98);
- –
- The amplitudes of voltage fluctuations vary in the range from 0.00 to 27.68 (the average value of in this period is 6.08);
- –
- The lowest rms value recorded in this period is 179.87;
- –
- The highest rms value recorded in this period is 242.76.
- Case 2. Measurements taken over a period of 7 days, with the following settings:
- –
- The discrimination period of voltage fluctuation indices is 5 min;
- –
- values vary in the range from 0.05 to 29.75 (the average value of in this period is 0.50);
- –
- The maximum variability varies in the range from 0.36 to 203.50 (the average value of in this period is 2.95);
- –
- The amplitudes of voltage fluctuations vary in the range from 0.00 to 144.67 (the average value of in this period is 2.39);
- –
- The lowest rms value recorded in this period is 48.29;
- –
- The highest rms value recorded in this period is 253.92.
- Case 3. Measurements taken over a period of 8 days, with the following settings:
- –
- The discrimination period of voltage fluctuation indices is 5 min;
- –
- values vary in the range from 0.05 to 2.16 (the average value of in this period is 0.45);
- –
- The maximum variability varies in the range from 0.57 to 29.31 (the average value of in this period is 4.26);
- –
- The amplitudes of voltage fluctuations vary in the range from 0.00 to 28.43 (the average value of in this period is 2.85);
- –
- The lowest rms value recorded in this period is 203.90;
- –
- The highest rms value recorded in this period is 236.43.
- Case 4. Measurements taken over a period of 6 days, with the following settings:
- –
- The discrimination period of voltage fluctuation indices is 5 min;
- –
- values vary in the range from 0.09 to 4.35 (the average value of in this period is 0.41);
- –
- The maximum variability varies in the range from 0.43 to 71.63 (the average value of in this period is 2.75);
- –
- The amplitudes of voltage fluctuations vary in the range from 0.00 to 61.06 (the average value of in this period is 1.88);
- –
- The lowest rms value recorded in this period is 159.91;
- –
- The highest rms value recorded in this period is 241.14.
- Case 5. Measurements taken over a period of 5 days, with the following settings:
- –
- The discrimination period of voltage fluctuation indices is 5 min;
- –
- values vary in the range from 0.09 to 1.71 (the average value of in this period is 0.42);
- –
- The maximum variability varies in the range from 0.45 to 26.35 (the average value of in this period is 2.78);
- –
- The amplitudes of voltage fluctuations vary in the range from 0.00 to 20.16 (the average value of in this period is 1.83);
- –
- The lowest rms value recorded in this period is 209.05;
- –
- The highest rms value recorded in this period is 239.74.
- Case 6. Measurements taken over a period of 6 days, with the following settings:
- –
- The discrimination period of voltage fluctuation indices is 5 min;
- –
- values vary in the range from 0.14 to 6.27 (the average value of in this period is 0.36);
- –
- The maximum variability varies in the range from 0.44 to 70.18 (the average value of in this period is 2.30);
- –
- The amplitudes of voltage fluctuations vary in the range from 0.28 to 46.23 (the average value of in this period is 1.82);
- –
- The lowest rms value recorded in this period is 161.73;
- –
- The highest rms value recorded in this period is 235.19.
- Case 7. Measurements taken over a period of 2 days, with the following settings:
- –
- The discrimination period of voltage fluctuation indices is 5 min;
- –
- values vary in the range from 0.06 to 7.28 (the average value of in this period is 0.35);
- –
- The maximum variability varies in the range from 0.37 to 120.41 (the average value of in this period is 2.20);
- –
- The amplitudes of voltage fluctuations vary in the range from 0.00 to 108.05 (the average value of in this period is 1.81);
- –
- The lowest rms value recorded in this period is 119.76;
- –
- The highest rms value recorded in this period is 242.39.
- Case 8. Measurements taken over a period of 2 days, with the following settings:
- –
- The discrimination period of voltage fluctuation indices is 5 min;
- –
- values vary in the range from 0.06 to 0.95 (the average value of in this period is 0.10);
- –
- The maximum variability varies in the range from 0.26 to 15.24 (the average value of in this period is 0.88);
- –
- The amplitudes of voltage fluctuations vary in the range from 0.00 to 11.62 (the average value of in this period is 0.26);
- –
- The lowest rms value recorded in this period is 221.94;
- –
- The highest rms value recorded in this period is 241.65.
- Case 9. Measurements taken over a period of 3 days, with the following settings:
- –
- The discrimination period of voltage fluctuation indices is 5 min;
- –
- values vary in the range from 0.06 to 1.40 (the average value of in this period is 0.12);
- –
- The maximum variability varies in the range from 0.29 to 16.34 (the average value of in this period is 0.93);
- –
- The amplitudes of voltage fluctuations vary in the range from 0.00 to 13.49 (the average value of in this period is 0.47);
- –
- The lowest rms value recorded in this period is 220.71;
- –
- The highest rms value recorded in this period is 242.02.
- Case 10. Measurements taken over a period of 4 days, with the following settings:
- –
- The discrimination period of voltage fluctuation indices is 5 min;
- –
- values vary in the range from 0.66 to 2.20 (the average value of in this period is 1.03);
- –
- The maximum variability varies in the range from 0.79 to 23.44 (the average value of in this period is 6.41);
- –
- The amplitudes of voltage fluctuations vary in the range from 2.29 to 19.99 (the average value of in this period is 5.08);
- –
- The lowest rms value recorded in this period is 191.51;
- –
- The highest rms value recorded in this period is 243.02.
- Case 11. Measurements taken over a period of 3 days, with the following settings:
- –
- The discrimination period of voltage fluctuation indices is 5 min;
- –
- values vary in the range from 0.05 to 1.71 (the average value of in this period is 0.10);
- –
- The maximum variability varies in the range from 0.50 to 87.41 (the average value of in this period is 1.45);
- –
- The amplitudes of voltage fluctuations vary in the range from 0.00 to 68.54 (the average value of in this period is 0.38);
- –
- The lowest rms value recorded in this period is 146.76;
- –
- The highest rms value recorded in this period is 236.03.
- Case 12. Measurements taken over a period of 3 days, with the following settings:
- –
- The discrimination period of voltage fluctuation indices is 5 min;
- –
- values vary in the range from 0.06 to 1.71 (the average value of in this period is 0.11);
- –
- The maximum variability varies in the range from 0.55 to 22.52 (the average value of in this period is 1.45);
- –
- The amplitudes of voltage fluctuations vary in the range from 0.00 to 18.00 (the average value of in this period is 0.37);
- –
- The lowest rms value recorded in this period is 209.99;
- –
- The highest rms value recorded in this period is 236.02.
- Case 13. Measurements taken over a period of 5 days, with the following settings:
- –
- The discrimination period of voltage fluctuation indices is 5 min;
- –
- values vary in the range from 0.14 to 4.86 (the average value of in this period is 0.73);
- –
- The maximum variability varies in the range from 0.45 to 60.73 (the average value of in this period is 4.14);
- –
- The amplitudes of voltage fluctuations vary in the range from 0.28 to 37.16 (the average value of in this period is 2.94);
- –
- The lowest rms value recorded in this period is 179.02;
- –
- The highest rms value recorded in this period is 289.16.
- Case 14. Measurements taken over a period of 5 days, with the following settings:
- –
- The discrimination period of voltage fluctuation indices is 5 min;
- –
- values vary in the range from 0.29 to 2.40 (the average value of in this period is 1.01);
- –
- The maximum variability varies in the range from 0.62 to 30.99 (the average value of in this period is 6.27);
- –
- The amplitudes of voltage fluctuations vary in the range from 0.79 to 21.84 (the average value of in this period is 5.21);
- –
- The lowest rms value recorded in this period is 183.45;
- –
- The highest rms value recorded in this period is 240.19.
- Case 15. Measurements taken over a period of 3 days, with the following settings:
- –
- The discrimination period of voltage fluctuation indices is 5 min;
- –
- values vary in the range from 0.13 to 1.63 (the average value of in this period is 0.38);
- –
- The maximum variability varies in the range from 0.54 to 21.37 (the average value of in this period is 2.84);
- –
- The amplitudes of voltage fluctuations vary in the range from 0.20 to 16.23 (the average value of in this period is 1.93);
- –
- The lowest rms value recorded in this period is 216.95;
- –
- The highest rms value recorded in this period is 247.66.
- Case 16. Measurements taken over a period of 3 days, with the following settings:
- –
- The discrimination period of voltage fluctuation indices is 5 min;
- –
- values vary in the range from 0.16 to 2.04 (the average value of in this period is 0.43);
- –
- The maximum variability varies in the range from 0.60 to 25.56 (the average value of in this period is 3.10);
- –
- The amplitudes of voltage fluctuations vary in the range from 0.34 to 14.14 (the average value of in this period is 2.13);
- –
- The lowest rms value recorded in this period is 215.07;
- –
- The highest rms value recorded in this period is 248.21.
- Case 17. Measurements taken over a period of 7 days, with the following settings:
- –
- The discrimination period of voltage fluctuation indices is 5 min;
- –
- values vary in the range from 0.05 to 4.27 (the average value of in this period is 0.26);
- –
- The maximum variability varies in the range from 0.31 to 63.88 (the average value of in this period is 1.52);
- –
- The amplitudes of voltage fluctuations vary in the range from 0.00 to 59.43 (the average value of in this period is 1.61);
- –
- The lowest rms value recorded in this period is 178.57;
- –
- The highest rms value recorded in this period is 244.86.
- Case 18. Measurements taken over a period of 5 days, with the following settings:
- –
- The discrimination period of voltage fluctuation indices is 5 min;
- –
- values vary in the range from 0.05 to 0.65 (the average value of in this period is 0.16);
- –
- The maximum variability varies in the range from 0.27 to 10.80 (the average value of in this period is 1.02);
- –
- The amplitudes of voltage fluctuations vary in the range from 0.00 to 5.42 (the average value of in this period is 0.57);
- –
- The lowest rms value recorded in this period is 226.93;
- –
- The highest rms value recorded in this period is 243.21.
- Case 19. Measurements taken over a period of 5 days, with the following settings:
- –
- The discrimination period of voltage fluctuation indices is 5 min;
- –
- values vary in the range from 0.13 to 3.92 (the average value of in this period is 1.19);
- –
- The maximum variability varies in the range from 0.38 to 27.46 (the average value of in this period is 5.64);
- –
- The amplitudes of voltage fluctuations vary in the range from 0.00 to 19.46 (the average value of in this period is 3.97);
- –
- The lowest rms value recorded in this period is 187.96;
- –
- The highest rms value recorded in this period is 243.68.
- Case 20. Measurements taken over a period of 7 days, with the following settings:
- –
- The discrimination period of voltage fluctuation indices is 1 min;
- –
- values vary in the range from 0.11 to 2.77 (the average value of in this period is 0.73);
- –
- The maximum variability varies in the range from 0.44 to 34.02 (the average value of in this period is 4.45);
- –
- The amplitudes of voltage fluctuations vary in the range from 0.00 to 28.96 (the average value of in this period is 1.85);
- –
- The lowest rms value recorded in this period is 210.98;
- –
- The highest rms value recorded in this period is 248.60.
- Case 21. Measurements taken over a period of 4 days, with the following settings:
- –
- The discrimination period of voltage fluctuation indices is 1 min;
- –
- values vary in the range from 0.05 to 29.57 (the average value of in this period is 1.38);
- –
- The maximum variability varies in the range from 0.04 to 247.45 (the average value of in this period is 5.97);
- –
- The amplitudes of voltage fluctuations vary in the range from 0.00 to 110.27 (the average value of in this period is 2.59);
- –
- The lowest rms value recorded in this period is 0.00;
- –
- The highest rms value recorded in this period is 253.99.
- Case 22. Measurements taken over a period of 4 days, with the following settings:
- –
- The discrimination period of voltage fluctuation indices is 1 min;
- –
- values vary in the range from 0.05 to 31.71 (the average value of in this period is 0.96);
- –
- The maximum variability varies in the range from 0.02 to 245.97 (the average value of in this period is 4.61);
- –
- The amplitudes of voltage fluctuations vary in the range from 0.00 to 36.85 (the average value of in this period is 1.71);
- –
- The lowest rms value recorded in this period is 0.00;
- –
- The highest rms value recorded in this period is 252.99.
- Case 23. Measurements taken over a period of 5 days, with the following settings:
- –
- The discrimination period of voltage fluctuation indices is 1 min;
- –
- values vary in the range from 0.08 to 1.90 (the average value of in this period is 0.36);
- –
- The maximum variability varies in the range from 0.44 to 17.28 (the average value of in this period is 2.14);
- –
- The amplitudes of voltage fluctuations vary in the range from 0.00 to 10.18 (the average value of in this period is 0.73);
- –
- The lowest rms value recorded in this period is 222.60;
- –
- The highest rms value recorded in this period is 249.42.
- Case 24. Measurements taken over a period of 5 days, with the following settings:
- –
- The discrimination period of voltage fluctuation indices is 1 min;
- –
- values vary in the range from 0.05 to 30.71 (the average value of in this period is 0.92);
- –
- The maximum variability varies in the range from 0.02 to 251.05 (the average value of in this period is 4.35);
- –
- The amplitudes of voltage fluctuations vary in the range from 0.00 to 34.99 (the average value of in this period is 1.55);
- –
- The lowest rms value recorded in this period is 0.00;
- –
- The highest rms value recorded in this period is 254.22.
- Case 25. Measurements taken over a period of 5 days, with the following settings:
- –
- The discrimination period of voltage fluctuation indices is 1 min;
- –
- values vary in the range from 0.05 to 31.22 (the average value of in this period is 1.27);
- –
- The maximum variability varies in the range from 0.03 to 254.08 (the average value of in this period is 5.76);
- –
- The amplitudes of voltage fluctuations vary in the range from 0.00 to 53.23 (the average value of in this period is 2.06);
- –
- The lowest rms value recorded in this period is 0.00;
- –
- The highest rms value recorded in this period is 259.35.
5. Research Results and Discussion
6. Conclusions
Funding
Data Availability Statement
Conflicts of Interest
References
- IEV Number 161-08-05; Voltage Fluctuation. International Electrotechnical Commission: Geneva, Switzerland, 2020.
- 6th CEER Benchmarking Report on All the Quality of Electricity and Gas Supply 2016. 2016. Available online: https://www.ceer.eu/ (accessed on 1 September 2021).
- Standard EN 50160:2010/A2:2019; Voltage Characteristics of Electricity Supplied by Public Electricity Networks. Cenelec: Brussels, Belgium, 2017.
- Kuwalek, P.; Wiczynski, G. Dependence of Voltage Fluctuation Severity on Clipped Sinewave Distortion of Voltage. IEEE Trans. Instrum. Meas. 2021, 70, 2006008. [Google Scholar] [CrossRef]
- Wiczynski, G.; Kuwalek, P. Voltage Distortion Influence on Flicker Severity Measurement by AMI Energy Meters. IEEE Trans. Ind. Electron. 2022, 69, 10684–10693. [Google Scholar] [CrossRef]
- Medeiros, C.; de Oliveira, J. Effects of voltage fluctuation associated to flicker limits on equipments performance. In Proceedings of the 10th International Conference on Harmonics and Quality of Power, Proceedings (Cat. No. 02EX630), Rio de Janeiro, Brazil, 6–9 October 2002; Volume 1, pp. 347–352. [Google Scholar] [CrossRef]
- Mindykowski, J.; Tarasiuk, T. Problems of power quality in the wake of ship technology development. Ocean Eng. 2015, 107, 108–117. [Google Scholar] [CrossRef]
- Ghaseminezhad, M.; Doroudi, A.S.H.; Hosseinian, A.J. Analysis of voltage fluctuation impact on induction motors by an innovative equivalent circuit considering the speed changes. IET Gen. Transm. Distrib. 2017, 11, 512–519. [Google Scholar] [CrossRef]
- Jhala, K.; Natarajan, B.; Pahwa, A. The Dominant Influencer of Voltage Fluctuation for Power Distribution System. IEEE Trans. Power Syst. 2019, 34, 4847–4856. [Google Scholar] [CrossRef]
- IEV Number 845-02-49; Flicker. International Electrotechnical Commission: Geneva, Switzerland, 2020.
- Drapela, J.; Langella, R.; Slezingr, J.; Testa, A. A Tunable Flickermeter to Account for Different Lamp Technologies. IEEE Trans. Power Deliv. 2017, 32, 872–880. [Google Scholar] [CrossRef]
- Petrinska, I.; Ivanov, D.; Pavlov, D.; Kassev, K. Photometric Flicker of LED Luminaires According to Driver Type. In Proceedings of the 2020 21st International Symposium on Electrical Apparatus Technologies (SIELA), Bourgas, Bulgaria, 3–6 June 2020; pp. 1–4. [Google Scholar] [CrossRef]
- Kukacka, L.; Hergesel, J.; Necasek, J.; Bilek, P.; Vik, M.; Meyer, J.; Stiegler, R.; Pourarab, M.; Drapela, J. Flicker Visibility with Different Spectra of White Light. In Proceedings of the 2023 IEEE Industry Applications Society Annual Meeting (IAS), Nashville, TN, USA, 29 October–2 November 2023; pp. 1–6. [Google Scholar] [CrossRef]
- Collin, A.J.; Djokic, S.Z.; Drapela, J.; Langella, R.; Testa, A. Light Flicker and Power Factor Labels for Comparing LED Lamp Performance. IEEE Trans. Ind. Appl. 2019, 55, 7062–7070. [Google Scholar] [CrossRef]
- Otomanski, P.; Wiczynski, G.; Zajac, B. Flicker Vision of Selected Light Sources. Meas. Sci. Rev. 2017, 17, 232–240. [Google Scholar] [CrossRef][Green Version]
- Petrinska, I.; Ivanov, D. Estimation of Flicker of Contemporary LED Lamps and Luminaires. In Proceedings of the 2019 11th Electrical Engineering Faculty Conference (BulEF), Varna, Bulgaria, 11–14 September 2019; pp. 1–4. [Google Scholar] [CrossRef]
- Putz, L.; Bednarek, K.; Nawrowski, R. Disturbances Generated by Lighting Systems with LED Lamps and the Reduction in Their Impacts. Appl. Sci. 2019, 9, 4894. [Google Scholar] [CrossRef]
- Gnacinski, P.; Peplinski, M.; Muc, A.; Hallmann, D.; Klimczak, P. Induction Motors Under Voltage Fluctuations and Power Quality Standards. IEEE Trans. Energy Convers. 2024, 39, 1255–1264. [Google Scholar] [CrossRef]
- Gnacinski, P.; Peplinski, M.; Hallmann, D.; Jankowski, P. Induction cage machine thermal transients under lowered voltage quality. IET Electr. Power Appl. 2019, 13, 479–486. [Google Scholar] [CrossRef]
- Gnacinski, P.; Peplinski, M.; Murawski, L.; Szelezinski, A. Vibration of Induction Machine Supplied with Voltage Containing Subharmonics and Interharmonics. IEEE Trans. Energy Convers. 2019, 34, 1928–1937. [Google Scholar] [CrossRef]
- Gnacinski, P.; Hallmann, D.; Peplinski, M.; Jankowski, P. The effects of voltage subharmonics on cage induction machine. Int. J. Electr. Power Energy Syst. 2019, 111, 125–131. [Google Scholar] [CrossRef]
- Gnacinski, P.; Hallmann, D.; Klimczak, P.; Muc, A.; Peplinski, M. Effects of Voltage Interharmonics on Cage Induction Motors. Energies 2021, 14, 1218. [Google Scholar] [CrossRef]
- Gnacinski, P.; Muc, A.; Peplinski, M. Influence of Voltage Subharmonics on Line Start Permanent Magnet Synchronous Motor. IEEE Access 2021, 9, 164275–164281. [Google Scholar] [CrossRef]
- Faranda, R.; Hafezi, H.; Shafizadeh, Z.; Fontana, A. Thermal load management: Experimental investigation of voltage variation effect on loads behavior. In Proceedings of the 2017 IEEE International Conference on Environment and Electrical Engineering and 2017 IEEE Industrial and Commercial Power Systems Europe (EEEIC/I&CPS Europe), Milan, Italy, 6–9 June 2017; pp. 1–5. [Google Scholar] [CrossRef]
- Gnacinski, P.; Klimczak, P. High-Power Induction Motors Supplied with Voltage Containing Subharmonics. Energies 2020, 13, 5894. [Google Scholar] [CrossRef]
- Bichik, A. Impact of Voltage Variation on Domestic and Commercial Loads. Master’s Thesis, Aalto University, School of Electrical Engineering, Espoo, Finland, 2015. [Google Scholar]
- IEV number 161-08-18; Short-Term Flicker Indicator. International Electrotechnical Commission: Geneva, Switzerland, 2020.
- IEV number 161-08-19; Long-Term Flicker Indicator. International Electrotechnical Commission: Geneva, Switzerland, 2020.
- IEV number 604-01-28; Flickermeter. International Electrotechnical Commission: Geneva, Switzerland, 2020.
- Standard IEC 61000-4-15:2010/ISH1:2017; Testing and Measurement Techniques—Flickermeter—Functional and Design Specifications. International Electrotechnical Commission: Geneva, Switzerland, 2017.
- Standard IEC 61000-4-30:2015/AMD1:2021; Testing and Measurement Techniques—Power Quality Measurement Methods. International Electrotechnical Commission: Geneva, Switzerland, 2021.
- Wiczynski, G. Model of ΔV10-meter signal chain for periodic voltage fluctuation. Measurement 2016, 93, 224–231. [Google Scholar] [CrossRef]
- Energy Measurements System SPE ENERGO, User Manual; ZAP MikroTom: Poznań, Poland, 2012.
- Wiczynski, G. Analysis of Voltage Fluctuations in Power Networks. IEEE Trans. Instrum. Meas. 2008, 57, 2655–2664. [Google Scholar] [CrossRef]
- Wiczynski, G. Voltage-Fluctuation-Based Identification of Noxious Loads in Power Network. IEEE Trans. Instrum. Meas. 2009, 58, 2893–2898. [Google Scholar] [CrossRef]
- Wiczynski, G. Determining location of voltage fluctuation source in radial power grid. Electr. Power Syst. Res. 2020, 180, 106069. [Google Scholar] [CrossRef]
- Wiczynski, G. Estimation of Pst indicator values on the basis of voltage fluctuation indices. IEEE Trans. Instrum. Meas. 2017, 66, 2046–2055. [Google Scholar] [CrossRef]
- Kuwalek, P. Recreation of Voltage Fluctuation Using Basic Parameters Measured in the Power Grid. J. Electr. Eng. Technol. 2020, 15, 601–609. [Google Scholar] [CrossRef]
- Michalski, M. Introductory results of tests of algorithms for recreation of voltage variation with voltage fluctuation indices. In Proceedings of the 2018 18th International Conference on Harmonics and Quality of Power (ICHQP), Ljubljana, Slovenia, 13–16 May 2018; pp. 1–5. [Google Scholar] [CrossRef]
- Michalski, M.; Wiczynski, G. An example of converting voltage fluctuation indices into Pst indicator. In Proceedings of the 2018 18th International Conference on Harmonics and Quality of Power (ICHQP), Ljubljana, Slovenia, 13–16 May 2018; pp. 1–5. [Google Scholar] [CrossRef]
- Kuwalek, P. Estimation of Parameters Associated with Individual Sources of Voltage Fluctuations. IEEE Trans. Power Deliv. 2021, 36, 351–361. [Google Scholar] [CrossRef]
- Kuwalek, P. Increase of Diagnostic Capabilities of Voltage Fluctuation Indicies. In Proceedings of the 2020 19th International Conference on Harmonics and Quality of Power (ICHQP), Dubai, United Arab Emirates, 6–7 July 2020; pp. 1–6. [Google Scholar]
- Kuwalek, P. Assessment of Diagnostic Capabilities of Methods of Recreation of Voltage Fluctuations. In Proceedings of the 18th International Conference on Compatibility, Power Electronics and Power Engineering (CPE-PowerENG 2024), Gdynia, Poland, 24–26 June 2024; p. 30. [Google Scholar]
- Kenney, J.; Keeping, E. Linear Regression and Correlation. In Mathematics of Statistics; Kenney, J., Ed.; Van Nostrand: Princeton, NJ, USA, 1962; Chapter 15; pp. 252–285. [Google Scholar]
- Chen, J.; Zhao, Y.; Wang, M.; Wang, K.; Huang, Y.; Xu, Z. Power Sharing and Storage-Based Regenerative Braking Energy Utilization for Sectioning Post in Electrified Railways. IEEE Trans. Transp. Electrif. 2024, 10, 2677–2688. [Google Scholar] [CrossRef]
- Ju, Y.; Liu, W.; Zhang, Z.; Zhang, R. Distributed Three-Phase Power Flow for AC/DC Hybrid Networked Microgrids Considering Converter Limiting Constraints. IEEE Trans. Smart Grid 2022, 13, 1691–1708. [Google Scholar] [CrossRef]
- Shirkhani, M.; Tavoosi, J.; Danyali, S.; Sarvenoee, A.K.; Abdali, A.; Mohammadzadeh, A.; Zhang, C. A review on microgrid decentralized energy/voltage control structures and methods. Energy Rep. 2023, 10, 368–380. [Google Scholar] [CrossRef]




Disclaimer/Publisher’s Note: The statements, opinions and data contained in all publications are solely those of the individual author(s) and contributor(s) and not of MDPI and/or the editor(s). MDPI and/or the editor(s) disclaim responsibility for any injury to people or property resulting from any ideas, methods, instructions or products referred to in the content. |
© 2024 by the author. Licensee MDPI, Basel, Switzerland. This article is an open access article distributed under the terms and conditions of the Creative Commons Attribution (CC BY) license (https://creativecommons.org/licenses/by/4.0/).
Share and Cite
Kuwałek, P. Practical Verification of Diagnostic Capabilities of Methods for the Recreation of Voltage Fluctuations. Electronics 2024, 13, 3272. https://doi.org/10.3390/electronics13163272
Kuwałek P. Practical Verification of Diagnostic Capabilities of Methods for the Recreation of Voltage Fluctuations. Electronics. 2024; 13(16):3272. https://doi.org/10.3390/electronics13163272
Chicago/Turabian StyleKuwałek, Piotr. 2024. "Practical Verification of Diagnostic Capabilities of Methods for the Recreation of Voltage Fluctuations" Electronics 13, no. 16: 3272. https://doi.org/10.3390/electronics13163272
APA StyleKuwałek, P. (2024). Practical Verification of Diagnostic Capabilities of Methods for the Recreation of Voltage Fluctuations. Electronics, 13(16), 3272. https://doi.org/10.3390/electronics13163272


