Abstract
In 5G networks and beyond, managing handovers (HOs) becomes complex because of frequent user transitions through small coverage areas. The abundance of small cells (SCs) also complicates HO decisions, potentially leading to inefficient resource utilization. To optimize this process, we propose an intelligent algorithm based on a method that utilizes a fuzzy logic controller (FLC), leveraging prior expertise to dynamically adjust the time-to-trigger (TTT), and handover margin (HOM) in a 5G ultra-dense SC heterogeneous network (HetNet). FLC refines TTT based on the user’s velocity to improve the response to movement. Simultaneously, it adapts HOM by considering inputs such as the reference signal received power (RSRP), user equipment (UE) speed, and cell load. The proposed approach enhances HO decisions, thereby improving the overall system performance. Evaluation using metrics such as handover rate (HOR), handover failure (HOF), radio link failure (RLF), and handover ping-pong (HOPP) demonstrate the superiority of the proposed algorithm over existing approaches.
1. Introduction
The swift rise in the number of mobile devices is leading to an increased demand for data traffic. According to the Ericsson Mobility Report, mobile data traffic is forecast to reach 329 exabytes (EB) per month by 2028. This represents a growth factor of 3.5% compared to the data traffic demand in 2022 [1]. The escalating demand for data traffic requires expanding and extending the capacity and coverage of legacy networks. A potential solution is the use of higher frequency bands and the deployment of a significant quantity of small cells (SCs) within the coverage area of existing cells [2]. This creates a heterogeneous network (HetNet) environment. HetNets comprise both macro cells (MCs) and SCs, which may use different radio access networks [3,4]. The deployment of dense SCs in a HetNet pose significant mobility management challenges, particularly for users moving at higher speeds. During movement, the user equipment (UE) passes through different cell-serving areas, requiring a smooth transition of the UE connection from one cell to another. This transition process is called a handover (HO), which differentiates cellular communication from Wi-Fi and is a sophisticated process in cellular networks. The goal of this process is to provide uninterrupted and reliable connectivity to the UE to facilitate service continuity [5].
The HO process becomes more complicated and challenging in densely deployed SC HetNets compared to conventional networks. HO triggering is based on the serving cell and neighboring cell’s signal quality in conventional networks, where the UE reports the signal strength of the serving cell, and the serving cell decides to initiate the HO process. For better HO decision and proper triggering of HO, based on reference signal received power (RSRP) and reference signal received quality (RSRQ) measurements, different parameters, such as time-to-trigger (TTT), handover margin (HOM), cell individual offset (CIO), and layer-3 (L3) filtering coefficient, are used. The pertinent selection of parameters for HO triggering affects the optimization of key performance indicators (KPIs). Proper triggering of HO ensures a reduction in unnecessary handover (UHO), handover failure (HOF), and radio link failure (RLF) probabilities while optimizing cell blocking probability (CBP), cell dropping probability (CDP), handover latency (HOL), and interruption time (InT). To achieve this, an efficient and resilient HO algorithm must be developed [6,7].
Mobility robustness optimization (MRO) is a significant function of self-organizing networks (SON) introduced by the third generation partnership project (3 GPP) [8,9]. Its purpose is to find the appropriate HO trigger for the optimal target cell to automatically optimize the HO control parameters (HCPs), such as TTT and HOM. The aim of the MRO algorithm should aim to mitigate UHO, RLF, and handover rate (HOR), which are significantly affected by the adjustment of HCPs [10]. For example, setting a long TTT at high speeds decreases UHO but increases RLF and vice versa. In addition, setting a low value for the HOM at high speeds can result in an early HO which in turn leads to RLF. Therefore, determining the optimal TTT and HOM to optimize the KPIs is still a challenge. Numerous methods have been suggested in academic research to address the issue of estimating TTT and HOM in long-term evolution (LTE) and 5G HetNets.
This study proposes a system for developing an algorithm that utilizes a fuzzy logic controller (FLC), and its notable contributions can be summarized as follows:
- Development of an intelligent FLC framework that separately handles TTT and HOM. The proposed framework utilizes critical system parameters such as RSRP, UE speed, and cell load to optimize the tuning of the TTT and HOM settings. These settings vary based on different input conditions, with the TTT being specifically set to longer for lower UE speed scenarios and shorter for higher UE speeds to ensure optimal performance.
- Optimization of the TTT and HOM settings involves applying the FLC rules based on previous expertise to determine their optimal values. This expertise includes an iterative process of applying different TTT and HOM values with varying ranges of input parameters to minimize RLF and HOPP. Specifically, different UE speed categories were considered for TTT optimization. It is crucial to set TTT and HOM in a manner that minimizes both RLF and HOPP levels simultaneously. Long TTT values may reduce HOPP occurrence but can lead to RLF due to serving signal deterioration and HO delay. Similarly, high HOM values can have the same effect. Conversely, a short TTT and low HOM may reduce the RLF but increase the overhead signaling and HOPP probabilities. This approach balances the mitigation of RLF and HOPP issues while ensuring the overall quality of service (QoS).
- We present an algorithm that facilitates efficient HO decision-making in ultra-densely deployed SC HetNets, resulting in optimized KPIs compared to existing methods in the literature, with a focus on simultaneously mitigating RLF and HOPP levels.
- Significantly, the UE speed thresholds considered in this study surpass those documented in prior literature. The carefully selected UE speeds are reflective of real-life scenarios, thus enhancing the practical applicability of this research.
The remaining sections of this paper are organized as follows. Section 2 provides a summary of the relevant literature concerning the adjustment of HCPs, specifically focusing on TTT and HOM. Section 3 defines the system model used in this study, provides an overview of FLC, and explains the proposed algorithm. Section 4 lists the simulation parameters and presents a thorough discussion of the KPI results. Finally, Section 5 serves as the conclusion of the paper.
2. Related Works
To tackle the problem of HO management and optimize adjustments to HCPs, researchers have taken various approaches. There are two main options for configuring the HCPs: fixed and adaptive. However, it is common practice to combine both fixed and adaptive settings into a single configuration for HCPs, harmonizing them together. In [11], the authors proposed an HO algorithm considering signal-to-interference-plus-noise ratio (SINR) and time-of-stay (ToS) parameters to balance the load between the cells and improve the throughput in HetNets. They assigned specific values to TTT and HOM based on the mobility of the UEs. The algorithm has a maximum speed limit of 70 km/h.
The authors in [12] introduced an algorithm that adaptively adjusts the HOM based on the UE’s position within the cell in an LTE environment. They clarified that the HOM decreases as UE moves toward the cell edge. The algorithm considers two UE speeds: 30 km/h and 120 km/h. In [13], an algorithm was developed based on enhanced mobility state estimation to optimize TTT and HOM. The algorithm takes into account the speed of the UE and different types of HOs (MC to MC, MC to SC, SC to MC, and SC to SC) in HetNets. In the study, the authors combined the adjusted TTT values with adaptive HOM adjustment in SON. The maximum speed of the UE considered is 120 km/h. In addition, it is recommended to set lower TTT values for UEs with higher mobility speeds. This will help prevent late HOs that could lead to RLF. In [14], the authors proposed an algorithm using a weight function tailored for carrier aggregation within the LTE-A environment to adaptively estimate HOM. The algorithm dynamically fine-tunes the HOM level by employing an adaptive function that relies on the weighting functions of SINR, cell load, and UE speed. The evaluation of the system’s performance involved measuring the SINR received by the UE, the throughput at the cell edges, and the probability of experiencing an outage. The maximum UE speed was set to 150 km/h. In reference [15], the authors extended the approach introduced in [14] and proposed a method to estimate the TTT and HOM parameters for each UE in a 5G network. The estimation was performed dynamically based on the UE’s experience. This method takes into account cell load, SINR, and UE speed as inputs to execute bounded functions. The outputs of these bounded functions are then used as inputs to another function that estimates the TTT and HOM parameters. The performance of the proposed method was evaluated using RSRP, HOR, HOPP, and RLF. The maximum UE speed considered in the study was 140 km/h. In a similar manner, the authors of [16] presented an algorithm that estimates both TTT and HOM in an LTE/5G HetNet. This algorithm adjusts the TTT and HOM by considering factors such as RSRP, cell load, and the speed of the UE. The performance of the network was evaluated using metrics such as HOF, HOPP, and InT. The maximum speed of the UE was set to 140 km/h.
Furthermore, the use of FLC has been extensively documented in the literature as a means of dynamically adjusting TTT and HOM. Some studies have used FLC to estimate either TTT or HOM, whereas others have used FLC to estimate both. In [17], a method has been developed for LTE HetNet environment that uses FLC to dynamically set the HOM. This method considers parameters such as reference signal received quality (RSRQ), UE speed, and the current HOM threshold. The maximum speed for the UE was set to 90 km/h. The study focused on system performance based on HOR, RSRQ, and HOM levels but did not consider KPIs such as RLF and HOPP, which are important for measuring system quality. The authors of [18] proposed a method that uses FLC to dynamically adjust the HOM based on three different rules in an LTE network. They considered the HOR and call dropping rate (CDR) as inputs to the FLC. TTT was applied using a fixed set of values. The method was analyzed for various traffic loads and UE speeds. The system’s performance was evaluated in terms of HOR and CDR, but other KPIs were not considered in their evaluation. The maximum speed for the UE was set at 50 km/h. In reference [19], the authors proposed an algorithm based on FLC that uses RSRP, RSRQ, and UE speed to dynamically determine HOM in an LTE HetNet. The algorithm’s effectiveness was assessed by employing KPIs such as HOR, RLF, and HOPP. The speed of the UE was taken into account within the range of 0 km/h to 80 km/h. Additionally, the impact of various inputs on FLC was studied individually, including HOR, HOF, HOPP, and the average time spent by the UE inside an SC. In [20], an HO algorithm that uses FLC has been introduced. This algorithm dynamically determines the HOM by considering both the current received SINR and the expected future SINR values for the UE in a 5G network. The authors claim that future SINR values can be predicted based on the SINR variations in the previous 200 milliseconds (ms). The network performance was evaluated in terms of RLF and HOPP. The UE speed was set at 3 km/h for indoor scenarios and 30 km/h for outdoor scenarios.
Moreover, the authors in [21] presented a technique that combines FLC with weight functions to adjust TTT and HOM settings in an LTE/5G HetNet. The FLC takes inputs from the SINR, cell load, and UE speed functions. The system’s performance was evaluated using metrics such as RLF, HOPP, and HOF. The study considered a maximum UE speed of 160 km/h. In both [22,23], the authors introduced the same method that uses FLC in the context of 5G and beyond networks. This method uses inputs such as RSRP, RSRQ, and UE speed to estimate the TTT and HOM. The primary aim of this approach, as mentioned in [22], is to mitigate HOR and HOPP issues. However, the specific FLC rules for estimating TTT and HOM are not provided explicitly in the study. However, the authors have detailed these FLC rules in their later work, along with additional KPIs such as HOF, HOL, and InT. The maximum UE speed considered in their studies was 160 km/h.
In [24], the authors introduced an algorithm in an LTE/5G environment that is similar to the methodologies discussed in references [14,15]. It builds upon the approaches presented in [16,21]. The newly proposed algorithm incorporates FLC into the weight functions, allowing adaptive adjustments to the TTT and HOM levels. The evaluation of system performance included metrics such as HOPP, RLF, HOL, and outage probability. The maximum UE speed considered was 160 km/h. The authors in [25] introduced an HO decision method that uses FLC in an LTE/5G ultra-dense network environment. This method adjusts the TTT and HOM dynamically on the basis of the SINR and the speed of the UE. The performance of this method was evaluated using metrics such as HOR, HOPP, and overall system throughput. The maximum speed considered for the UE was 72 km/h.
3. Proposed System Architecture
This section provides the system model used in this study, outlines FLC in a general form, and explains the proposed system and algorithm for the HO decision.
3.1. System Model
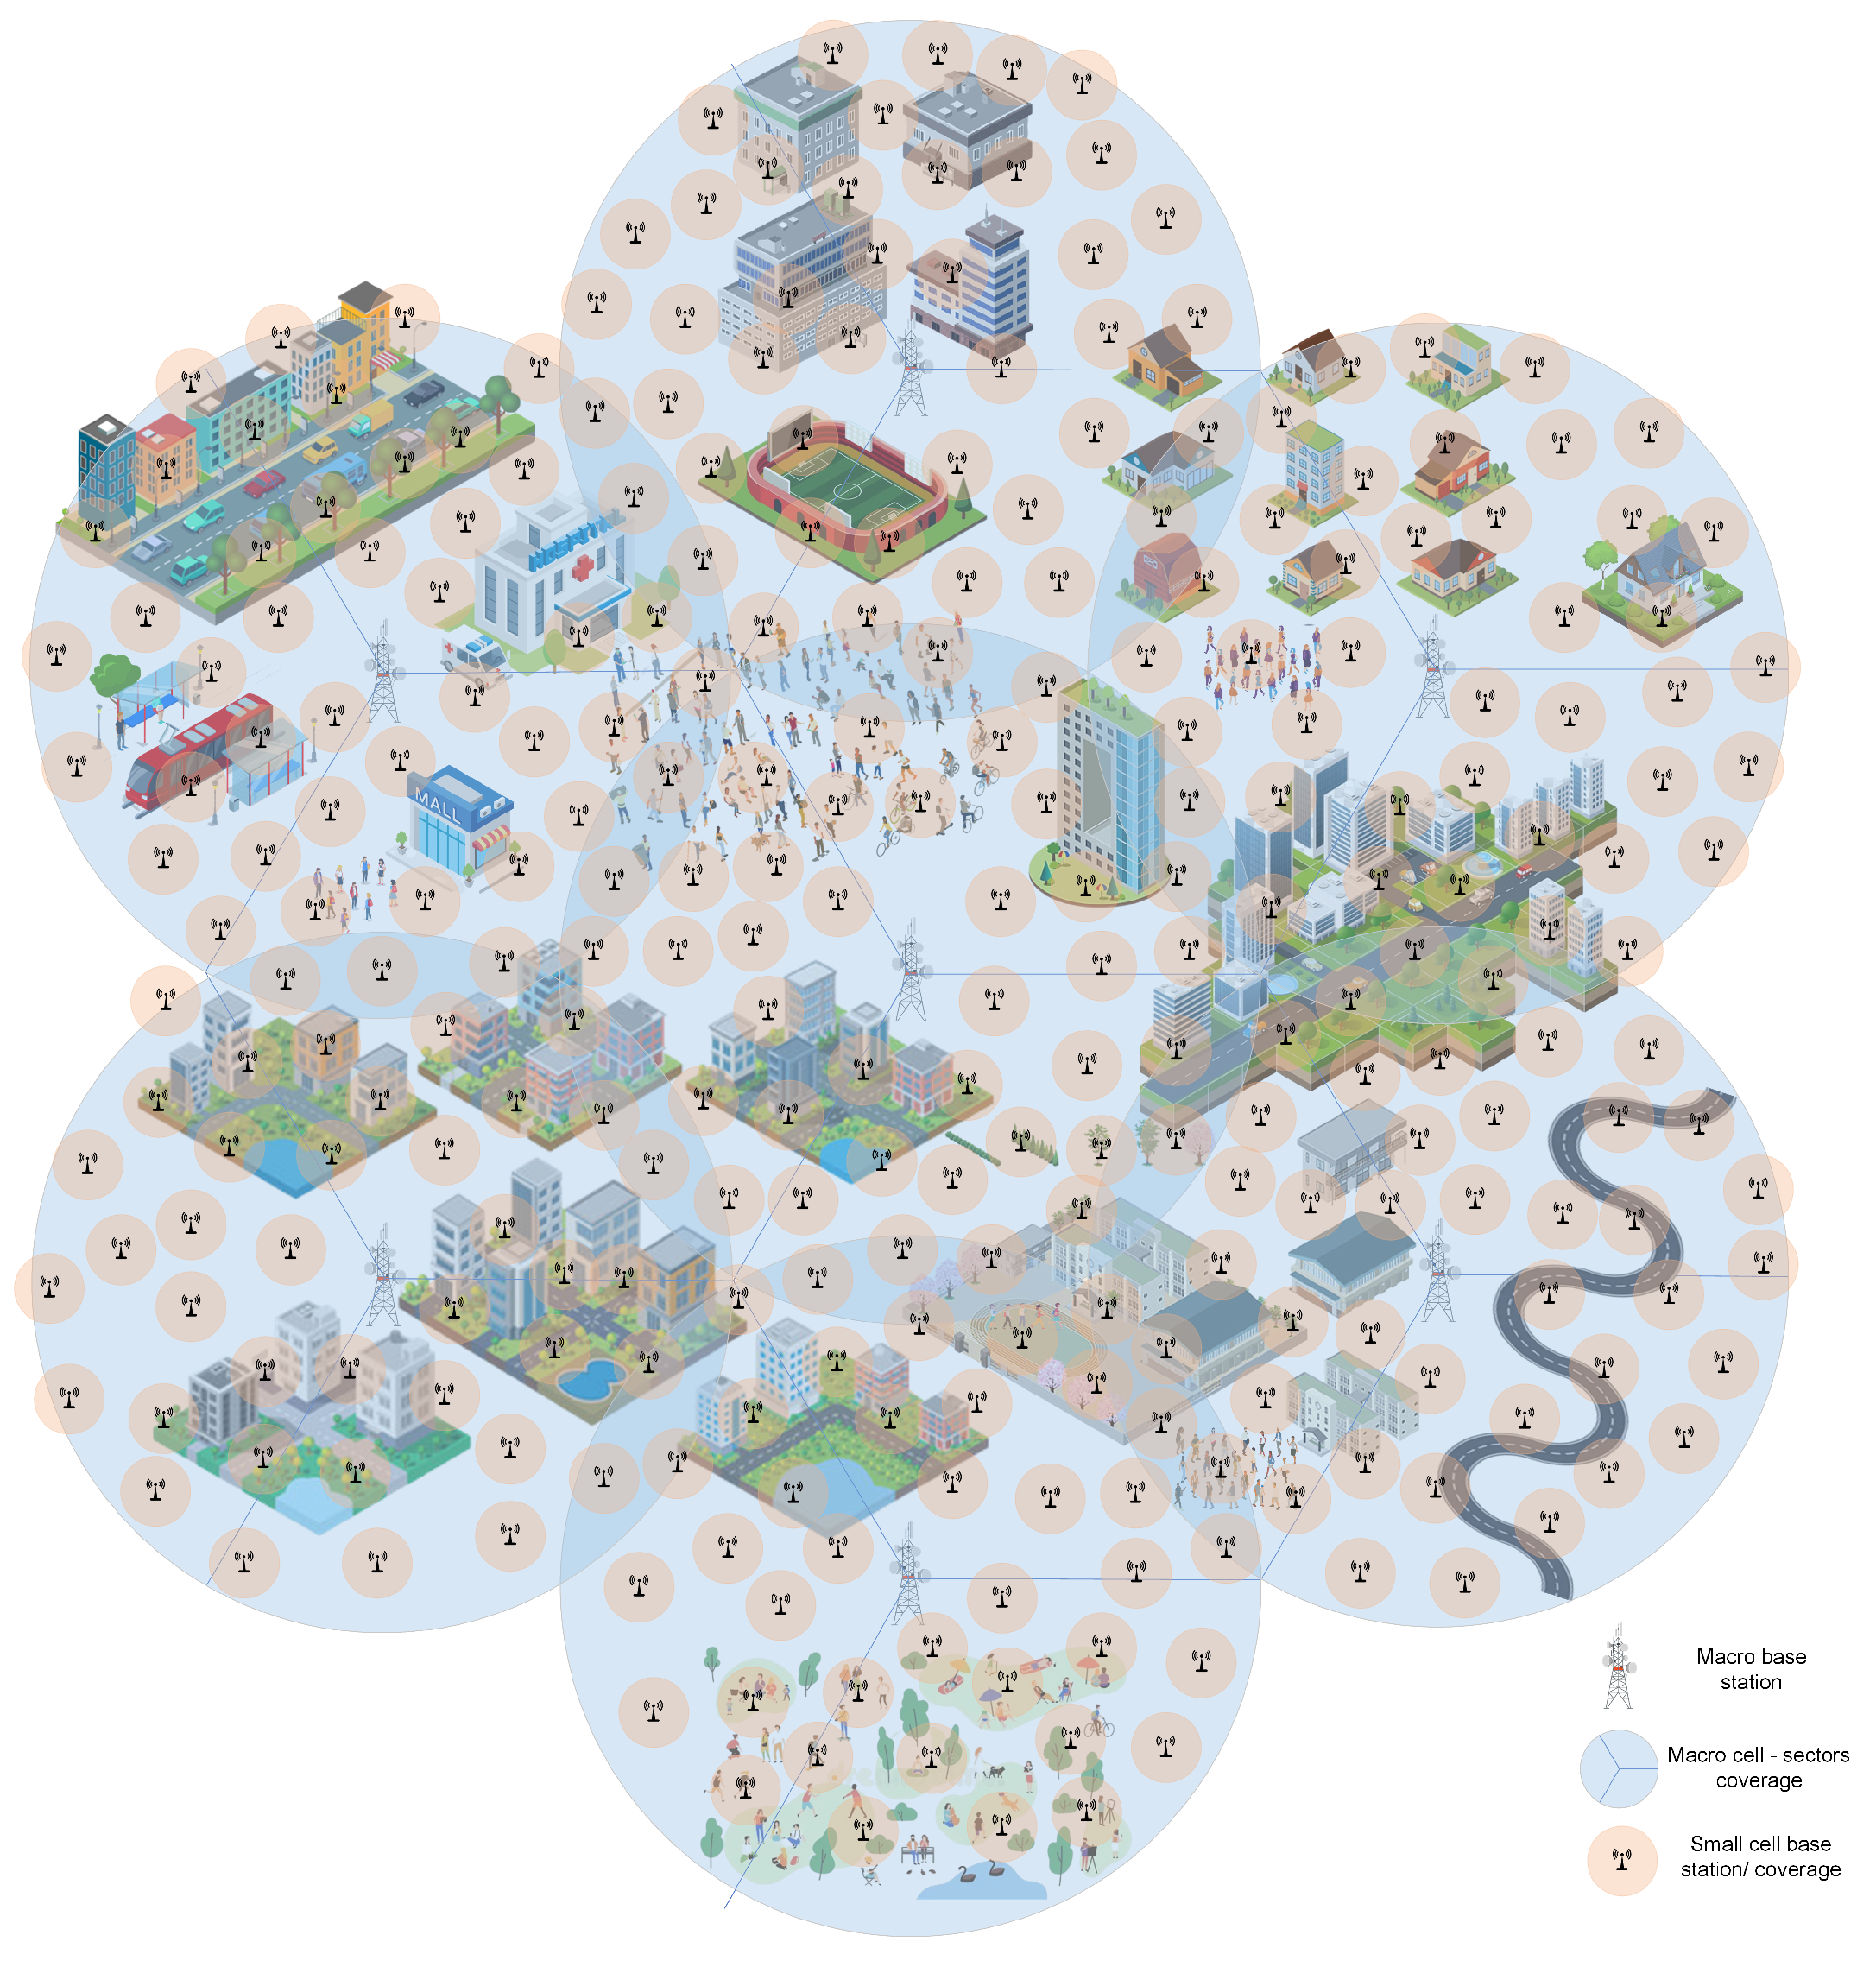
In our study, we investigate a two-tier configuration of a HetNet illustrated in Figure 1.
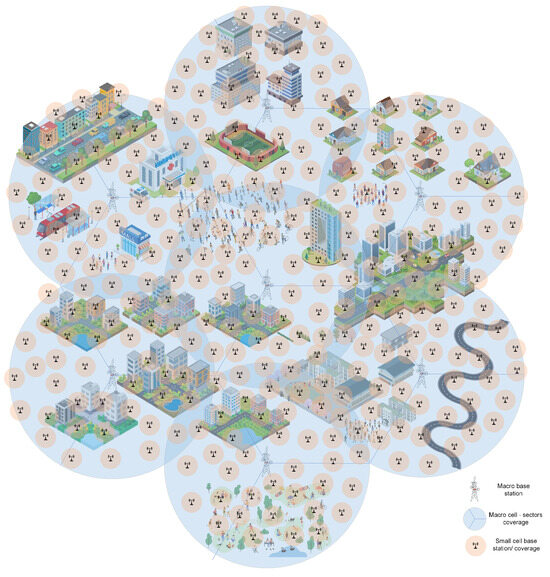
Figure 1.
Proposed HetNet system model.
This configuration includes seven LTE-A base stations (BSs), each with three sectors, and an ultra-dense collection of 5G BSs. The LTE-A BSs are positioned at the center of the MC and cover the surrounding area with three sectors. The 5G BSs are located at the center of the SCs and exhibit omni-directional propagation. SCs are distributed evenly and randomly. UEs are also uniformly placed within the coverage areas of the MCs. It is worth mentioning that we have only considered users within one MC for thorough investigation. The mobility of the UEs is characterized by two parameters: the direction and speed of the UEs. The UEs move in parallel to each other, following the directions determined by their initial positions. During the simulation, UEs positioned on the positive x-axis move to the left, whereas those on the negative x-axis move to the right. This is because the simulation steps are not limited by the size of the simulation environment.
3.2. Fuzzy Logic Controller (FLC)
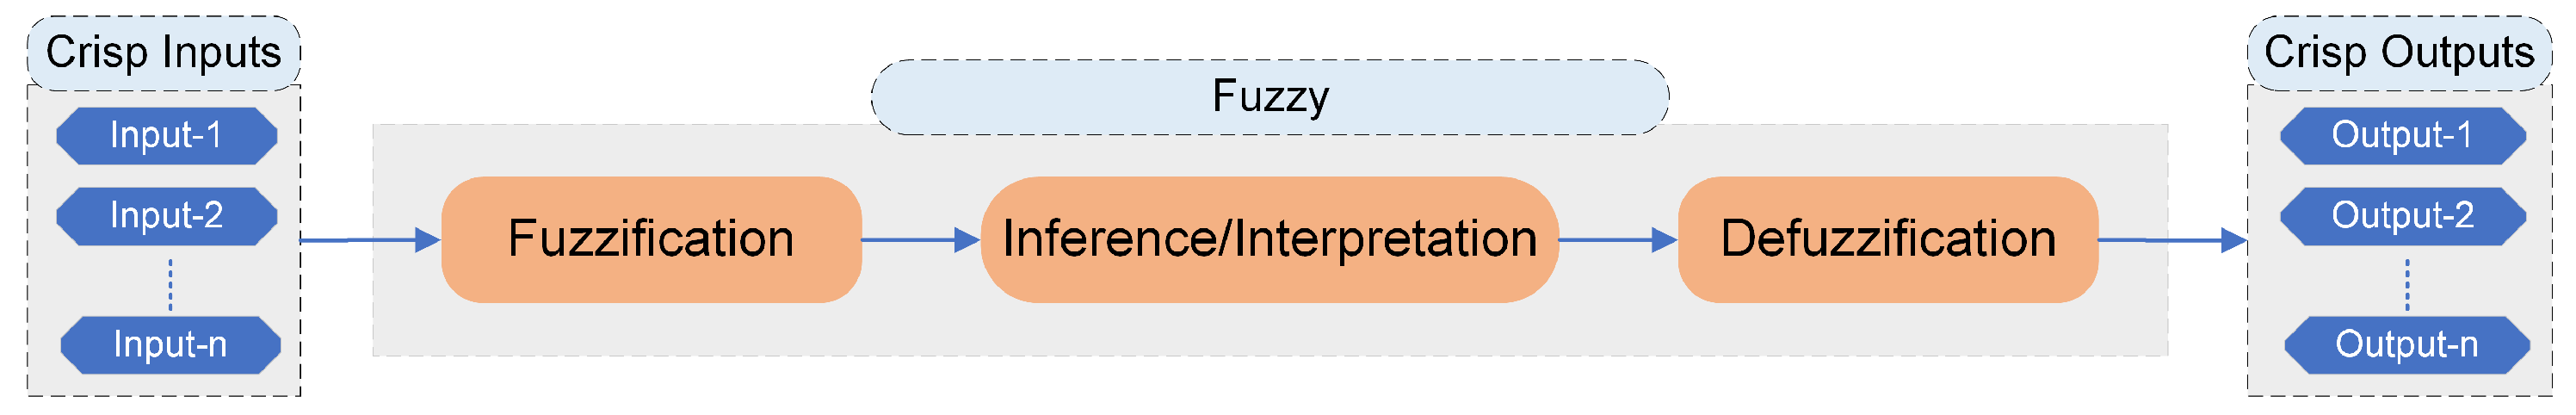
FLCs made their debut in 1965, thanks to Professor Lotfi Zadeh [26]. FLC techniques involve breaking down complex systems into manageable subsystems using human expert knowledge. Each subsystem is controlled by simple laws that imitate human strategies. By combining these local control actions through fuzzy membership functions (MFs), a comprehensive control law is created. This approach replaces complex mathematical models with simple (If–Then) conditional statements and linguistic variables, providing a practical way of analyzing and synthesizing. FLCs are based on rationality and use approximations instead of precise values. FLCs are well suited for processes that involve multiple variables and inconsistencies, where obtaining exact measurements is difficult. FLCs can have either one or multiple inputs and outputs, depending on the specific application. FLCs operate within specific information ranges, using a rule base derived from past data to infer appropriate actions and outcomes. Figure 2 illustrates the general FLC diagram, which comprises three blocks or stages.
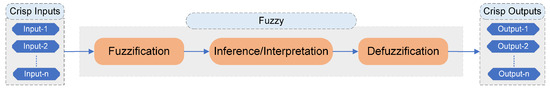
Figure 2.
FLC basic structure.
The function of each block inside the fuzzy structure is described as follows:
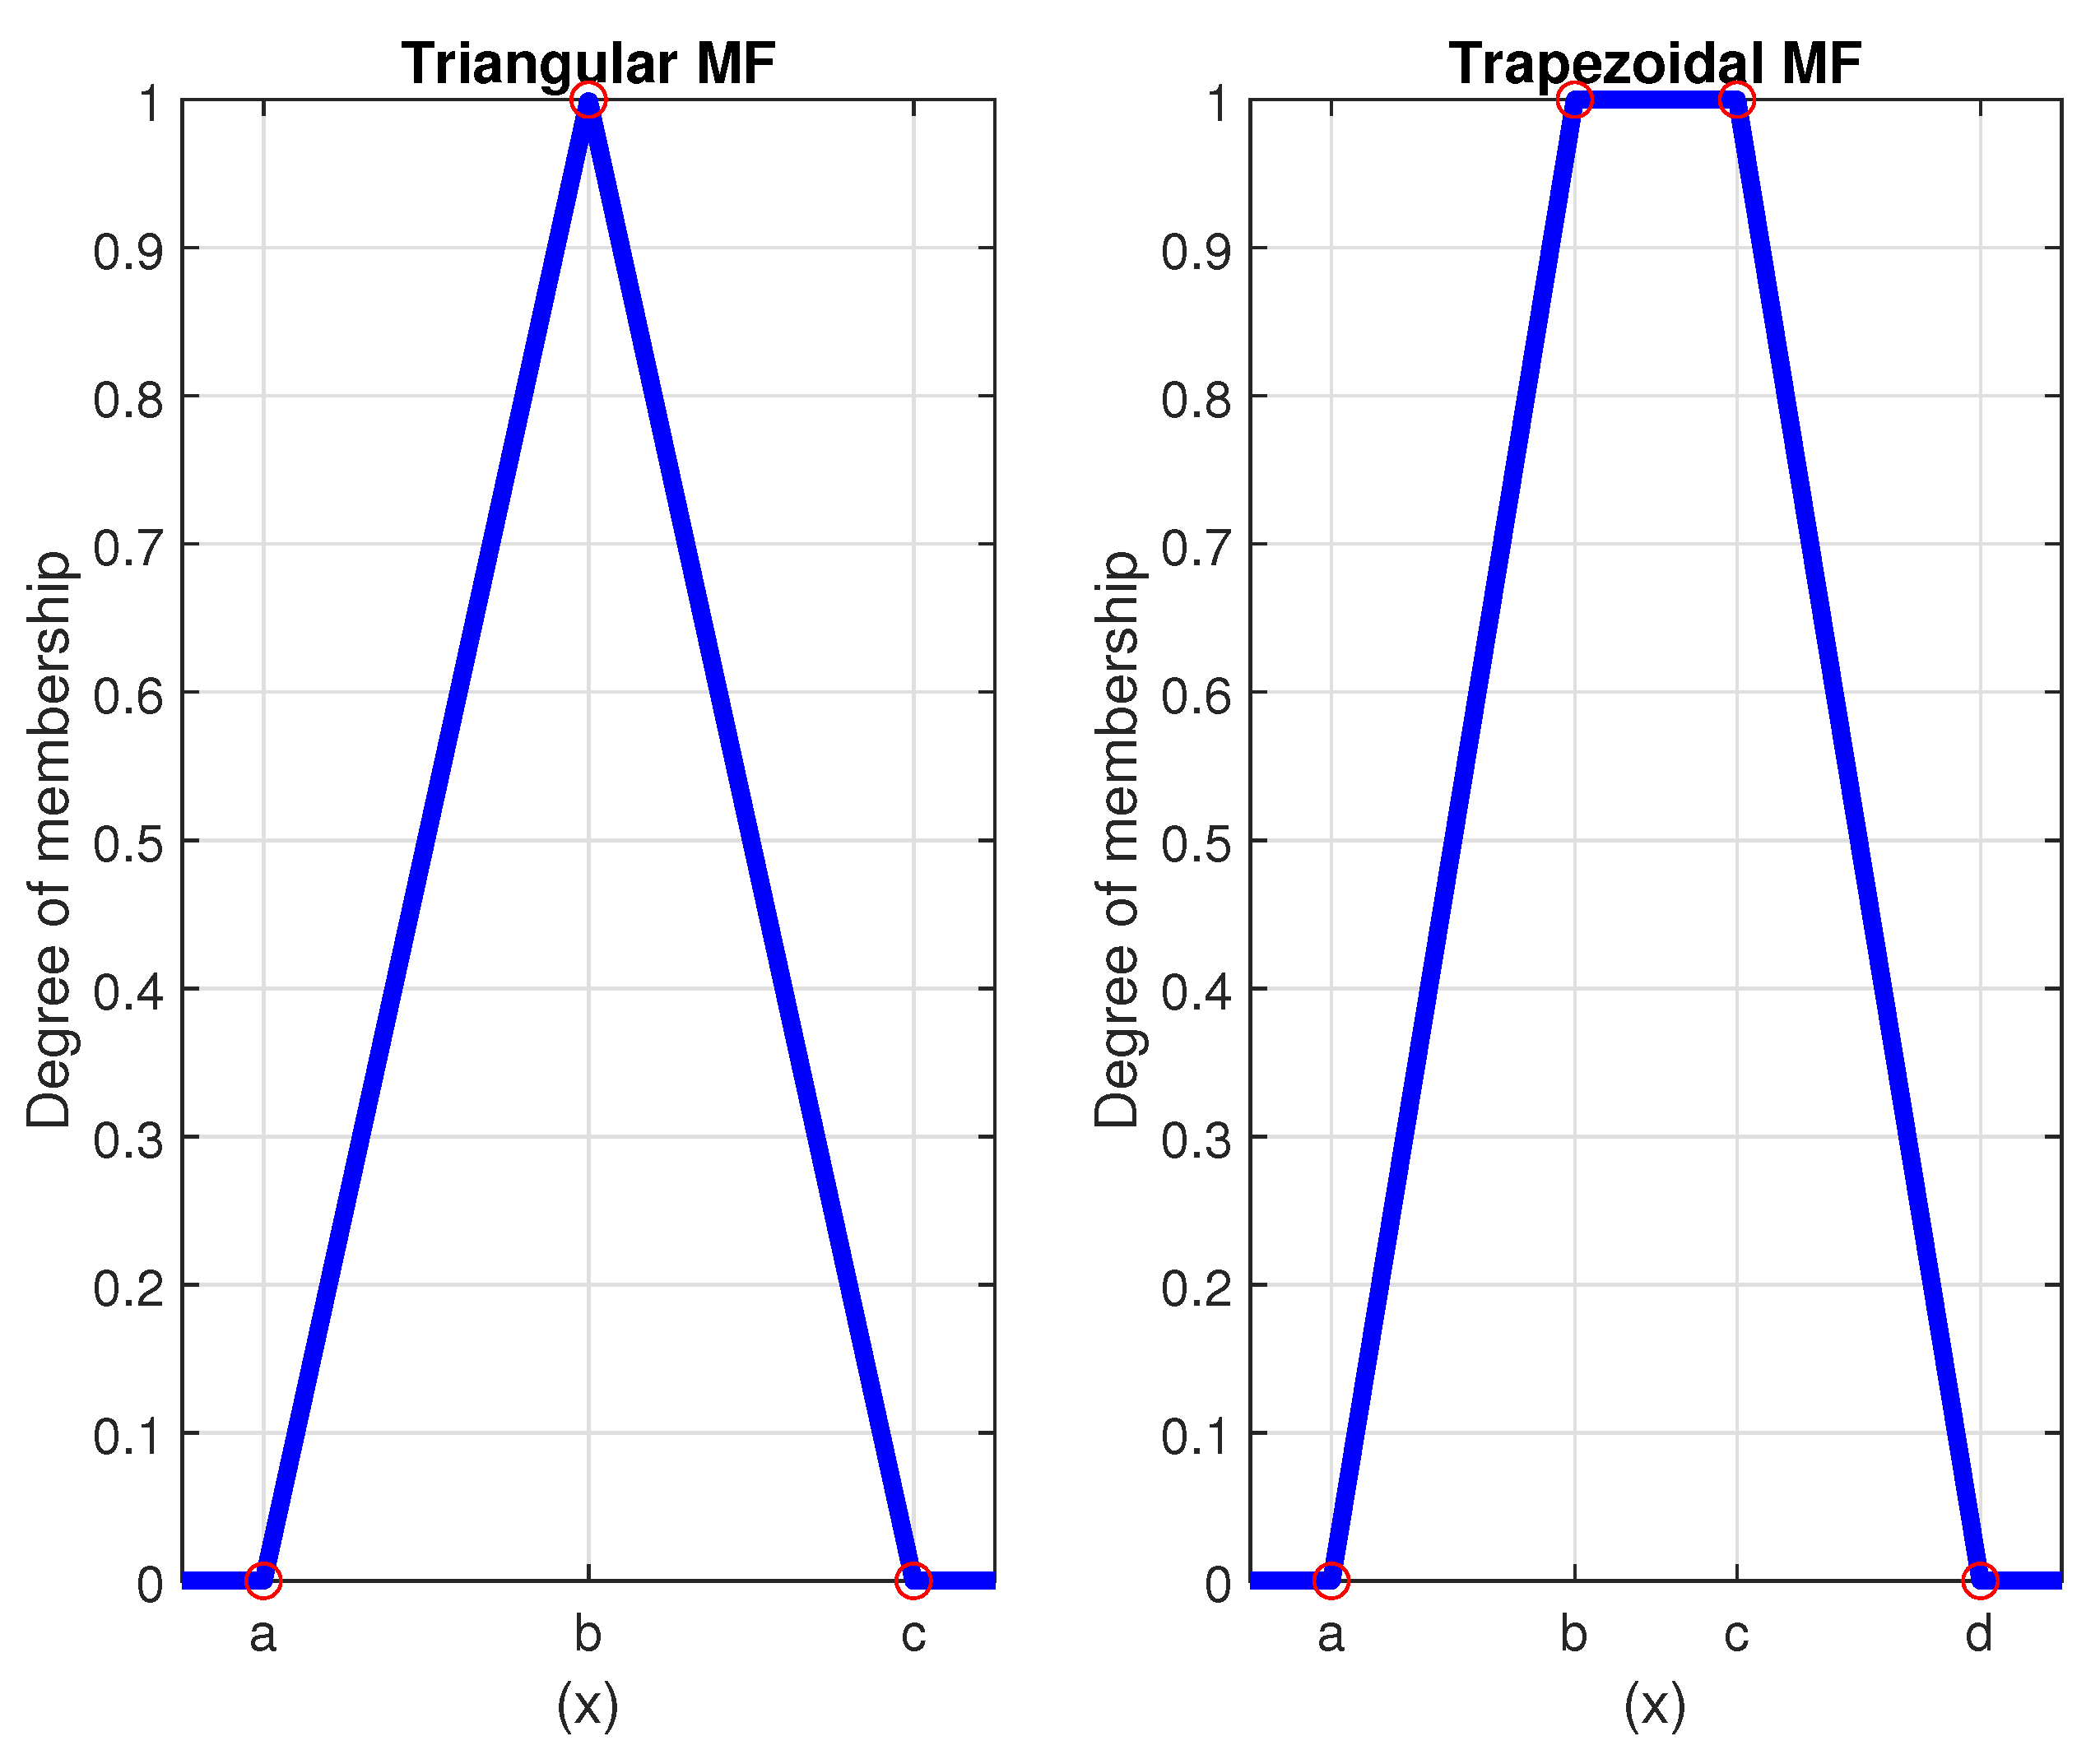
- During the Fuzzification stage, inputs are received, marking the beginning of the fuzzification process. Fuzzification involves converting imprecise input data into fuzzy values. This relates to a domain characterized by MFs. These functions can be in the form of a triangle, trapezoid, or Gaussian. In more complex systems, multiple MFs can be combined, and the choice depends on the specific requirements of the system. The triangular MF is the most commonly used option due to its simplicity, though its effectiveness may vary by implementation. The selection of MF shape is problem-specific, but extensive literature reviews indicate the triangular MF is generally more effective than other MFs [27]. If there is no preference for the shape of MFs, triangular or trapezoidal shapes are recommended for their simplicity and computational efficiency. To maximize performance, a design optimization process is often necessary, where the adjustable parameters of the fuzzy system are tuned to meet a specific performance criterion. The triangular and trapezoidal MFs are defined concisely using the following compact expressions and are visually depicted in Figure 3.
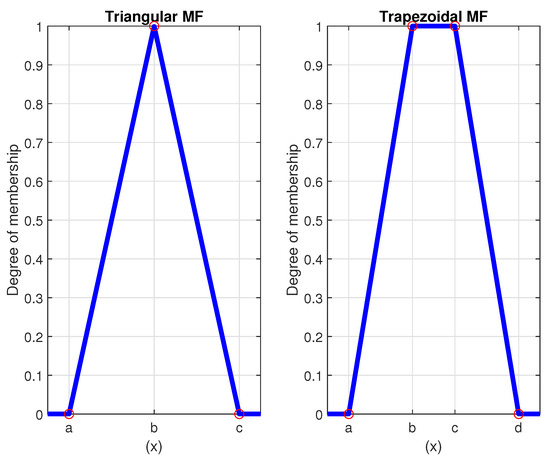 Figure 3. Triangular and trapezoidal MFs, with red circles indicating key transition points a, b, c, and d, to highlight significant changes in the functions for clear visualization.
In this work, a triangular MF is used mostly for the input and output parameters, while a trapezoidal MF is applied to specific cases requiring greater flexibility. This choice is driven by the simplicity and computational efficiency of triangular and trapezoidal shapes.
- In the inference/interpretation stage, rules are created using linguistic variables derived from system performance and experience. The interpreter is then used to make decisions based on the given input and the established rule base. There are two main categories of fuzzy inference systems (FIS): Mamdani-type FIS and Sugeno-type FIS, also referred to as Takagi–Sugeno–Kang fuzzy inference. The Mamdani and Sugeno FISs designed for a specific system have an equal number of input and output MFs. Their rules are also aligned, but the main difference lies in how they process fuzzy output through defuzzification. The primary distinction between the Mamdani and Sugeno FISs is their approach to generating precise output from fuzzy inputs. Prominent Mamdani defuzzification methods, such as the smallest of maxima (SoM), largest of maxima (LoM), and mean of maxima (MoM), stem from variations in the max criterion. These methods determine the smallest, largest, or mean output value on the basis of inputs whose membership values reach their maximum. Mamdani systems are commonly used in expert system applications because they benefit from their intuitive and easily understandable rule bases, which are often described on the basis of insights from human experts. In contrast, the Sugeno FIS uses a weighted average approach instead of the complex iterative process used in Mamdani systems. Unlike the Mamdani FIS, the Sugeno FIS does not include an output MF. Instead, it uses singleton output MFs that are either constant or linear functions of input values. This makes the Sugeno FIS less computationally complex than the Mamdani FIS. However, the interpretability and expressive capabilities of the Mamdani FIS are compromised in the Sugeno FIS because of its non-fuzzy rule consequents. As a result, the output is represented as a constant value rather than a fuzzy set during rule evaluation [28,29,30]. Ultimately, the choice between the Mamdani and Sugeno FIS depends on carefully weighing the advantages and limitations. This prompts the system designer to select an option that best suits the specific system requirements.
- During the Defuzzification stage, the decision of the inference block is converted into numerical values. This block serves as a bridge between the controller and the actual system, providing accurate values for further processing [31].
3.3. Proposed System and Algorithm
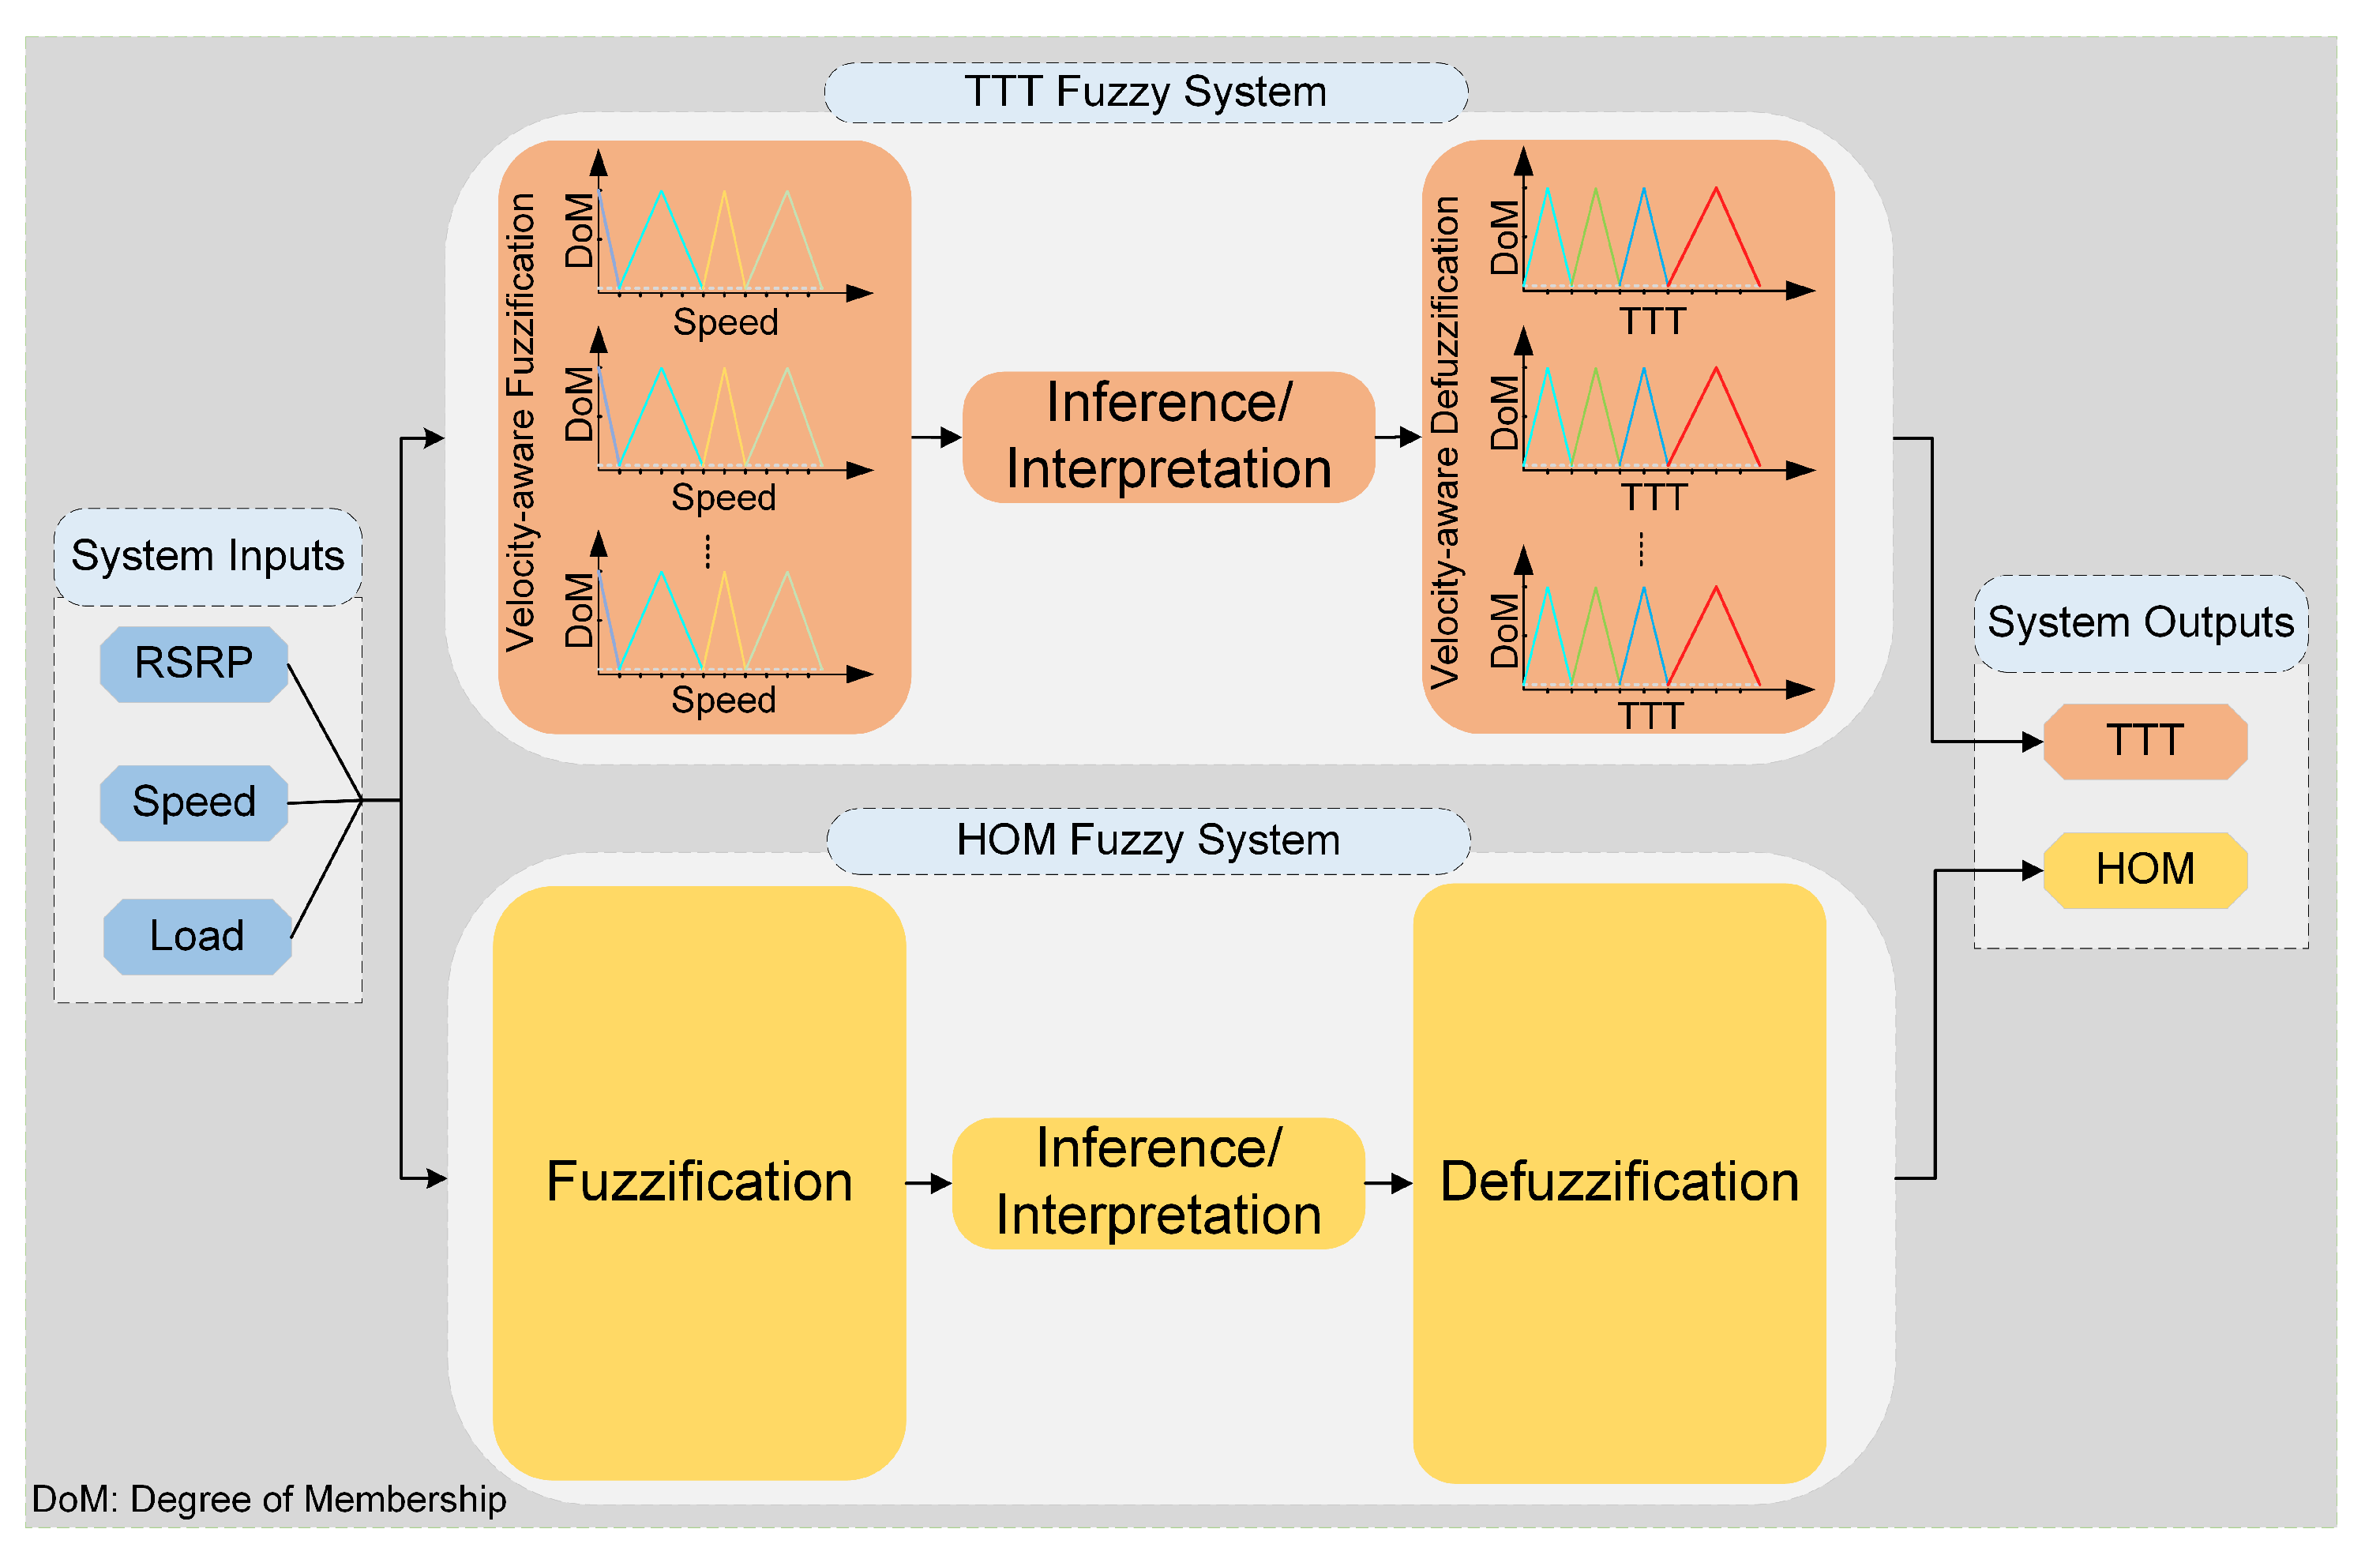
We proposed a system that uses FLC, as shown in Figure 4. The proposed system consists of two segments: one segment focuses on adjusting the TTT based on velocity awareness, while the other segment dynamically regulates the HOM. Afterwards, the system outputs are incorporated into the developed algorithm to improve the HO decision process, thereby enhancing the overall system performance.
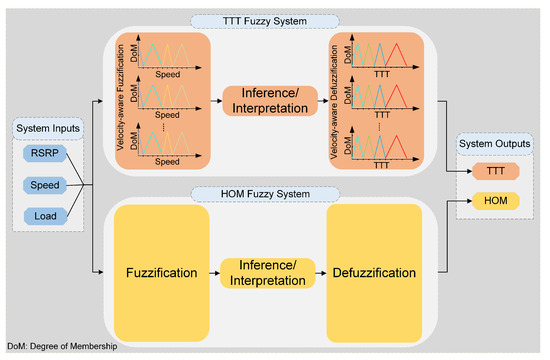
Figure 4.
Proposed velocity-aware FLC-based system.
In the proposed system, FLC incorporates three inputs: RSRP and cell load, both with a trinary classification, and UE speed segmented into four distinct levels. This configuration creates 36 rules that govern the system. These rules partially follow the structure outlined in Table 1 and use triangular and trapezoidal functions, as described in Equations (1) and (2). The classification of inputs into different categories was carefully considered in terms of accuracy and processing time. It is crucial to note that the number of levels directly affects the processing time and complexity of the system.

Table 1.
Membership principles for FLC inputs.
RSRP is defined by 3GPP in LTE/LTE-A to illustrate received signal strength (RSS). This parameter plays a crucial role in measuring the performance of a mobile wireless network during UE mobility due to the rapid fluctuation of the RSRP level. Furthermore, the system’s performance is significantly influenced by RSRP, with a higher level helping to reduce the probability of system outage. The speed of the UE directly affects the adjustment of HCPs values. UEs with slower speeds tend to stay in a cell for longer periods, benefiting from better signal quality. As a result, they transition between cell boundaries more smoothly, leading to fewer handovers within a given time frame compared with UEs that move faster. Slower-moving UEs usually require higher HCP settings to account for their shorter travel distances unless they experience early HOs. On the other hand, UEs with higher speeds require lower HCPs settings to avoid late HOs. In our proposed system, we have included the cell’s traffic load as an input parameter. The cell load has a significant impact on the HO process when a user moves from one cell to another. If the target cell is heavily loaded, the user may experience service failure, which can negatively affect the overall system QoS. In this study, we considered the loads of both static and moving users as factors that influence the cell load. UEs regularly monitor both their current cell and neighboring cells in the network by measuring the downlink RSRP. These measurement reports are then sent by the UEs to their serving cells. When certain predefined network configuration conditions are satisfied, the serving cell takes action on the basis of the corresponding report, which indicates the triggering event. In our proposed algorithm, we implement the A3 event condition as defined by 3 GPP [32]. The A3 event is triggered when a neighboring cell has a signal quality offset that is better than that of the serving cell. When this condition is met and persists for a specific duration known as TTT, HO is initiated.
where and are the RSRPs of the current serving cell and the target cell, respectively.
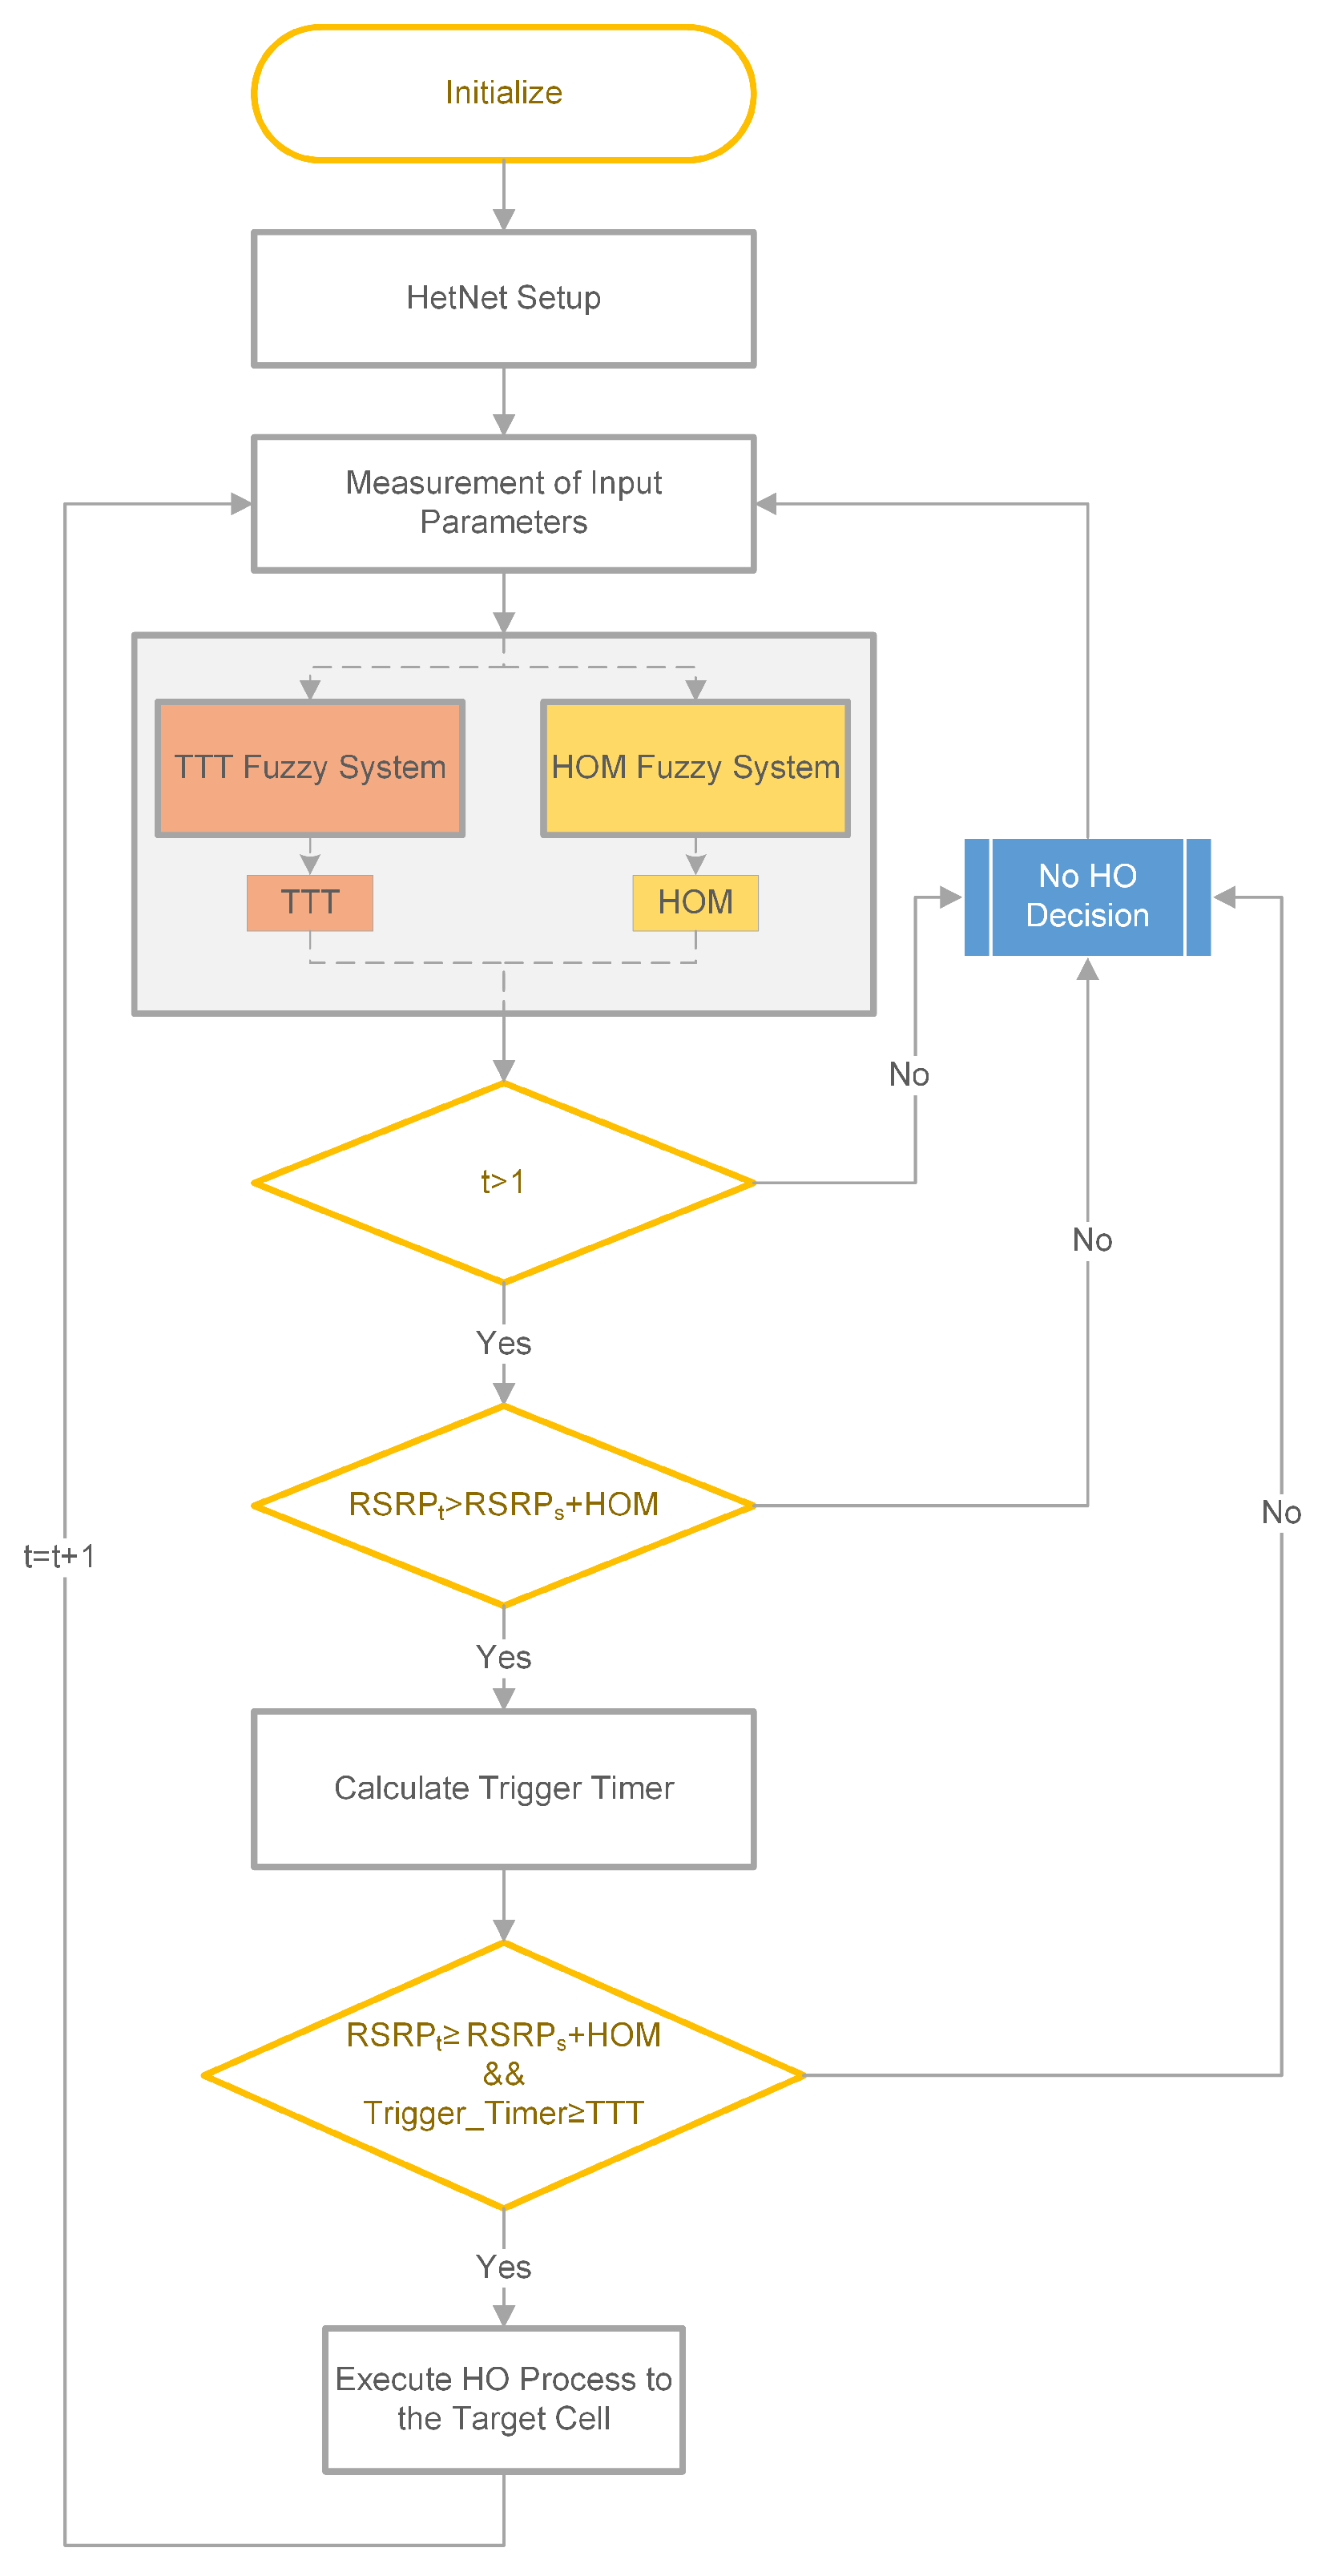
Based on the proposed system, we developed an algorithm that optimizes the HO process by adjusting the TTT and HOM for each UE, as depicted in Figure 5. This algorithm mitigates HOPP, RLF, HOR, and HOF effects on the network, thereby improving the overall QoS.
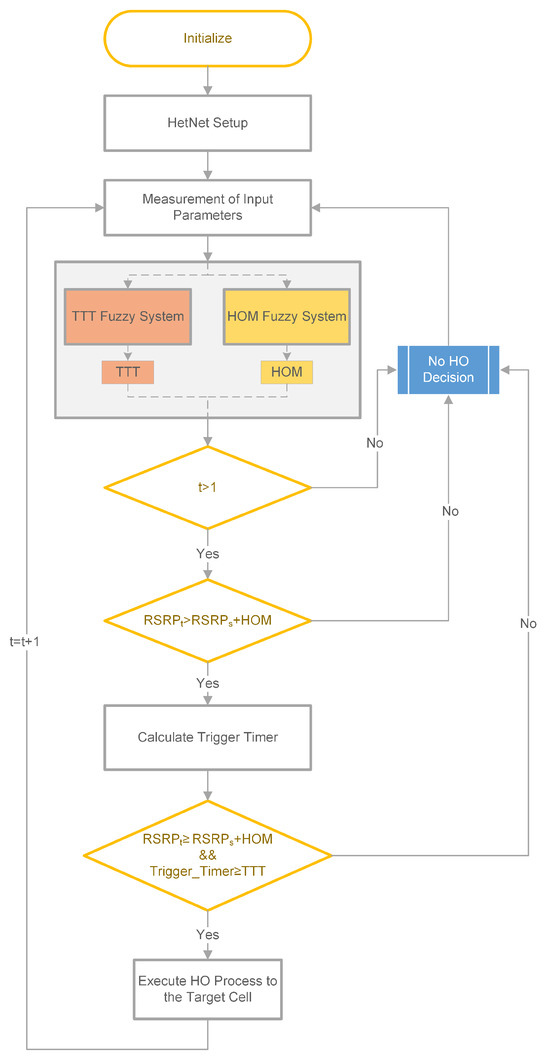
Figure 5.
Flowchart for the proposed algorithm.
In Figure 5, a trigger timer is used to manage the HO process, preventing it from occurring within the same cell, whether in MC or SC. The calculation of the trigger timer is detailed in Algorithm 1.
| Algorithm 1 Pseudocode for calculating trigger timer. |
|
In Algorithm 1, a timer is applied as a counter that is initiated upon meeting the condition stated in Equation (3). The timer increments only after the initiation of the HO decision, and the cell ID of the target cell (cell_IDt) must be different from that of the previous simulation time; otherwise, the timer is set to zero. The maximum timer value for a user can be calculated as Equation (4):
where MP is the measurement periodicity for each simulation cycle, within which the measurements are made, and it is set to 40 ms.
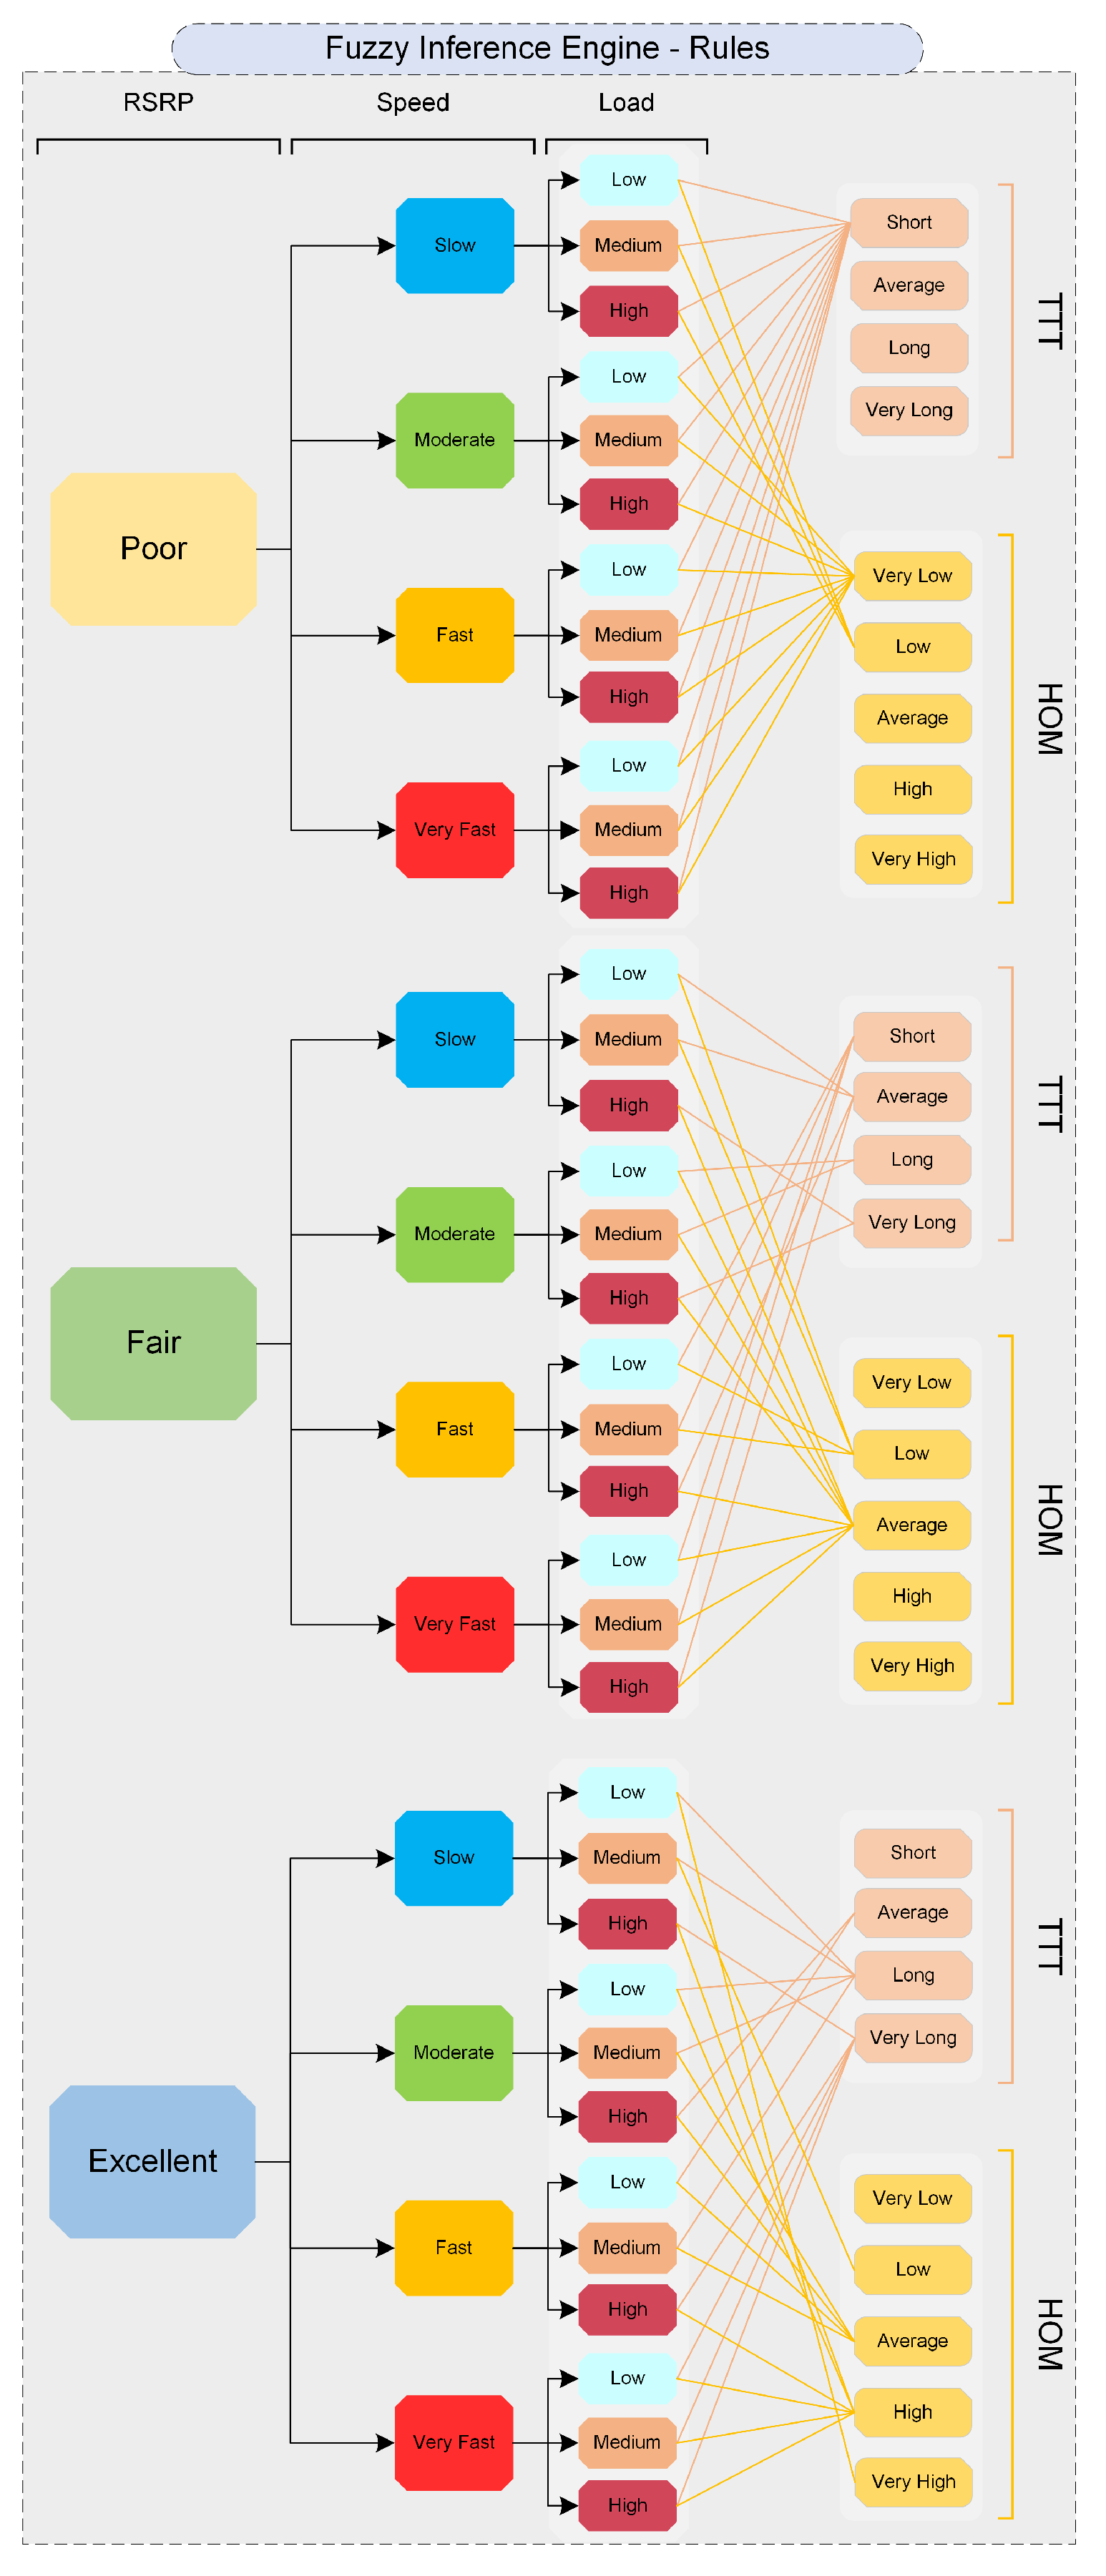
The rules that govern the FLC outputs for TTT and HOM are illustrated in Figure 6. This decision is based on our expertise and is consistent with the implementation of the Mamdani FIS for estimating system outputs. Our expertise has been developed through an iterative process, involving the adjustment of different TTT and HOM values in relation to varying input parameters, such as UE speed, RSRP, and cell load, to achieve the minimum RLF and HOPP values. These parameters significantly impact system performance and are considered essential metrics for TTT and HOM adjustments.
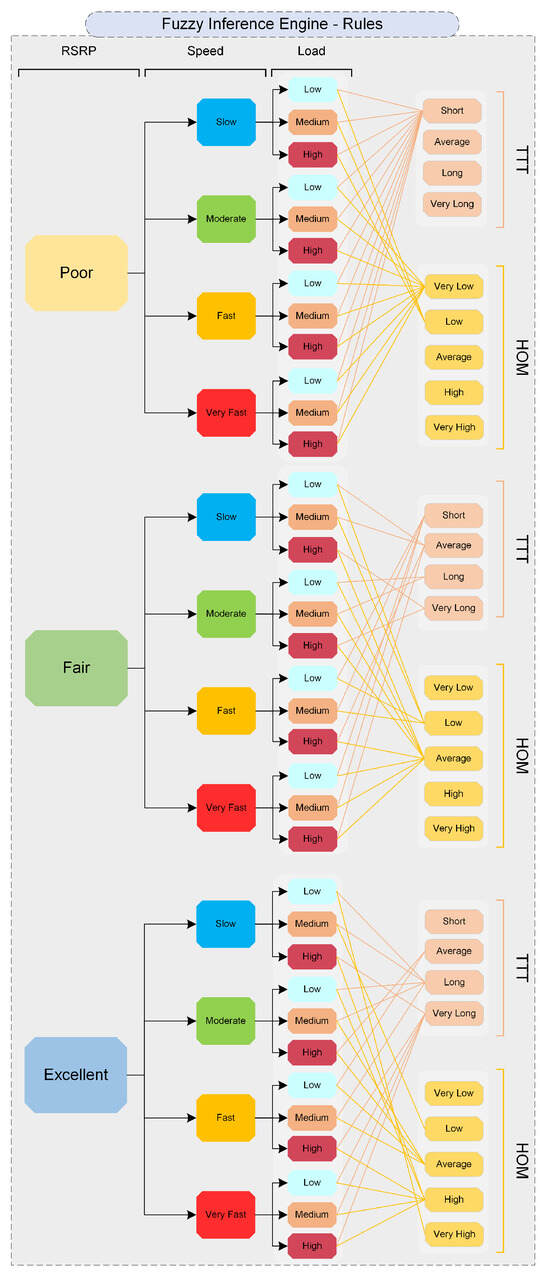
Figure 6.
Rules governing TTT and HOM.
Considering all input parameters for setting the TTT and HOM is crucial. Relying on a single input parameter (e.g., RSRP) is insufficient for setting HCPs (e.g., TTT or HOM). For example, if the serving cell requests an HO and the TTT is set based on the target cell’s excellent RSRP levels, the TTT duration should be set very long. However, if the UE speed is high under the same conditions, this could lead to an RLF due to a late HO. Conversely, if TTT is set based on slow UE speed, it should also be set very long. In this case, if the RSRP is poor, it will cause RLF too. The same principle applies to the combination of UE speed with RSRP and cell load, as well as to the setting of the HOM.
Setting the rules in FLC is based on the defined ranges of specific input parameters. For instance, the combination of UE speed, RSRP, and RSRQ in [19] generates different rules to output TTT and HOM. The effect of each input parameter on any output parameter is distinctive; for example, RSRQ may impact TTT variation differently than cell load.
The number of rules is directly proportional to the number of distinct ranges of the input parameters. A combination of three input parameters with three distinct degrees each will create a total of 27 rules, whereas considering two input parameters with three distinct degrees and one with four distinct degrees will create a total of 36 rules. Additionally, the TTT and HOM ranges are related to the maximum and minimum ranges of the input parameters, which will also impact system performance due to limitations in those parameters. For instance, in [25], the maximum UE speed is considered to be 72 km/h, which impacts the TTT and HOM ranges considered in the ranges of 0 to 200 ms and 0 to 5 dB, respectively. The proposed algorithm in this work will not be efficient for UE speeds greater than 72 km/h.
Therefore, prior knowledge of system performance behavior, considering the effects of all input parameters on TTT and HOM, is required when applying a technique like FLC. A static setting of TTT and HOM may lead to unacceptable increases or decreases in RLF and HOPP occurrences. Thus, it is crucial to mitigate both RLF and HOPP occurrences while ensuring a balanced approach that maintains acceptable thresholds.
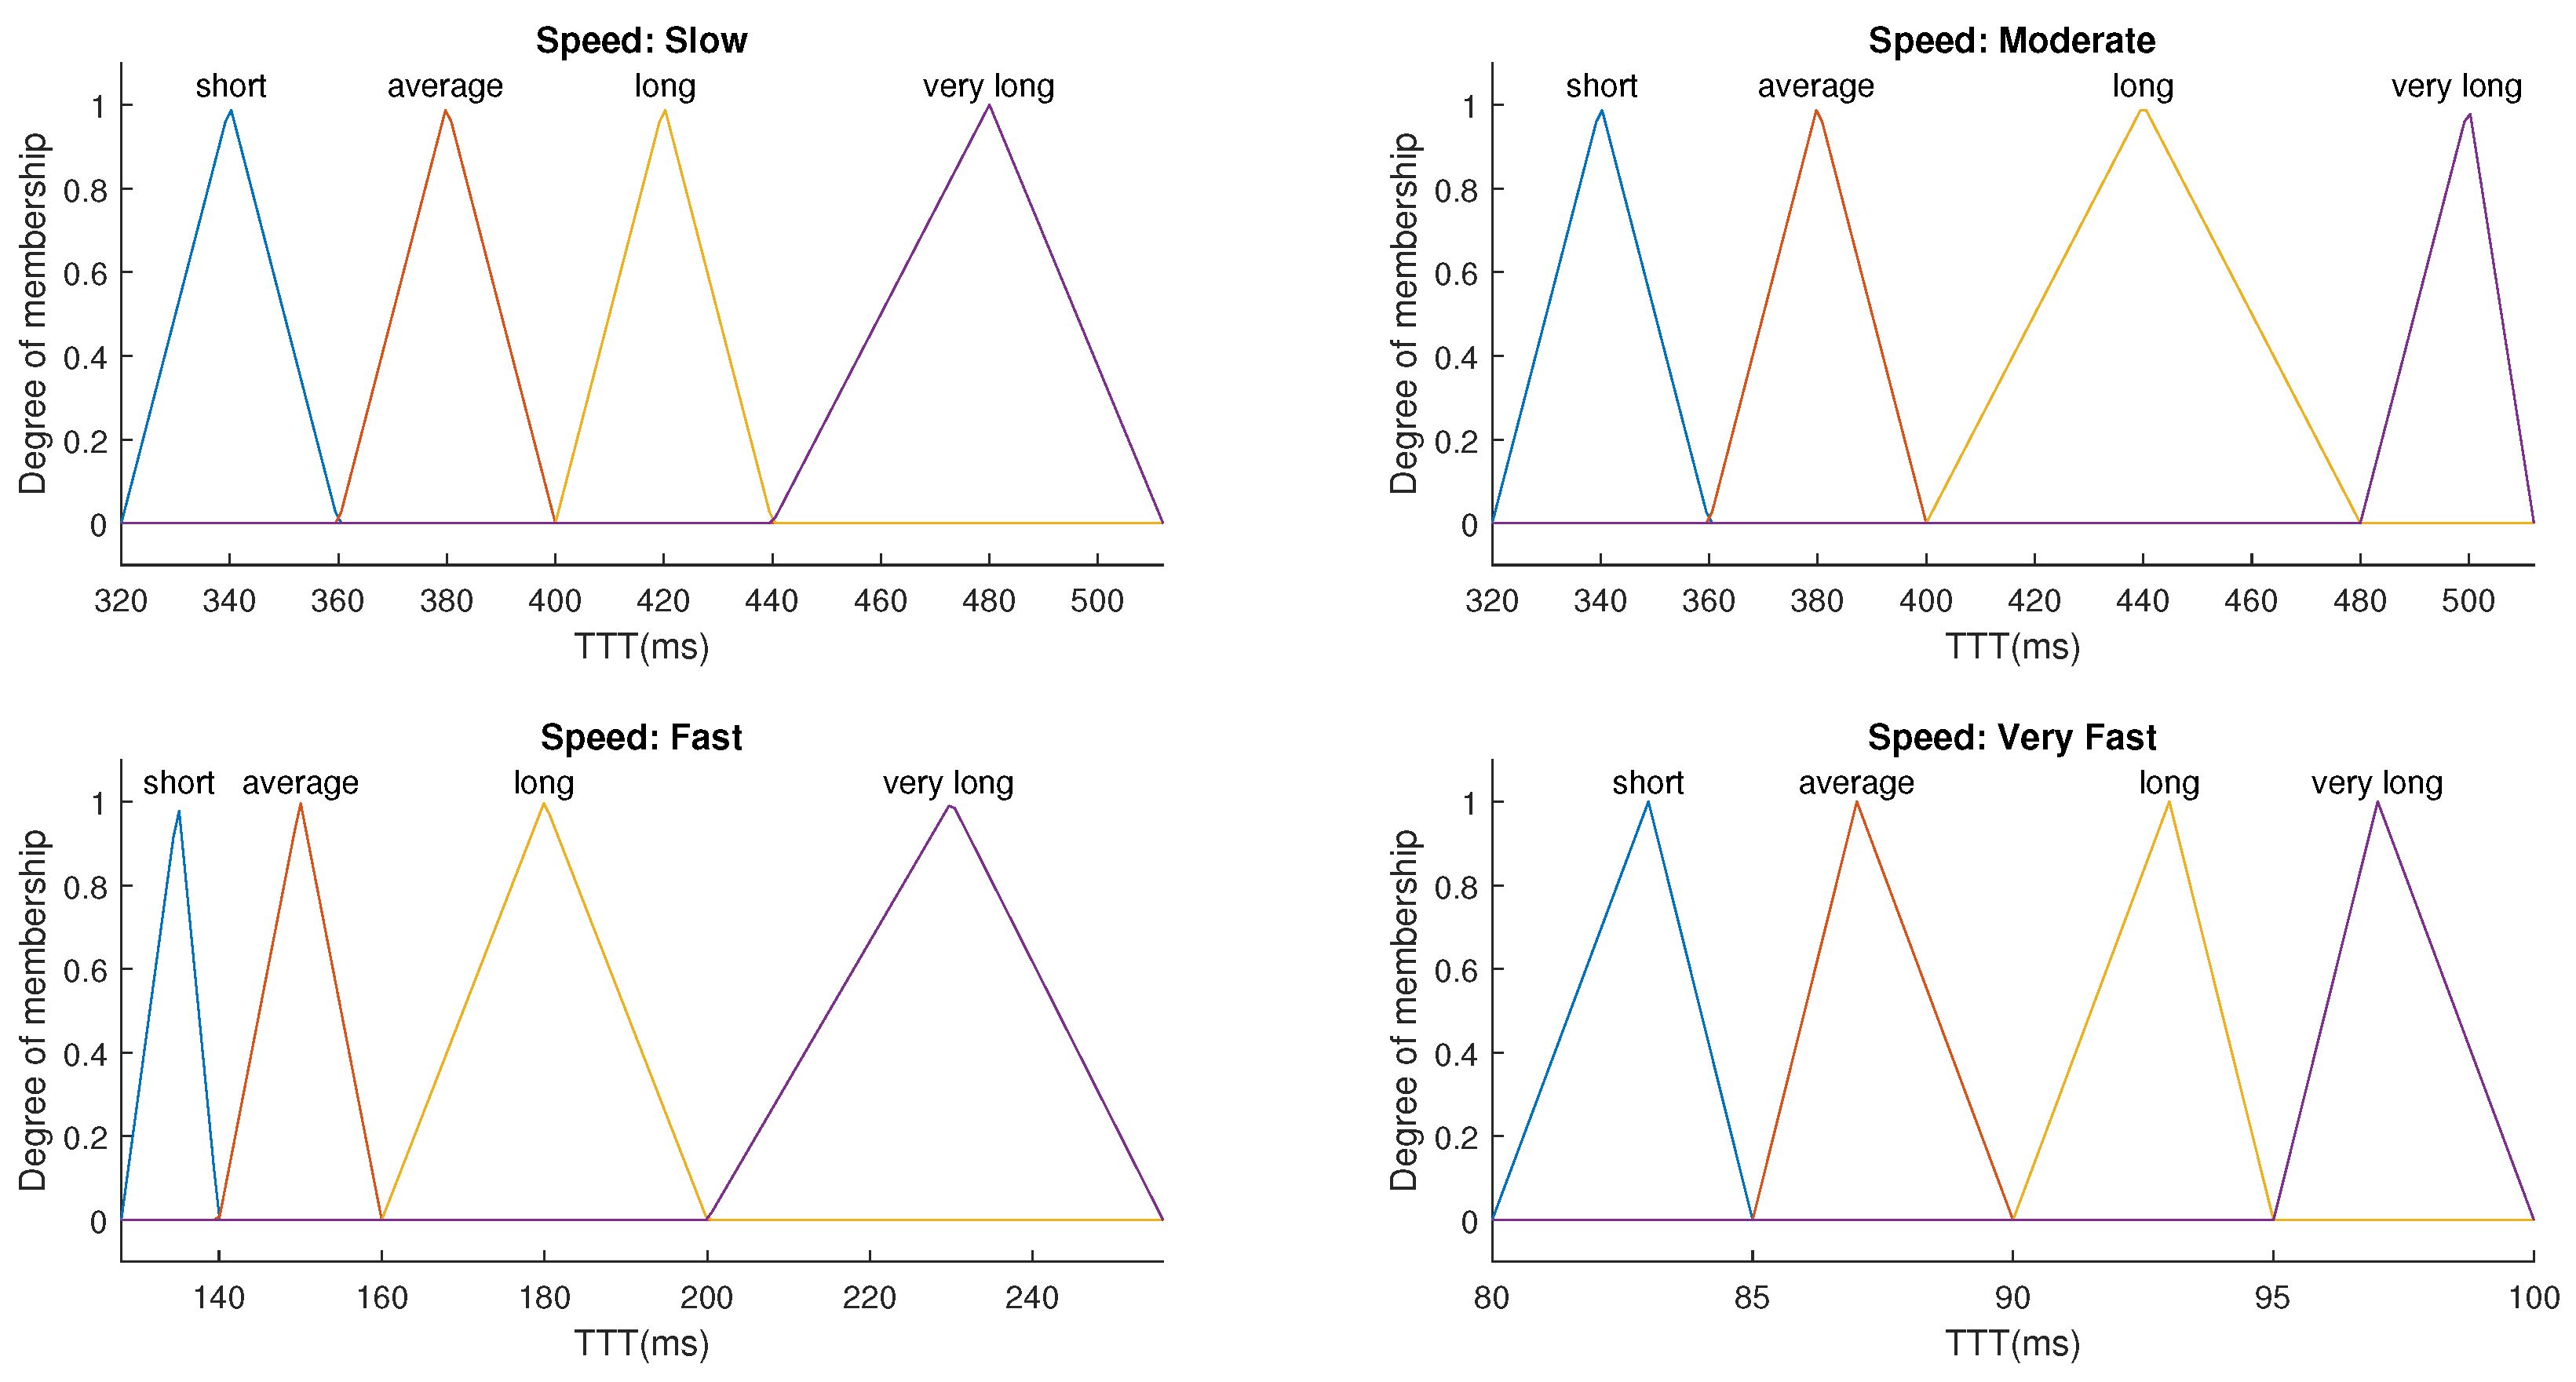
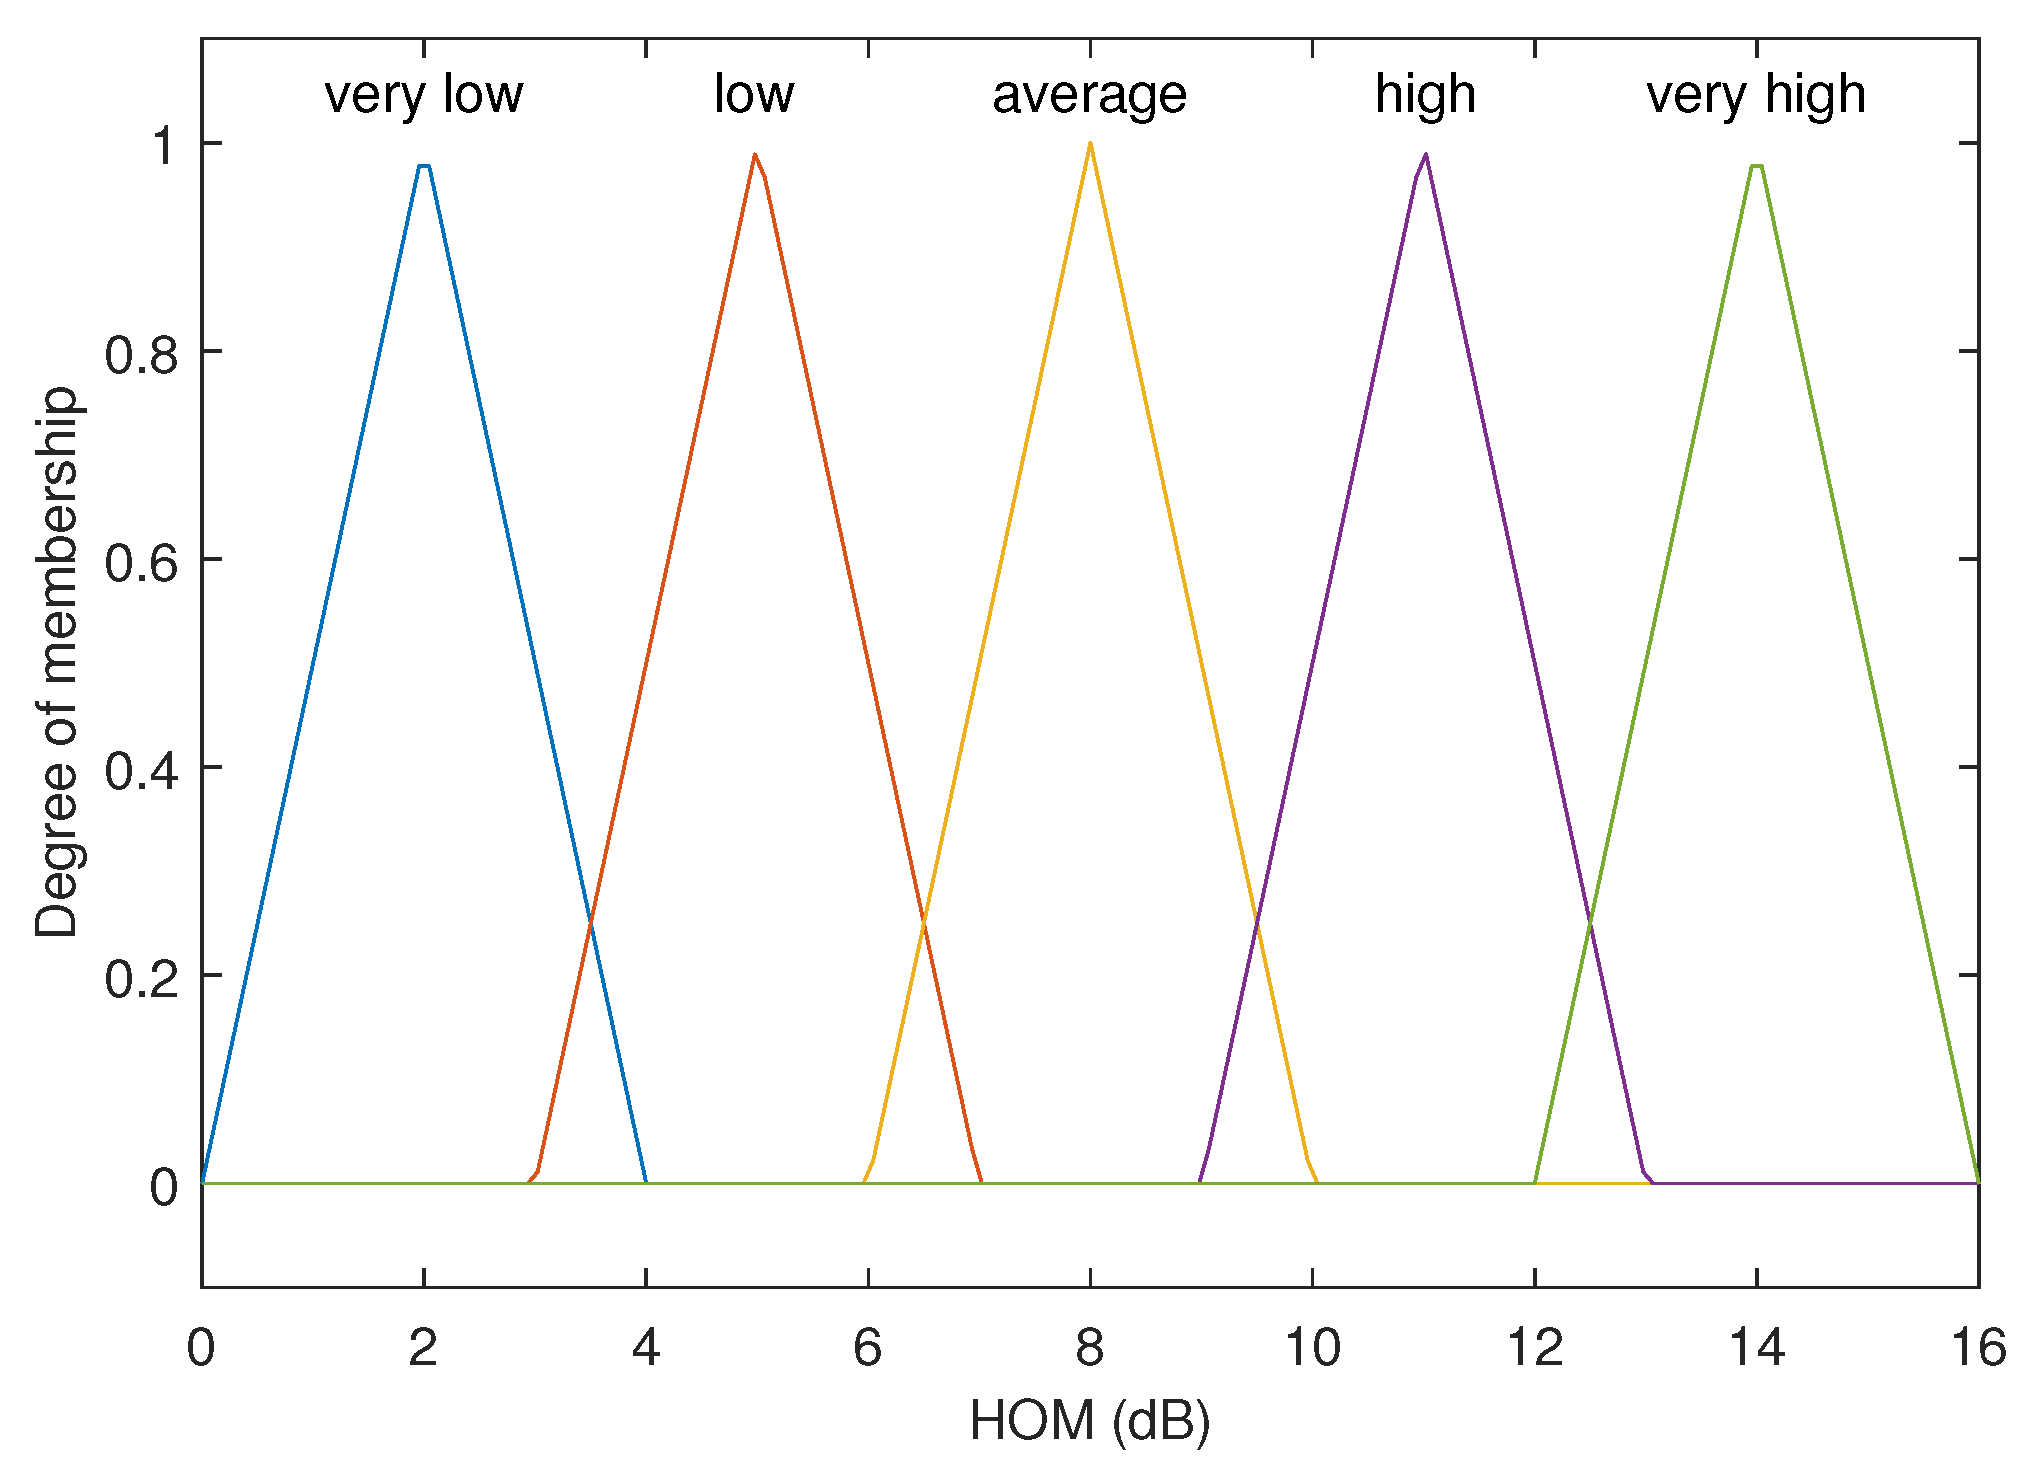
The TTT and HOM MFs are depicted in Figure 7 and Figure 8, respectively. TTT MFs are defined individually for each speed set (degree), whereas the HOM MF is defined as a general status across all speed scenarios within the system. Figure 7 depicts the TTT range for each speed set, with varying illustrations. Overall, the crisp value falls within the range of 80 to 512 ms. Furthermore, Figure 8 illustrates the HOM crisp values ranging between 0 and 16 dB.
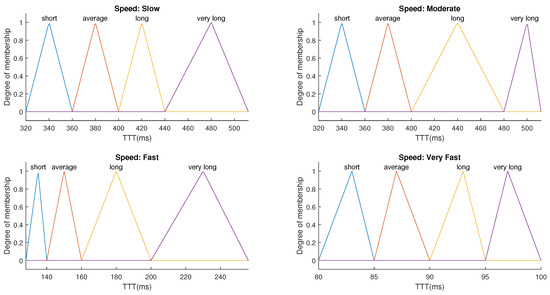
Figure 7.
TTT MFs for different speed sets.
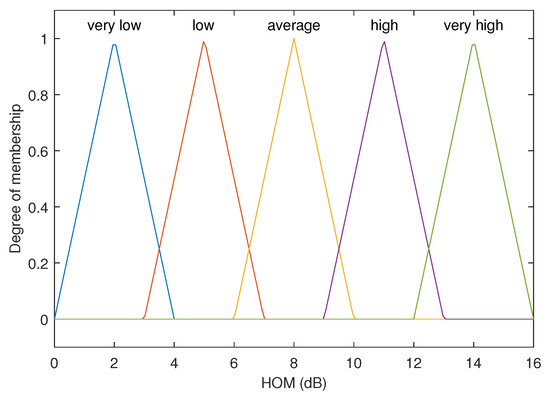
Figure 8.
HOM MF for all speed scenarios.
4. Performance Evaluation
The performance of the proposed algorithm, called velocity-aware fuzzy logic-based HO optimization algorithm (VAFL), was assessed through the use of KPIs, including HOR, HOF, HOPP, and RLF. It has been compared with a conventional A3 event, an FLC-based HO scheme called FLDHDT that dynamically adjusts the values of both HOM and TTT [25], and another competitive method called the individualistic dynamic handover parameter optimization algorithm based on an automatic weight function (IDHPO-AWF) [15]. The comparison methods are labeled as A3, FLD, and AWF in the results. The simulation parameters are listed in Table 2, with values carefully selected based on established standards, reputable literature, and findings from esteemed published papers [33,34,35,36].
Table 2.
Simulation parameters for LTE-A and 5G.
4.1. Handover Rate (HOR)
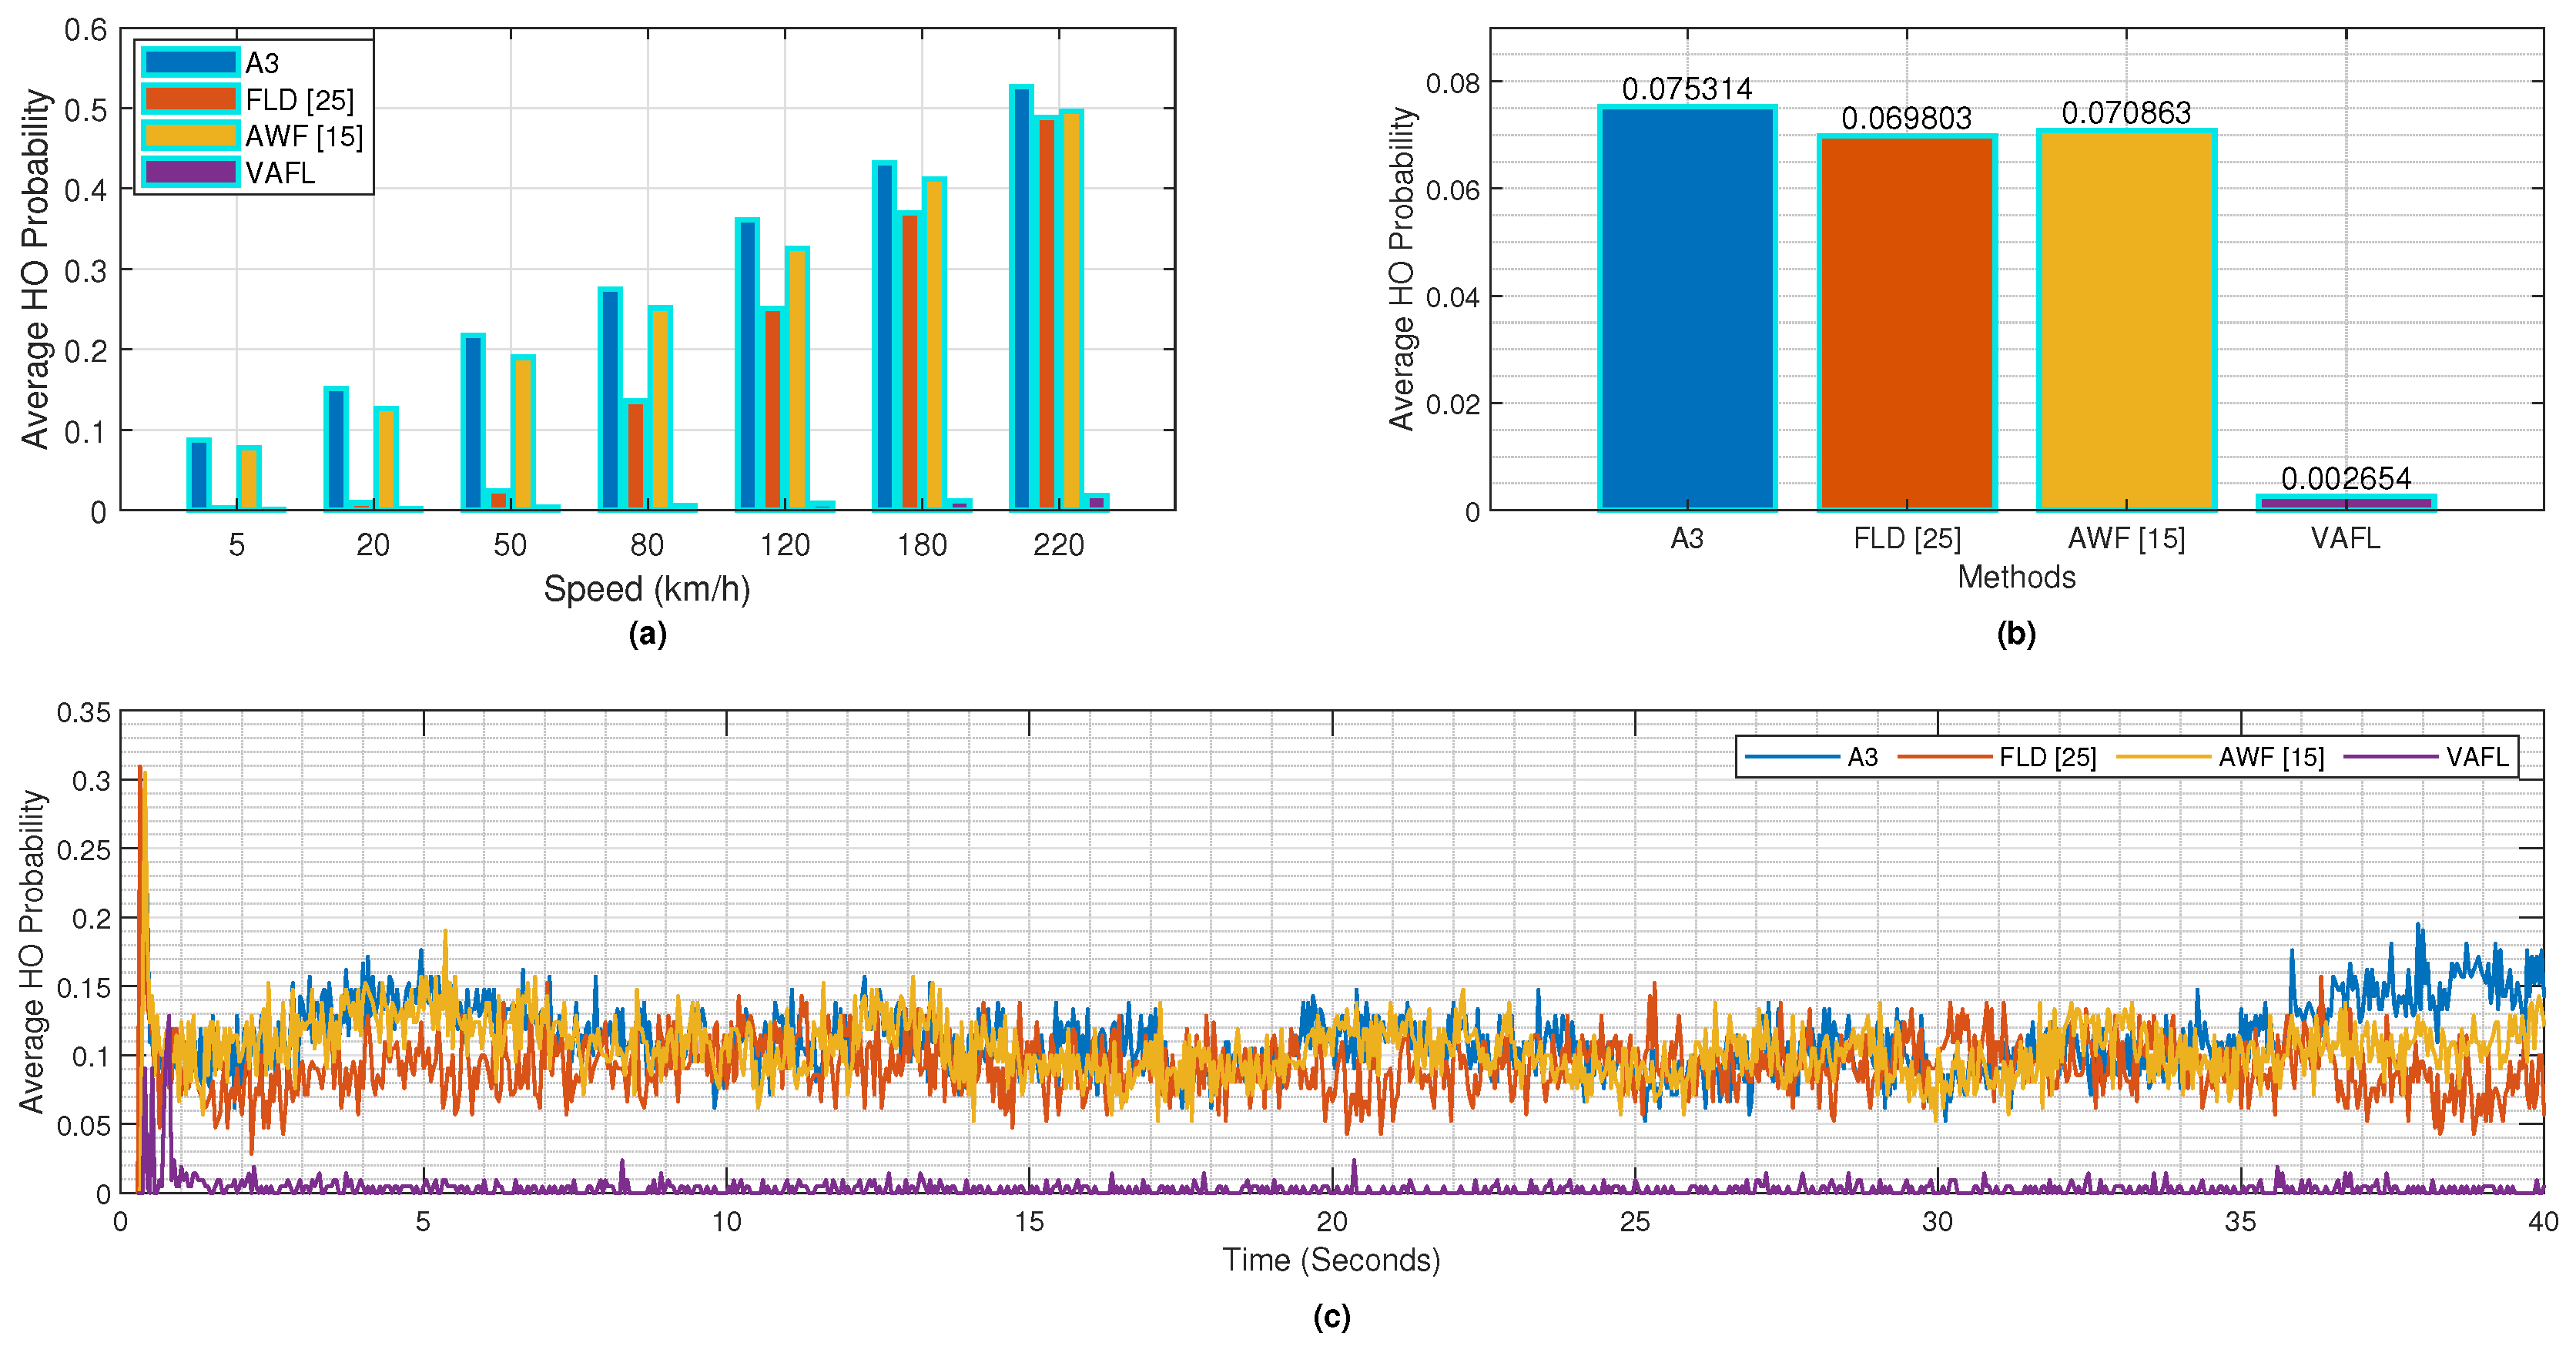
HOR is used to describe the number of HOs that can occur when a user moves within the network. This metric is also known as the HO probability. Figure 9 illustrates the average HOR versus different aspects: (a) speed, (b) overall the system, and (c) simulation time.

Figure 9.
Average HOR (a) overall UEs versus UE speeds, (b) overall system, and (c) simulation time.
As shown in Figure 9a, as the UE speeds increase, the HOR also increases. This is mainly due to the UEs moving between multiple cells. Figure 9b shows the average HOR versus the overall system for the proposed method and all the comparing methods. In Figure 9c, the average HOR for all UEs is depicted over simulation time. The initial peak in this graph is due to an increase in HO requests during the initial phases of network operation. During this period, UEs are switching to cells that provide better cell load and signal quality conditions.
Our proposed method has better performance than other methods under consideration, where it outperforms A3 by approximately 96.47%, surpasses FLD [25] by 96.20%, and exceeds AWF [15] by 96.26%. Overall, our method demonstrated consistent performance across different UE speeds, effectively handling the rising number of HOs associated with higher speeds. This underscores the robustness and flexibility of our approach, crucial for ensuring continuous connectivity and optimal UE experience in dynamic network environments.
4.2. Handover Failure (HOF)
HOF in HetNets can be caused by several factors. These include interference, load imbalances between BSs, coverage issues leading to sudden drops in received power levels, and inadequate mobility management techniques. HOF typically occurs when the UE is unable to establish a connection with the target cell or experiences a connection failure due to any of the above-mentioned factors.
Figure 10a,b depict the average HOF probability for the overall UEs for different UE speeds and the overall system, respectively. The results from all algorithms show a correlation between the probability behavior of HOF and HOR.
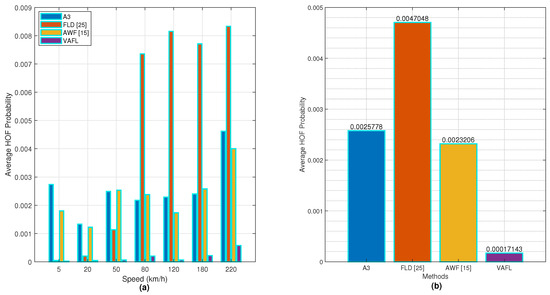
Figure 10.
Average HOF probability: (a) overall UEs versus UE speeds and (b) overall system.
The results in Figure 10a,b reveal that VAFL achieves the lowest HOF probability. As illustrated in Figure 10a, there is a notable increase in the HOF for the FLD [25] method starting at the UE speed of 80 km/h. This sudden rise is attributed to the fact that the maximum UE speed considered in the referenced work is 72 km/h, and the HCPs attributed are not effective for UE speeds exceeding this maximum. When evaluating Figure 10b, VAFL achieves an HOF rate of 0.00017143. In contrast, the other methods have HOF rates of 0.0025778, 0.0047048, and 0.0023206 for A3, FLD [25], and AWF [15], respectively. Our method surpasses A3, FLD [25], and AWF [15] by approximately 93.34%, 96.35%, and 92.61%, respectively, demonstrating its superior performance in reducing occurrences of HOF. The superior performance is attributed to the carefully optimized settings of the HCPs and the development of the algorithm that thoughtfully integrates considerations of signal level and cell load into the HO decision-making process.
4.3. Radio Link Failure (RLF)
RLF is an important metric used to assess network performance. It occurs when an HO is initiated to a target BS, but the downlink SINR of that BS drops below a predetermined threshold within a specified period. HCPs can be configured manually or estimated automatically. However, setting HCPs to their maximum values can cause RLF. This is especially true for UEs located at cell edges or at high mobility speeds, as this can lead to late HO. A high RLF rate can result in network resource wastage and a decrease in overall QoS. Therefore, it is crucial to configure optimal HCPs to reduce the RLF rate and prevent network resource wastage.
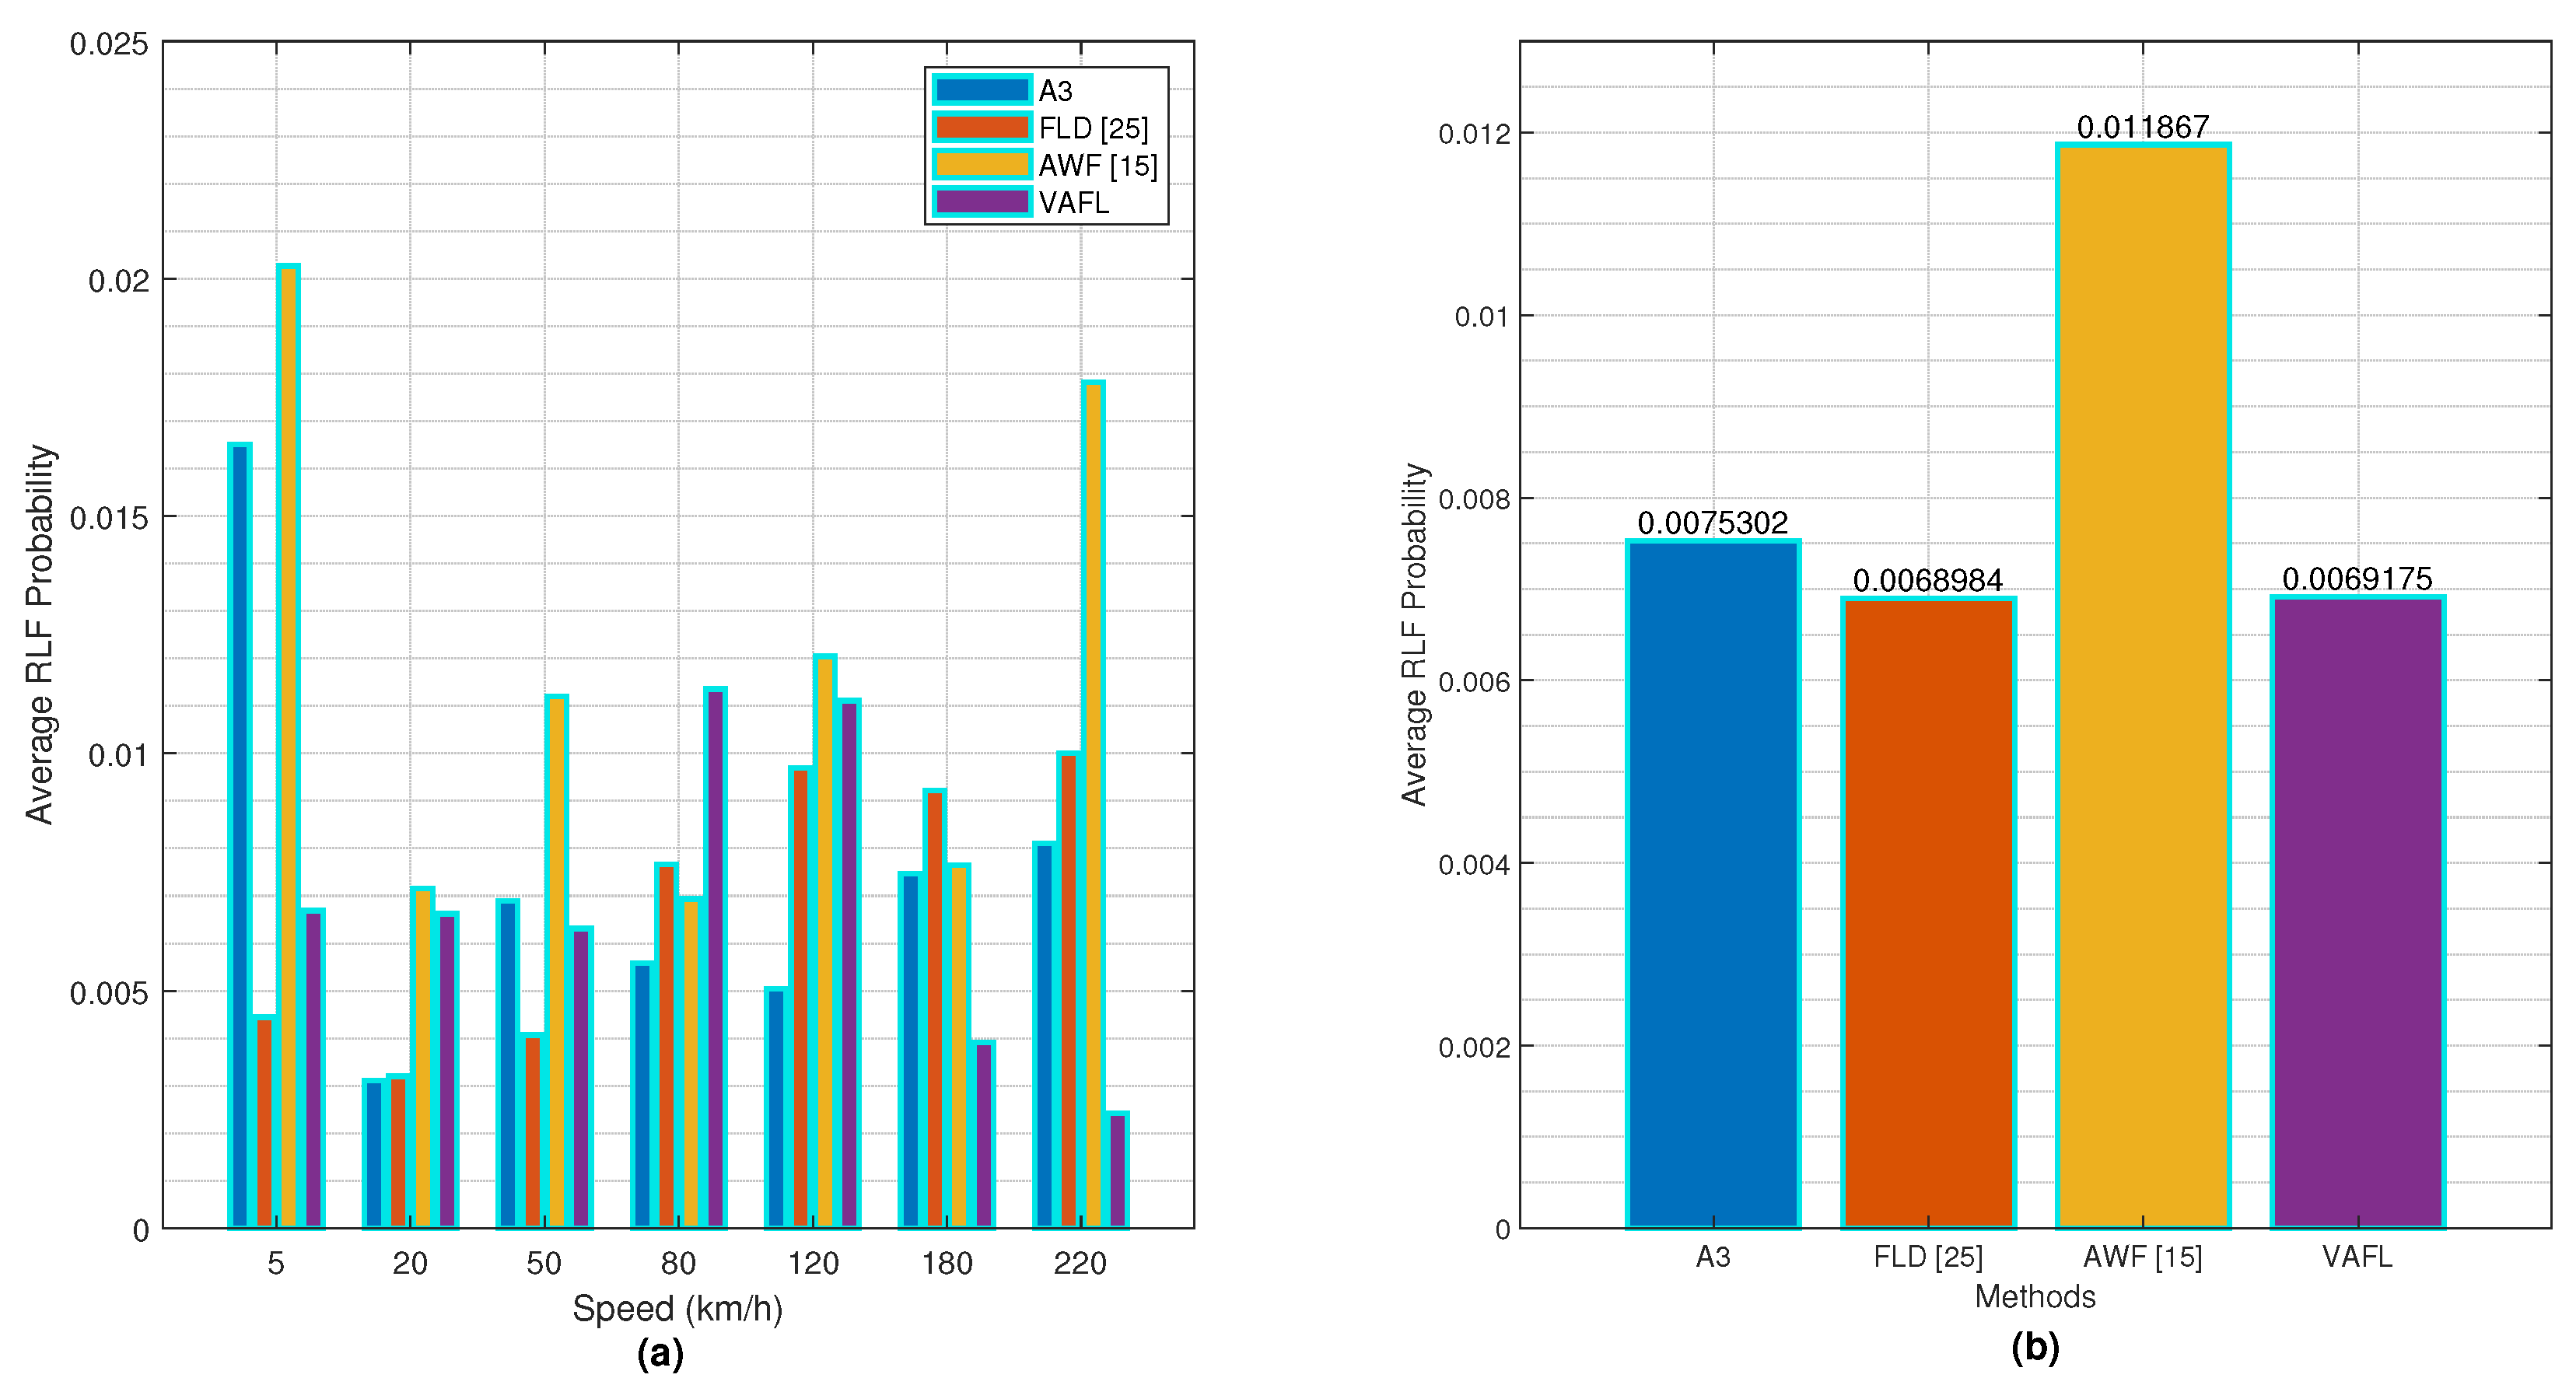
Figure 11 depicts the average RLF probability for the proposed method and the comparison methods under consideration. Figure 11a displays the average RLF probability for all UEs across various UE speed scenarios, while Figure 11b showcases the average RLF probability overall the system for the considered methods.
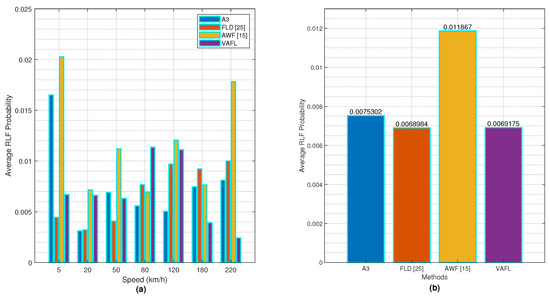
Figure 11.
Average RLF probability: (a) overall UEs versus UE speeds and (b) overall system.
Based on the illustrations, it is evident that the proposed method exhibits better performance at higher UE speeds. In terms of overall system performance, our method has a lower RLF rate than A3 and AWF [15], but it is slightly higher than FLD [25]. Our proposed algorithm achieves a reduction gain of approximately 8.14% and 41.71% compared to A3 and AWF [15], respectively. However, FLD [25] slightly outperforms our algorithm with a reduction gain of approximately 0.28%. However, it is not always ideal to have a lower RLF rate because lower HCPs settings result in lower RLF rates but higher HOPP probability. Therefore, the HCPs settings should be optimized to simultaneously ensure both lower RLF rate and HOPP probability.
4.4. Handover Ping-Pong (HOPP)
HOPP refers to a wireless network scenario where UEs experience frequent and repetitive HOs between two BSs. Instantaneous variations in signal level due to shadowing, especially in UEs located at the cell edge, cause HOPP. HOPP is one of the vital performance metrics that shows the UHO. HOPP may occur due to inappropriate settings of HCPs in automatic configuration and low value setting to HCPs in manual configuration. In both the automatic and manual configurations, the minimum value settings to HCPs cause early HO and, in turn, lead to an increase in HOPP probability. HOPP significantly degrades the QoS of the network, wastes network resources, and results in excessive power consumption.
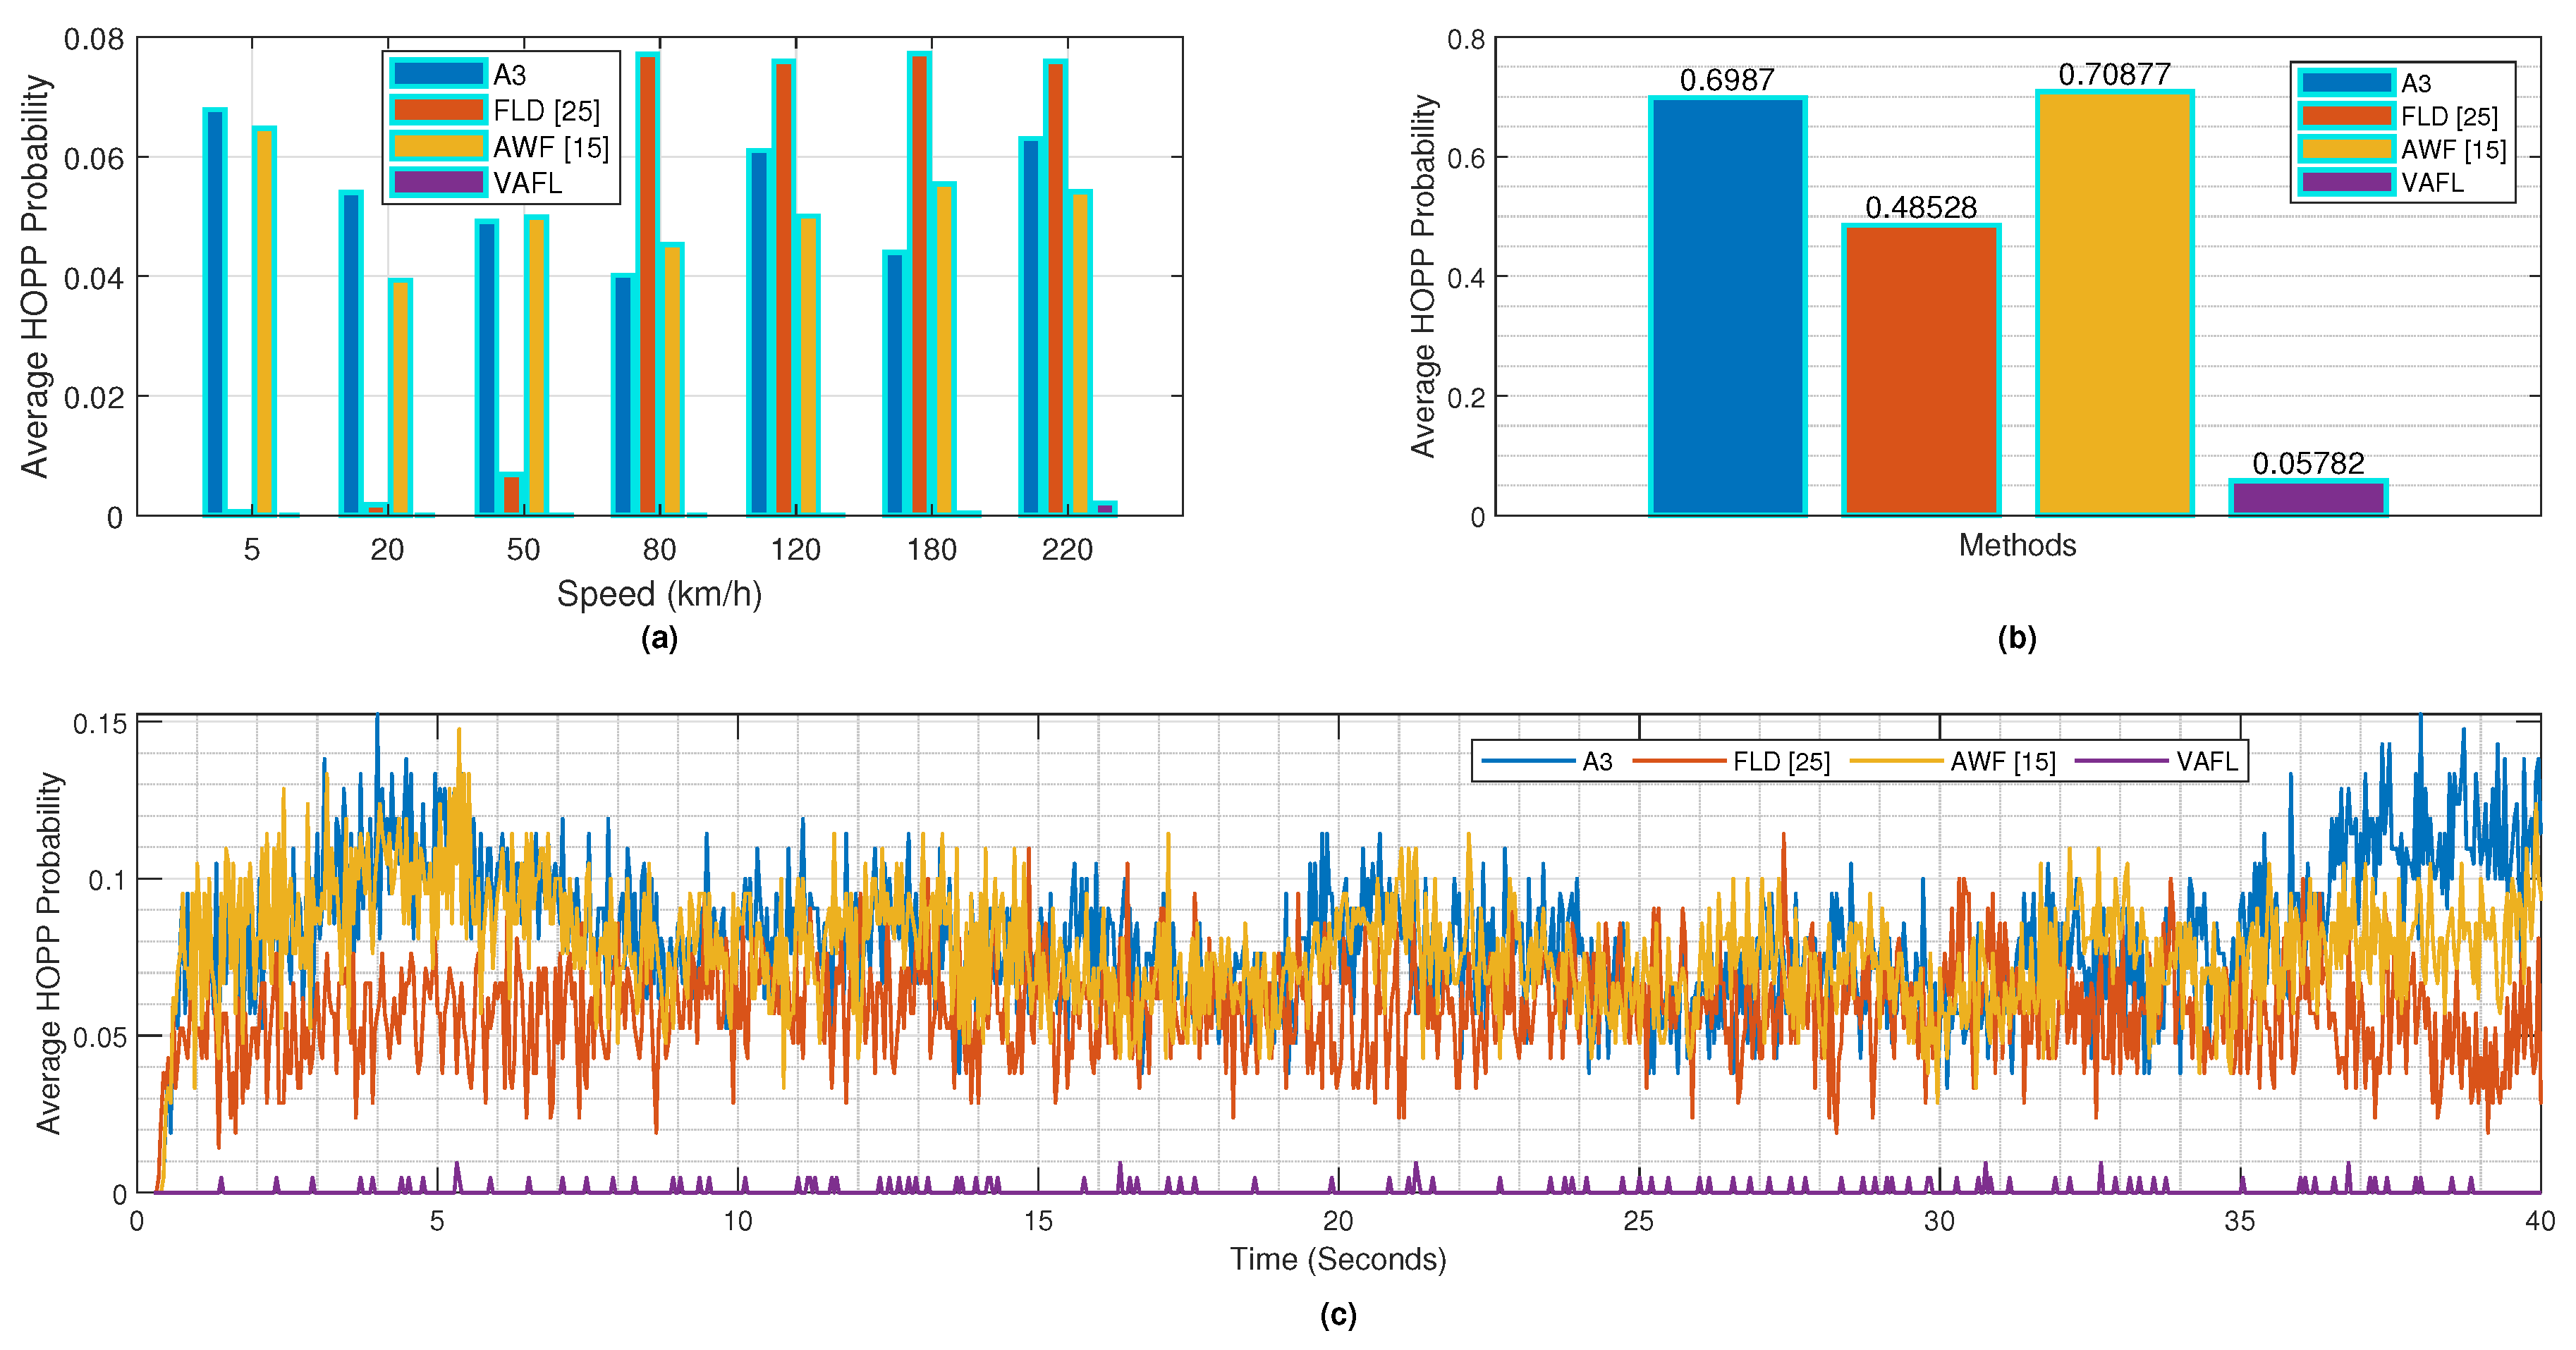
Figure 12a displays the HOPP probabilities as the average of all UEs with varying UE speed scenarios. It illustrates that HOPP probabilities vary across different methods and speed limits. For instance, A3 exhibits unpredictable HOPP probabilities for different UE speeds. On the other hand, FLD [25] shows an increasing HOPP probability from 5 to 80 km/h, but it decreases for speeds above 80 km/h. In contrast, AWF [15] has higher HOPP probabilities for lower UE speeds, but these decrease as UE speeds increase. In comparison, the proposed algorithm has lower HOPP probabilities for low UE speeds and higher HOPP probabilities for higher UE speeds. The occurrence of the HOPP probability is related to how HCPs limits are applied in algorithms. Some algorithms have more reactions with UE speeds, whereas others do not.
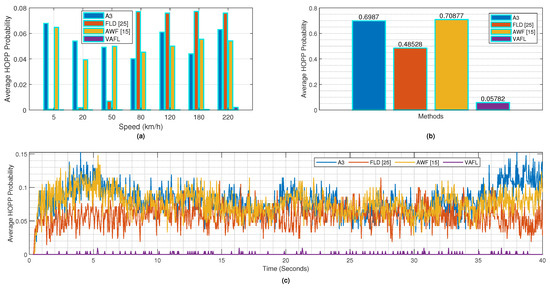
Figure 12.
Average HOPP probability for the methods under consideration across different scenarios: (a) for all UEs versus UE speed scenarios, (b) for the overall system, and (c) for all UEs versus simulation time.
Figure 12b presents the HOPP probabilities for all the considered methods as the average of all UEs across the various UE speed scenarios. Similarly, Figure 12c shows the HOPP probability for all UEs versus time. In these illustrations, it is evident that the proposed algorithm offers a substantial reduction in the HOPP probability compared to the other methods considered. The proposed algorithm achieved reductions of 91.72%, 88.09%, and 91.85% in comparison with the A3, FLD [25], and AWF [15] methods, respectively. This reduction is attributed to the optimization of HCPs and the effectiveness of the algorithm presented in this work.
5. Conclusions
In this study, we proposed a system that uses FLC to estimate HCPs, such as TTT and HOM, and based on the proposed system, we developed an algorithm which optimizes the KPIs by making efficient HO decisions in a 5G ultra-densely deployed SCs HetNet environment. The FLC utilized in the system leverages prior expertise and considers factors such as RSRP, UE speed, and cell load as input metrics. It adapts to different UE speeds and adjusts the TTT and HOM in a separate manner inside the FLC framework. The rules for both parameters differ significantly, while TTT is directly ruled by the UE speeds, a concept is referred as ’velocity-aware’, HOM operates under distinct rules. Importantly, our proposed algorithm customizes the HCPs for each UE independently, eliminating the blanket impact on all UEs. We validated the HCP settings across a range of speed scenarios from 5 km/h to 220 km/h and assessed the algorithm’s performance using various KPIs such as HOR, HOF, RLF, and HOPP. The results undeniably demonstrate that our proposed algorithm surpasses the performance of compared methods in the literature, ensuring a balance between RLF and UHO by minimizing the average RLF probability to 0.0069 and the average HOPP probability to 0.057 in an ultra-densely deployed HetNet environment, which serves as compelling evidence of its efficacy and superiority. This clear advantage positions our algorithm as a prime candidate for implementation in 5G networks, offering tangible benefits in terms of performance optimization and operational efficiency. In addition, future research can explore the validation of our proposed method, considering other metrics with different scenarios.
Author Contributions
Conceptualization, H.R.; methodology, H.R.; software, H.R.; validation, H.R., S.Ö. and A.Ç.; formal analysis, H.R., S.Ö. and A.Ç.; writing—original draft preparation, H.R., writing—review and editing, A.Ç., S.Ö. and H.R.; visualization, H.R., S.Ö. and A.Ç.; supervision, S.Ö. and A.Ç. All authors have read and agreed to the published version of the manuscript.
Funding
This research received no external funding.
Data Availability Statement
Data are contained within the article.
Conflicts of Interest
The authors declare no conflicts of interest.
References
- Ericsson Mobility Report. Available online: https://www.ericsson.com/49dd9d/assets/local/reports-papers/mobility-report/documents/2023/ericsson-mobility-report-june-2023.pdf (accessed on 28 May 2024).
- Liu, G.; Jiang, D. 5G: Vision and requirements for mobile communication system towards year 2020. Chin. J. Eng. 2016, 2016, 5974586. [Google Scholar] [CrossRef]
- Chu, X.; Lopez-Perez, D.; Yang, Y.; Gunnarsson, F. Heterogeneous Cellular Networks: Theory, Simulation and Deployment, 1st ed.; Cambridge Press: Cambridge, UK, 2013. [Google Scholar]
- Dghais, W.; Souilem, M.; Chi, H.R.; Radwan, A.; Taha, A.-E.M. Dynamic clustering for power effective small cell deployment in HetNet 5G networks. In Proceedings of the 2020 IEEE International Conference of Communications (ICC), Dublin, Ireland, 7–11 June 2020. [Google Scholar]
- Ghosh, S.K.; Ghosh, S.C. A Blackout Aware Handover Mechanism for Ultra Dense Networks. J. Netw. Syst. Manag. 2022, 30, 37. [Google Scholar] [CrossRef]
- Haghrah, A.; Haghrah, A.; Niya, J.M.; Ghaemi, S. Handover triggering estimation based on fuzzy logic for LTE-A/5G networks with ultra-dense small cells. Soft Comput. 2023, 27, 17333–17345. [Google Scholar] [CrossRef]
- Rehman, A.U.; Roslee, M.B.; Jun Jiat, T. A Survey of Handover Management in Mobile HetNets: Current Challenges and Future Directions. Appl. Sci. 2023, 13, 3367. [Google Scholar] [CrossRef]
- 3GPP; LTE. Self-configuring and self-optimizing network (SON) use cases and solutions. In Evolved Universal Terrestrial Radio Access (E-UTRA); Technical Report TR 36.902 V9.3.1; 3GPP Mobile Competence Centre: Sophia Antipolis, France, 2022. [Google Scholar]
- 3GPP; LTE. Overall description, Stage 2. Technical Specification TS 36.300 V11.6.0. In Evolved Universal Terrestrial Radio Access (E-UTRA) and Evolved Universal Terrestrial Radio Access Network (E-UTRAN); 3GPP Mobile Competence Centre: Sophia Antipolis, France, 2013. [Google Scholar]
- Saad, W.K.; Shayea, I.; Hamza, B.J.; Azizan, A.; Ergen, M.; Alhammadi, A. Performance Evaluation of Mobility Robustness Optimization (MRO) in 5G Network with Various Mobility Speed Scenarios. IEEE Access 2022, 10, 60955–60971. [Google Scholar] [CrossRef]
- Alhabo, M.; Zhang, L. Load-Dependent Handover Margin for Throughput Enhancement and Load Balancing in HetNets. IEEE Access 2018, 6, 67718–67731. [Google Scholar] [CrossRef]
- Ray, R.P.; Tang, L. Hysteresis margin and load balancing for handover in heterogeneous network. Int. J. Future Comput. Commun. 2015, 4, 231. [Google Scholar] [CrossRef]
- Nie, S.; Wu, D.; Zhao, M.; Gu, X.; Zhang, L.; Lu, L. An enhanced mobility state estimation based handover optimization algorithm in LTE-A self-organizing network. Procedia Comput. Sci. 2015, 52, 270–277. [Google Scholar] [CrossRef]
- Shayea, I.; Ismail, M.; Nordin, R.; Ergen, M.; Ahmad, N.; Abdullah, N.F.; Alhammadi, A.; Mohamad, H. New weight function for adapting handover margin level over contiguous carrier aggregation deployment scenarios in LTE-advanced system. Wirel. Pers. Commun. 2019, 108, 1179–1199. [Google Scholar] [CrossRef]
- Shayea, I.; Ergen, M.; Azizan, A.; Ismail, M.; Daradkeh, Y.I. Individualistic Dynamic Handover Parameter Self-Optimization Algorithm for 5G Networks Based on Automatic Weight Function. IEEE Access 2020, 8, 214392–214412. [Google Scholar] [CrossRef]
- Alhammadi, A.; Hassan, W.H.; El-Saleh, A.A.; Shayea, I.; Mohamad, H.; Daradkeh, Y.I. Conflict Resolution Strategy in Handover Management for 4G and 5G Networks. Comput. Mater. Contin. 2022, 72, 5215–5232. [Google Scholar] [CrossRef]
- Cardoso, E.; Silva, K.; Francês, R. Intelligent handover procedure for heterogeneous LTE networks using fuzzy logic. In Proceedings of the 2017 13th International Wireless Communications and Mobile Computing Conference (IWCMC), Valencia, Spain, 26–30 June 2017; IEEE: Piscataway, NJ, USA, 2017. [Google Scholar]
- Muñoz, P.; Barco, R.; de la Bandera, I. On the potential of handover parameter optimization for self-organizing networks. IEEE Trans. Veh. Technol. 2013, 62, 1895–1905. [Google Scholar] [CrossRef]
- Da Costa Silva, K.; Becvar, Z.; Frances, C.R.L. Adaptive Hysteresis Margin Based on Fuzzy Logic for Handover in Mobile Networks with Dense Small Cells. IEEE Access 2018, 6, 17178–17189. [Google Scholar] [CrossRef]
- Chen, Y.S.; Chang, Y.J.; Tsai, M.J.; Sheu, J.P. Fuzzy-logic-Based Handover Algorithm for 5G Networks. In Proceedings of the IEEE Wireless Communications and Networking Conference (WCNC), Nanjing, China, 29 March–1 April 2021; pp. 1–7. [Google Scholar]
- Alhammadi, A.; Roslee, M.; Alias, M.Y.; Shayea, I.; Alriah, S.; Abas, A.B. Advanced handover self-optimization approach for 4G/5G HetNets using weighted fuzzy logic control. In Proceedings of the 2019 15th International Conference on Telecommunications (ConTEL), Graz, Austria, 3–5 July 2019; pp. 1–6. [Google Scholar]
- Alraih, S.; Nordin, R.; Shayea, I.; Abdullah, N.F.; Alhammadi, A. Ping-Pong Handover Effect Reduction in 5G and Beyond Networks. In Proceedings of the IEEE Microwave Theory and Techniques in Wireless Communications (MTTW), Riga, Latvia, 7–8 October 2021; pp. 97–101. [Google Scholar]
- Alraih, S.; Nordin, R.; Abu-Samah, A.; Shayea, I.; Abdullah, N.F.; Alhammadi, A. Robust Handover Optimization Technique with Fuzzy Logic Controller for Beyond 5G Mobile Networks. Sensors 2022, 22, 6199. [Google Scholar] [CrossRef] [PubMed]
- Alhammadi, A.; Hassan, W.H.; El-Saleh, A.A.; Shayea, I.; Mohamad, H.; Saad, W.K. Intelligent coordinated self-optimizing handover scheme for 4G/5G heterogeneous networks. ICT Express 2022, 9, 276–281. [Google Scholar] [CrossRef]
- Hwang, W.S.; Cheng, T.Y.; Wu, Y.J.; Cheng, M.H. Adaptive Handover Decision Using Fuzzy Logic for 5G Ultra-Dense Networks. Electronics 2022, 11, 3278. [Google Scholar] [CrossRef]
- Zadeh, L.A. Fuzzy Sets, Fuzzy Logic and Fuzzy Systems; World Scientific: Singapore, 1996. [Google Scholar]
- Sadollah, A. Introductory Chapter: Which Membership Function is Appropriate in Fuzzy System? In Fuzzy Logic Based in Optimization Methods and Control Systems and Its Applications; InTech: London, UK, 2018. [Google Scholar]
- Chen, Y.L.; Wang, N.C.; Liu, Y.S.; Ko, C.Y. Energy Efficiency of Mobile Devices Using Fuzzy Logic Control by Exponential Weight with Priority-Based Rate Control in Multi-Radio Opportunistic Networks. Electronics 2023, 12, 2863. [Google Scholar] [CrossRef]
- Takagi, T.; Sugeno, M. Fuzzy identification of systems and its applications to modeling and control. IEEE Trans. Syst. ManCybern. 1985, SMC-15, 116–132. [Google Scholar]
- Egaji, O.A.; Griffiths, A.; Hasan, M.S.; Yu, H.-N. A comparison of Mamdani and Sugeno fuzzy based packet scheduler for MANET with a realistic wireless propagation model. Int. J. Autom. Comput. 2015, 12, 1–13. [Google Scholar] [CrossRef]
- Mahajan, V.; Agarwal, P.; Gupta, H.O. Power quality problems with renewable energy integration. In Power Quality in Modern Power Systems, 1st ed.; Academic Press: Cambridge, MA, USA, 2021; pp. 105–131. [Google Scholar]
- 3GPP. Technical Specification TS 38.331 V15.3.0. In 5G, NR, Radio Resource Control (RRC), Protocol Specification; 3GPP Mobile Competence Centre: Sophia Antipolis, France, 2018. [Google Scholar]
- Riaz, H.; Öztürk, S.; Aldırmaz Çolak, S.; Çalhan, A. Performance Analysis of Weighting Methods for Handover Decision in HetNets. Gazi Univ. J. Sci. in press. [CrossRef]
- Sklar, B. Rayleigh fading channels in mobile digital communication systems. I. Characterization. IEEE Commun. Mag. 1997, 35, 90–100. [Google Scholar] [CrossRef]
- Goldsmith, A. Wireless Communications; Cambridge University Press: Cambridge, UK, 2005. [Google Scholar]
- 3GPP; LTE. Radio Frequency (RF) system scenarios. Technical Report TR 36.942 V16.0.0. In Evolved Universal Terrestrial Radio Access (E-UTRA); 3GPP Mobile Competence Centre: Sophia Antipolis, France, 2020. [Google Scholar]

Disclaimer/Publisher’s Note: The statements, opinions and data contained in all publications are solely those of the individual author(s) and contributor(s) and not of MDPI and/or the editor(s). MDPI and/or the editor(s) disclaim responsibility for any injury to people or property resulting from any ideas, methods, instructions or products referred to in the content. |
© 2024 by the authors. Licensee MDPI, Basel, Switzerland. This article is an open access article distributed under the terms and conditions of the Creative Commons Attribution (CC BY) license (https://creativecommons.org/licenses/by/4.0/).