Article

The Vulnerability Relationship Prediction Research for Network Risk Assessment

School of Computer Science, Beijing Information Science and Technology University, Beijing 102206, China
*
Author to whom correspondence should be addressed.
Electronics 2024, 13(17), 3350; https://doi.org/10.3390/electronics13173350 (registering DOI)
Submission received: 29 July 2024 / Revised: 16 August 2024 / Accepted: 22 August 2024 / Published: 23 August 2024

Abstract

:
Network risk assessment should include the impact of the relationship between vulnerabilities, in order to conduct a more in-depth and comprehensive assessment of vulnerabilities and network-related risks. However, the impact of extracting the relationship between vulnerabilities mainly relies on manual processes, which are subjective and inefficient. To address these issues, this paper proposes a dual-layer knowledge representation model that combines various attributes and structural information of entities. This article first constructs a vulnerability knowledge graph and proposes a two-layer knowledge representation learning model based on it. Secondly, in order to more accurately assess the actual risk of vulnerabilities in specific networks, this paper proposes a vulnerability risk calculation model based on impact relationships, which realizes the risk assessment and ranking of vulnerabilities in specific network scenarios. Finally, based on the research on automatic prediction of the impact relationship between vulnerabilities, this paper proposes a new Bayesian attack graph network risk assessment model for inferring the possibility of device intrusion in the network. The experimental results show that the model proposed in this study outperforms traditional evaluation methods in relationship prediction tasks, demonstrating its efficiency and accuracy in complex network environments. This model achieves efficient resource utilization by simplifying training parameters and reducing the demand for computing resources. In addition, this method can quantitatively evaluate the success probability of attacking specific devices in the network topology, providing risk assessment and defense strategy support for network security managers.

1. Introduction

In recent years, with the rapid development of computer networks, the scale of networks has been continuously expanding, and the growth rate of network vulnerabilities has also been gradually increasing [1,2]. Given the increasing number of vulnerabilities, ensuring that all vulnerabilities on each host are patched is a highly challenging task. Therefore, it is necessary to conduct vulnerability risk assessment to prioritize the remediation of the most critical vulnerabilities [3]. In the risk assessment process, fully considering the impact of relationships between vulnerabilities is crucial for a comprehensive evaluation of individual vulnerabilities and overall network risk [4]. Consequently, it is particularly important to automatically identify and analyze the impact relationships between vulnerabilities.
Network risk assessment, as a proactive defense security technology, has always been a research hotspot in the field of network security. Researchers have proposed various assessment methods, such as game theory [5], mathematical models [6], neural networks [7], and vulnerability correlation graphs [5]. For multi-vulnerability combined attacks, risk assessment integrates various technologies, including indicator fusion [8,9], attack graphs [10,11], and Bayesian networks [12,13,14], to reveal the correlations between vulnerabilities, thereby comprehensively assessing the risks faced by the network. Additionally, knowledge graphs, by embedding entities and relationships into low-dimensional vector spaces, simplify tasks such as graph completion and link prediction, providing a powerful tool for dynamic risk assessment.
However, current research still faces several key issues that need to be addressed. First, the dependencies between vulnerabilities heavily rely on the expertise of researchers, requiring detailed manual analysis and provision, which is especially time-consuming and labor-intensive when dealing with a large number of vulnerabilities. Second, besides dependencies, there is also an impact relationship between vulnerabilities, where the exploitation of one vulnerability may reduce the exploitation complexity of another. However, current research on such impact relationships is still insufficient. Finally, research based on Bayesian attack graphs directly adopts Common Vulnerability Scoring System (CVSS) scores when quantifying vulnerability risk, neglecting the potential impact of impact relationships between vulnerabilities on the probability of successful exploitation, which may lead to inaccurate network risk assessment results. In summary, determining how to automatically predict and embed the impact relationships between vulnerabilities into vulnerability risk assessment and network risk assessment is an urgent need in this field and the focus of this paper.
This article found, through analyzing vulnerability data, that each vulnerability entity has multiple attributes. However, existing cross-series knowledge representation models mainly utilize translation principles to transform entities and relationships in knowledge graphs into low-dimensional vectors. However, this method only embeds triplet information, limiting the accurate expression of deep meanings by entity vectors. To this end, we propose a two-layer knowledge representation learning model based on vulnerability knowledge graph, which incorporates entity attribute information in the representation learning process, thereby more accurately embedding entity nodes and improving the accuracy of predicting the impact relationships between vulnerable entities.
Based on the network environment and the impact relationships between vulnerabilities, a risk calculation model is constructed in this paper. This model introduces factors such as the importance of network devices, the connectivity between devices, and the impact relationships between vulnerabilities to achieve more reasonable vulnerability risk assessment. By constructing a network device connectivity matrix, a device vulnerability matrix, a vulnerability relationship matrix, and setting relevant weight parameters to initialize the model, the iterative method is used to calculate the risk scores of devices and vulnerabilities, and the risks are ranked.
Based on the research of predicting the influence relationships among vulnerabilities, this paper proposes a new Bayesian attack graph. This attack graph is used to establish a network risk assessment model, performing risk evaluation for vulnerabilities and device nodes within the network. First, a Bayesian attack graph incorporating impact relationships between vulnerabilities is defined to model the network environment. Second, by combining the impact relationships between vulnerabilities, the exploitability probability of vulnerability nodes is quantified. For device condition nodes, the conditional probability is calculated based on their parent vulnerability nodes, and the reachability probability of device condition nodes is calculated using the joint conditional probability of the current node and its parent nodes, thereby inferring the probability of an attacker successfully compromising the node in a given network topology, providing defense strategy support for network security managers.The main contributions of this paper are as follows:
  • We propose a two-layer knowledge representation learning model that incorporates entity attribute information during the knowledge representation learning process. The method improves the embedding accuracy of entity nodes, thereby enhancing the accuracy of predicting the impact relationship between vulnerable entities. We constructed a vulnerability knowledge graph containing approximately 100,000 entities and 400,000 relationships, and conducted experiments on this graph to demonstrate that the proposed model outperforms the baseline model.
  • A vulnerability risk calculation model based on impact relationships is proposed, which enables risk assessment and ranking of vulnerabilities in network scenarios. This model introduces factors such as the importance of network devices and the impact relationship between vulnerabilities. We initialize the model by constructing a network device connectivity matrix, device vulnerability matrix, vulnerability relationship matrix, and setting relevant weight parameters. And experiments have shown that the vulnerability risk calculation model based on impact relationships proposed in this paper can more reasonably evaluate the actual risk of vulnerabilities in specific network scenarios.
  • We propose a network risk model based on Bayesian attack graph to assess the risk of device nodes in the network. This model combines the impact relationship between vulnerabilities and quantifies the probability of vulnerability exploitation and the risk status of network devices. By inferring the likelihood of attackers successfully capturing devices in a given network topology, it provides defense strategy support for network security managers. Compared with other risk assessment methods, this model is more accurate and efficient in evaluating the risk of vulnerabilities being exploited and devices being compromised in the network.

2. Related Work

Network risk assessment is a critical research area in network security, primarily involving methods based on indicator fusion, attack graphs, Bayesian networks, and Bayesian attack graphs. Indicator fusion methods integrate various security risk factors to build mathematical models for comprehensive evaluation of overall network risk. Researchers have proposed a series of indicator fusion-based risk assessment models using techniques such as analytic hierarchy process (AHP) [15] and D-S evidence theory [16]. For example, Wang et al. [15] introduced a network security situation assessment and quantification method based on AHP. This method uses AHP to address the subjective factors introduced during the determination of indicator weights and employs a hierarchical situation assessment model to address multiple risk indicators, thereby solving the network security situation assessment problem.
CVSS primarily aims to score the risk of individual vulnerabilities but fails to fully capture the attacker’s intent. An attack graph is a modeling technique used to represent the sequence of network attack events [17], correlating isolated vulnerabilities to illustrate the attacker’s behavior. Attack graphs are mainly divided into state attack graphs and attribute attack graphs. Due to the state explosion problem in state attack graphs, researchers have focused more on network risk assessment based on attribute attack graphs. Wang et al. [18] proposed a vulnerability assessment method based on attribute attack graphs and maximum flow. This method generates attack graphs by traversing vulnerability node information and their correlations, uses depth-first search algorithms and maximum loss flow mechanisms to find the optimal attack paths in the network, and evaluates critical vulnerabilities based on attack paths and loss saturation. To address the complexity of generating and quantifying attack graphs in large-scale networks, Lee et al. [19] endowed attack graphs with semantics using ontology technology, enabling machines to handle large-scale attack graphs and infer strategies to enhance network security, thus supporting automated risk assessment in large-scale network nodes.
When using attack graphs for network risk assessment, the modeling is typically static, whereas Bayesian networks utilize observed attack events to infer subsequent node risks, lacking dynamic attack scenario construction. Combining Bayesian networks with attack graphs can dynamically illustrate attack patterns and conduct real-time risk assessment. Poolsappasi et al. [20] proposed a dynamic risk assessment model based on Bayesian attack graphs, which includes not only the causal relationships between different network states but also the likelihood of exploiting these relationships. Munoz-Gonzalez et al. [21] introduced a new algorithm to infer Bayesian attack graphs, reducing the time required to generate these graphs, saving computational resources, and enhancing the applicability of the Bayesian attack graph method in large-scale networks.
With the increasing complexity of software functions, new vulnerability patterns continue to emerge. The diversification of software vulnerabilities and the interdependencies among software enhance cross-cooperation among vulnerabilities, making it more common for attackers to exploit multiple vulnerabilities in combination [22]. Researchers have, thus, focused on the relationships between vulnerabilities. Du et al. [23] suggested that vulnerabilities are caused by weaknesses, and the relationships between vulnerabilities should be analyzed based on weaknesses. This study proposed a weakness importance propagation algorithm based on PageRank to predict the relationships between weaknesses. Han et al. [24] also focused on weaknesses, noting that although the common weakness enumeration (CWE) contains rich information on weaknesses, its textual data format prevents direct inference of relationships among weaknesses. This study established a knowledge graph (KG) of weaknesses, using knowledge representation, learning to embed weaknesses and their relationships into a semantic vector space, facilitating knowledge acquisition and relationship inference to predict missing relationships between CWEs.
Knowledge representation learning based on knowledge graphs has become a research hotspot in recent years. Knowledge graphs consist of entities (nodes) and relationships (edges) [25], with each edge represented as a triple (head entity, relationship, tail entity). Knowledge graphs like Freebase [26], DBpedia [27], YAGO [28], and NELL [29] have been widely used in fields such as named entity disambiguation, relationship extraction, and intelligent question answering. Knowledge representation learning [30,31,32] embeds the elements of knowledge graphs, including entities and relationships, into continuous low-dimensional vector spaces, simplifying triple operations while preserving the inherent structure of the graph. After embedding entities and relationships into low-dimensional vectors, these vectors can assist in downstream tasks such as graph completion [33,34], relationship prediction [35], triple classification [36], and relationship extraction [37]. The most typical knowledge representation learning models are the TransE [38] model and its improved versions, such as TransH [39], TransR [40], and TransD [41]. These models first represent entities and relationships in a continuous vector space, defining an energy function for triples to calculate vector representations, and optimize the overall plausibility of triples to obtain vector representations of entities and relationships. However, these models only integrate structural information into vector representations through triples without considering the specific meanings of entities. Therefore, the vector representations of entities and relationships obtained may not be sufficient for predictions in downstream tasks. The TransD model addresses the problem in TransR, where entities of vastly different types and attributes share the same projection matrix by further decomposing the projection matrix into the product of two projection vectors, thus also reducing the model’s parameter count. Yang et al. [42] conducted link prediction research for entities with relatively few related triples, proposing a new link prediction model based on meta-learning. This model divides training data into four groups based on relationship types, trains each task sequentially through a meta-learning framework, and uses graph neural networks to score triples, effectively predicting relationships for newly added unknown entities in knowledge graphs. In addition, some studies [43] will explicitly simulate high-order connectivity in KG in an end-to-end manner, recursively propagating embeddings from nodes’ neighbors (which can be users, items, or attributes) to refine node embeddings, and they use attention mechanisms to distinguish the importance of neighbors to promote more effective knowledge representation.

3. Methodology and Implementation

3.1. Vulnerability Knowledge Graph Definition and Construction

The vulnerability knowledge graph constructed in this paper comprises three primary entities: vulnerabilities, the products affected by these vulnerabilities, and the vendors of these products.
At the core of this knowledge graph is the vulnerability entity. We classify the attributes of this entity into three dimensions: the fundamental characteristics of the vulnerability, the conditions under which the vulnerability can be exploited, and the impact of such exploitation. Each vulnerability entity is characterized by a total of 21 attributes across these dimensions. Detailed descriptions and values of each attribute are provided in Table A1.
The relationships between entities are defined as five in this paper, which are shown as follows:
I n f l u e n c e : : = < v u l n e r a b i l i t y , p r o d u c t >
where v u l n e r a b i l i t y denotes a vulnerability entity and p r o d u c t denotes a product entity. When both v u l n e r a b i l i t y and p r o d u c t are assigned specific values, the impact relationship between a vulnerability entity and a product entity can be determined.
A f f i l i a t e d W i t h : : = < p r o d u c t , v e n d o r >
where p r o d u c t denotes a product entity, v e n d o r denotes a vendor entity, and A f f i l i a t e d W i t h indicates that the product entity belongs to a vendor entity. When both product and vendor are assigned specific values, the affiliated relationship between a product entity and a vendor entity can be determined.
The Common Vulnerability Scoring System Version 3 (CVSS3) [44] evaluates the exploitability of vulnerabilities in four dimensions: attack vector (AV), attack complexity (AC), privileges required (PR), and user interaction (UI), as shown in Table 1.
Since user interaction metrics require human factors to be involved, this paper does not consider this dimension when studying the relationship between vulnerabilities. We define the relationship between vulnerability entities in terms of three dimensions: privileges required, attack vector, and attack complexity when they are exploited.
We use the term I n c r e a s e P e r m i s s i o n s to describe the permission changes that occur when exploiting the relationship between two vulnerabilities. This relationship and its formation conditions are illustrated in Figure 1, where ellipses, rectangles, parallelograms, and rounded rectangles, respectively, represent exploitable vulnerabilities, required operations, permission requirements, and the influence relationships between vulnerabilities. If the exploitation outcome of v i is to elevate user privileges, thereby enabling the exploitation requirements of another vulnerability, v j , to be met, then there exists an I n c r e a s e P e r m i s s i o n s relationship between the two vulnerabilities. GainPrivilege represents the system or application privilege attribute that can be acquired upon the exploitation of the vulnerability entity v i , while PrivilegesRequired indicates the privilege attribute necessary for the exploitation of the vulnerability entity v j . When the attribute value of GainPrivilege is “Root” or “Administrator” privileges, and the attribute value of PrivilegesRequired is “High”, then there exists an I n c r e a s e P e r m i s s i o n s relationship between v i and v j .
We use I n c r e a s e A c c e s s P a t h to describe the changes of the local vulnerability exploit conditions between two vulnerabilities, and its formation condition is shown in Figure 2. ExecuteSystemCommand and ExecuteCode, respectively, denote vulnerability’s command and code execution attribute. When the value of ExecuteSystemCommand or ExecuteCode is yes, and the value of AccessPath is Local, then there is a relationship I n c r e a s e A c c e s s P a t h between v i and v j .
We use D e c r e a s e C o m p l e x i t y to describe the complexity changes of exploit between two vulnerabilities, and its formation condition is shown in Figure 3 and Figure 4. Access Application, Access Database, Access File System, File Read Write, Upload File, and Download File, respectively, indicate whether the v i can access system or application, access database, access file system, file read and write permission, upload file, and download file. Authentication, AccessComplexity, and read–write, respectively, indicate whether it needs Authentication, access complexity when v j is exploited, and whether it requires read and write permission. When the value of AccessApplication or AccessDatabase is yes, and the value of AccessComplexity is Local, then there is a relationship DecreaseComplexity between v i and v j (Figure 3). In addition, when the value of File Read Write or Access File System or Upload File or Download File is yes, and the value of AccessComplexity is Local, then there is a relationship DecreaseComplexity between v i and v j (Figure 4).

3.2. Dual-Layer Knowledge Representation Learning Model

In the current field of information security, most researchers tend to adopt more traditional methods for modeling and analyzing complex relationships between vulnerabilities, products, and suppliers. These methods often focus on a single data processing or feature extraction technique, and less comprehensive consideration is given to multidimensional and deep-level correlations between entities. This limitation, to some extent, limits the accuracy and efficiency of vulnerability impact assessment.
In view of this, this article uses the commonly used TransE model in link prediction, which maps vulnerability entities, product entities, supplier entities, and their complex relationships into a vector space through a translation mechanism. The aim is to construct a vector embedding representation that can comprehensively cover the relationships between vulnerabilities, their affected products, and the suppliers to which the products belong. This method not only simplifies the handling of complex relationships, but also enhances the model’s generalization ability to new vulnerabilities and products. In order to further improve the accuracy of representation, the TransCatAttr knowledge representation model proposed in this paper is also introduced. This model makes full use of the vulnerability entity vector obtained from the first layer of knowledge representation learning as the initialization basis, and through splicing the attribute vectors of vulnerability entities (such as vulnerability type, severity, utilization difficulty, etc.), it achieves a more detailed and comprehensive description of vulnerability entities. This fusion of attribute vectors makes the model more accurate and efficient in identifying vulnerability features and evaluating their potential impact, providing strong support for subsequent vulnerability warning, risk assessment, and emergency response.
As shown in Figure 5, a total of two layers of knowledge representation learning are performed after the vulnerability knowledge graph is successfully constructed. The first layer is the vector embedding of vulnerability entities, product entities, vendor entities, and their inter-entity relationships using the TransE model, aiming to make the obtained vulnerability entity vectors cover the relationships with their affected products and vendors to which the products belong. The second layer uses the TransCatAttr knowledge representation model proposed in this paper, adopts the vulnerability entity vectors obtained from the first layer of knowledge representation learning as the initial vectors, and splices the attributes vectors of the vulnerability entities to represent the entities more accurately.
After obtaining the vector representation of vulnerability entities and relationships, the relationship prediction of vulnerability entities is performed. For the head vulnerability entity h and the tail vulnerability entity t for which some relationship is to be predicted, the energy function value of the triple is calculated for any one candidate relationship. Then, all candidate triples are sorted in ascending order according to the energy function value, and the relationship r ranked first is selected as the prediction result.
The initialization vector representation of entities in the TransE model is randomly generated when knowledge representation learning is performed, and the attribute information of entities is not considered. The TransCatAttr knowledge representation model proposed in this paper splices the attribute information vectorization of entities with the vulnerability entity vector obtained from the first round of knowledge representation learning as the vulnerability entity initialization of the TransCatAttr vector, which can embed entity nodes more accurately.
The input of the TransCatAttr model is vulnerability entities and relationships between vulnerability entities in the vulnerability knowledge graph. The relationship between each set of vulnerability entities is represented by a triple as ( h , r , t ) T , where h , t V , V denotes the set of vulnerability entities, and r R , R denotes the set of the three types of relationships between vulnerability entities. The T denotes the training set of the triples for knowledge representation learning. The input of the TransCatAttr model is vulnerability entities and relationships between vulnerability entities in the vulnerability knowledge graph. The relationship between each set of vulnerability entities is represented by a triple as ( h , r , t ) T , where h , t V , V denotes the set of vulnerability entities, and r R , R denotes the set of the three types of relationships between vulnerability entities. The T denotes the training set of the triples for knowledge representation learning.
Vulnerability entities and relationships are represented by k-dimensional vectors, and each vulnerability entity is represented in two parts. One part is a structure-based vector representation, with hs and ts, respectively, denoting the structure-based vector representation of the head vulnerability entity and the tail vulnerability entity, which is learned from the relationships between entities. The other part is a vector representation based on attributes information, with ha and ta, respectively, denoting the attribute-based vector representation of the head vulnerability entity and the tail vulnerability entity, which are obtained by encoding the attributes of the vulnerability entities.
The 21 kinds of attributes are coded by one-hot encoding for each attribute except for the vulnerability number and date. After obtaining the attribute vectors of vulnerability entities, the structure vector of vulnerability entities obtained by the first round of knowledge representation is used as the initial vector of vulnerability entities learned by the TransCatAttr model. The energy function of the model is shown in Equation (3), and the goal of knowledge representation is to minimize E on the triple training set T.
E = E s E a
where the symbol ⊕ represents the connection of the two representation vectors of the entity, and Es and Ea are calculated by the following Equation (4) and Equation (5), respectively.
E s = h s + r s t s
E a = h a + r a t a
The objective of the TransCatAttr model is to minimize the loss function L, as shown in Equation (6). Here, γ > 0 is a bounded hyperparameter indicating that a positive instance triple scores at least γ higher than a negative instance triple, and E ( h , r , t ) is the energy function defined above, obtained by computing E s spliced with E a . T is the set of negative instance triples constructed during training based on the triple training set T according to Equation (7). The head entity or tail entity in the triplet is randomly replaced by any one of the entities in the vulnerability entity set V, and it must be ensured that the constructed negative instance of the triplet has not appeared in the training set T.
L = ( h , r , t ) T ( h , r , t ) T max ( γ + E ( h , r , t ) E ( h , r , t ) , 0 )
T ( h , r , t ) = { ( h , r , t ) h E } { ( h , r , t ) t E }
The training process of the TransCatAttr model is shown in Algorithm 1. Firstly, the vector representation of each entity in the set of vulnerability entities is initialized, and the structure-based vector representation obtained from the first round of knowledge representation is stitched with the attribute vector representation. The initial value of the structure-based vector representation of the relationship vector is randomly generated, and the uniform representation conforms to the uniform distribution of [ 1 , 1 ] , where k denotes the embedding dimension of the structure-based vector representation; it is stitched with the attribute vector of the relationship to obtain the initial vector representation of the relationship vector as a whole. After the initialization of entity and relation vectors, T b a t c h is initialized and the corresponding negative case triples are constructed according to Equation (7). The entity vectors and relation vectors are optimized in the gradient direction of the loss function described in Equation (6) for the positive and negative case triples.
Algorithm 1 Learning TransCatAttr
Input: Training set T = ( h , r , t ) , entity set V and relation set R, vulnerability entity initial embeddings set l, vulnerability entity attribution embeddings set A, vulnerability relation attribution embeddings set R A , margin γ , structure embeddings dimension k, attribution embeddings dimension m.
Output: Knowledge graph embedding model
  1:
for  e V  do
  2:
    Let e s I;
  3:
    Let e a A;
  4:
    Let e s e s e a ;
  5:
    Let e s e e ;
  6:
end for
  7:
for  e V  do
  8:
    Let r s I;
  9:
    Let r a A;
10:
    Let r s r s r a ;
11:
    Let r s r r ;
12:
end for
13:
for  e V  do
14:
    Let T b a t c h ϕ ;
15:
    Let T b a t c h T b a t c h ( ( h , r , t ) , ( h , r , t ) ) ;
16:
end for
17:
Update embedding
18:
           Σ ( ( h , r , t ) , ( h , r , t ) ) T b a t c h max ( γ + E ( h , r , t ( ) E ( h , r , t ) ) , O )

3.3. Attack Graph for Relationship Prediction

Bayesian network attack graphs are commonly used network risk assessment models. As shown in Table 2, a traditional Bayesian attack graph mainly includes S, E, Vul.R, and Pro. In this paper, we redefine the model by introducing inf (Influence).
Use the formula in Equation (8) to map the integrating the influence relationship between vulnerabilities to the [0,1] range, this value indicates the probability of the attacker’s success in using the vulnerability, called the vulnerability node availability probability. As shown in Equation (8), we ignore the factor of UI according to the actual situation, where the meanings and corresponding values of indicators AV, AC, and PR are given in Table 1.
P ( V ) = A V · A C · P R 10
For S j , the probability of being trapped is calculated according to the parent vulnerability node with its dependence, that is, the conditional probability, denoted as P ( S j ParVul ( S j ) ) , where ParVul ( S j ) represents the set of parent vulnerability nodes. According to different R, the conditional probability is calculated, respectively.
P ( S j ParVul ( S j ) ) = 0 , S j ParVul ( S j ) , S j = 0 j = 1 n ParVul ( V j ) , others
P ( S j ParVul ( S j ) ) = 0 , S j ParVul ( S j ) , S j = 0 1 j = 1 n [ 1 ParVul ( V j ) ] , others R = OR
After calculating the conditional probability of each attribute node in the Bayesian attack graph, the joint conditional probability of the current node and its parent node is used as the accessibility probability of the attribute node to represent the trapped probability of the attribute node. The following is the formula for calculating the accessible probability of the node S j .
Probability ( S j ) = j = 1 n P ( S j Par ( S j ) )

3.4. Experiment Validation

In this paper, the vulnerability information for three years from 2019 to 2021 was obtained from National Vulnerability Database (NVD) and Common Vulnerabilities and Exposures (CVE) Details, and the corresponding relationship data were obtained from Common Weakness Enumeration (CWE), Common Attack Pattern Enumeration and Classification (CAPEC), and Security Blog (Breff). Then, entities and relationships were imported into the Neo4j database for storage. The constructed vulnerability knowledge graph contains 96,261 entities and 398,220 relationships, where the number of each type of entity node and each type of relationship is shown in Table 3.
Figure 6 shows some of the nodes and relationships of the vulnerability knowledge graph constructed in this paper, where a red node is the vendor node, a green node is the product node, and a yellow node is the vulnerability node. For example, it shows two product nodes, rv340 firmware and Secure Access Control, that has an relationship for AffiliatedWith with the vendor node Cisco. Two vulnerability nodes, CVE-2022-20707 and CVE-2022-20705, have an “Influence” relationship with the rv340 firmware product node, and there is a “ D e c r e a s e C o m p l e x i t y ” relationship between CVE-2022-20707 and CVE-2022-20705.
The data of the triple are divided into the training set, validation set, and test set in the ratio of 8:1:1 for the linked prediction task, i.e., predicting the relations based on the head entity and tail entity, and using the task evaluation metrics to measure the accuracy and effectiveness of the model.
In relationship prediction tasks, the relationship prediction performance of knowledge representation models is often evaluated using mean rank (MR) and top-k hits Hit@k (k = 1, 3, 5).
In the model training process, the range of hyperparameters is empirically defined in this paper as follows: loss function interval margin { 1 , 2 , 4 , 6 } , stochastic gradient descent learning rate l r { 0.001 , 0.01 , 0.1 } , and the set hyperparameters are determined according to the best results achieved on the validation set, as shown in Table 4.
This paper conducted an experiment using the PyTorch 1.5.0 deep learning framework in LINUX Ubuntu 16.04, using the Python programming language, version 3.7. The hardware was trained using NVIDIA GTX1660, an NVIDIA graphics card, and the CUDA version was 10.0.1. The overall training time is about one week.
Figure 7 shows the changes in the loss values of the training and validation sets during the training process of the TransCatAttr model. It can be seen from the figure that the loss values of the TransCatAttr model decrease as the number of training iterations increases, with a significant drop at the beginning of the training phase, indicating that the learning rate is appropriate and the gradient descent process is effective. After approximately 100 iterations, the loss curve levels off, indicating that the model has largely been trained successfully.
In this paper, to evaluate the performance of the TransCatAttr model, the TransE model is selected as the baseline model. These two models were separately subjected to relationship prediction experiments on the dataset constructed above. A comparative analysis of the experimental results is shown in Table 5. From Table 5, it can be seen that the TransCatAttr model proposed in this paper performs better compared to the TransE model. The entity MR index value is improved by 8.97%, and the relationship MR is improved by 8.21%. However, the entity Hits@10 index value is decreased by 143.95, and the relationship Hits@1 index value is decreased by 0.6.
The primary reason that the TransCatAttr model outperforms the TransE model is that it incorporates attribute information of entities, whereas the TransE model only performs vector embedding based on the graph structure. By integrating attribute information, the TransCatAttr model can represent the relationships between entities more accurately, leading to better performance in prediction tasks. Specifically, the improvement in the entity MR index is due to the enhanced expressive power of entity embeddings when attributes are considered. Similarly, the relationship MR index is improved because the inclusion of attribute information results in more precise relationship embeddings. On the other hand, the decrease in the entity Hits@10 index suggests that in certain scenarios, the introduction of attribute information enhances the model’s ability to identify entities. The slight decrease in the relationship Hits@1 index indicates that the model’s optimization may have emphasized different aspects of relationships, resulting in improved prediction accuracy for relationships.

4. Results

We selected a local area network (LAN) configuration that includes 13 servers and multiple terminals, identifying 33 vulnerabilities. The specific attack map is shown in Figure A1. Simultaneously, we used the risk calculation model introduced in this paper for validation and compared it with existing CVSS scores, demonstrating that the assessment scores from our model are closer to real-world attack scenarios.
After multiple iterations, the vulnerability risk assessment scores eventually converged. Due to the CVSS base scores (BS) not accounting for the importance of network topology, they cannot accurately assess vulnerability risks in specific environments, leading to significant discrepancies in rankings between the two methods. Figure 8 shows the risk assessment ranking of experimental network vulnerabilities using the evaluation model proposed in this paper and the basic scores in CVSS. There is a difference in the ranking given by the two methods for the same vulnerability, with vulnerabilities 1, 5, 6, 10, 13, 16, 17, 18, 24, and 31 having a significant difference. The basic score for vulnerability 5 in the CVSS evaluation method is 7.5, indicating that vulnerability 5 is not a high-risk vulnerability under the BS evaluation criteria of CVSS. However, vulnerability 5 is located on the logistics system server, and hosts within the network can access this server through the corresponding port. The exploitation of vulnerability 3 or vulnerability 4 on the logistics system server can achieve the effect of obtaining server root permission, and after obtaining root permission, vulnerability 5 can be used to download files in the shared directory to the local area. Therefore, the exploitation of vulnerability 3 or vulnerability 4 reduces the complexity of vulnerability 5 exploitation. Thus, the risk score for vulnerability 5 needs to be adjusted and increased, and the same applies to vulnerabilities 1, 6, and 10. In the CVSS evaluation method, the basic score for vulnerability 17 is 4.3, the impact score is 1.4, and the utilization score is 2.8. Under the evaluation criteria of CVSS, vulnerability 17 is not a high-risk vulnerability. However, vulnerability 17 is located on both the system server and the academic affairs server, and the exploitation of vulnerability 8 on the same device can achieve the effect of taking over the server, thereby obtaining the necessary permissions to exploit vulnerability 17. Therefore, the risk score for vulnerability 17 needs to be adjusted and increased, as well as vulnerabilities 13, 16, and 18. Vulnerability 31 is considered a high-risk vulnerability in the CVSS evaluation method, and when combined with vulnerability 32, it can be exploited to allow unauthorized attackers to remotely execute arbitrary code and obtain system privileges on the server. However, vulnerability 31 requires vulnerability 32 to help it bypass permissions, and the permission requirements for vulnerability 32 are also high. Therefore, the probability of successful exploitation of vulnerability 31 is low, and its risk value should be reduced. The same is true for vulnerability 24.
In the evaluation and verification process of the network risk model, we compared three different detection techniques to comprehensively assess the system’s security and accuracy. First, we used the hidden Markov model (HMM), a temporal probability model evolved from the Markov chain. To calculate the probability P ( S i ( t ) = r i s k s t a t e ) that a vulnerability node i is in a risk state at time t, we use the forward algorithm in HMM. The initialization (at t = 1) is as follows (Equation (12)).
a i k ( 1 ) = π i k b i k ( O ( 1 ) )
where π i k is the probability that node i is initially in state k, and b i k ( O ( 1 ) ) is the probability of observing O ( 1 ) given that node i is in state k. Next, we proceed with recursion (at t > 1 ), as illustrated in Equation (13):
a i k ( t ) = j = 1 N a i j ( t 1 ) a j i b i k ( O ( t ) )
where a j i is the probability of transitioning from state j to state k. Finally, the probability that vulnerability node i is in a risk state at time t is illustrated in Equation (13):
P ( S t ( t ) = S i k O ( t ) , θ ) = k = 1 N a i k ( t )
This method quantifies the direct risk of vulnerability nodes by analyzing their security states and risk values at different times. First, for direct risk, we define the direct risk value of vulnerability node i at time t as R i d ( t ) , which can be expressed as follows:
R i d ( t ) = P ( S i ( t ) = risk state )
where P ( S i ( t ) = risk state ) represents the probability that node i is in a risk state at time t. Additionally, we consider the correlation between vulnerabilities to quantify the indirect risk between them. For indirect risk, we define the indirect risk value of vulnerability node i due to its association with other nodes j as R i i ( t ) , which can be expressed as follows:
R i i ( t ) = j i P ( S j ( t ) = risk state ) × C j i
where C j i represents the correlation between node i and node j. By combining direct and indirect risks, we can more accurately assess the actual risk condition of the nodes. The comprehensive risk value S k ( t ) of device node k can be expressed as follows:
S k ( t ) = i w i k R i d ( t ) + R i i ( t )
where w i k represents the influence weight of vulnerability node i on device node k, and i w i k = 1 . By combining direct and indirect risks, we can more accurately assess the actual risk condition of the nodes. Finally, by incorporating the weights of each node in the network, we can comprehensively evaluate the risk of devices in the network, providing strong support for network security management.
Secondly, considering the dynamic impacts of attacks and defenses, we introduced the Stochastic Petri Net (SPN) to evaluate the model. In the validation experiments, device nodes were represented as places, and vulnerability events were simulated as transitions. This representation method allows for intuitive simulation and analysis of the state changes in network devices and the impact of vulnerability events on the network. During the detection process, we first modeled the network devices and vulnerability events to create an initial Petri Net model. Then, we used this model to simulate potential threats and attack paths in the network. The Stochastic Petri Net not only captures the dependencies and interactions between devices but also allows for the addition of random parameters to transitions to simulate uncertainties in real networks, thereby further analyzing the accuracy and robustness of the detection results. Figure A2 shows the Stochastic Petri Net model we constructed based on the experimental network.
Finally, Bayesian networks are probabilistic models that combine probability theory and graph theory to model conditional independence and dependencies among variables. By introducing attack graphs, the relationships between nodes, and the deductive reasoning of Bayesian networks, we can calculate the reachability probability of each node in the graph to quantify, assess, and predict network risk levels. By comprehensively applying these three detection techniques, we can more thoroughly evaluate the accuracy of the proposed model, ensuring its reliability and effectiveness across different dimensions and various scenarios. This multi-angle evaluation method not only improves the precision of detection results but also provides solid data support for optimizing network security strategies. Figure 9 shows how to use reachability probability to calculate the risk probability of device nodes by constructing a Bayesian attack graph through experimental networks. The conditional probability table for the computing node S4, as calculated based on the experimental network, is presented in Table 6.
We also compared the results with two commonly used risk assessment methods: hidden Markov model (HMM) and Petri Net. As shown in Figure 9, we found that the prediction results from these methods exhibit trends similar to those of our system, thereby validating the accuracy and effectiveness of our approach. Compared to models that do not consider the relationships between vulnerabilities, our method demonstrates significant differences. For example, the reachability probability prediction for node S4 is almost twice that of the original Bayesian attack graph and the Petri Net method. This difference can be attributed to the successful exploitation of vulnerability CVE-2019-2887 (on which node S4 depends), which in turn is facilitated by the presence of vulnerability CVE-2019-2729, thereby reducing the exploitation difficulty. Consequently, its exploitability PR index decreases from “L” to “N”, increasing the probability of successful exploitation and, thus, the risk of node S4 being compromised. Additionally, another vulnerability on which node S4 depends, CVE-2016-2107, has a high exploitation complexity. Exploiting the parent node vulnerability CVE-2020-1745 on the attack path can grant root access to the server, thereby reducing the exploitation complexity and lowering its exploitability AC index from “H” to “L”.
Furthermore, although the HMM method yields higher risk values than our method for some vulnerabilities, its modeling requires the integration of substantial evidence information and prior knowledge, demanding relatively high data dimensions and computational resources. This can limit the real-time assessment capability in complex network environments. In contrast, the dual-layer knowledge representation learning model adopted in this paper efficiently achieves vulnerability relationship prediction and network risk assessment with less storage space and fewer computational resources, thereby significantly enhancing the system’s response speed and real-time performance.

5. Discussion

With the continuous expansion of computer networks, the number of network vulnerabilities is also increasing year by year, corresponding to network attacks. Attacks and security incidents are becoming increasingly frequent. Due to the fact that attackers often combine and exploit multiple vulnerabilities when launching attacks, determining how to automatically predict the impact relationship between vulnerabilities and combine it with impact relationship prediction in order to achieve attack objectives through holes is important. The risks brought by vulnerability exploitation to the network have become very important. This article addresses the above issues by linking the knowledge graph and predicting the impact relationship between vulnerabilities and combining Bayesian attack graph technology for network risk assessment. The research content is as follows:
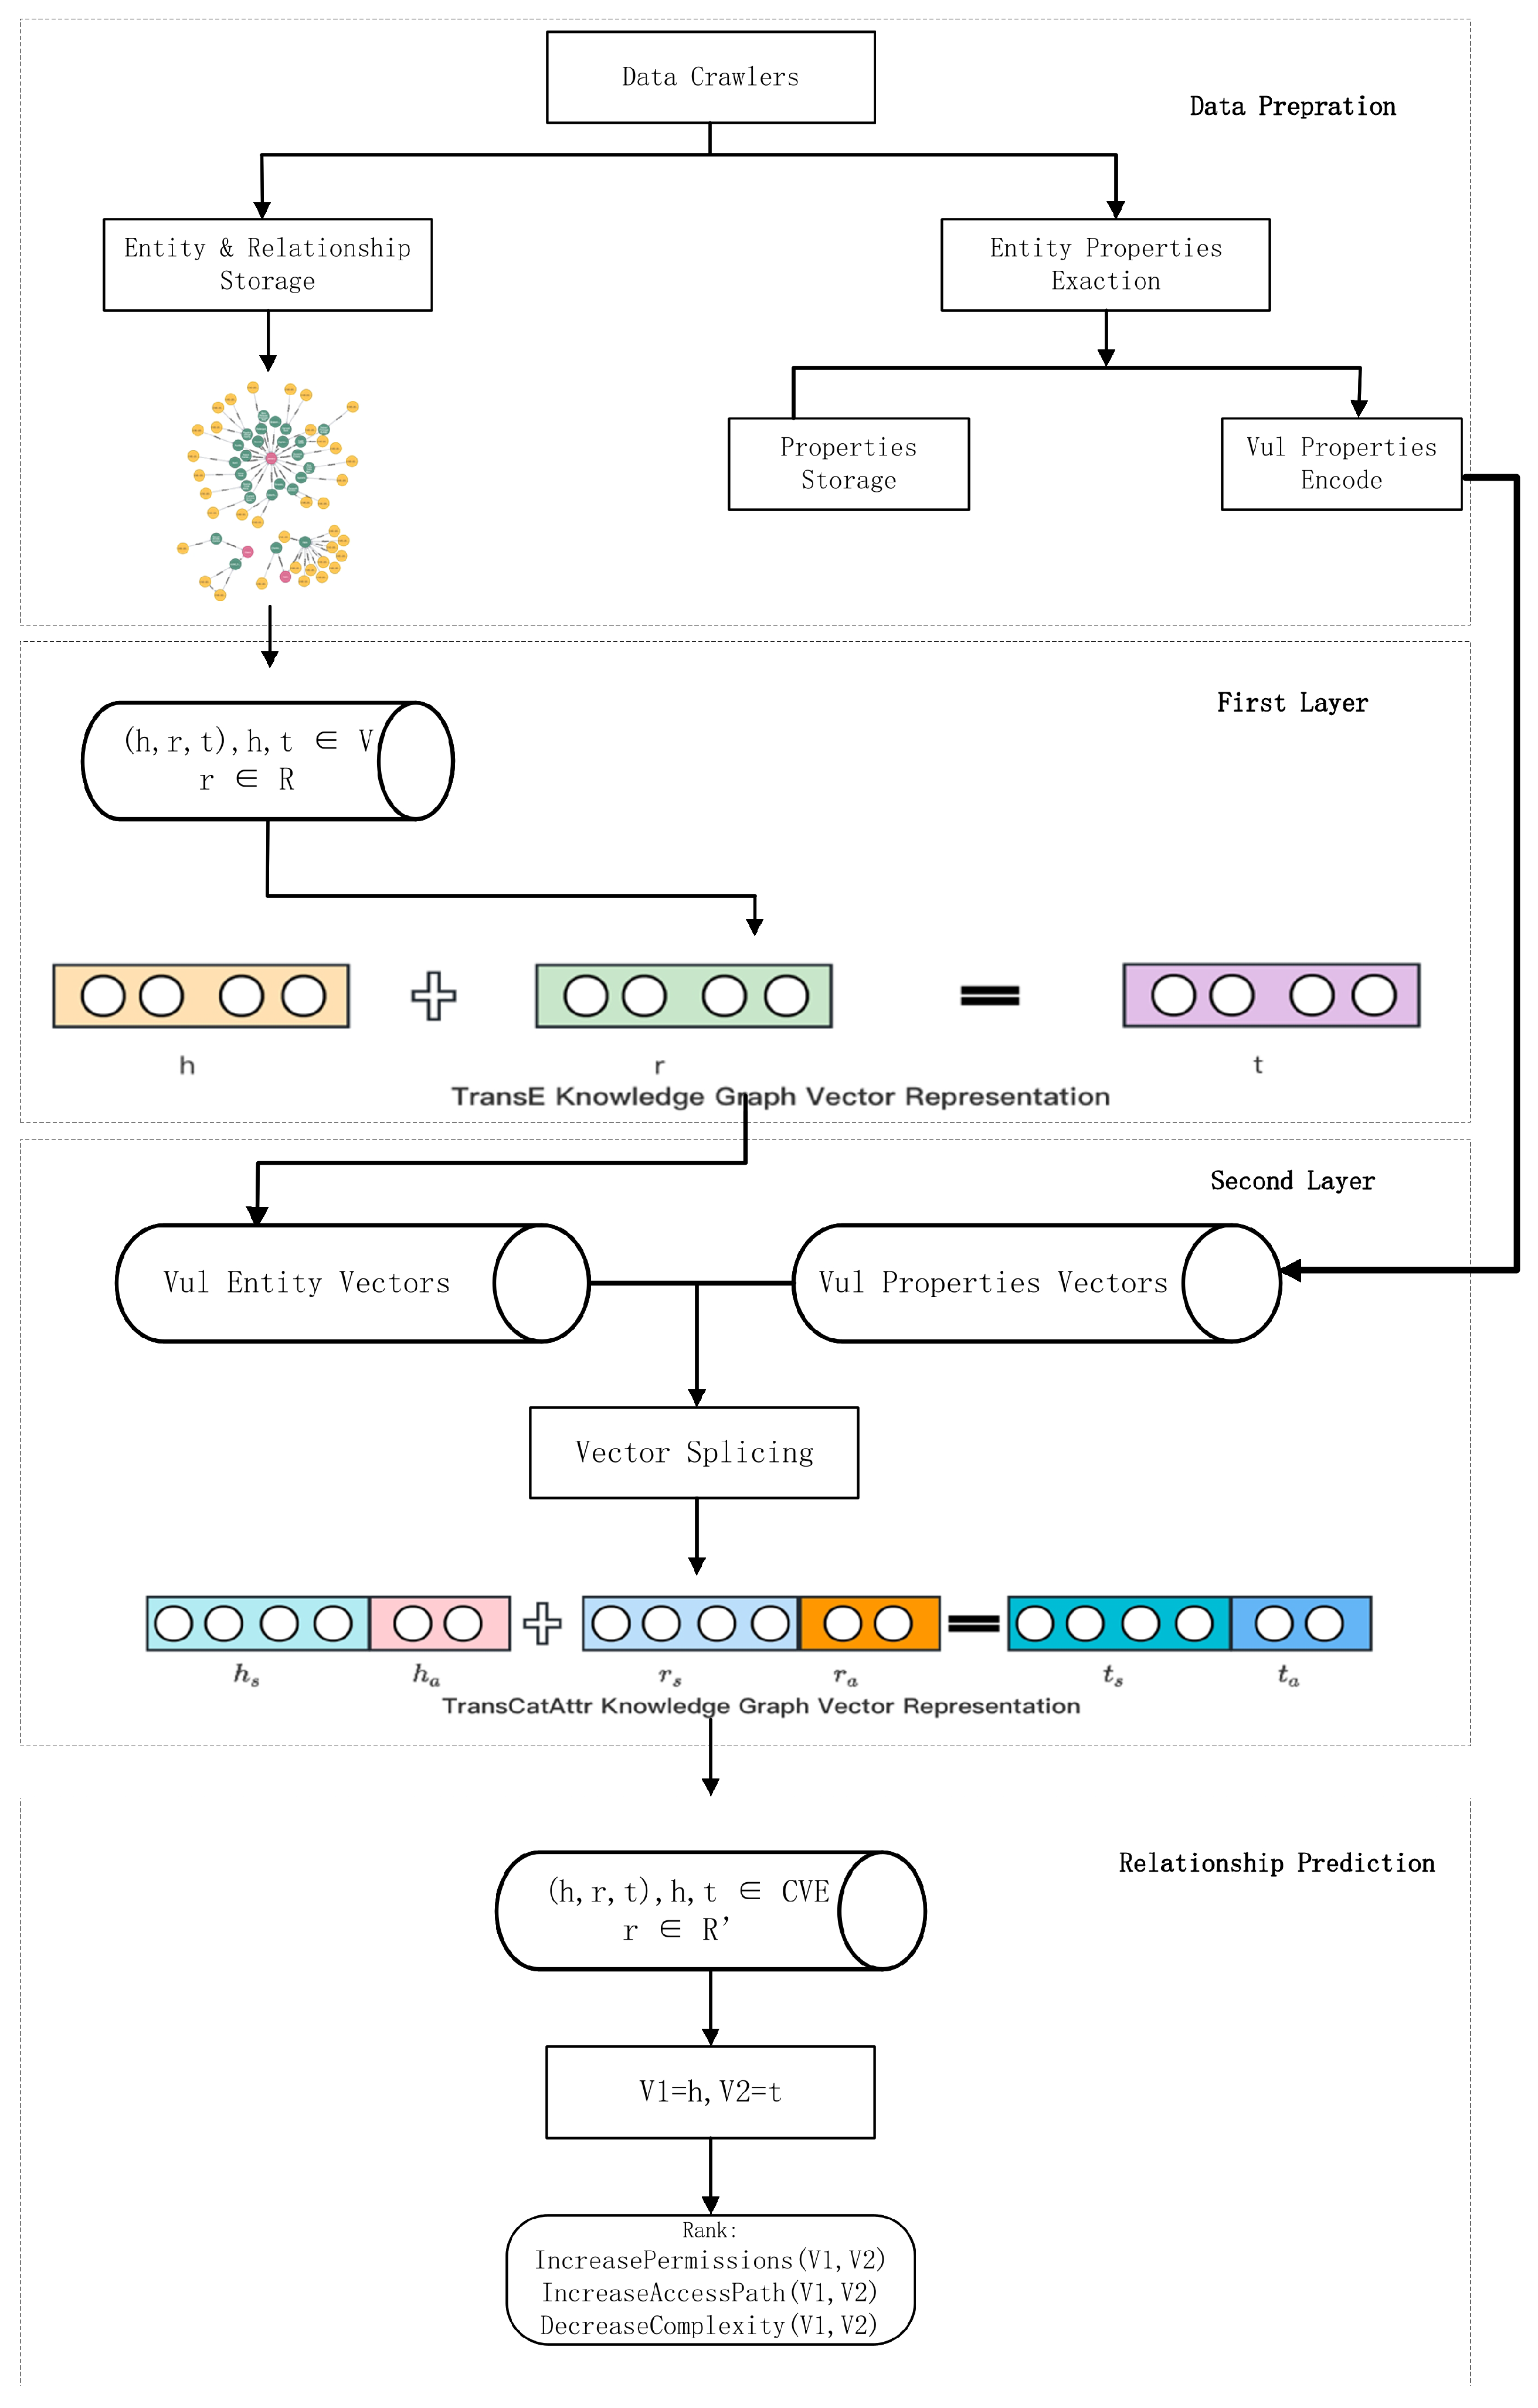
  • This paper proposes a two-layer knowledge representation learning model that introduces entity attribute information during the knowledge representation learning process, enabling more accurate embedding of entity nodes and thereby enhancing the prediction accuracy of influence relationships among vulnerability entities. Firstly, a knowledge graph of vulnerabilities in the cybersecurity domain is constructed, and the meanings of entities and relationships within the vulnerability knowledge graph are elaborated in detail. Multiple-attribute information of vulnerabilities is analyzed and summarized. Secondly, the proposed two-layer knowledge representation learning model is utilized to represent entities and relationships in vector form. Each vulnerability entity is divided into two parts for representation: one based on structure and the other on attribute information, to better depict the actual meaning of vulnerability entities. Finally, a vulnerability knowledge graph comprising 96,261 entities and 398,220 relationships is constructed, and experiments are conducted on this graph to predict the influence relationships among vulnerability entities. The results demonstrate that the proposed model outperforms the TransE model.
  • A vulnerability risk calculation model oriented towards influence relationships is proposed, which realizes the risk assessment and ranking of vulnerabilities existing in network scenarios. This model incorporates factors such as the importance of network devices, the connectivity between devices, and the influence relationships among vulnerabilities. It initializes the model by constructing network device connectivity matrices, device vulnerability matrices, vulnerability relationship matrices, and setting relevant weight parameters. An iterative method is employed to calculate the risk scores and rankings of devices and vulnerabilities, enabling risk assessments of both. Experimental results demonstrate that the proposed vulnerability risk calculation model oriented towards influence relationships can more reasonably evaluate the actual risks of vulnerabilities in specific network scenarios.
  • A network risk model based on Bayesian attack graphs (BAGs) is proposed, which enables risk assessment of device nodes in a network. Firstly, a BAG incorporating the influence relationships among vulnerabilities is defined to model the network environment. Secondly, for vulnerability nodes, the exploitation probability is quantified by considering the influence relationships among vulnerabilities. For network device nodes, the conditional probability is calculated based on the parent vulnerability nodes of the device condition nodes. The reachability probability of the device condition nodes is then derived using the joint conditional probability of the current node and its parent nodes, thereby inferring the likelihood of an attacker successfully compromising the device within a given network topology. This provides cybersecurity managers with insights for defense strategy support. Finally, compared to the original BAG method, the proposed model offers a more accurate assessment of the risks associated with the exploitation of vulnerabilities and the compromise of devices within the network.

6. Conclusions

This article studies the automatic prediction of the impact relationship between vulnerabilities, and then proposes a vulnerability risk calculation model and a network risk assessment model based on the Bayesian attack graph of the impact relationship. The proposed model has achieved good performance. However, this study still has certain limitations in terms of depth and breadth. In order to further improve the accuracy and practicality of the model, future research can introduce more advanced neural network methods, such as ConvKB and graph attention network (GAT). These methods have unique advantages in handling complex graph structured data and relationship modeling, and are expected to bring better results for predicting vulnerability impact relationships and risk assessment. Meanwhile, in order to cope with large-scale network environments, using single hot encoding may lead to issues such as high dimensionality. In future research, other encoding techniques such as frequency and target encoding will be used to make it suitable for large datasets.

Author Contributions

Conceptualization, W.L. and J.J.; methodology, W.L.; software, W.L.; validation, W.L. and J.J.; formal analysis, W.L.; investigation, W.L.; resources, W.L.; data curation, W.L.; writing—original draft preparation, W.L.; writing—review and editing, J.J. and D.G. All authors have read and agreed to the published version of the manuscript.

Funding

This paper is supported by the Beijing Advanced Innovation Center for Future Blockchain and Privacy Computing (No: GJJ-23).

Data Availability Statement

Data are contained within the article.

Acknowledgments

We would like to thank the anonymous reviewers for their insightful comments and suggestions.

Conflicts of Interest

The authors declare no conflicts of interest.

Appendix A

Appendix A.1

Table A1 provides a detailed list of multidimensional attribute information about software vulnerabilities, covering the basic identification of vulnerabilities (such as CVE number, operating system impact, vulnerability type, etc.), exploitation conditions (such as access vector, required permissions, user interaction, etc.), and detailed classification of exploitation results (such as permission elevation, system command execution, data access, etc.).
Table A1. Vulnerability entity attributions.
Attribution TypeAttribution NameAttribution MeaningAttribution Value
Base attributions of the vulnerabilityCVE-IDCVE numberFor example CVE-2019-6551
Product At OSThe operating system where Influenced the product is locatedLinux/Windows/Mac/
Android/iOS
TypeVulnerability typeSql Injection, XSS, Directory Traversal, DOS, Code Execution, Overflow, Memory Corruption, Bypass, Gain Privileges, CSRF, File Inclusion, Gain Information, Http Response Splitting
CWE-IDCWE numberFor example CWE-79
Published DateVulnerability published dateFor example 2021 October 21
Last ModifiedVulnerability last modified dateFor example 2021 November 23
Condition attributions of vulnerability exploitationAccess VectorLocal/Adjacent Network/Remote Network/Physical
AuthenticationDoes vulnerability exploitation
require authentication?
Multiple/Single/None
Access ComplexityVulnerability exploitation complexityHigh/Low
Privileges RequiredPermissions required for
vulnerability exploitation
High/Low/None
Read & WriteRead and write permissions required for
vulnerability exploitation
Overall/None/Write Access/Read Access
UserDoes the exploitRequire/None
User InteractionDoes the exploit require user interaction?
Impact attributions of vulnerability exploitationAccess ApplicationAbility to access the system or applicationYes/No
Gain PrivilegeGained privilege after
vulnerability exploitation
Root/administrator/User/None
Execute System CommandAbility to execute system commandsYes/(System/Root)/No

Appendix A.2

This article uses the vulnerability scanning tool Nessus to obtain experimental network topology information, open services, and vulnerability information, and then configures this information in the corresponding settings file of the open-source attack graph generation tool MulVAL to generate the original attack graph. Due to the fact that the attack graph generated by MulVAL does not distinguish between the impact relationship of vulnerabilities, it is necessary to adjust the attack graph. We extract the vulnerability node and the device condition node, and mark the “and”, “or”, “IncreasePermissions”, “IncreaseAccessPath”, and “DecreaseComplexity” impact relationships between vulnerabilities. The adjusted full campus network attack diagram in this article is shown in Figure A1.
Figure A1. Network Attack Graph.
Electronics 13 03350 g0a1

Appendix A.3

Within the framework of Petri Nets, we consider network devices as Places, which represent entities or resources in the network, and vulnerability events are simulated as Transitions, which reflect the possible state changes or event triggers that may occur due to the existence of vulnerabilities. During the construction process, we first model the device nodes and potential vulnerability events in the network. We quantify the characteristics of each device, their interrelationships, and potential threats they may face. Based on this information, an initial Petri Net model is constructed, as shown in Figure A2. Subsequently, using the constructed Petri Net model, potential threats and attack paths that may occur in the network environment are simulated. By simulating the triggering sequence of transitions in different scenarios, we predict the security risks that the network may face. Finally, based on the simulation results, the risk probability of each device node is inferred. By comprehensively considering the frequency of transition triggers, internode dependencies, and the severity of potential vulnerabilities, we evaluate and quantify the security risks of each node.
Figure A2. Petri net model.
Electronics 13 03350 g0a2

References

  1. National Vulnerability Database. Available online: https://nvd.nist.gov (accessed on 20 September 2022).
  2. Williams, M.A.; Dey, S.; Camacho Barranco, R.; Motahar Naim, S.; Hossain, M.S.; Akbar, M. Analyzing Evolving Trends of Vulnerabilities in National Vulnerability Database. In Proceedings of the 2018 IEEE International Conference on Big Data, Big Data 2018, Seattle, WA, USA, 10–13 December 2018; IEEE: Piscataway, NJ, USA, 2018; pp. 3011–3020. [Google Scholar]
  3. Wang, W.; Shi, F.; Zhang, M.; Xu, C.; Zheng, J. A Vulnerability Risk Assessment Method Based on Heterogeneous Information Network. IEEE Access 2020, 8, 148315–148330. [Google Scholar] [CrossRef]
  4. Cheng, P.; Wang, L.; Jajodia, S.; Singhal, A. Aggregating CVSS base scores for semantics-rich network security metrics. In Proceedings of the IEEE Symposium on Reliable Distributed Systems, Irvine, CA, USA, 8–11 October 2012; IEEE: Piscataway, NJ, USA, 2012; pp. 31–40. [Google Scholar]
  5. Monostori, L.; Kádár, B.; Bauernhansl, T.; Kondoh, S.; Kumara, S.; Reinhart, G.; Sauer, O.; Schuh, G.; Sihn, W.; Ueda, K. Cyber-physical systems in manufacturing. CIRP Ann. Manuf. Technol. 2016, 65, 621–641. [Google Scholar] [CrossRef]
  6. Sridhar, S.; Hahn, A.; Govindarasu, M. Cyber–physical system security for the electric power grid. Proc. IEEE 2012, 100, 210–224. [Google Scholar] [CrossRef]
  7. Liang, X.; Xiao, Y. Game theory for network security. IEEE Commun. Surv. Tutor 2013, 15, 472–486. [Google Scholar] [CrossRef]
  8. Jiang, W.; Zhan, J. A modified combination rule in generalized evidence theory. Appl. Intell. 2017, 46, 630–640. [Google Scholar] [CrossRef]
  9. Zheng, Z.; Sun, P. Application of RBF neural network in network security risk assessment. In Proceedings of the 2011 International Conference on Computer Science and Applications, Antwerp, Belgium, 26 March 2011; pp. 43–46. [Google Scholar]
  10. Liang, L.; Yang, J.; Liu, G.; Zhu, G.; Yang, Y. Novel method of assessing network security risks based on vulnerability correlation graph. In Proceedings of the 2012 IEEE 2nd International Conference on Computer Science and Network Technology (ICCSNT), Changchun, China, 29–31 December 2012; pp. 1085–1090. [Google Scholar]
  11. Sheyner, O.; Wing, J. Tools for Generating and Analyzing Attack Graphs; Springer: Berlin/Heidelberg, Germany, 2003. [Google Scholar]
  12. Zhu, Y.; Du, Z. Research on the Key Technologies of Network Security-Oriented Situation Prediction. Sci. Program. 2021, 2021, 5527746. [Google Scholar] [CrossRef]
  13. Zhou, Y.Y. Risk assessment method for network attack surface based on Bayesian attack graph. Chin. J. Netw. Inf. Secur. 2018, 4, 11–22. [Google Scholar] [CrossRef]
  14. Huang, K.; Zhou, C.; Tian, Y.C.; Yang, S.; Qin, Y. Assessing the physical impact of cyberattacks on industrial cyber physical systems. IEEE Trans. Ind. Electron. 2018, 65, 8153–8162. [Google Scholar] [CrossRef]
  15. Wang, H.; Chen, Z.; Feng, X.; Di, X.; Liu, D.; Zhao, J.; Sui, X. Research on Network Security Situation Assessment and Quantification Method Based on Analytic Hierarchy Process. Wirel. Pers. Commun. 2018, 102, 1401–1420. [Google Scholar] [CrossRef]
  16. Kotenko, I.; Doynikova, E. Security assessment of computer networks based on attack graphs and security events. In Proceedings of the Information & Communication Technology-EurAsia Conference, Bali, Indonesia, 14–17 April 2014; pp. 462–471. [Google Scholar]
  17. Lallie, H.S.; Debattista, K.; Bal, J. A review of attack graph and attack tree visual syntax in cyber security. Comput. Sci. Rev. 2020, 35, 100219. [Google Scholar] [CrossRef]
  18. Wang, H.; Chen, Z.; Zhao, J.; Di, X.; Liu, D. A Vulnerability Assessment Method in Industrial Internet of Things Based on Attack Graph and Maximum Flow. IEEE Access 2018, 6, 8599–8609. [Google Scholar] [CrossRef]
  19. Lee, J.; Moon, D.; Kim, I.; Lee, Y. A semantic approach to improving machine readability of a large-scale attack graph. J. Supercomput. 2019, 75, 3028–3045. [Google Scholar] [CrossRef]
  20. Poolsappasit, N.; Dewri, R.; Ray, I. Dynamic security risk management using Bayesian attack graphs. IEEE Trans. Dependable Secur. Comput. 2012, 9, 61–74. [Google Scholar] [CrossRef]
  21. Munoz-Gonzalez, L.; Sgandurra, D.; Barrere, M.; Lupu, E.C. Exact Inference Techniques for the Analysis of Bayesian Attack Graphs. IEEE Trans. Dependable Secur. Comput. 2019, 16, 231–244. [Google Scholar] [CrossRef]
  22. Lu, J.; Su, P.; Yang, M.; He, L.; Zhang, Y.; Zhu, X.; Lin, H. Software and Cyber Security—A Survey. Ruan Jian Xue Bao/J. Softw. 2016, 29, 42–68. (In Chinese) [Google Scholar]
  23. Du, Y.; Lu, Y. A weakness relevance evaluation method based on pagerank. In Proceedings of the 2019 IEEE 4th International Conference on Data Science in Cyberspace, Hangzhou, China, 23–25 June 2019; IEEE: Piscataway, NJ, USA, 2019; pp. 422–427. [Google Scholar]
  24. Han, Z.; Li, X.; Liu, H.; Xing, Z.; Feng, Z. DeepWeak: Reasoning common software weaknesses via knowledge graph embedding. In Proceedings of the 25th IEEE International Conference on Software Analysis, Evolution and Reengineering, Campobasso, Italy, 20–23 March 2018; IEEE: Piscataway, NJ, USA, 2018; pp. 456–466. [Google Scholar]
  25. Wang, Q.; Mao, Z.; Wang, B.; Guo, L. Knowledge graph embedding: A survey of approaches and applications. IEEE Trans. Knowl. Data Eng. 2017, 29, 2724–2743. [Google Scholar] [CrossRef]
  26. Bollacker, K.; Evans, C.; Paritosh, P.; Sturge, T.; Taylor, J. Freebase: A collaboratively created graph database for structuring human knowledge. In Proceedings of the ACM SIGMOD International Conference on Management of Data, Houston, TX, USA, 10–15 June 2008; pp. 1247–1249. [Google Scholar]
  27. Lehmann, J.; Isele, R.; Jakob, M.; Jentzsch, A.; Kontokostas, D.; Mendes, P.N.; Hellmann, S.; Morsey, M.; Van Kleef, P.; Auer, S.; et al. DBpedia—A large-scale, multilingual knowledge base extracted from Wikipedia. Semant. Web 2015, 6, 167–195. [Google Scholar] [CrossRef]
  28. Fabian, M.; Gjergji, K.; Gerhard, W. Yago: A Core of Semantic Knowledge Unifying WordNet and Wikipedia. In Proceedings of the 16th International World Wide Web Conference, Banff, AL, Canada, 8–12 May 2007. [Google Scholar]
  29. Carlson, A.; Betteridge, J.; Kisiel, B.; Settles, B.; Hruschka, E.R.; Mitchell, T.M. Toward an architecture for never-ending language learning. In Proceedings of the National Conference on Artificial Intelligence, Atlanta, GA, USA, 11–15 July 2010; pp. 1306–1313. [Google Scholar]
  30. Ji, S.; Pan, S.; Cambria, E.; Marttinen, P.; Yu, P.S. A Survey on Knowledge Graphs: Representation, Acquisition, and Applications. IEEE Trans. Neural Netw. Learn. Syst. 2022, 33, 494–514. [Google Scholar] [CrossRef]
  31. Li, Z.; Liu, H.; Zhang, Z.; Liu, T.; Xiong, N.N. Learning Knowledge Graph Embedding with Heterogeneous Relation Attention Networks. IEEE Trans. Neural Netw. Learn. Syst. 2022, 33, 3961–3973. [Google Scholar] [CrossRef]
  32. Du, H.; Wang, Z.; Nie, H.; Yao, Q.; Li, X. Multi-scale dilated convolutional network for knowledge graph embedding. Sci. China Inf. 2022, 52, 1204–1220. [Google Scholar]
  33. Chen, Z.; Wang, Y.; Zhao, B.; Cheng, J.; Zhao, X.; Duan, Z. Knowledge graph completion: A review. IEEE Access 2020, 8, 192435–192456. [Google Scholar] [CrossRef]
  34. Shen, Y.; Ding, N.; Zheng, H.T.; Li, Y.; Yang, M. Modeling Relation Paths for Knowledge Graph Completion. IEEE Trans. Knowl. Data Eng. 2021, 33, 3607–3617. [Google Scholar] [CrossRef]
  35. Bayrak, B.; Choupani, R.; Dogdu, E. Link Prediction in Knowledge Graphs with Numeric Triples Using Clustering. In Proceedings of the 2020 IEEE International Conference on Big Data, Big Data 2020, Virtual, 10–13 December 2020; pp. 4492–4498. [Google Scholar]
  36. Zhao, F.; Xu, T.; Jin, L.; Jin, H. Convolutional Network Embedding of Text-Enhanced Representation for Knowledge Graph Completion. IEEE Internet Things J. 2021, 8, 16758–16769. [Google Scholar] [CrossRef]
  37. Hong, W.; Li, S.; Hu, Z.; Rasool, A.; Jiang, Q.; Weng, Y. Improving Relation Extraction by Knowledge Representation Learning. In Proceedings of the International Conference on Tools with Artificial Intelligence, ICTAI 2021-November, Virtual, 1–3 November 2021; pp. 1211–1215. [Google Scholar]
  38. Bordes, A.; Usunier, N.; Garcia-Durán, A.; Weston, J.; Yakhnenko, O. Translating embeddings for modeling multi-relational data. Adv. Neural Inf. Process. Syst. 2013, 26, 1–9. [Google Scholar]
  39. Berant, J.; Chou, A.; Frostig, R.; Liang, P. Semantic parsing on freebase from question-answer pairs. In Proceedings of the 2013 Conference on Empirical Methods in Natural Language Processing (EMNLP 2013), Seattle, WA, USA, 18–21 October 2013; pp. 1533–1544. [Google Scholar]
  40. Lin, Y.; Liu, Z.; Sun, M.; Liu, Y.; Zhu, X. Learning Entity and Relation Embeddings for Knowledge Graph Completion. In Proceedings of the 29th AAAI Conference on Artificial Intelligence, Austin, TX, USA, 25–30 January 2015; pp. 2181–2187. [Google Scholar]
  41. Ji, G.; He, S.; Xu, L.; Liu, K.; Zhao, J. Knowledge graph embedding via dynamic mapping matrix. In Proceedings of the ACL-IJCNLP 2015—53rd Annual Meeting of the Association for Computational Linguistics and the 7th International Joint Conference on Natural Language Processing of the Asian Federation of Natural Language Processing, Beijing, China, 26–31 July 2015; pp. 687–696. [Google Scholar]
  42. Yang, R.; Wei, Z.; Fan, Y.; Zhao, J. A Few-Shot Inductive Link Prediction Model in Knowledge Graphs. IEEE Access 2022, 10, 97370–97380. [Google Scholar] [CrossRef]
  43. Wang, X.; He, X.; Cao, Y.; Liu, M.; Chua, T. KGAT: Knowledge Graph Attention Network for Recommendation. In Proceedings of the 25th ACM SIGKDD International Conference on Knowledge Discovery & Data Mining, Anchorage, AK, USA, 4–8 August 2019. [Google Scholar]
  44. CVSS. Available online: https://www.first.org/cvss/ (accessed on 1 November 2023).
Figure 1. Relationship I n c r e a s e P e r m i s s i o n s schematic.
Electronics 13 03350 g001
Figure 2. Relationship I n c r e a s e A c c e s s P a t h schematic.
Electronics 13 03350 g002
Figure 3. Relationship D e c r e a s e C o m p l e x i t y schematic A.
Electronics 13 03350 g003
Figure 4. Relationship D e c r e a s e C o m p l e x i t y schematic B.
Electronics 13 03350 g004
Figure 5. Dual-layer knowledge representation learning model.
Electronics 13 03350 g005
Figure 6. Example of the vulnerability knowledge graph.
Electronics 13 03350 g006
Figure 7. TransCatAttr model loss value change process.
Electronics 13 03350 g007
Figure 8. Vulnerability risk ranking comparison.
Electronics 13 03350 g008
Figure 9. Schematic diagram of Bayesian attack.
Electronics 13 03350 g009
Table 1. CVSS3 vulnerability exploitability metrics.
Indicator NameIndicator Values
PRNone/Low/High
AVNetwork/Adjacent/Local/Physical
ACLow/High
UINone/Required
Table 2. Attack graph symbol.
SymbolMeans
SThe device node for attack status from start to end.
EDependencies between S during the attack occurrence.
VulVulnerability assemble for attack.
RThe relationship between multiple precursor nodes and the successor nodes is represented as R { AND , OR } .
InfImpact relationships between vulnerabilities mentioned in Section 2.
ProAttack the accessibility probability of the S in the graph.
Table 3. Vulnerability knowledge graph data volume.
Entity Node Type/Relationship TypeQuantity (Pcs/Strip)
Vulnerability55,874
Product33,249
Vendor7138
Influence168,406
AffiliatedWith33,368
IncreasePermissions98,254
IncreaseAccessVector20,101
DecreaseComplexity78,091
Table 4. TransCatAttr model hyperparameter setting.
ParametersValueMeaning
embedding_dim111Embedding dimension
l r 0.01Learning rate
margin4.0Loss function margin
norm1L1-norm or L2-norm
c0.25Threshold value
epochs500Model training iteration times
batch_size9600Batch size
Table 5. TransCatAttr and TransE model relationship prediction results.
ModelEntity MREntity Hits@10Relationship MRRelationship Hits@1
TransE19.92%904.5590.98%2
TransCatAttr28.89%760.699.19%1.4
Table 6. Conditional probability of node S4 in Bayesian attack graph.
S2S3P(S4|S2)P(S4|S3)
TrueFalseTrueFalse
TrueTrue0.220.780.280.72
TrueFalse0.220.7801
FalseTrue000.280.72
FalseFalse0001
Disclaimer/Publisher’s Note: The statements, opinions and data contained in all publications are solely those of the individual author(s) and contributor(s) and not of MDPI and/or the editor(s). MDPI and/or the editor(s) disclaim responsibility for any injury to people or property resulting from any ideas, methods, instructions or products referred to in the content.

