Abstract
The DC-side response characteristics of the VSC-HVDC transmission system under AC-side sub-synchronous disturbances may lead to the propagation of AC/DC oscillations, and then there may be non-fundamental frequency oscillation on the DC-side. To clarify the interactive influence mechanism and propagation evolution law of the AC and DC side sub-synchronous oscillations in the VSC-HVDC transmission system, the frequency characteristics of the DC-side oscillation power are investigated by considering the effect of converter control links. First, the AC-side voltage and current frequency responses under single/multiple SSO components are analyzed. Secondly, the frequency characteristics of the DC-side power after the injection of single/multiple SSO components are investigated. Meanwhile, the effect of system control parameters on the sub-synchronous responses of the DC-side power is investigated. Finally, the theoretical analysis is verified with PSCAD/EMTDC simulations. The results show that under the influence of the AC-side SSO components, the DC-side of VSC-HVDC faces the risk of multi-frequency oscillations; when there are multiple SSO components on the AC-side, there is a coupling between the components, and the system control parameters affect the amplitude of the DC-side oscillation power.
1. Introduction
The VSC-HVDC transmission system has the advantages of flexible control ability, low harmonic component, power supply for passive system, etc., which has been rapidly developed in the field of large-capacity long-distance transmission [1,2,3]. However, due to the large number of power electronic devices connected to the power systems, a series of SSO issues have arisen.
The SSO phenomenon was observed during the trial operation of the Shanghai Nanhui wind power via the VSC-HVDC project [4], and the SSO phenomenon occurred when wind turbines were connected to the weak AC grid at Xinjiang Hami region in 2015 [5], thus threatening the system stable operation. These studies attribute the SSOs to the increasing number of power electronic devices in the power systems due to the access to wind power. The interactions of power electronic devices/power grids are prone to cause the SSO phenomenon on the AC- side. However, few studies have focused on the propagation of SSOs on the AC and DC sides of the wind power via the VSC-HVDC system, which may bring new risks and pitfalls for the VSC-HVDC system’s stable operation. Therefore, it is urgent to study the response characteristics and mechanism of the AC and DC sides of the wind power via the VSC-HVDC system when SSO occurs.
The SSO analysis methods for power electronic power systems are mainly time domain analysis [6,7], eigenvalue analysis [8,9,10,11], impedance analysis [12,13,14,15], the complex torque coefficient analysis method [16,17], and the transfer function analysis method [18]. The literature [6] investigated the SSO characteristics triggered by a static reactive power compensator in a weak grid using the time domain analysis method. The effect of phase-locked loop (PLL) on the VSC-HVDC characteristics is investigated with the eigenvalue method in [11], but the eigenvalue transfer function is relatively complex and requires extensive calculations. The literature [14] develops an impedance model for the PLL-based VSCs that can be used to assess system-level converter-grid compatibility and power quality. The literature [15] analyzes the interaction of synchronous generators on the AC- side based on the impedance analysis method, and the effect of controller parameters on the interaction is analyzed. The literature [16] analyzed the SSO risks before and after the connection of the VSC-HVDC with the complex torque coefficient analysis method, and a hybrid damping control strategy for the VSC-HVDC was proposed. The above literature has carried out in-depth research on the response mechanism and influencing factors of SSOs. However, the phenomenon of the system generating multiple frequency components under SSOs has not been analyzed. Meanwhile, most focus has been put on the response characteristics of wind turbines or weak grids under sub-synchronous disturbances, but the multi-frequency response analysis of the VSC-HVDC system under AC sub-synchronous disturbances is not addressed. The literature [18] analyzed the current responses of the wind turbine to the SSO component, but the frequency component characteristics of the VSC-HVDC SSO oscillating power are not addressed.
Currently, the AC-side or DC-side oscillation characteristics of wind power via the VSC-HVDC system are generally analyzed separately [19,20,21,22,23,24]. The literature [19] shows that in a doubly-fed wind turbine via a VSC-HVDC system, the SSO current component appears on the VSC-HVDC AC- side due to the wind turbine cutover. The literature [20] shows that there is a risk of SSO on the AC- side of the VSC-HVDC system when multiple direct-drive turbines are connected to the VSC-HVDC. The literature [21] investigated the effect of the AC system and PLL on the DC-side current oscillation characteristics. The literature [22] proposed a method to suppress the DC-side oscillation of the VSC-HVDC system based on a superconducting magnetic energy storage device. The literature [23] established the DC-side impedance model of the island VSC-HVDC system with the impedance analysis method, and the DC-side SSO mechanism was revealed. The literature [24] analyzed the DC-side SSO mechanism of the VSC-HVDC system from the perspectives of its impedance characteristics, switching frequency characteristics, and system control damping. Although the above literature considers the oscillation mechanism of the AC or DC side of the system, respectively, the possible interaction between the AC and DC networks is ignored [25], which may bring certain errors in the system stability analysis. Meanwhile, the AC–DC coupled SSO problem may cause serious hazards such as wind turbine off-grid and DC transmission line power dipping [26]. For the response characteristics under the SSO disturbances, existing studies mainly focused on the frequency response characteristics under a single SSO disturbance component [27,28]. The nonlinear controllers proposed in [29] have a process of weight factor adjustment, which is complicated. The PI controller used in this paper is simple and easy to implement. The dq control structures are usually associated with PI controllers, and they perform well in controlling DC variables [30]. Moreover, the use of cross-coupling terms combined with voltage feedforward in this paper also improves the performance of the PI controller [31]. The literature [32,33] points out that forced oscillations will be induced when there is a continuous small periodic disturbance in the system and the frequency of the disturbance is close to the intrinsic frequency of the system. In this paper, there is no disturbance frequency close to the SSO component within the VSC-HVDC system, so the oscillation case discussed in this paper is not a forced oscillation.
In summary, the SSO response mechanism and frequency component analysis of wind power via the VSC-HVDC system are seldom involved at present. Therefore, this paper firstly derives the response of AC-side voltage and current of the VSC-HVDC system under the AC sub-synchronous disturbance. Secondly, the frequency response characteristics of the VSC-HVDC under single/multiple SSO disturbance components are analyzed by considering the role of converter inner-loop control. Finally, the effect of system control parameters on the DC-side power is analyzed.
2. VSC-HVDC System Structure
The structure of a typical VSC-HVDC system is shown in Figure 1, which mainly includes AC and DC circuit parts. The AC and DC circuit sections mainly include the AC power source, SSO disturbance source, grid inductor, VSC, and DC line. The rectifier station of the VSC-HVDC system adopts constant active power control, and the inverter station adopts constant DC voltage control. Figure 2 shows the current control loop of the VSC. The inner loop current control outputs udref and uqref correspond to the VSC output voltage’s d and q axis components, respectively.
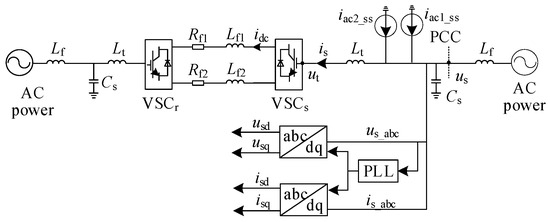
Figure 1.
Block diagram of the VSC-HVDC system structure.
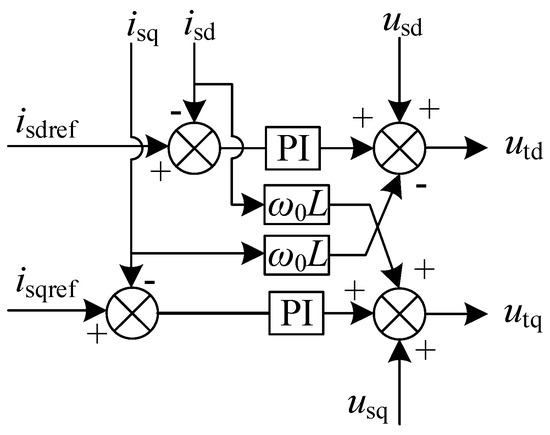
Figure 2.
Control block diagram of rectifier VSC.
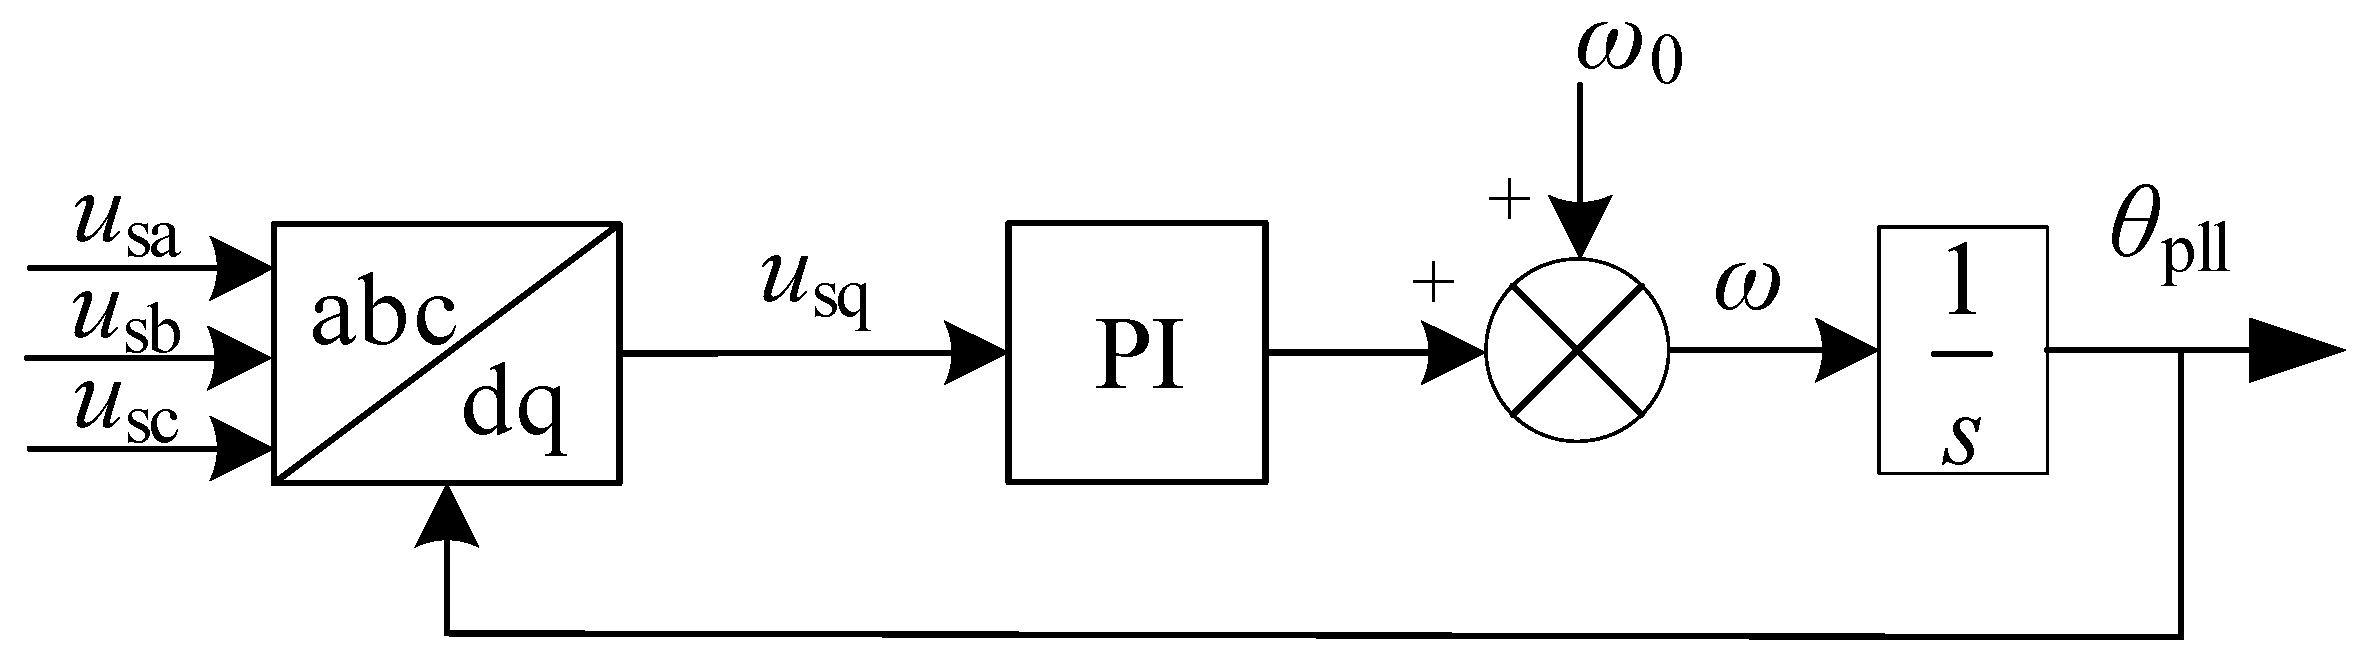
Figure 3 shows the PLL control loop, including the PARK conversion and the q-axis voltage control, where ω0 and θpll are the synchronous angular velocity of the AC grid and the synchronous phase angle measured by the PLL, respectively.
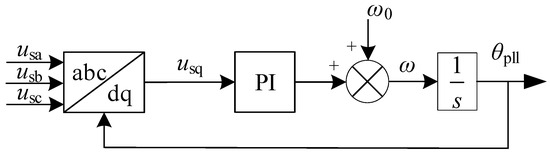
Figure 3.
PLL control system block diagram.
3. DC Power Frequency Characteristics under AC-Side SSO Perturbation
When SSO occurs in the AC-side of the VSC-HVDC system, the response of the AC-side voltage and current is firstly analyzed by considering the VSC inner-loop control, and then the expression of DC-side power is obtained. This section investigates the DC-side power response characteristics based on the system shown in Figure 1. The three-phase fundamental frequency current and SSO current, when the SSO current iac1_ss is injected into the AC-side point of common coupling (PCC), are
Noting the three-phase current at the PCC of the rectifier AC system as is_abc, is_abc is then
System three-phase current disturbances lead to three-phase voltage fluctuations, and then the three-phase fundamental frequency voltage and SSO voltage can be expressed as
Noting the three-phase voltage at the PCC of the rectifier AC system as us_abc, us_abc is then
In (1)–(6), If0 and ϕf0 are the amplitude and initial phase of the fundamental frequency current, respectively; Iac1 and ϕs are the amplitude and initial phase of the injected SSO current iac1_ss, respectively; Uf0 and Ψf0 are the amplitude and initial phase of the fundamental frequency voltage, respectively; Uac1 and Ψs are the amplitude and initial phase of the SSO voltage uac1_ss, respectively; and ω0 and ωac1 are the fundamental frequency and the SSO frequency.
3.1. PLL Response Characteristics to SSO Disturbance
The SSO voltage uac1_ss leads to the change in PLL control angle compared to the pre-disturbance period. The change in the PLL control angle affects the response characteristics of the DC-side power. Therefore, the response of the PLL under the SSO perturbation is analyzed in the following. As shown in Figure 3, the PLL control angle is
where ω is the synchronous coordinate rotation angular velocity of PLL output, Kp_pll and Ki_pll are PLL proportional and integral coefficients, respectively, and usq is the q-axis voltage tracked by PLL.
When SSO does not occur, the q-axis voltage satisfies usq0 = 0 and the steady state value of the PLL control angle can be expressed as θa = ω0t. When the SSO voltage exists on the AC-side, the fluctuation in the d and q-axis voltage can be expressed as
where P(θa) is the PARK transformation matrix with the specific expression.
Substituting (9) into (8) gives the q-axis voltage as
It can be known from (7) that the PLL control angle will contain a component with frequency (ω0 − ωac1) under the effect of usq1, which can be expressed as
where M1 is the amplitude of the output phase angle variation and ϕM1 is the initial phase of the output phase angle variation.
When the SSO component exists in the AC-side of the VSC-HVDC rectifier system, a perturbation Δθe will appear in the PLL control angle, which makes the PLL output phase angle change from θa to , and the expression of is
As shown in Figure 3, there is a feedback loop in the PLL control system, and the PLL control angle while considering the perturbation amount affects the PARK transformation of us_abc. Then, a new d/q-axis component appears, and the AC-side d/q-axis current isdq and the voltage usdq can be expressed as
where usdq denotes the d and q-axis voltage at PCC and isdq is the d and q-axis current of the rectifier AC-side.
Since the perturbation angle variation Δθe is small, the trigonometric expression of the PLL output phase can be dealt with a first-order Taylor expansion, which can be expressed as [28]
Substituting (3), (9), and (12) into (13) yields specific expressions for the feedthrough single SSO component and the AC-side d and q axis current components isd1 and isq1, as follows:
where the SSO current is_abc with frequency ωac1 mainly generates two components with frequencies (ω0 − ωac1) and 2(ω0 − ωac1) after abc/dq coordinate transformation. The amplitude of the 2(ω0 − ωac1) frequency component is smaller than that of the (ω0 − ωac1) frequency component. Id1 and Iq1 are the steady-state values of the AC-side d/q-axis currents; Id2 and Iq2 are the amplitudes of the (ω0 − ωac1) frequency components; and Id3 and Iq3 are the amplitudes of the 2(ω0 − ωac1) frequency components.
Considering the effect of PLL disturbances, substituting (6), (9), and (12) into (13) yields the expressions of the AC-side voltage d/q-axis components usd2 and usq2, as shown as
From (1)–(6), it can be seen that the fundamental frequency voltage and SSO voltage in the three-phase voltage us_abc are consistent with the three-phase current is_abc. Therefore, the frequency response components of the AC-side d/q-axis voltages after the PARK transformation are consistent with the AC-side d/q-axis currents. The steady-state values of the AC-side d/q-axis voltages are usd0 and usq0, and the voltages usds and usqs generated under the sub-synchronous current perturbation on the AC-side mainly contain the components of frequencies (ω0 − ωac1) and 2(ω0 − ωac1).
3.2. Response Characteristics of DC Power to Single SSO Component
When the SSO component exists in the AC-side of the wind power via the VSC-HVDC system, it can be known from [34] that the voltage outer-loop control link has a larger time constant and responds more slowly to the SSO disturbance. Therefore, this section analyzes the dynamic responses of the inner-loop current control under SSO disturbances. It can be known from Figure 2 that the d/q axis components of the converter output voltage are
where Kpd, Kpq, Kid, and Kiq represent the proportional and integral coefficients of the d/q axis inner loop PI controllers, respectively; the three-phase current is_abc at the PCC of the rectifier AC system contains the SSO current component iac1_ss; and the d/q-axis current components under the effect of PLL and PARK transformation are isd1 and isq1. Therefore, utd and utq also contain SSO components.
From the equal power on both sides of the AC and DC, it can be concluded that the AC-side power and DC-side power expressions are [35]
where Pac denotes the AC-side power of the VSC-HVDC rectifier system and Pdc denotes the DC-side power of the VSC-HVDC system. Substituting (15) and (17) into (18), the expression for the power on the DC-side after feeding the single SSO component can be obtained, as follows:
where φA1, φA2, φA3, and φA4 denote the phase angles of the doubled to quadrupled frequency components in the (ω0 − ωac1) reference. A0, A1, A2, A3, and A4 represent the steady-state amplitude and the amplitude of the doubled to quadrupled frequency components in the (ω0 − ωac1) reference, respectively. From (19), there are five terms in the DC-side power response components. A0 is the active power of the basic frequency, which is independent of oscillations; the component with frequency (ω0 − ωac1) is generated under the effect of the power frequency component and PLL perturbation component; the component with frequency 2(ω0 − ωac1) is generated under the effect of the power frequency component, PLL perturbation component, and SSO component; and the components with frequencies 3(ω0 − ωac1) and 4(ω0 − ωac1) are generated under the effect of SSO component and PLL perturbation component.
The d/q-axis current response characteristics and DC-side power response characteristics under a single AC-side SSO disturbance are shown in Table 1. It can be seen from Table 1 that the d/q-axis current components contain one and two times the frequency components in the (ω0 − ωac1) reference and the DC-side power contains one to four times the frequency components in the (ω0 − ωac1) reference.

Table 1.
The frequency response characteristics of the DC power under the AC sub-synchronous disturbance.
3.3. Response Characteristics of DC Power to Multiple SSO Components
To obtain the multi-frequency response components of the DC-side power when the AC-side of the VSC-HVDC system is subjected to multiple AC-side SSO components, this section derives the multi-frequency response characteristics of the DC-side power by feeding two AC-side SSO components as an example.
As shown in Figure 1, the second SSO current iac2_ss is superimposed based on the first SSO current, iac1_ss, which is fed at the PCC point of the AC-side, and the expression of the three-phase current i1 s_abc on the AC-side after superposition is
The expression for iac2_ss in (20) is
where Iac2 and ϕs2 are the amplitude and initial phase of the SSO current iac2_ss, respectively; ωac2 is the frequency of the SSO current iac2_ss.
The voltage fluctuation caused by iac2_ss is ωac2Ltiac2_ss and the voltage fluctuation caused by the SSO current iac2_ss is denoted as uac2_ss. The three-phase voltage at the PCC point shown in Figure 1 after the superposition of uac2_ss is denoted as u1 s_abc and the expression of u1 s_abc is
When the SSO component iac2_ss is fed, the PLL phase angle will have a change in Δθe1, and then the PLL phase angle variation changes from Δθe to Δθe2 = Δθe + Δθe1. The PLL output phase angle becomes θvp = θa + Δθe2. Substituting θvp into (9) yields P(θvp), and then the combination of P(θvp), (20), and (13) gives the expressions of the AC d/q axis currents isd2 and isq2 when the two SSO components are fed. The expressions for the AC-side d/q-axis currents isd2 and isq2 are
It can be seen from (23) that the d/q-axis current components contain not only the components with frequencies (ω0 − ωac1) and 2(ω0 − ωac1) resulting from feeding the SSO component iac1_ss alone and the components with frequencies (ω0 − ωac2) and 2(ω0 − ωac2) resulting from feeding the SSO component iac2_ss alone but also the components with frequencies (2ω0 − ωac1 − ωac2) and (ωac1 − ωac2) resulting from the interaction between iac1_ss and iac2_ss.
Based on the analysis of (16) in Section 3.1, the d- and q-axis components usd2 and usq2 of u1 s_abc are consistent with the frequency components of the currents isd2 and isq2 in (23). The d- and q-axis current and voltage equations under the effect of SSO components iac1_ss and iac2_ss are calculated according to (15), (17), and (18). The d- and q-axis voltages and currents considering the SSO quantities are substituted into (18) to derive the DC-side power expression when the SSO components iac1_ss and iac2_ss are fed simultaneously, as shown in (24). The multi-frequency response characteristics of the DC power under multiple AC sub-synchronous disturbances are listed in Table 2.
Table 2.
The multi-frequency response characteristics of the DC power under the multiple AC sub-synchronous disturbances.
It can be seen from Table 2 that m(ω0 − ωac1) and n(ω0 − ωac2) components generated by the simultaneous action of SSO components iac1_ss and iac2_ss are the same as the frequency response components of the DC-side power when the SSO components iac1_ss and iac2_ss are fed individually; u(ωac1 − ωac2) and αω0 − βωac1 − γωac2 (α = β + γ) frequency components are the frequency response components of the DC-side power under the coupling effect of the two SSO components iac1_ss and iac2_ss.
4. Simulation Verification
To verify the frequency response characteristics of the DC-side power under single/multiple AC-side SSO disturbances in Section 3.2 and Section 3.3, the system simulation model of Figure 1 is built in PSCAD/EMTDC. The quantitative selection principles of the system parameters are
- (1)
- The transmission power range of the VSC-HVDC system is 10–400 MW and the regulation range of the operating power is 10~100%. The upper limit of DC is 1.5 kA and the range of DC voltage level is (±10~±200) kV or 350 kV;
- (2)
- The selection principle of filter: considering the harmonic current flowing into the filter from other harmonic sources and considering the effects of system voltage imbalance, filter detuning, and harmonic impedance.
- (3)
- Capacitor selection principles: capacitor energy storage needs to be less than or equal to 5 ms, and it should be able to stabilize the voltage and weaken the coupling effect of the converter station.
- (4)
- Transformer selection principles: its rated capacity is decided by the converter capacity, the valve side voltage, and the converter outlet voltage. It should be designed to prevent the zero sequence current from transferring between the AC and DC systems.
Quantitative selection principles of controller parameters
- (1)
- Selection of proportional coefficient: a small proportional coefficient can be selected and then gradually increases to observe the system responses and adjusted to the appropriate value;
- (2)
- Selection of integral coefficient: it can be adjusted through simulations and is designed to eliminate the steady-state error and maintain stability.
According to the above principles, the system’s main parameters can be designed, as shown in Table 3. SSO currents with frequencies of 40 Hz and 35 Hz are injected at the rectifier PCC point. On this basis, the corresponding frequency response characteristics of the DC-side power are observed.
Table 3.
System main parameters.
4.1. D-Axis Current Response Characteristics to Single/Multiple SSO Components
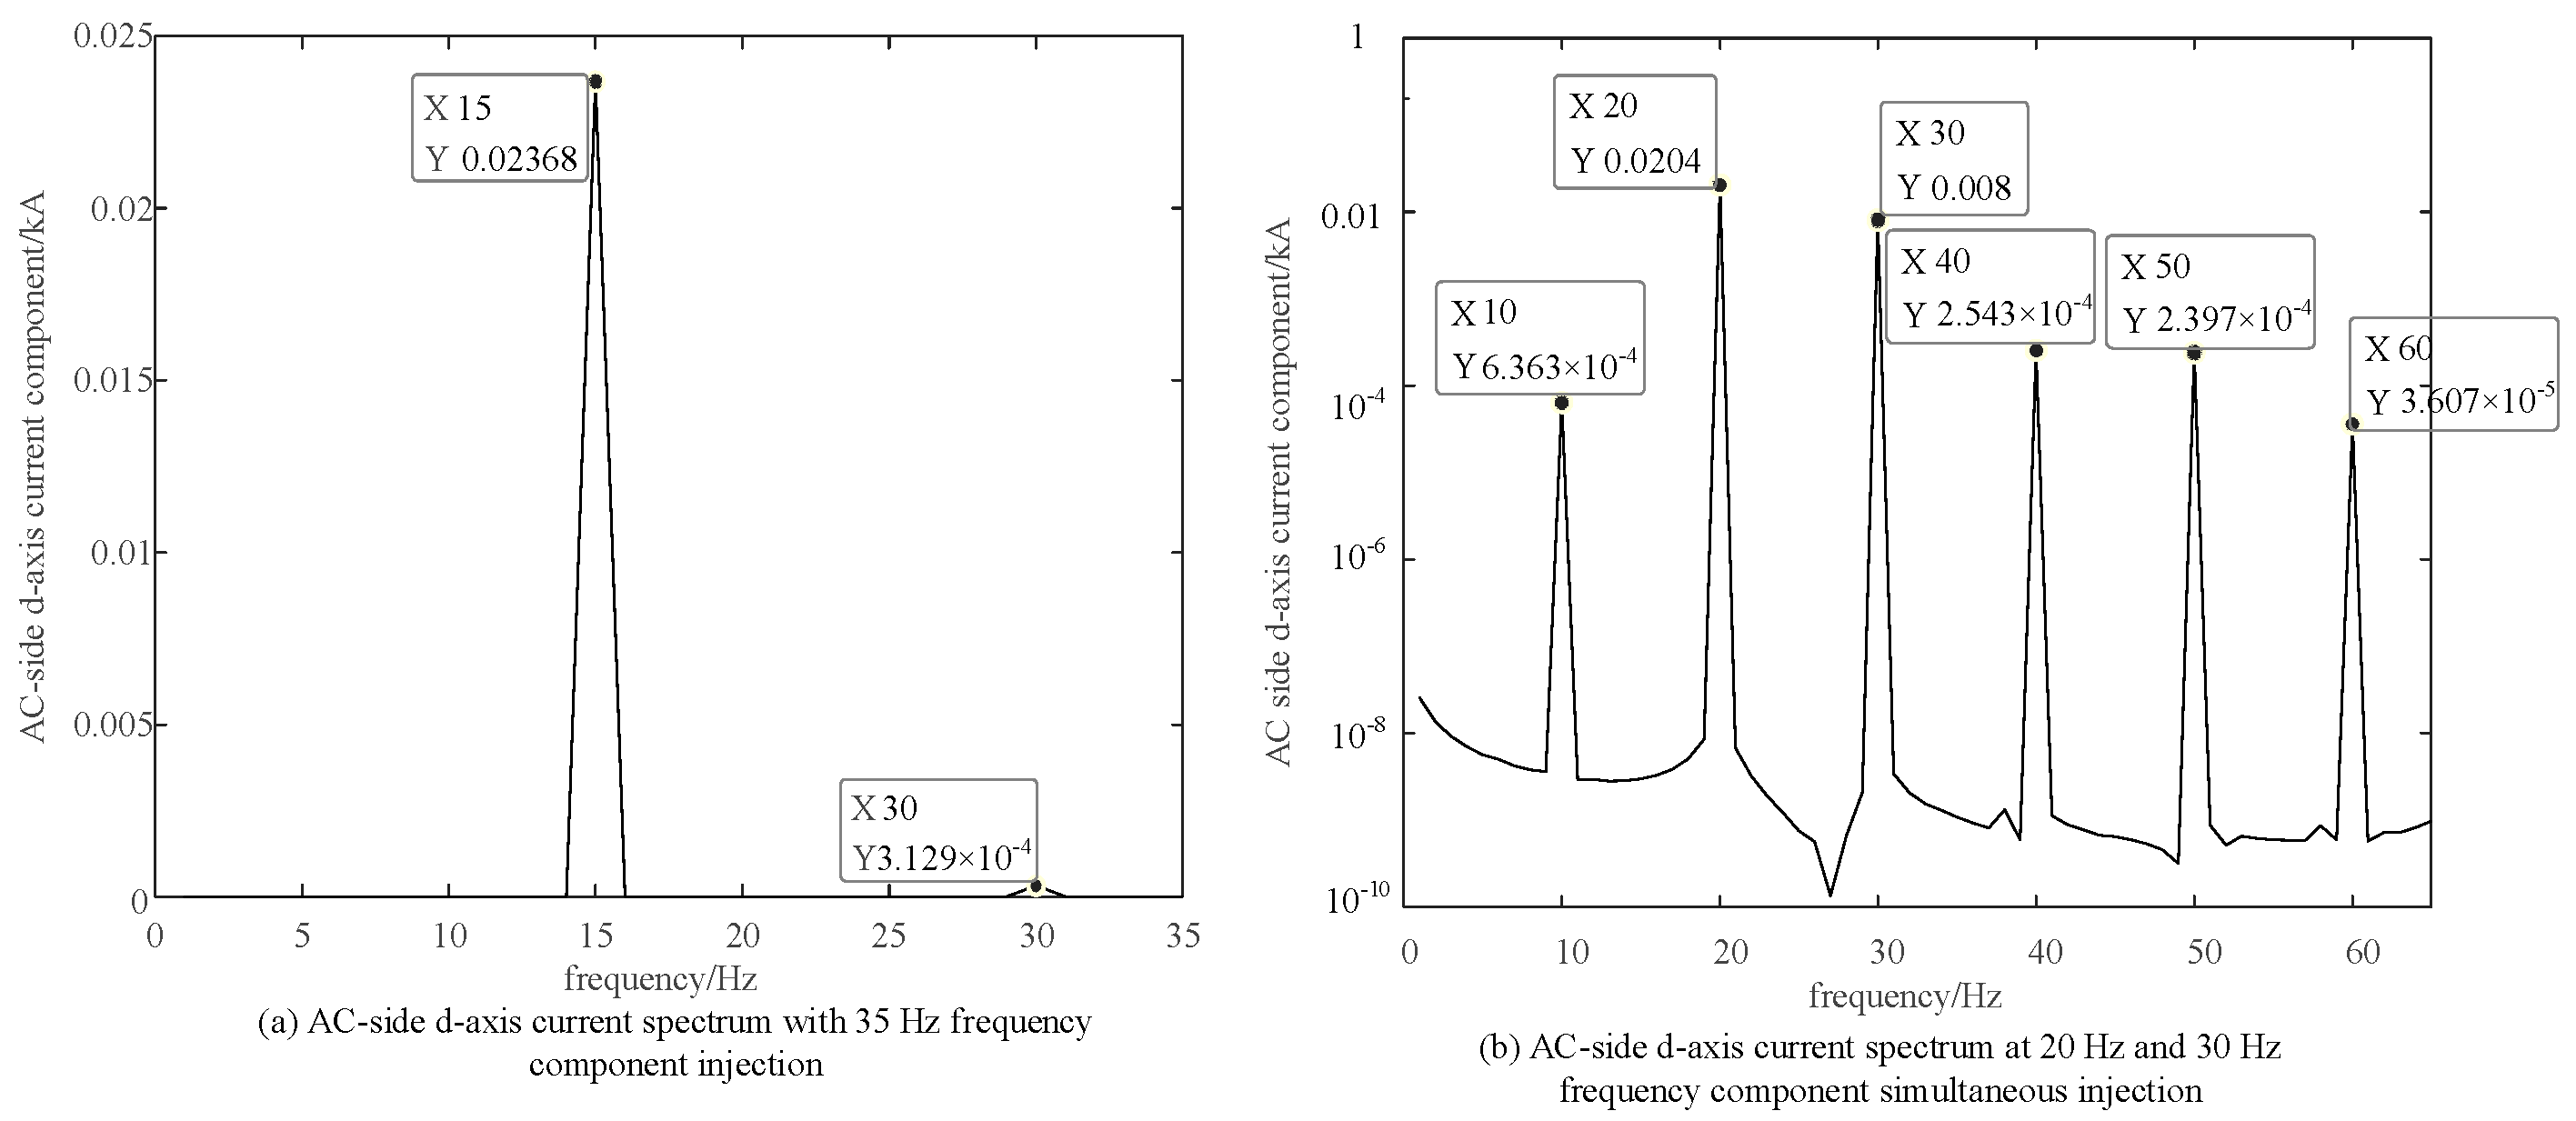
The d-axis current response results are shown in Figure 4. It can be seen from Figure 4a that when the SSO component with a frequency of 35 Hz is injected into the PCC, SSO components with frequencies of 15 Hz (ω0 − ωac1) and 30 Hz (2ω0 − 2ωac1) appear in the d-axis current. In Figure 4b, when SSO components with frequencies of 20 and 30 Hz are simultaneously injected into the PCC, there are SSO currents with frequencies of 10 Hz (ωac1 − ωac2), 20 Hz (ω0 − ωac2), 30 Hz (ω0 − ωac1), 40 Hz (2ω0 − 2ωac2), 50 Hz (2ω0 − ωac1 − ωac2), and 60 Hz (2ω0 − 2ωac1). The d-axis current response characteristics in Figure 4 verify the AC-side current frequency response components in Table 1 and Table 2.
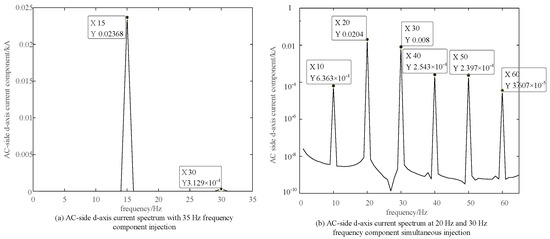
Figure 4.
D-axis current responses to single/multiple AC-side SSO disturbances.
4.2. Verification of Single AC-Side SSO Disturbance with DC-Side Power Response
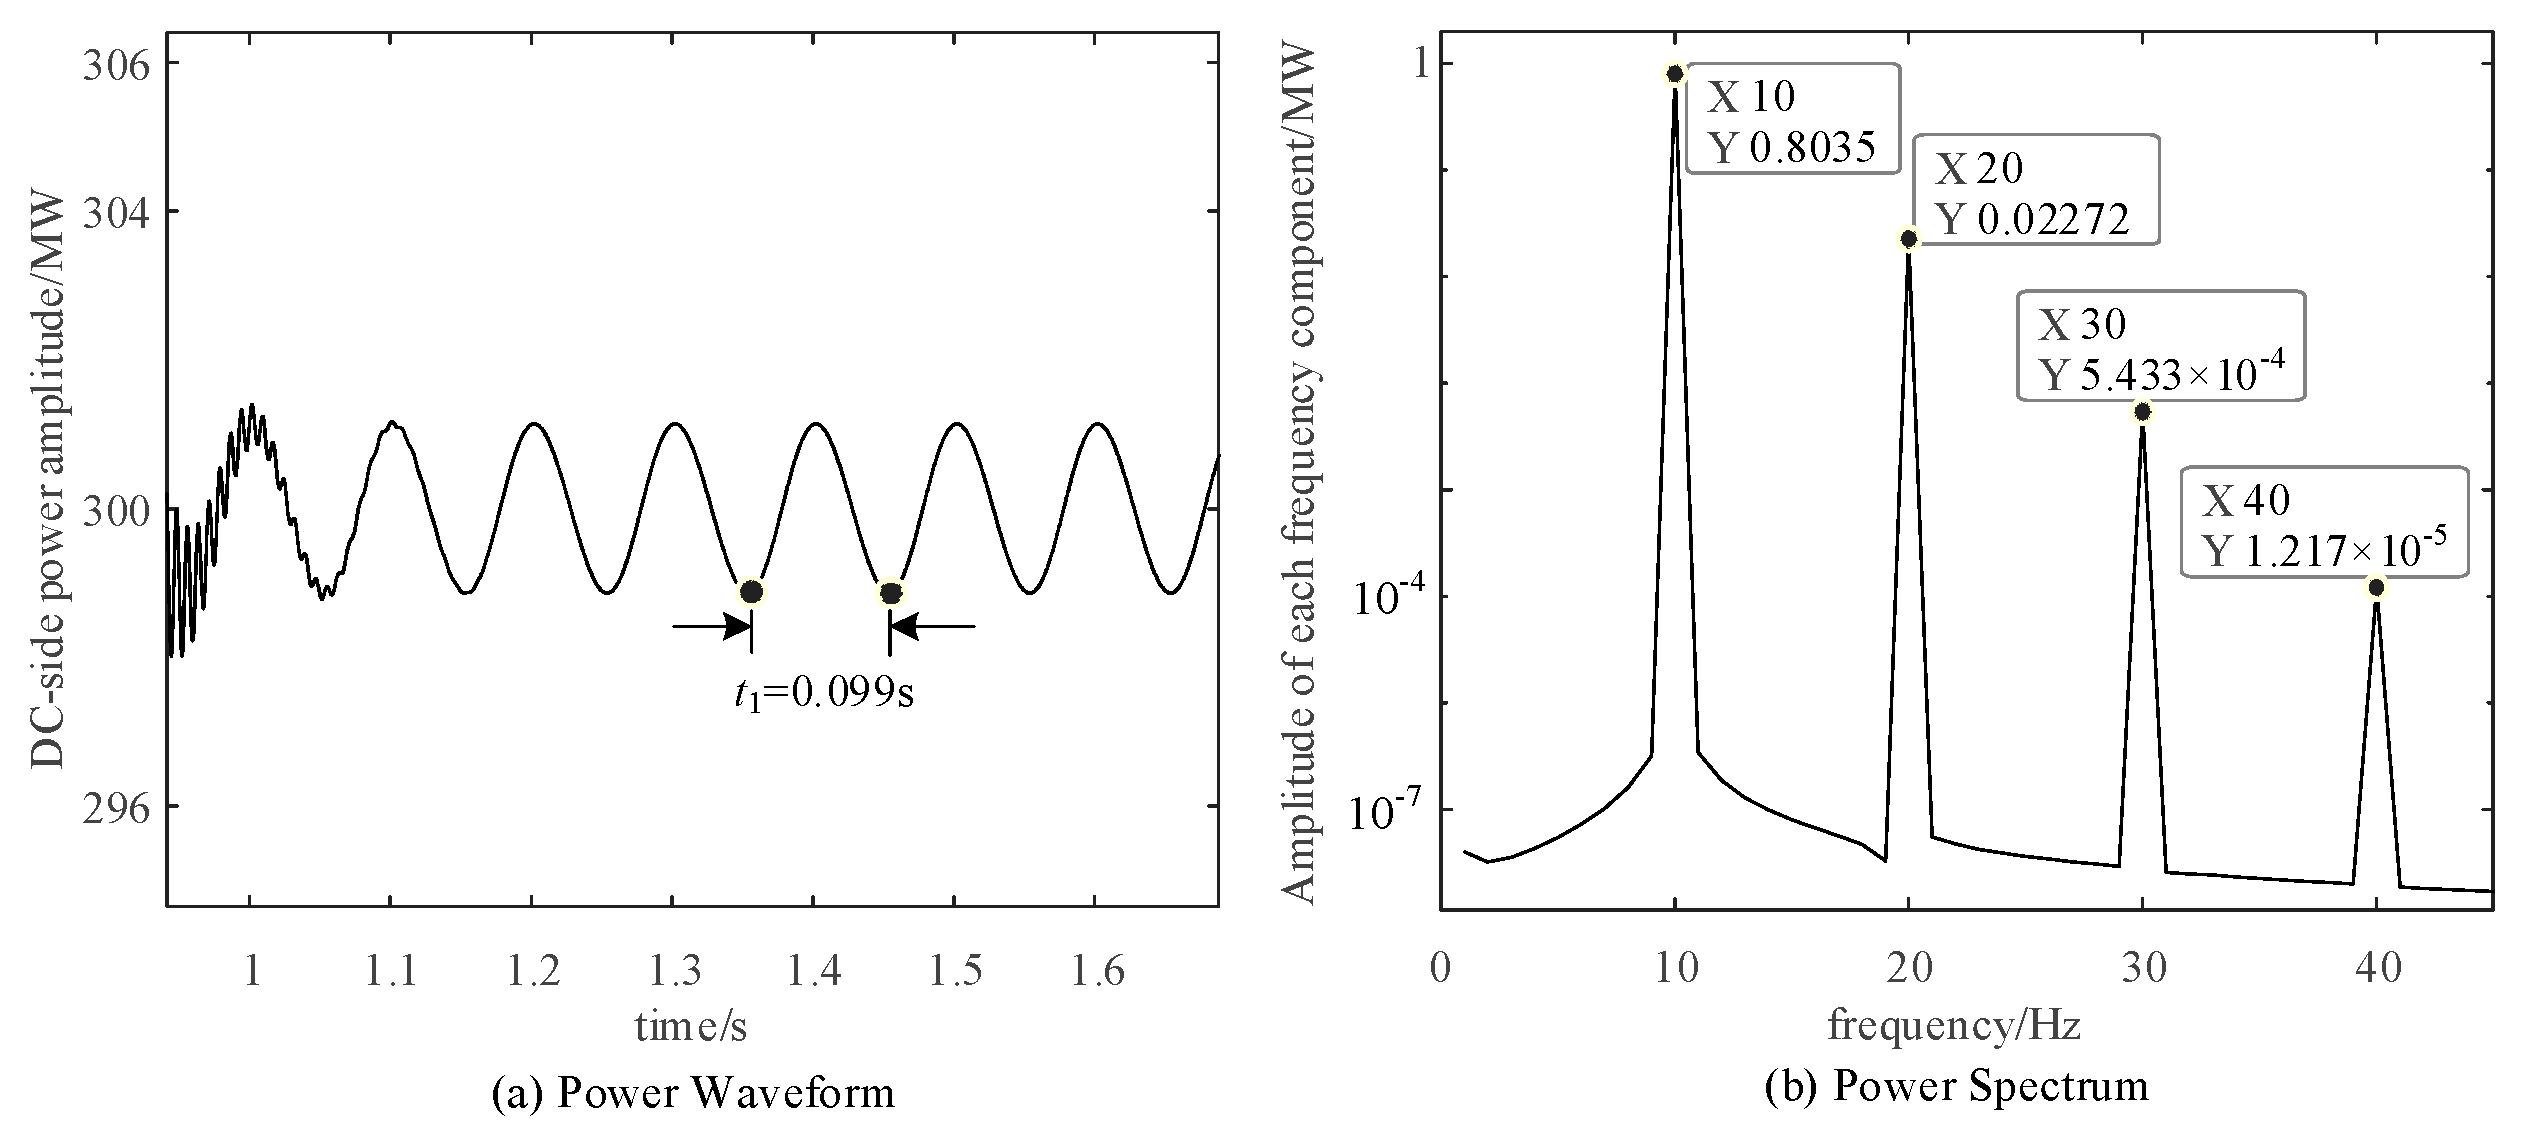
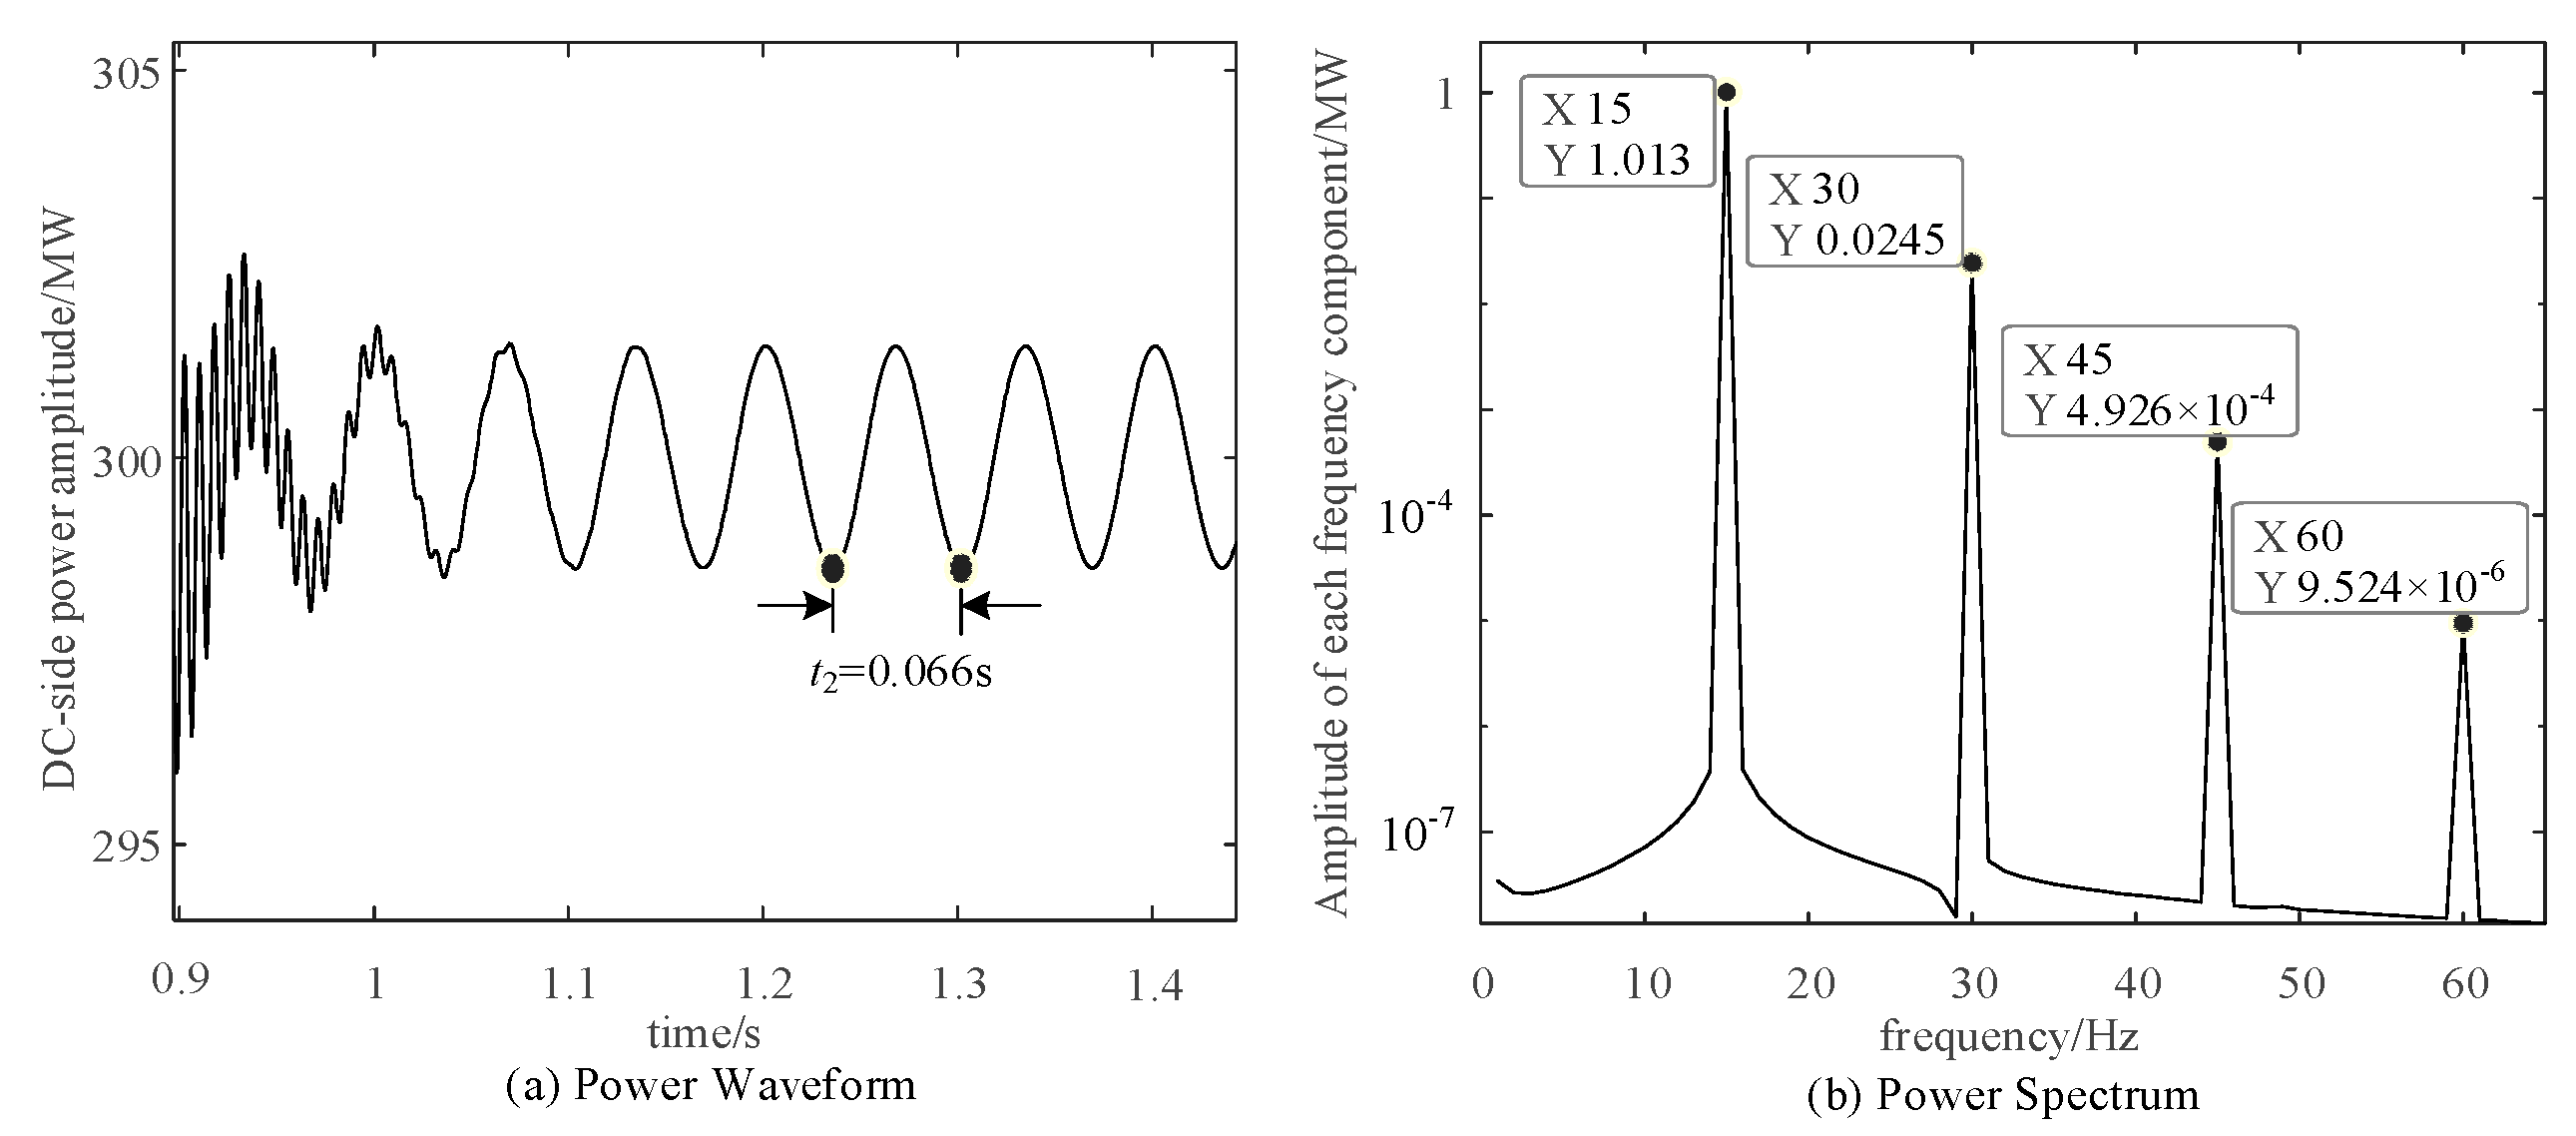
The frequency response results of DC-side power and corresponding spectrum analysis are shown in Figure 5 and Figure 6. It can be seen from Figure 5 that the oscillation frequency (1/t1 = 10 Hz) of the wind power via the VSC-HVDC system in Figure 5a is consistent with the oscillation frequency of 10 Hz in Figure 5b. It can be known from Figure 5b that when the AC-side SSO current with the frequency of 40 Hz is injected at the PCC, the sub-synchronous frequency components with the frequencies of 10 Hz (ω0 − ωac1), 20 Hz (2ω0 − 2ωac1), 30 Hz (3ω0 − 3ωac1), and 40 Hz (4ω0 − 4ωac1) appear in the DC-side power. It can be seen from Figure 6 that the oscillation frequency (1/t2 = 15 Hz) in Figure 6a is consistent with the oscillation frequency of 15 Hz in Figure 6b. In Figure 6b, when the AC-side SSO current with the frequency of 35 Hz is injected at the PCC, there are super-synchronous DC oscillation components with a frequency of 60 Hz (4ω0 − 4ωac1) and multiple SSO components with the frequencies of 15 Hz (ω0 − ωac1), 30 Hz (2ω0 − 2ωac1), and 45 Hz (3ω0 − 3ωac1).
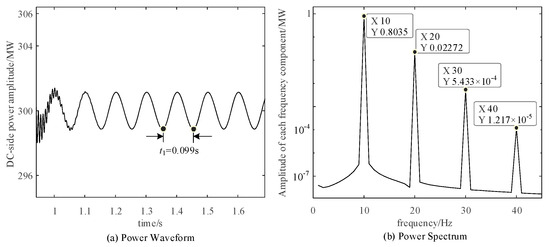
Figure 5.
DC-side power response during SSO component injection at 40 Hz.
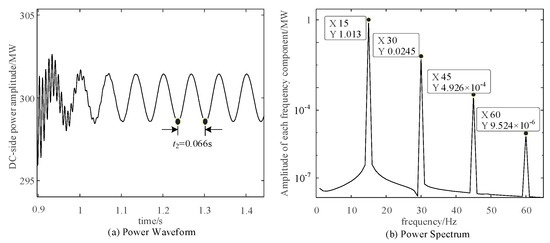
Figure 6.
DC-side power response during SSO component injection at 35 Hz.
Therefore, when the SSO component is added to the AC-side PCC point of the wind power via the VSC-HVDC system, the DC-side power response components contain the sub/super-synchronous oscillation powers. Each frequency component of the DC-side power present in the simulation results of Figure 5 and Figure 6 is consistent with the theoretical analysis of Table 1 in Section 3.2.
4.3. Verification of Multiple AC-Side SSO Disturbance with DC-Side Power Response
To verify the DC-side power response characteristics to multiple AC-side SSO disturbance components, this section takes two AC-side SSO components acting at the same time as an example. Simultaneously feeding sub-synchronous disturbance components with frequencies of 20 Hz and 30 Hz on the VSC-HVDC AC-side, the multiple frequency response characteristics of the DC-side power are shown in Figure 7.
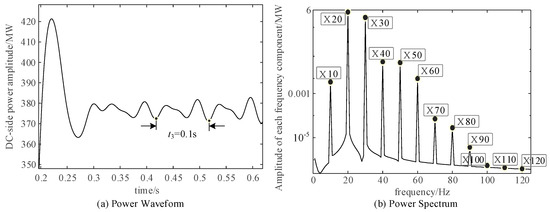
Figure 7.
DC-side power response when 20 Hz and 30 Hz disturbance components act simultaneously.
It can be seen from Figure 7 that the oscillation frequency of the VSC-HVDC system (1/t3 = 10 Hz) in Figure 7a is consistent with the oscillation frequency of 10 Hz in Figure 7b. Meanwhile, it can be known from Figure 7b that when the SSO components with the frequencies of 20 Hz and 30 Hz are injected at the same time, there are 10 Hz (ω0 − 2ωac2 + ωac1/ωac1 − ωac2), 20 Hz (ω0 − ωac2/2ωac1 − 2ωac2), 30 Hz (ω0 − ωac1), 40 Hz (2ω0 − 2ωac2), 50 Hz (2ω0 − ωac1 − ωac2), 60 Hz (3ω0 − 3ωac2), 70 Hz (3ω0 − ωac1 − 2ωac2), 80 Hz (4ω0 − 4ωac2), 90 Hz (4ω0 − 3ωac2 − ωac1), 100 Hz (4ω0 − 2ωac1 − 2ωac2), 110 Hz (4ω0 − 3ωac1 − ωac2), and 120 Hz (4ω0 − 4ωac1) frequency components. Each frequency component of the DC−side output power in Figure 7 is consistent with the theoretical analysis of Table 2 in Section 3.3.
5. Influence of Control Parameters on the DC-Side Oscillation Power
5.1. PLL Controller Parameter
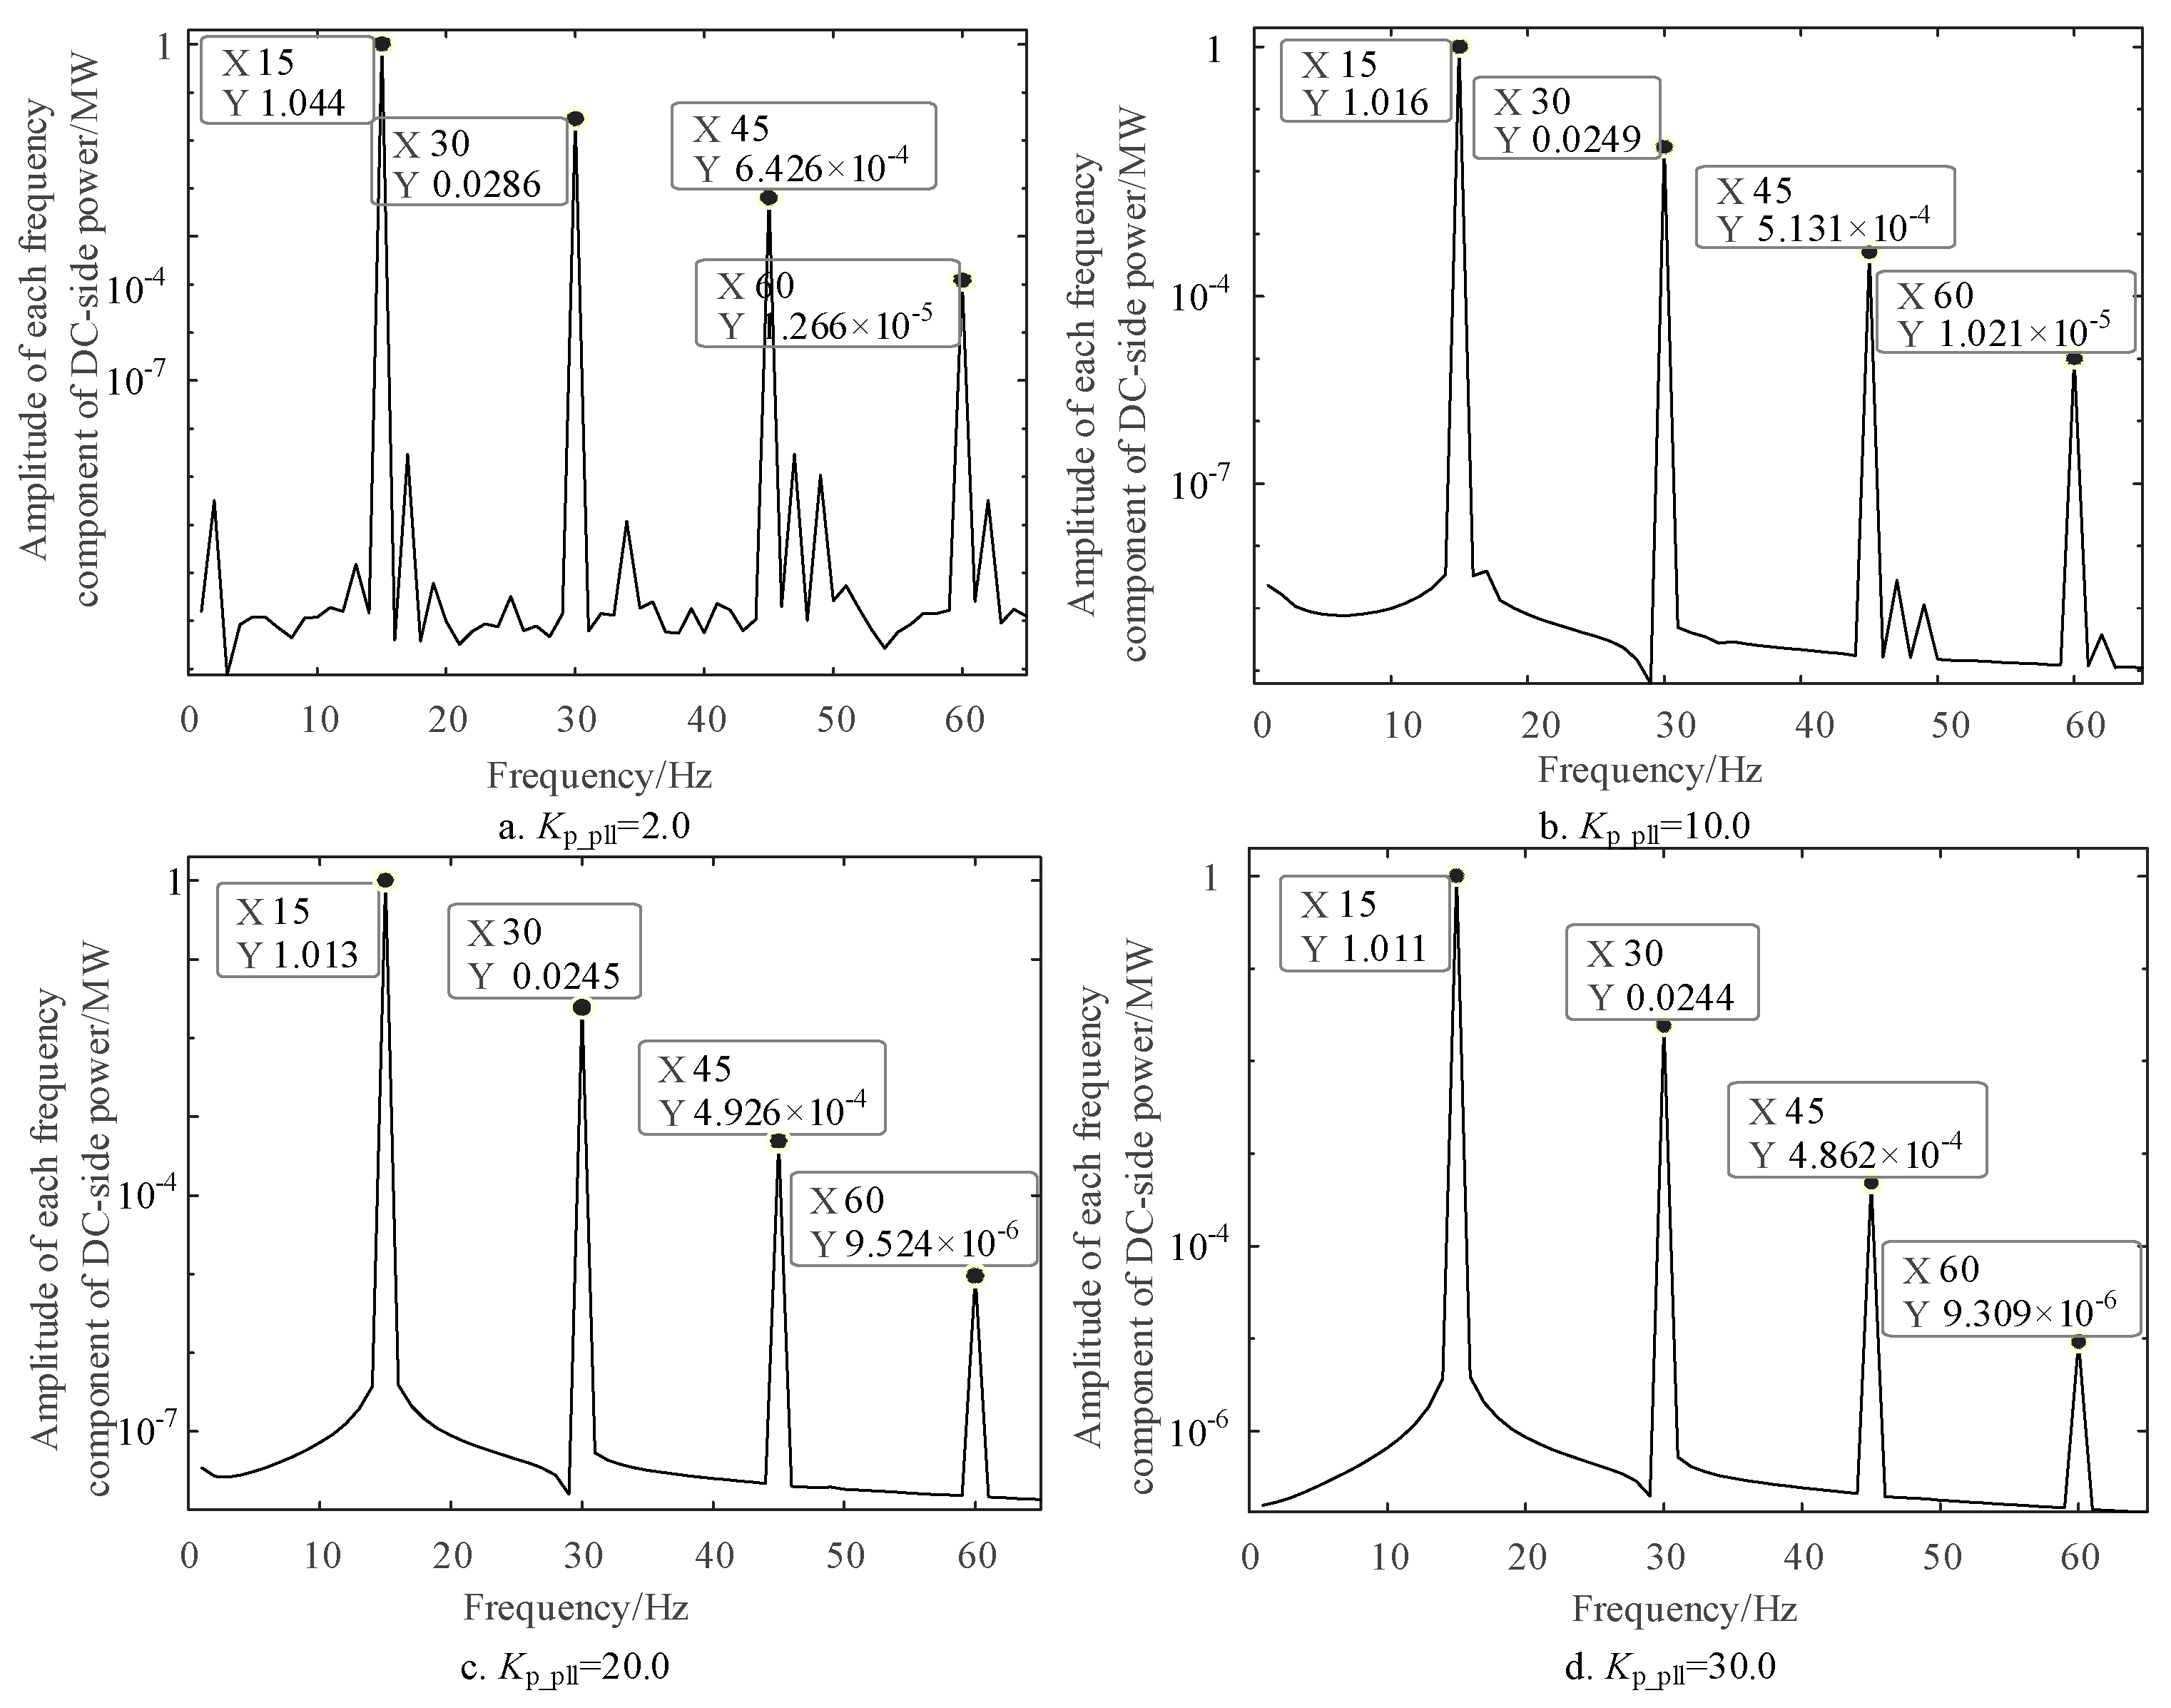
The effect of PLL proportional coefficient Kp_pll and integral coefficient Ki_pll on the VSC-HVDC DC-side oscillating power is shown in Figure 8 and Table 4 when the SSO component of 35 Hz is injected at the rectifier AC-side. It can be seen from Figure 8 that the amplitude of the oscillation component in the DC-side power spectrum analysis is the largest when Kp_pll = 2. With the increase in Kp_pll, the oscillation frequency nearly does not change. The amplitude of each oscillation component in the DC-side power spectrum analysis gradually decreases, and thus the oscillation risk decreases. It can be seen from Table 4 that the amplitude of each oscillation component in the DC-side power varies little with the change in Ki_pll, so the influence of Ki_pll on the DC-side oscillation power is small.
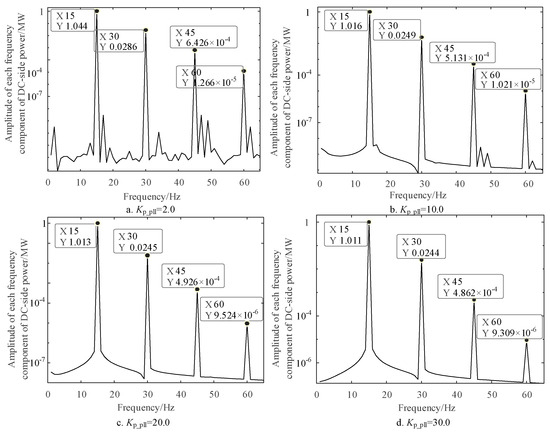
Figure 8.
Results of DC power spectrum analysis with different Kp_pll.
Table 4.
The impact of Ki_pll on the DC-side oscillation power.
5.2. Inner Loop Current Controller Parameter
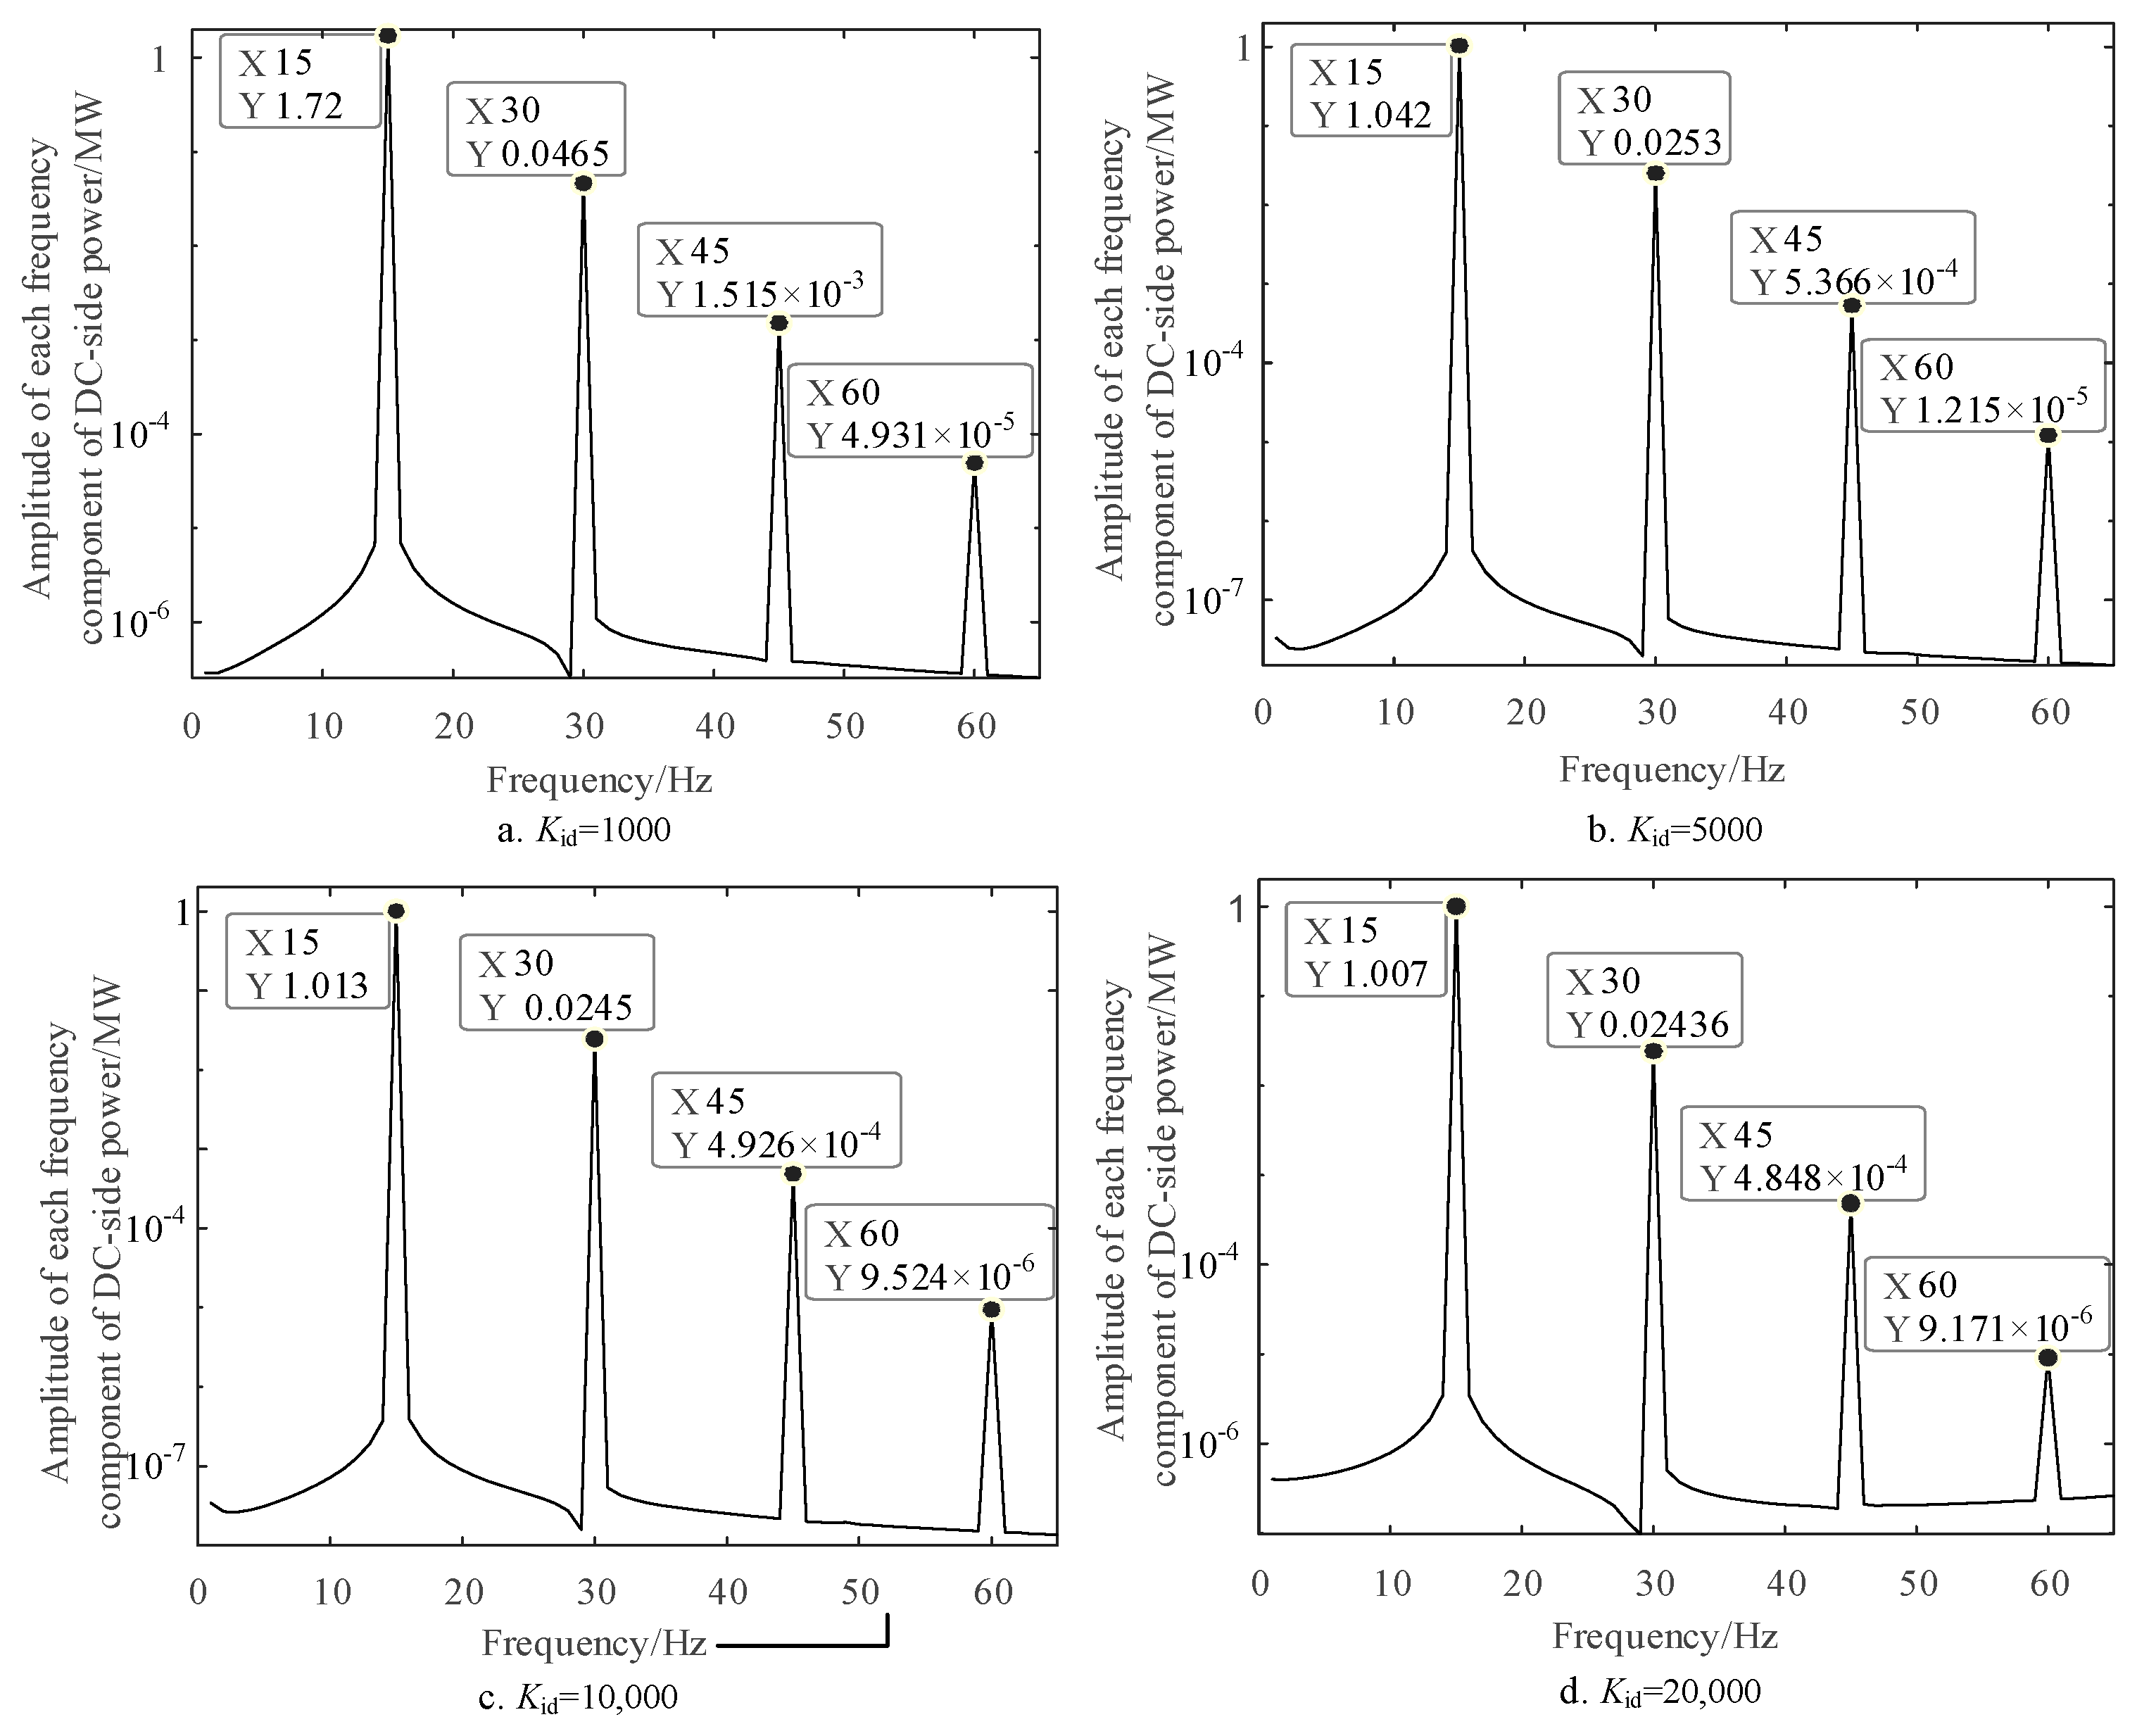
The effect of d-axis inner-loop current control proportional and integral parameters on the VSC-HVDC DC-side oscillating power is shown in Figure 9 and Table 5 when the SSO component of 35 Hz is injected at the rectifier AC-side. It can be seen from Figure 9 that as the d-axis integral coefficient Kid increases, the amplitude of each DC-side frequency component in the spectral analysis decreases, and thus the oscillation risk decreases. It can be seen from Table 5 that the d-axis inner loop current control proportional parameter has a small impact on the DC-side oscillation power.
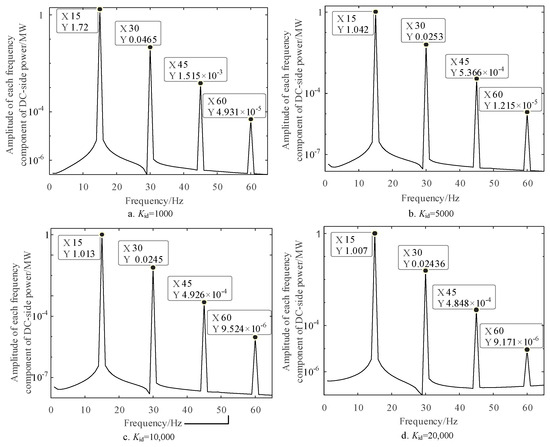
Figure 9.
Results of DC power spectrum analysis with different Kid.
Table 5.
The impact of Kpd on the DC-side oscillation power.
Meanwhile, it can be seen from Table 6 and Table 7 that after the change in the current inner-loop q-axis PI parameters, there is no change in each oscillation frequency point on the DC-side, and the amplitude of each oscillation component of the DC-side power changes slightly. Therefore, the effect of the current inner-loop q-axis PI parameters on the DC-side oscillating power amplitude is small.
Table 6.
The impact of Kpq on the DC-side oscillation power.
Table 7.
The impact of Kiq on the DC-side oscillation power.
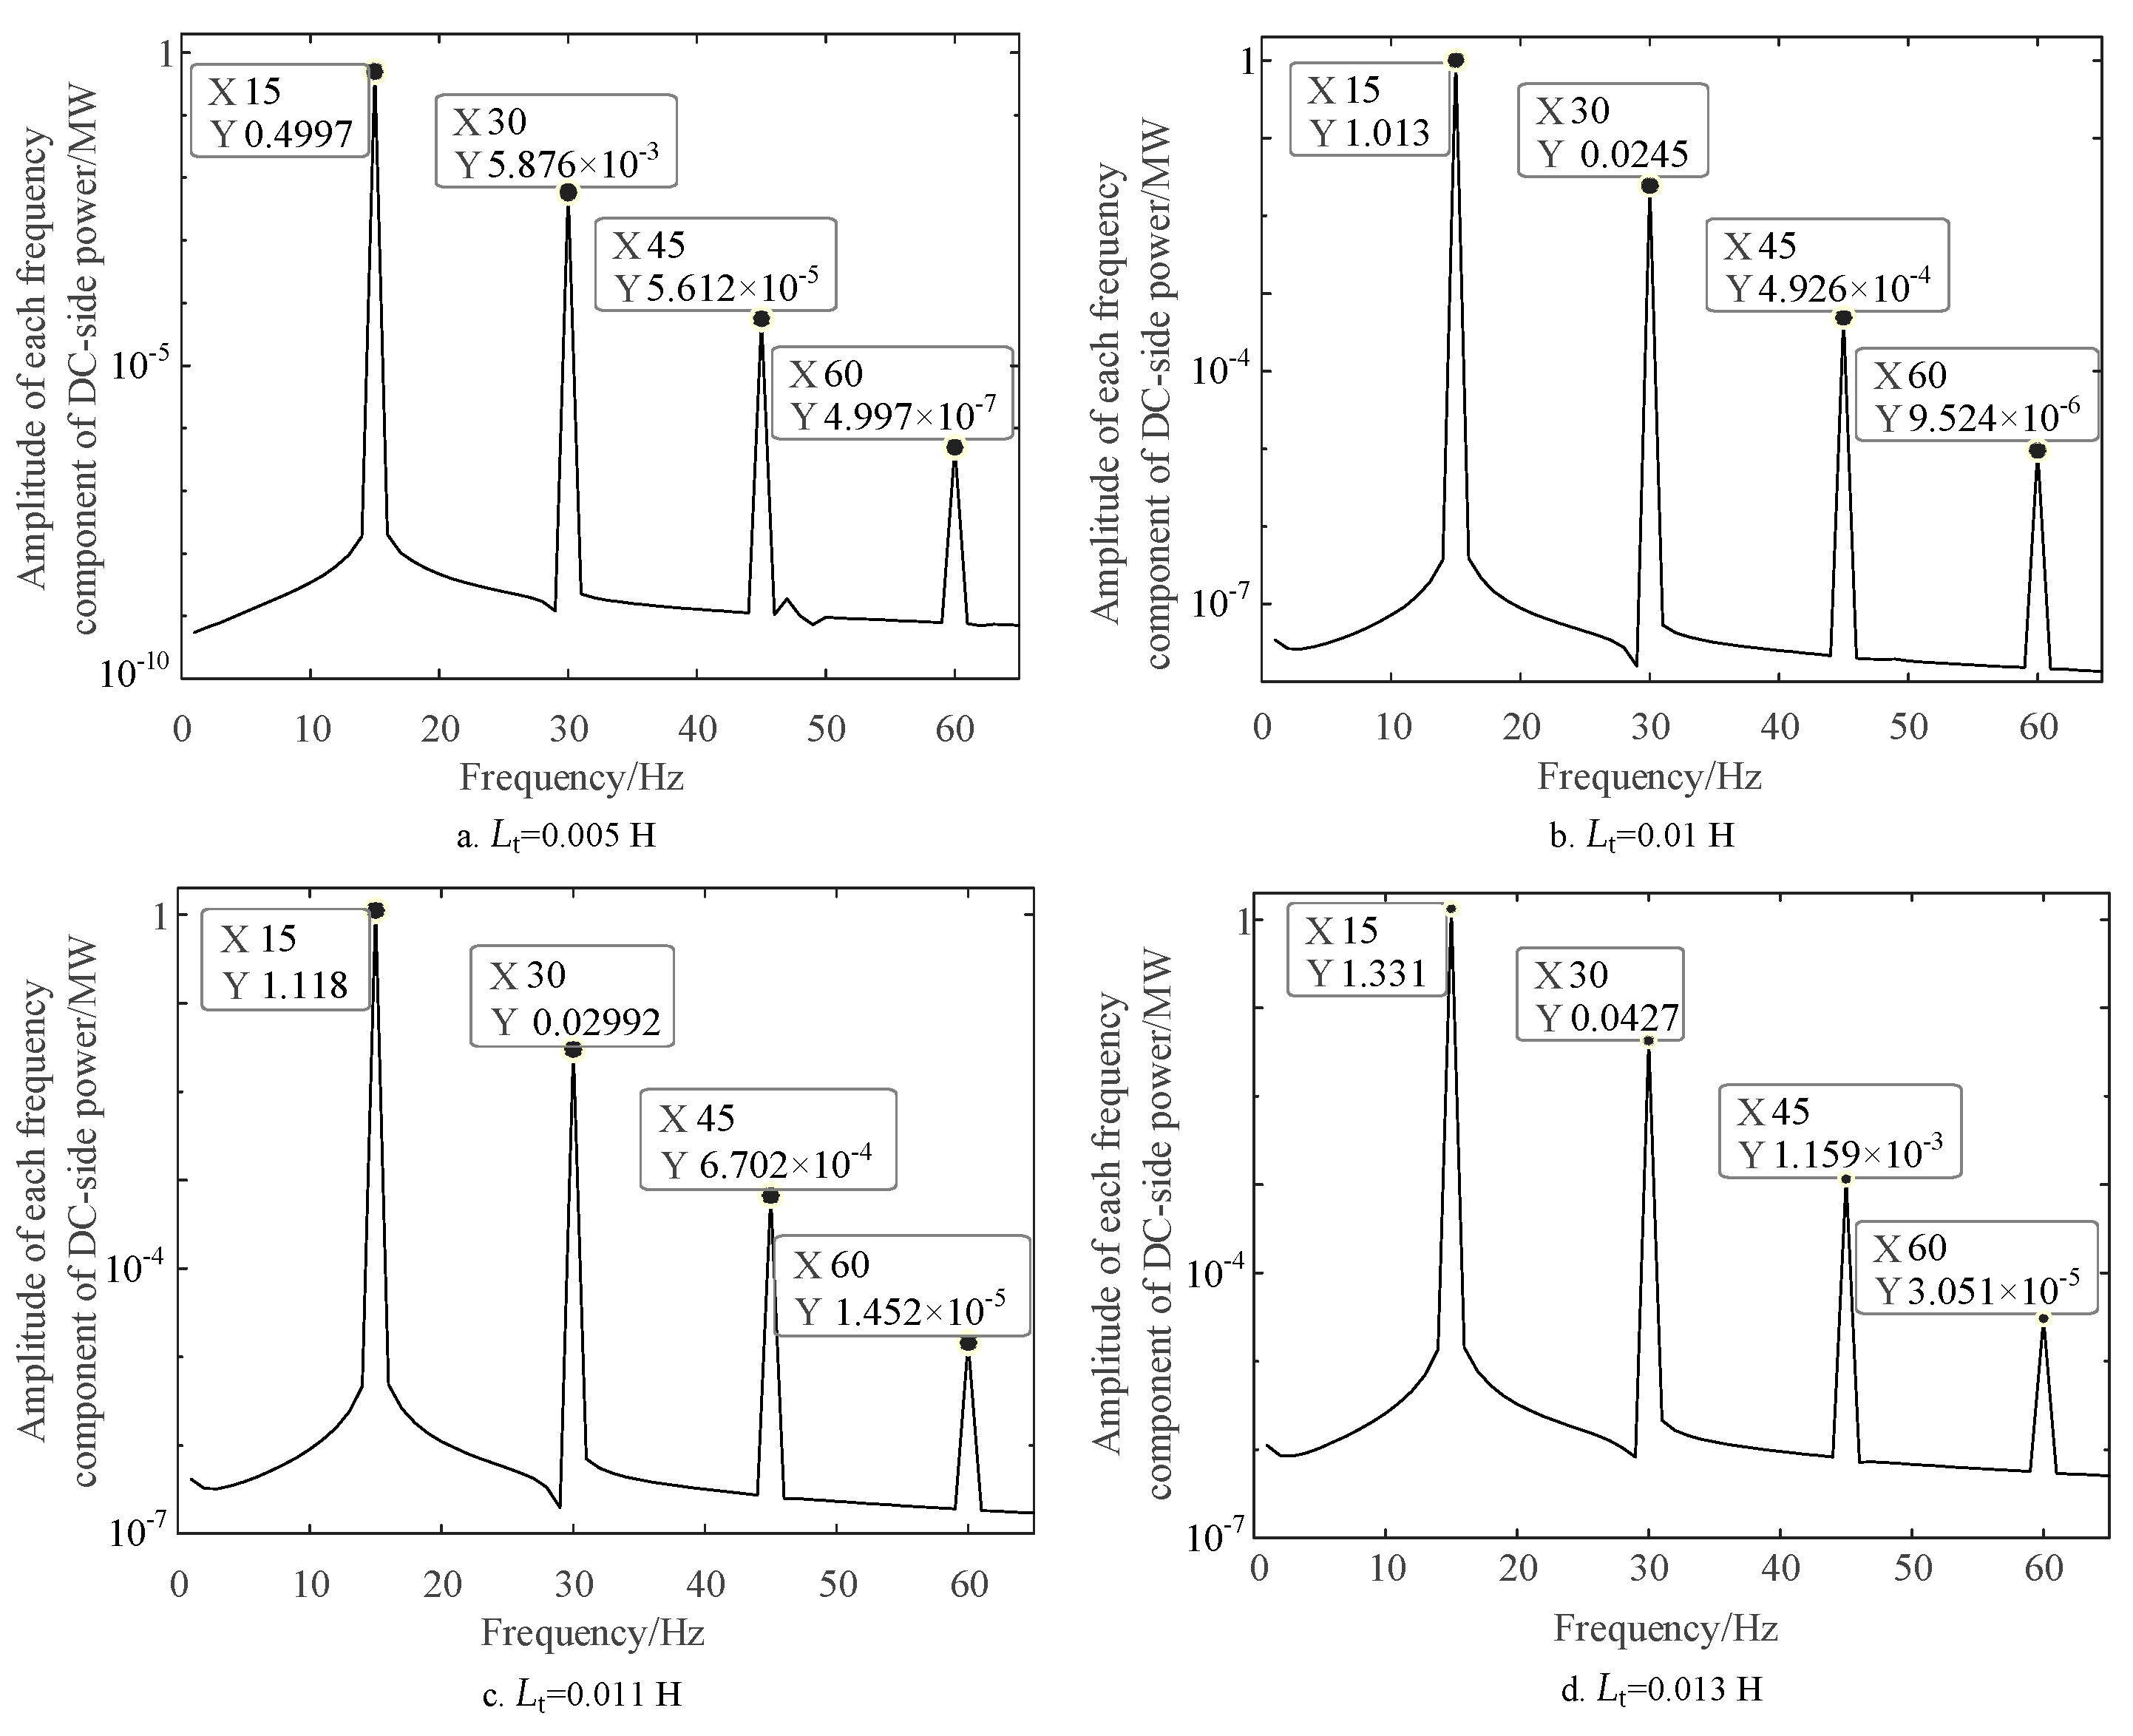
5.3. Filter Inductor Parameter
When the filter inductor parameter Lt is 0.005 H, 0.01 H, 0.011 H, and 0.013 H with the injection of the 35 Hz SSO component at the AC-side rectifier, the oscillating power of the VSC-HVDC DC-side is shown in Figure 10. It can be seen from Figure 10 that the amplitude of the oscillation component in the DC-side power spectrum analysis is the smallest when Lt is 0.005 H. With the increase in Lt, there is no change in each oscillation frequency point, but the amplitude of each oscillation component in the DC-side power spectrum analysis gradually increases, and the oscillation risk increases.
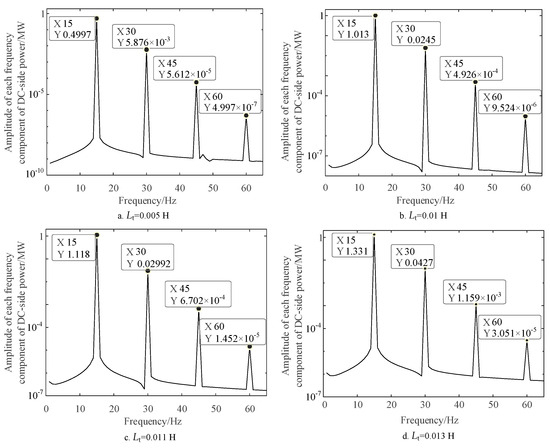
Figure 10.
Results of DC power spectrum analysis with different Lt.
5.4. Other Parameters
When the SSO component of 35 Hz is injected at the rectifier AC-side, the DC-side oscillation power of the VSC-HVDC is shown in Table 8 with the AC-grid inductance Lf varying between 0.004 H and 0.007 H. The DC-side oscillating power of the VSC-HVDC is shown in Table 9 when the reference value of the active power Pref varies between 100 MW and 200 MW. It can be seen from Table 8 that the change in the AC-grid inductance Lf does not influence the frequency points of each oscillation component on the DC- side. However, Table 8 shows that the amplitude of each oscillation component of the DC-side power increases, and the risk of oscillation increases. It can be seen from Table 9 that with the increase in active power reference Pref, there is no change in the frequency point of each oscillation component on the DC- side. However, Table 9 shows that the risk of oscillation increases with the increase in Pref, as the amplitude of each oscillation component of the DC-side power increases.
Table 8.
The impact of Lf on the DC-side oscillation power.
Table 9.
The impact of Pref on the DC-side oscillation power.
6. Conclusions
To reveal the oscillation propagation mechanism in the AC and DC sides of the VSC-HVDC system, the frequency response characteristics of the VSC-HVDC DC-side oscillation power under the AC SSO perturbations are investigated. The main conclusions are summarized as follows:
- (1)
- When the SSO component with frequency ωac1 exists on the AC-side of the VSC-HVDC system, the perturbation frequency component is generated through the effect of the PLL, and then the perturbation frequency component acts directly on the current inner loop. Finally, the DC-side oscillation power exhibits multi-frequency oscillation characteristics, containing one to four times the frequency component under the (ω0-ωac1) reference;
- (2)
- When the SSO components of ωac1 and ωac2 exist simultaneously on the AC-side of the VSC-HVDC system, the m(ω0 − ωac1), n(ω0 − ωac2), and αω0 − βωac1 − γωac2 (α = β + γ) DC-side oscillation power frequency components under the effect of the two sub-synchronous components appear. This indicates that different SSO components are coupled with each other, which affects the multi-frequency response characteristics of the DC-side oscillation power;
- (3)
- The increase in the PLL proportional coefficient and d-axis current inner-loop integral coefficient leads to the decrease in the amplitude of each DC-side oscillation power frequency component, and then the oscillation risk decreases. Meanwhile, with the increase in the filtering inductance, AC grid inductance, and active power, the amplitude of each DC-side oscillation power frequency component increases, and then the oscillation risk increases.
Author Contributions
Conceptualization, Z.B., B.S. and P.L.; methodology, B.S., X.F. and Z.M.; software, P.L.; validation, Z.B.; formal analysis, X.F. and Z.M.; investigation, X.K.; resources, X.K.; data curation, Z.M. and P.L.; writing, B.S., Z.M. and Z.B.; visualization, Z.B.; supervision, X.F.; project administration, Z.M.; funding acquisition, Z.B. and X.F. All authors have read and agreed to the published version of the manuscript.
Funding
This research was supported by the State Grid Corporation of China’s Technology Project (4000-202318081A-1-1-ZN) which is named “Research of oscillation mode drifting and coordinating suppression in power system with offshore wind power integrated via VSC-HVDC”.
Data Availability Statement
Dates are contained within the article.
Conflicts of Interest
Author Z.B., X.F., X.K. and P.L. were also employed by State Grid Jiangsu Electric Power Co., Ltd. The remaining authors declare that the research was conducted in the absence of any commercial of financial relationships that could be construed as a potential conflict of interest.
References
- Wang, Z.; Wu, J.L.; Liu, R.X.; Shan, Y. A P-Q coordination control strategy of VSC-HVDC and BESS for LVRT recovery performance enhancement. Electronics 2024, 13, 741. [Google Scholar] [CrossRef]
- Lv, X.J.; Wang, J.L.; Zhang, Z.C.; Liu, Z.W.; Li, Z.X. Adaptive active inertia control strategy of MMC-HVDC systems for flexible frequency support. Electronics 2023, 12, 4288. [Google Scholar] [CrossRef]
- Liu, L.; Li, X.P.; Jiang, Q.; Teng, Y.F.; Chen, M.J.; Wang, Y.F.; Zeng, X.Y.; Luo, Y.P.; Pan, P.Y. A multi-terminal control method for AC grids based on a hybrid high-voltage direct current with cascaded MMC converters. Electronics 2024, 12, 4799. [Google Scholar] [CrossRef]
- Shao, B.B.; Zhao, S.Q.; Yang, Y.H.; Gao, B.F.; Blaabjerg, F. Sub-synchronous oscillation characteristics and analysis of direct-drive wind farms with VSC-HVDC systems. IEEE Trans. Sustain. Energy 2021, 12, 1127–1140. [Google Scholar] [CrossRef]
- Liu, H.K.; Xie, X.R.; He, J.B.; Xu, T.; Yu, Z.; Wang, C.; Zhang, C.Y. Subsynchronous interaction between direct-drive PMSG based wind farms and weak AC networks. IEEE Trans. Power Syst. 2017, 32, 4708–4720. [Google Scholar] [CrossRef]
- Sun, X.W.; Shi, H.B.; Ni, J.; Wei, W. Study of the sub-synchronous oscillation caused by SVC in weak-link power grids and its suppressing method. Power Syst. Prot. Control 2019, 47, 171–178. [Google Scholar]
- Habibullah, M.; Mithulananthan, N.; Shah, R.; Islam, M.R.; Muyeen, S.M. Investigation of oscillation and resonance in the renewable integrated DC-microgrid. Electronics 2023, 12, 1574. [Google Scholar] [CrossRef]
- Mohammadpour, H.A.; Santi, E. SSR damping controller design and optimal placement in rotor-side and grid-side converters of series-compensated DFIG-based wind farm. IEEE Trans. Sustain. Energy 2015, 6, 388–399. [Google Scholar] [CrossRef]
- Zhao, S.Q.; Shen, J.L.; Shao, B.B. Subsynchronous oscillation characteristics analysis of grid-connected direct-drive farms via VSC-HVDC system under whole operation regions of D-PMSG. Acta Energy Sol. Sin. 2021, 42, 163–173. [Google Scholar]
- Jin, G.X.; Li, F.T.; Yin, C.Y.; Liu, J.S.; Wang, T. Analysis of small-disturbance stability of onshore wind power all-DC power generation system and identification of leading factors. Electronics 2024, 13, 8. [Google Scholar] [CrossRef]
- Zhou, J.Z.; Ding, H.; Fan, S.; Zhang, Y.; Gole, A.M. Impact of short-circuit ratio and phase-locked-loop parameters on the small-signal behavior of a VSC-HVDC Converter. IEEE Trans. Power Deliv. 2014, 29, 2287–2296. [Google Scholar] [CrossRef]
- Zhang, M.Y.; Xiao, S.W.; Tian, T. Analysis of SSO influencing factors and parameter adjustment for grid-connected full-converter wind farm based on impedance sensitivity. Power Syst. Technol. 2018, 42, 2768–2777. [Google Scholar]
- Wang, H.B.; Zhou, N.C.; Huang, P.; Duan, X.C.; Huang, R.L. Mechanism analysis and suppression strategy of continuous high-frequency oscillation in MMC-HVDC system. Electronics 2022, 11, 3555. [Google Scholar] [CrossRef]
- Cespedes, M.; Sun, J. Impedance Modeling and Analysis of Grid-Connected Voltage-Source Converters. IEEE Trans. Power Electron. 2014, 29, 1254–1261. [Google Scholar] [CrossRef]
- Agbemuko, A.J.; Domínguez-García, J.L.; Gomis-Bellmunt, O. Impedance-based modelling of hybrid AC/DC grids with synchronous generator for interaction study and dynamic improvement. Electr. Power Syst. Res. 2020, 179, 106086. [Google Scholar] [CrossRef]
- Wang, X.Y.; Yang, J.; Wu, Y.N.; Pang, H.; Kong, M. Effect analysis of back-to-back flexible HVDC connecting Chongqing and Hubei Power Grid on sub-synchronous oscillation characteristics. Electr. Power Autom. Equip. 2019, 39, 188–194+202. [Google Scholar]
- Chen, G.; Zeng, X.Y.; Shi, H.B.; Wang, B.; Li, G.; Jiang, Q.; Wang, Y.F.; Li, B.H. Influence analysis and control method of ultra-low frequency oscillation in a hydro-dominant sending power system with wind power integration. Electronics 2024, 13, 31. [Google Scholar] [CrossRef]
- Li, J.Y.; Bi, T.S.; Yu, Z.; Zhang, P.; Xiao, S.W. Study on response characteristics of grid converter control system of Permanent Magnet Synchronous Generators (PMSG) to subsynchronous frequency component. Power Syst. Technol. 2014, 41, 1734–1740. [Google Scholar]
- Sun, K.; Yao, W.; Fang, J.K.; Ai, X.M.; Wen, J.Y.; Cheng, S.J. Impedance modeling and stability analysis of grid-connected DFIG-based wind farm with a VSC-HVDC. IEEE J. Emerg. Sel. Top. Power Electron. 2020, 8, 1375–1390. [Google Scholar] [CrossRef]
- Shao, B.B.; Zhao, S.Q.; Gao, B.F.; Yang, Y.H.; Blaabjerg, F. Adequacy of the single-generator equivalent model for stability analysis in wind farms with VSC-HVDC systems. IEEE Trans. Energy Convers. 2021, 36, 907–918. [Google Scholar] [CrossRef]
- Li, Y.F.; Tang, G.F.; He, Z.Y.; An, T.; Yang, J.; Wu, Y.N.; Kong, M. Damping control strategy research for MMC based HVDC system. Proc. CSEE 2016, 36, 5492–5503+5725. [Google Scholar]
- Ma, W.Z.; Ding, A.M.; Zhou, G.Y.; Zhao, Y.; Zhang, Y.; Zhang, K.T.; Dong, L. Superconducting magnetic energy storage device based DC oscillation mitigation method in MMC-HVDC system. Electr. Power Autom. Equip. 2020, 40, 184–190+210. [Google Scholar]
- Wu, W.H.; Chen, Y.D.; Luo, A.; Zhou, L.M.; Zhou, X.P.; Yang, L.; Huang, X.C. DC impedance modeling, oscillation analysis and suppression method for VSC-HVDC system in the field of islands power supply. Proc. CSEE 2018, 38, 4359–4368+4636. [Google Scholar]
- Zhang, Y.; Lin, W.X.; Deng, C.B.; Liu, H.J.; Liu, P.; Gao, T. Low-frequency oscillation mechanism and suppression strategy of Flexible HVDC transmission system. Power Syst. Technol. 2021, 45, 3134–3146. [Google Scholar]
- Shah, S.; Parsa, L. Impedance Modeling of Three-Phase Voltage Source Converters in DQ, Sequence, and Phasor Domains. IEEE Trans. Energy Convers. 2017, 32, 1139–1150. [Google Scholar] [CrossRef]
- Xie, X.R.; Liu, H.K.; He, J.B.; Liu, W. Small-signal impedance/admittance network modeling for grid-connected renewable energy generation systems. Autom. Electr. Power Syst. 2017, 41, 26–32. [Google Scholar]
- Lv, J.; Dong, P.; Shi, G.; Cai, X.; Li, X.L. Subsynchronous oscillation and its mitigation of MMC-based HVDC with large doubly-fed induction generator-based wind farm integration. Proc. CSEE 2015, 35, 4852–4860. [Google Scholar]
- Xue, A.C.; Wu, Y.; Wang, Z.Z.; Li, J.Y.; Bi, T.S. Analysis of frequency response of DFIG system under subsynchronous disturbance. Power Syst. Technol. 2018, 42, 1804–1810. [Google Scholar]
- Lin, H.J.; Chung, H.S.-H.; Shen, R.H.; Xiang, Y.X. Enhancing Stability of DC Cascaded Systems With CPLs Using MPC Combined With NI and Accounting for Parameter Uncertainties. IEEE Trans. Power Electron. 2024, 39, 5225–5238. [Google Scholar] [CrossRef]
- Rocabert, J.; Luna, A.; Blaabjerg, F.; Rodríguez, P. Control of power converters in AC microgrids. IEEE Trans. Power Electron. 2012, 27, 4734–4749. [Google Scholar] [CrossRef]
- Twining, E.; Holmes, D.G. Grid current regulation of a three-phase voltage source inverter with an LCL input filter. IEEE Trans. Power Electron. 2003, 18, 888–895. [Google Scholar] [CrossRef]
- Tang, Y. The analysis of forced power oscillation in power system. Power Syst. Technol. 1995, 19, 6–10. [Google Scholar]
- Shao, B.B.; Xiang, N.W.; Wang, S.L.; Ding, C.; Ni, X.J.; Zhao, Z.Z. Classification and research status of power system generalized modal resonance. Proc. CSEE 2023, 1–15, (Early access). [Google Scholar]
- Xu, Y.H.; Cao, Y.P. Research on mechanism of sub/super-synchronous oscillation caused by GSC controller of direct-drive permanent magnetic synchronous generator. Power Syst. Technol. 2018, 42, 1556–1564. [Google Scholar]
- Wu, G.L.; Zhou, X.X.; Wang, S.S.; Liang, J.; Zhao, B.; Wang, T.Z.; Li, Y.B.; Yang, Y.C. Analytical Research on the Mechanism of the Interaction Between PLL and Inner Current Loop When VSC-HVDC Connected to Weak Grid. Proc. CSEE 2018, 38, 2622–2633+2830. [Google Scholar]


Disclaimer/Publisher’s Note: The statements, opinions and data contained in all publications are solely those of the individual author(s) and contributor(s) and not of MDPI and/or the editor(s). MDPI and/or the editor(s) disclaim responsibility for any injury to people or property resulting from any ideas, methods, instructions or products referred to in the content. |
© 2024 by the authors. Licensee MDPI, Basel, Switzerland. This article is an open access article distributed under the terms and conditions of the Creative Commons Attribution (CC BY) license (https://creativecommons.org/licenses/by/4.0/).