Article

Ship-VNet: An Algorithm for Ship Velocity Analysis Based on Optical Remote Sensing Imagery Containing Kelvin Wakes

1
School of Information Science and Technology, Dalian Maritime University, Dalian 116026, China
2
School of Electronics and Information Engineering, Liaoning Technical University, Huludao 125105, China
3
Institute of Automation, Chinese Academy of Sciences, Beijing 100190, China
*
Author to whom correspondence should be addressed.
Electronics 2024, 13(17), 3468; https://doi.org/10.3390/electronics13173468
Submission received: 4 June 2024 / Revised: 19 August 2024 / Accepted: 20 August 2024 / Published: 31 August 2024

Abstract

:
Extracting ship velocity vectors from optical remote sensing images is a very challenging task, and ship wakes are the only motion features of ships. However, because the sensor’s field of view is not sufficiently bright and the brightness is not uniform, the image contains noise, which makes it difficult to define and extract the wake of the ship. Velocity analysis of the extracted wake makes the whole process complicated and slow. Therefore, considering the above problems, this paper proposes Ship-VNet, an optical remote sensing image ship velocity analysis algorithm based on Kelvin wakes. In this model, the rotating target detection algorithm is used to detect the ship, and then, the classical relationship between the kinematic characteristics of the ship’s Kelvin wake and the velocity of the ship is studied and experimentally analyzed in the frequency domain. In addition, based on optical remote sensing images and corresponding real AIS data, a ship dataset with Kelvin wakes marked with heading velocity was constructed to verify the effectiveness of the proposed method. Compared with the ship velocity analysis method based on the frequency domain, which was also used in the previous research, the experiment demonstrates the superiority of the method in terms of analysis accuracy.

1. Introduction

It is important to extract ship velocity vectors from optical remote sensing images. The use of ship velocity information can enable real-time monitoring of ships at sea [1] and form maritime combat intelligence [2]. With the rapid development of satellite remote sensing imaging technology, the number of high-quality remote sensing satellite images that can be obtained has increased dramatically [3]. The remote sensing images include ship wakes reflecting ship motion characteristics, which provide the possibility to invert ship velocity based on a single remote sensing image.
In the past few years, there has been relatively little research on predicting ship speed based on wakes in optical images. Instead, the recent studies have typically relied on large datasets constructed from non-image data points [4,5]. Against this backdrop, we propose a method for predicting ship speed using optical remote sensing images based on ship wakes.There are four main types of ship wakes: turbulent wakes [6], Kelvin wakes, narrow “V”-type Bragg wakes [7] and internal wave wakes [8], and the Kelvin wake [9] is one of the most detectable wakes in visible light remote sensing applications of ocean observations [10]. The Kelvin wake has obvious characteristics, and after analysis, the wavelength of the shear wave has a definite mathematical relationship with the velocity of the ship. Therefore, it is a good choice to use the Kelvin wake to analyze the velocity of the ship. This paper mainly studies ship velocity and heading analysis based on Kelvin wakes.
In recent years, the research on the use of ship wakes to analyze ship velocity has mainly been divided into three categories. First, it is well known that there is a specific relationship between the wavelength of the wave that constitutes the Kelvin mode and the velocity of the ship [11,12]. Panico et al. [13] used Kelvin wake analysis to calculate the wavelength in a certain direction for ship velocity estimation. Sun et al. [14] reconstructed wake components from multiple ships, which helped to further estimate ship geometry, orientation, velocity, etc. Zilman et al. [15] applied a fast discrete Radon transform to detect the boundary of a simulated Kelvin wake, analyzed the relationship between ship velocity and Kelvin wavelength [16] and estimated ship velocity, but their results were based on mathematical modeling, and the analog wake detection of RT is limited.
Second, using the azimuth displacement of the wake vertex and the center of the ship due to imaging to analyze the velocity of the ship, Kang and Kim [17] used a convolutional neural network (CNN) to extract the ship and the wake and then calculated the azimuth offset distance. Graziano et al. [18] first obtained the direction of the ship according to the turbulent wake and then used the azimuth offset and the Kelvin spectral wavelength to analyze the ship’s velocity, but the results were only verified in a single case.
Finally, the wake spectrum has also been used to analyze the ship’s velocity. Tuck et al. [19] estimated ship velocity by locating the peaks of the spectrum along certain slices of the Kelvin wake. Zilman et al. [12] analyzed the ship velocity through the spectrum of the Kelvin wake. Li et al. [20] proposed an automatic ship velocity estimation method based on the Kelvin wake two-dimensional spectrum of synthetic aperture radar (SAR) images. The simulation and experimental results verify that the spectrum-based method can be used to estimate the ship’s velocity. Compared with the first two methods, the wake spectrum-based method is easy to implement because it only needs to transform the image to the frequency domain by fast Fourier transform (FFT) to obtain its spectrum.
In this paper, a ship velocity analysis algorithm Ship-VNet based on optical remote sensing images containing Kelvin wakes is proposed. The flow chart is shown in Figure 1. First, the rotating target detection algorithm is used to detect the ship, and the heading of the ship is analyzed. Then, through the classical relationship between the kinematic characteristics of the ship’s Kelvin wake and the ship’s velocity, the wake is processed in the frequency domain, the parameters required for the analysis of the velocity are extracted, and an optical remote sensing image-oriented ship velocity analysis algorithm is completed. The contributions of this paper are described as follows.
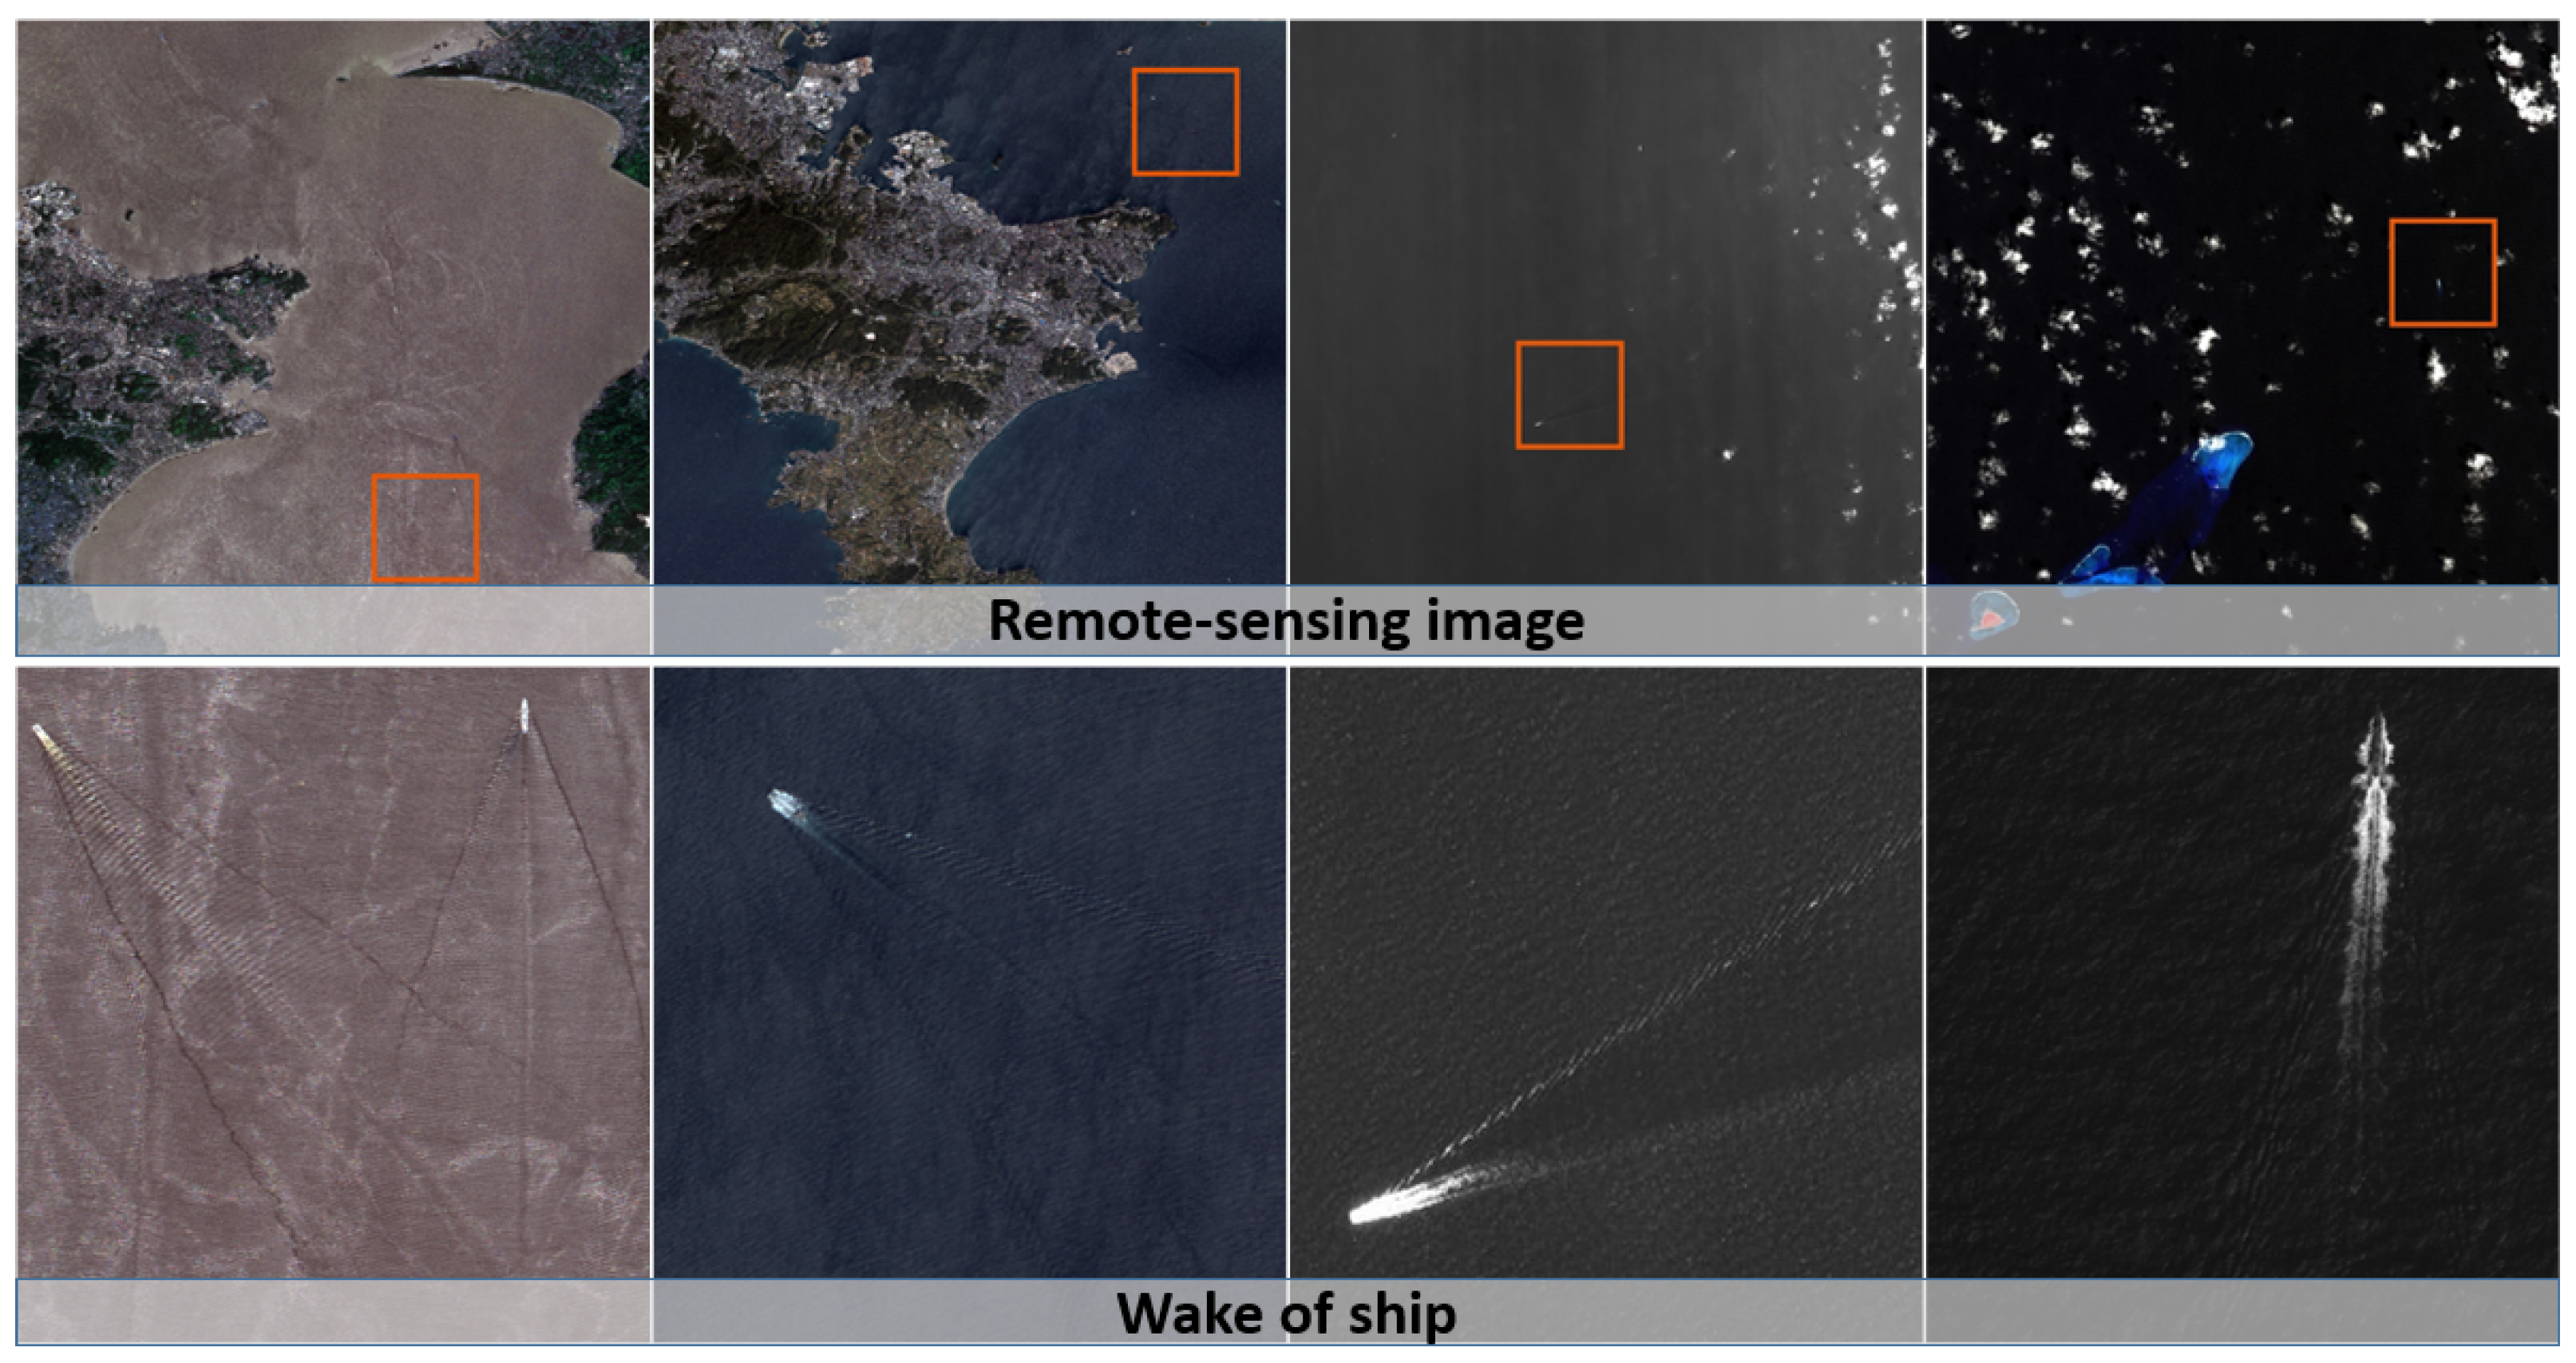
  • Aiming at the lack of corresponding data between ship wakes and ship velocity, an optical remote sensing image ship velocity and heading analysis dataset for Kelvin wakes is created.
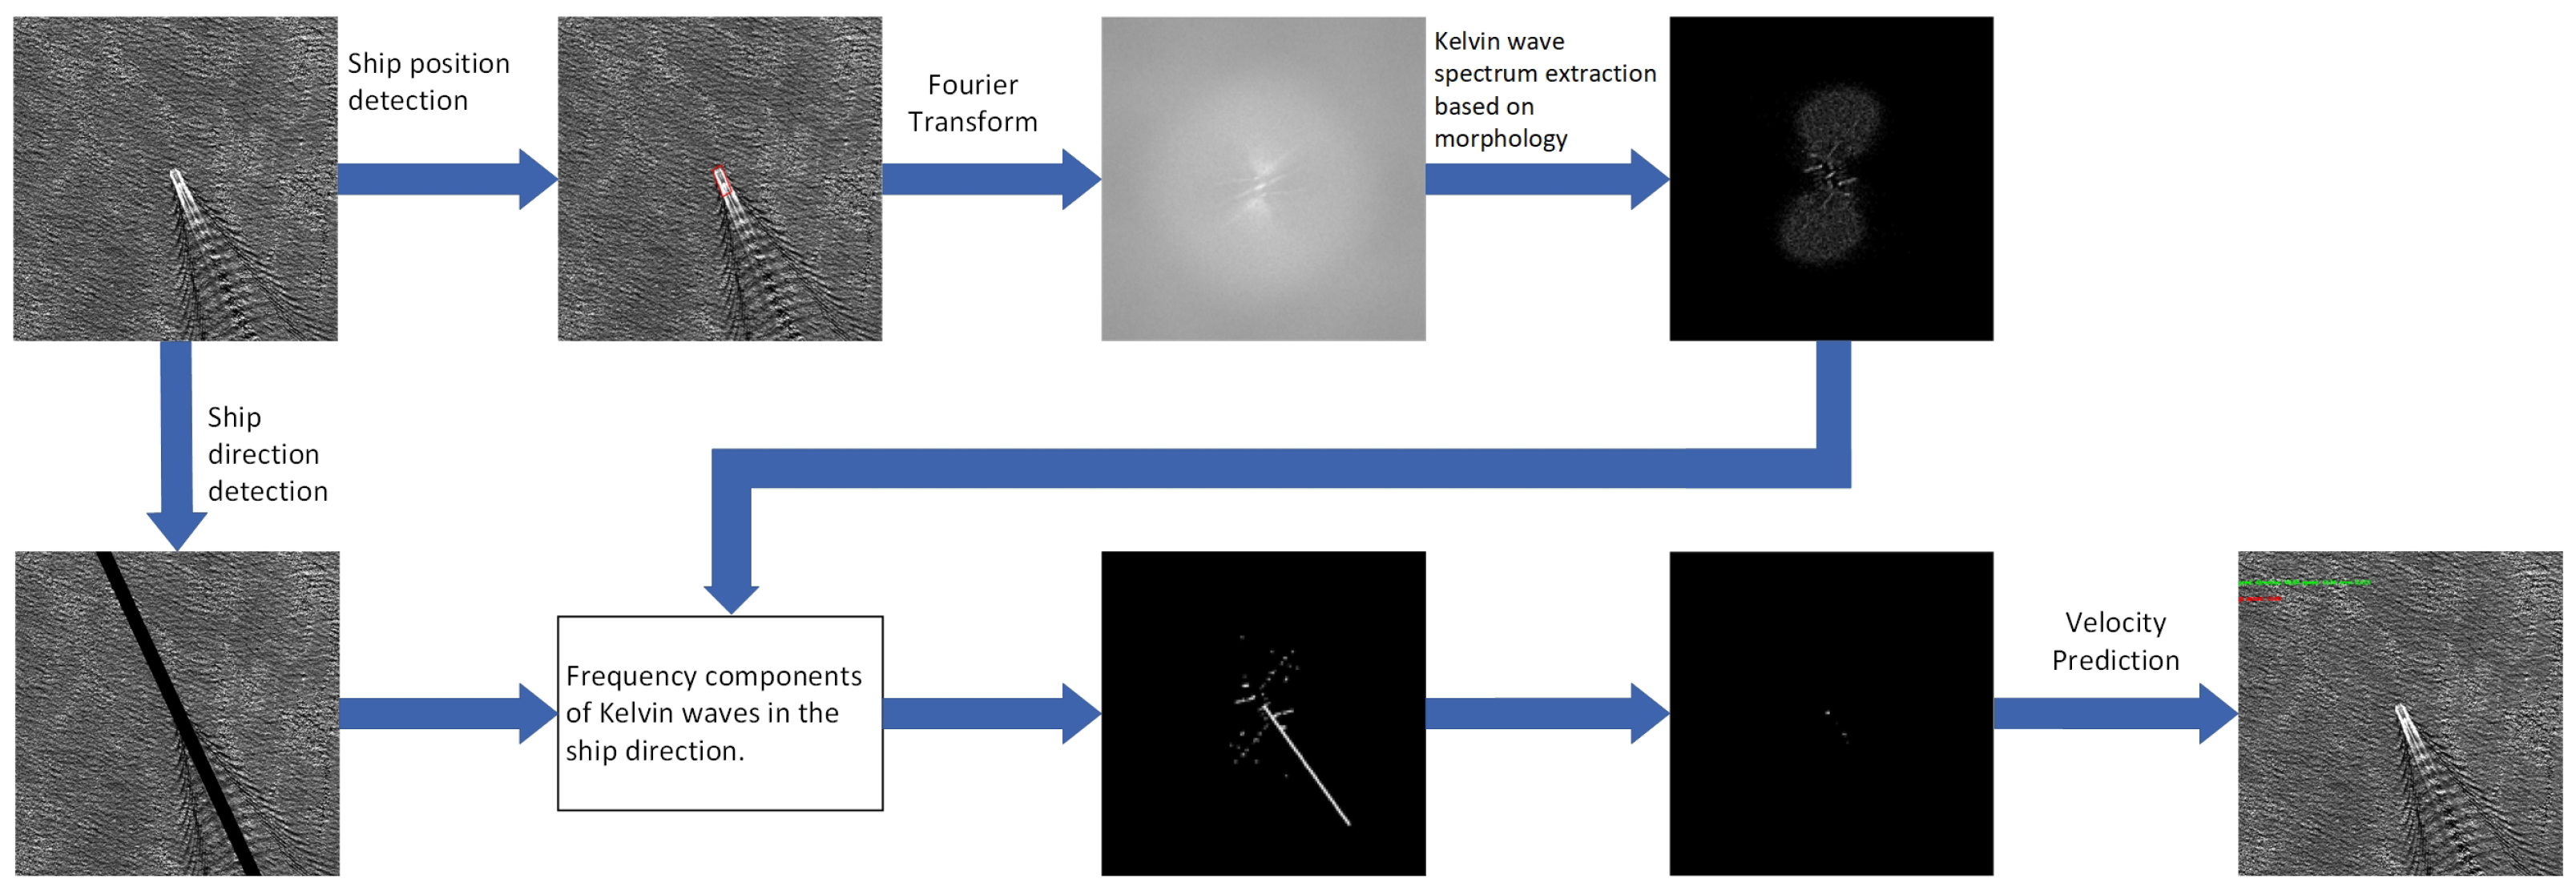
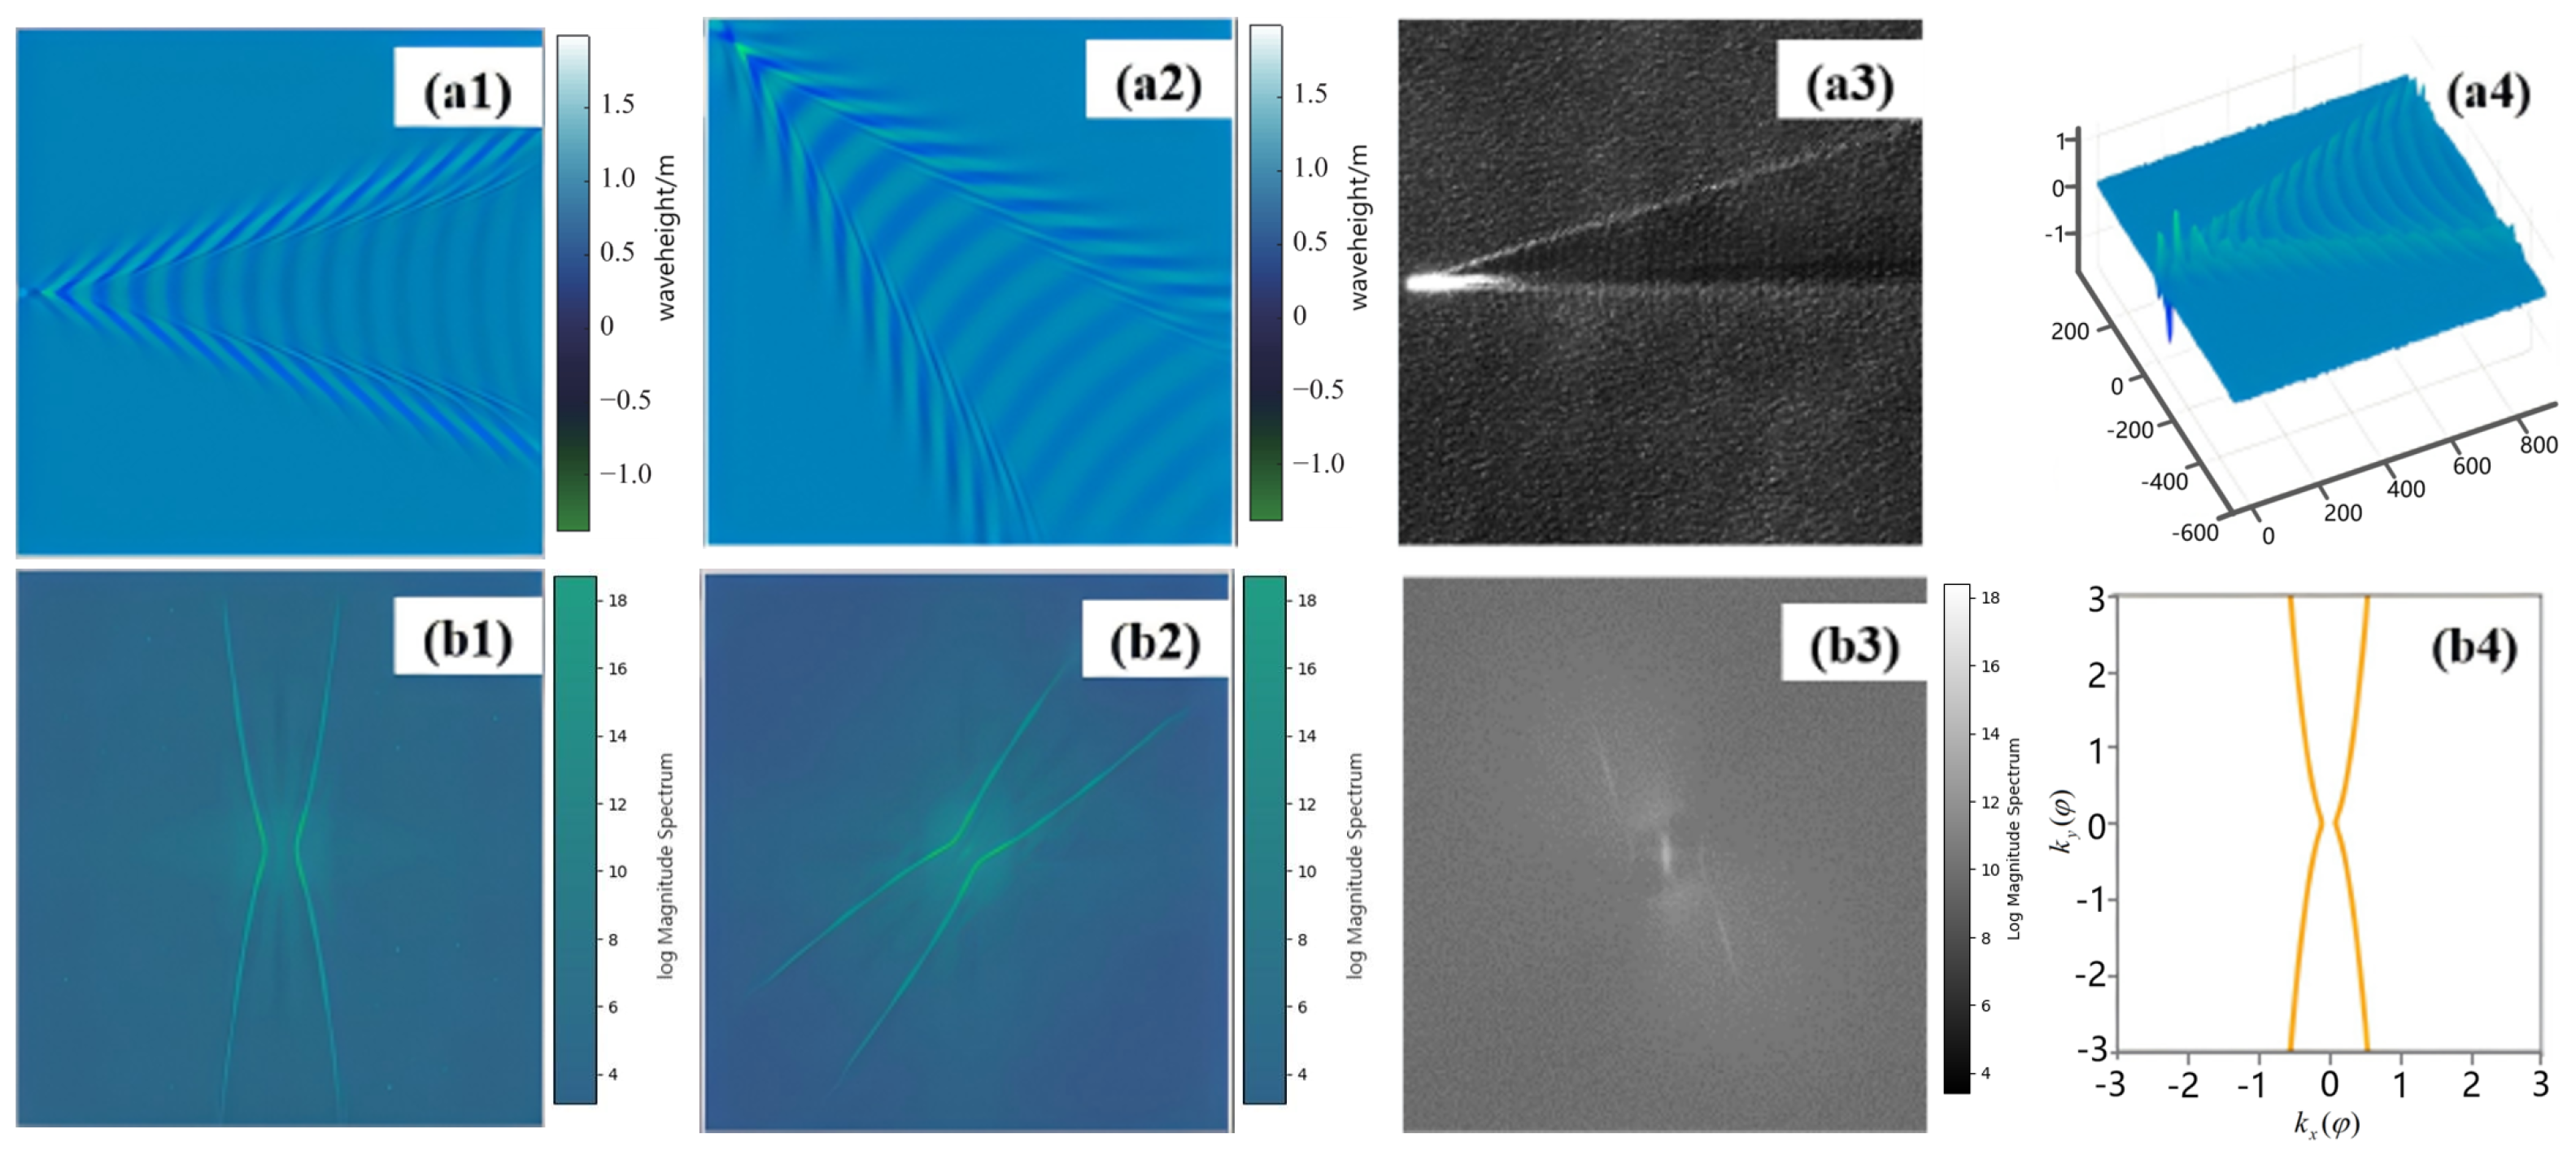
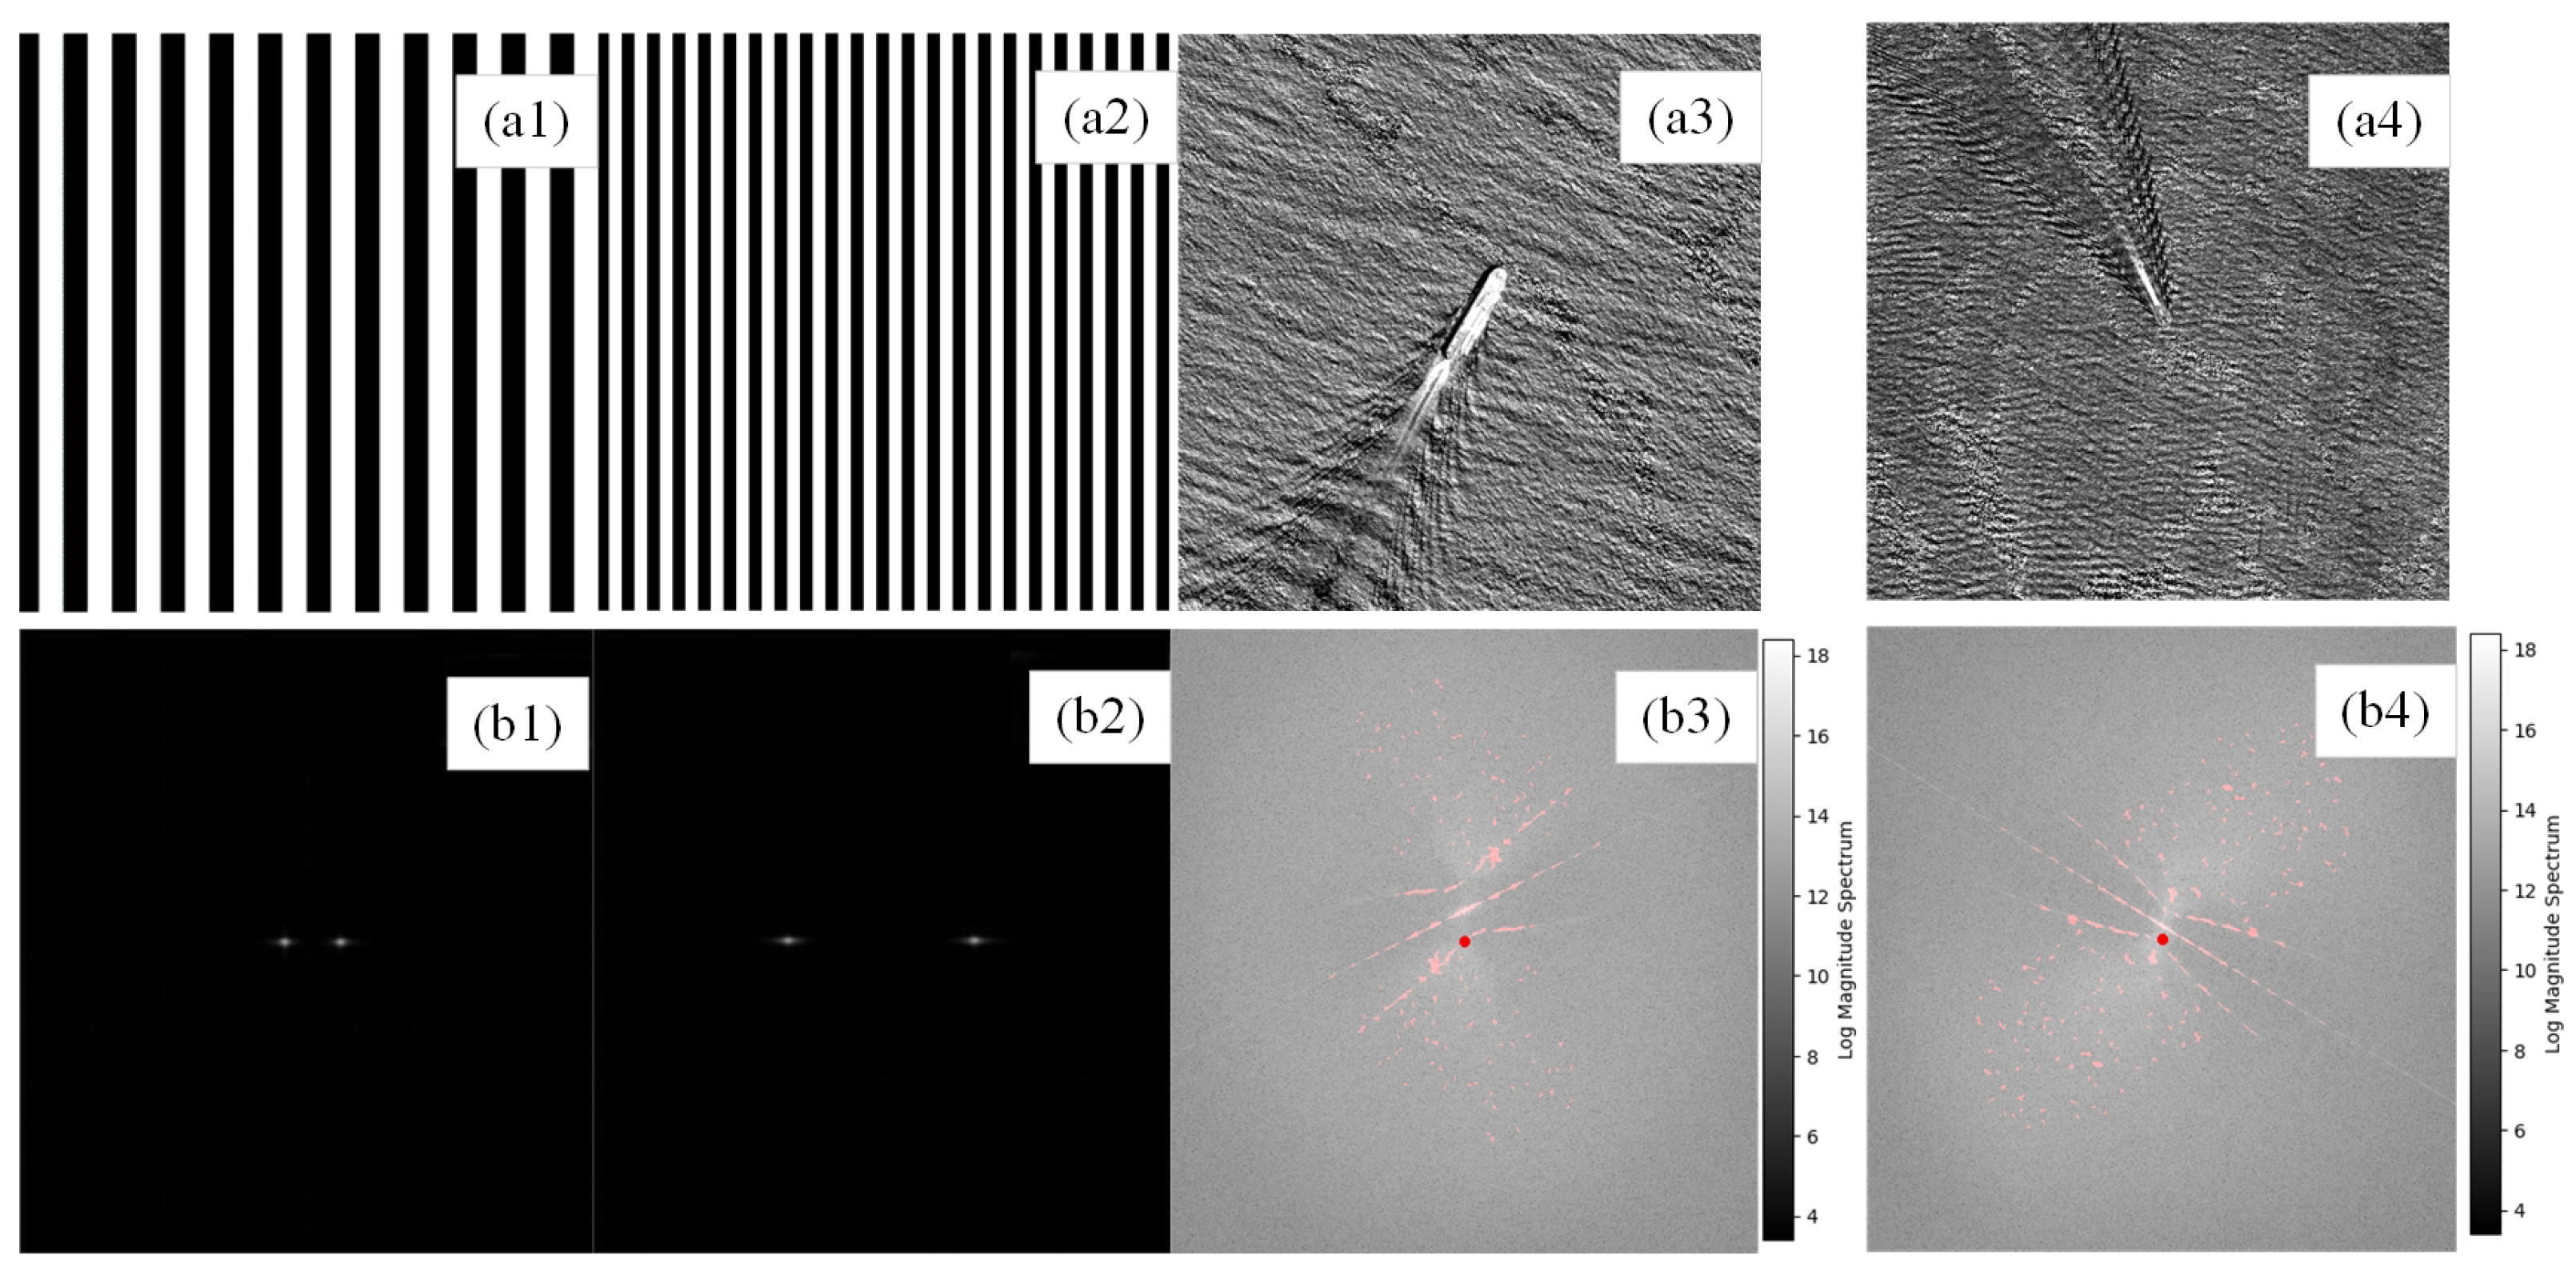
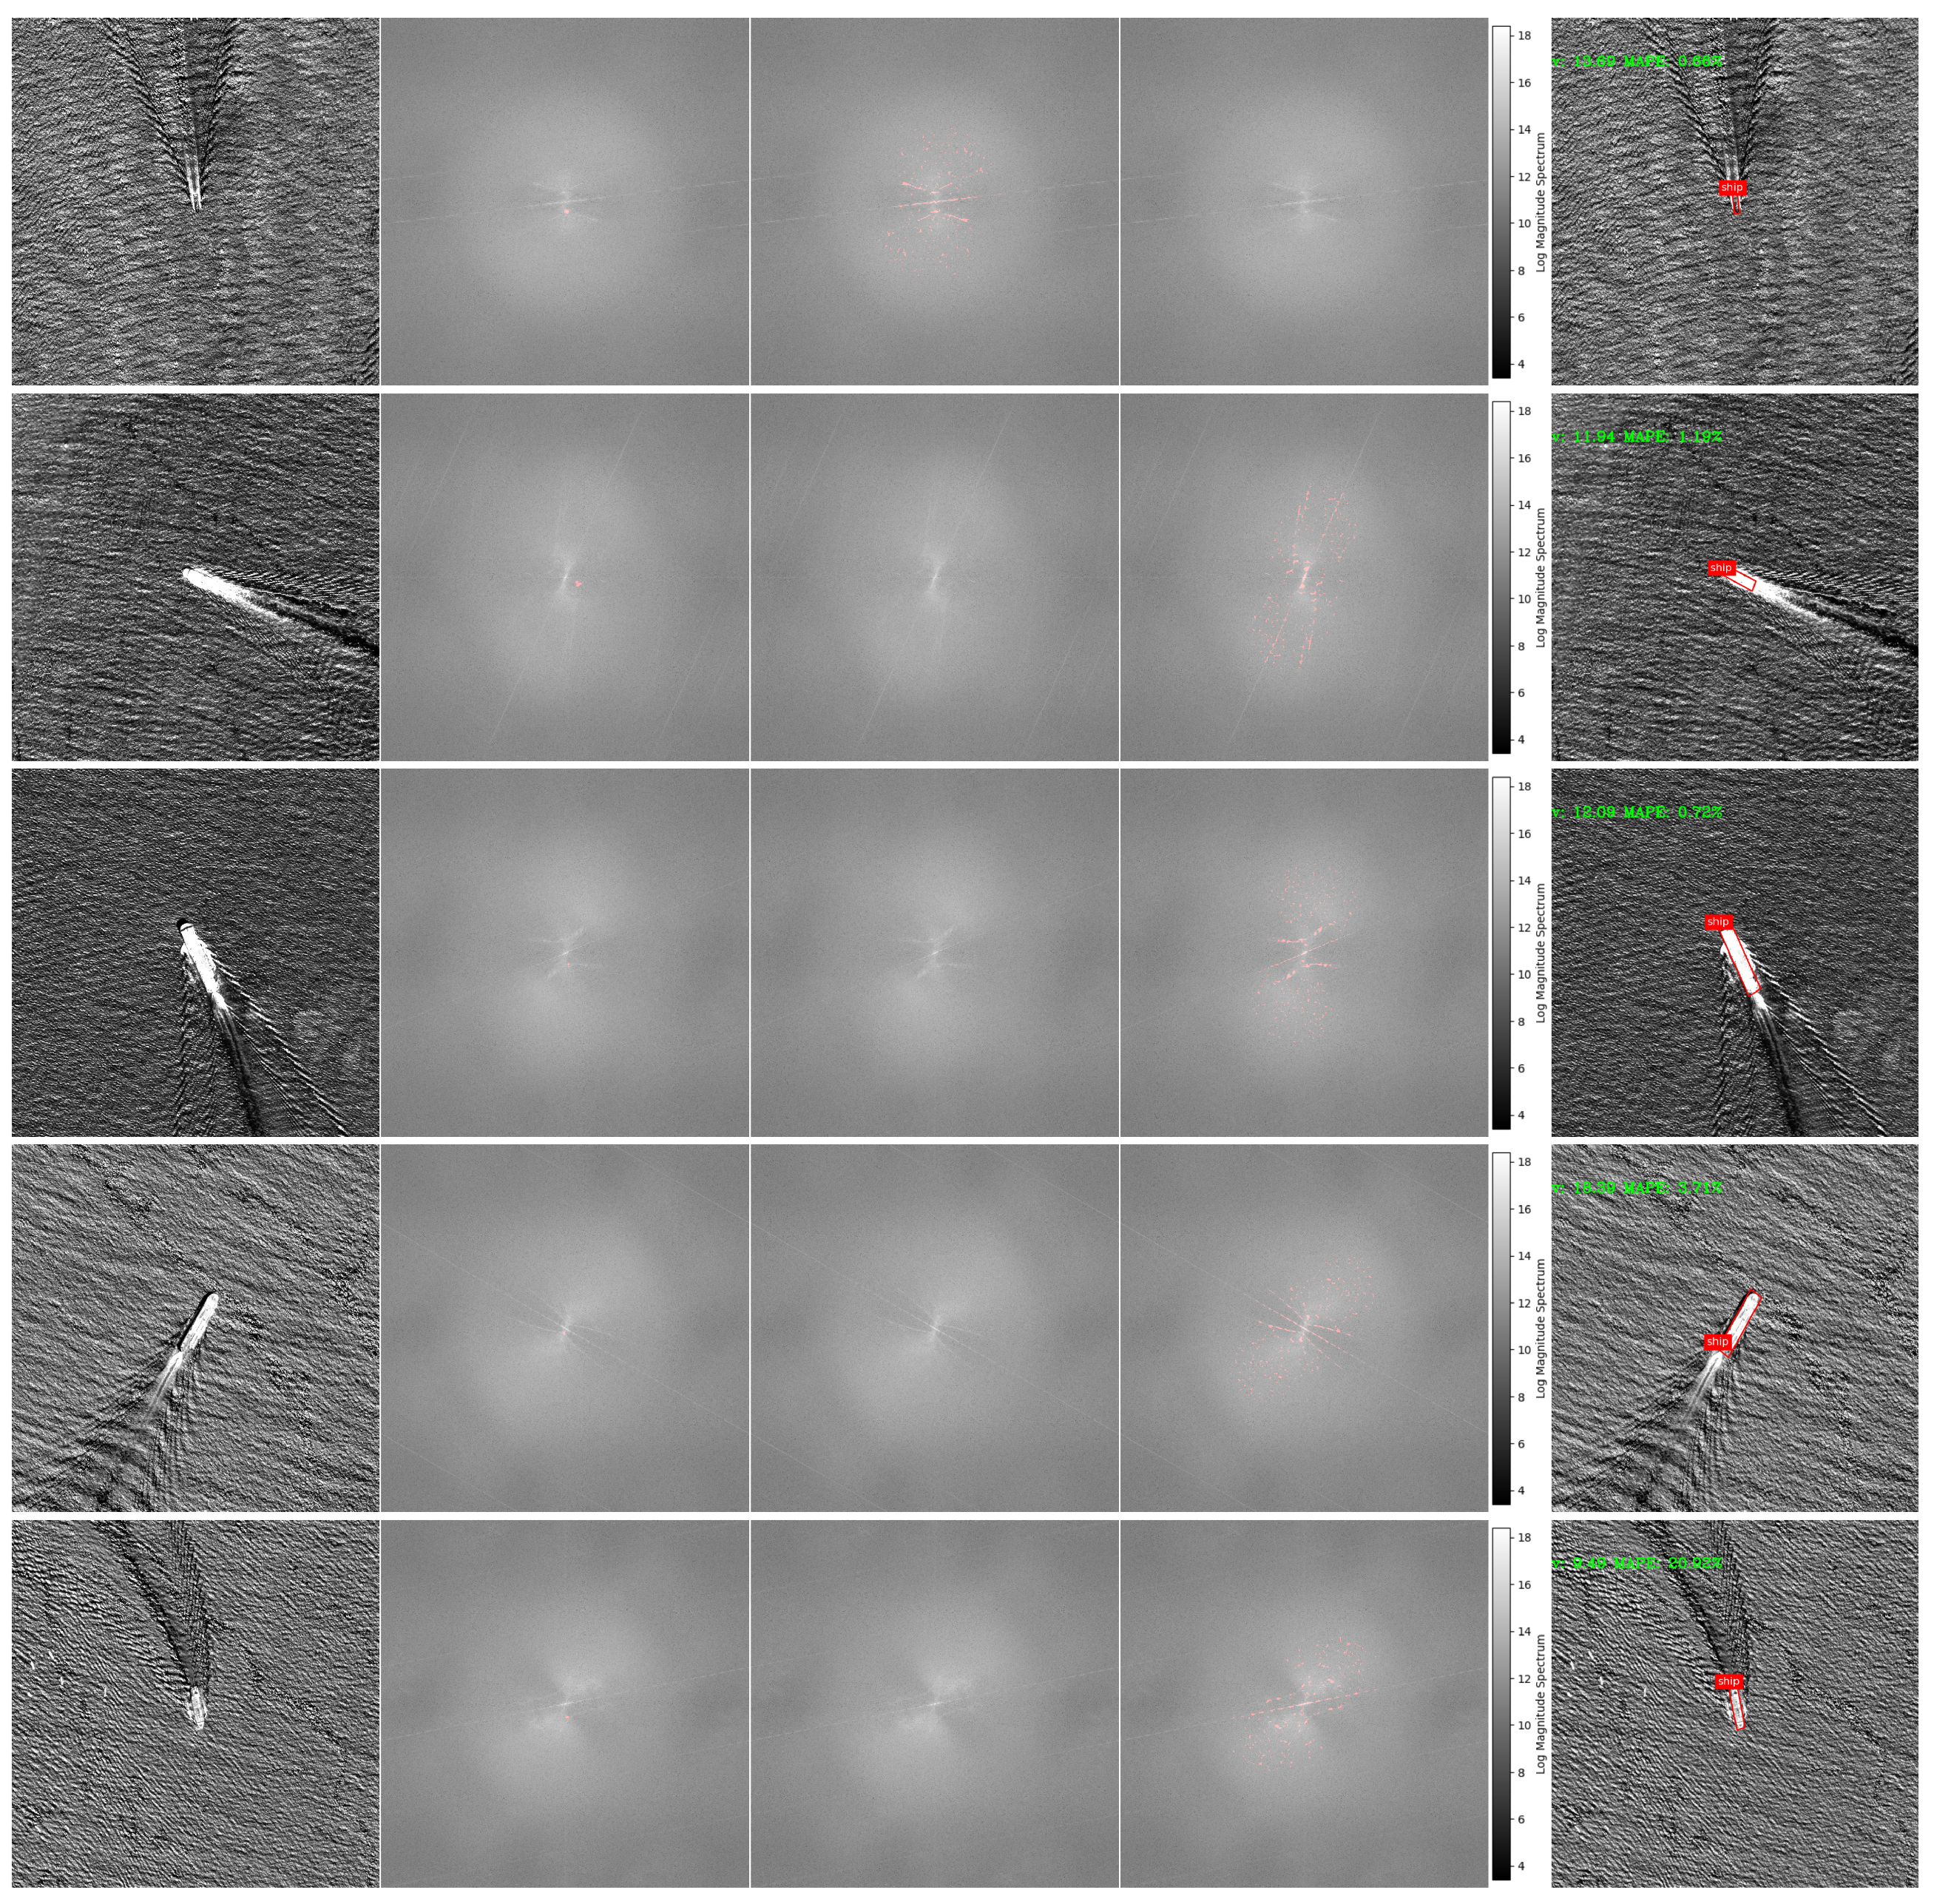
  • Aiming at the problem that the wake is difficult to define and extract under a complex background, which makes heading analysis based on the wake difficult, a heading analysis method based on rotating target detection is proposed, which uses the rotating rectangular frame to analyze the bow and stern lines of the ship. The relationship between the kinematic characteristics of the Kelvin wake and the ship velocity is studied and experimentally analyzed, and a method for processing the wake spectrum information in the frequency domain and automatically extracting the parameters required for calculating the ship velocity is used.
  • The method analyzes ship velocity information in optical remote sensing images, does not need to detect targets with sparse features of complex small targets at the same time for ships and wakes and does not need to extract the wakes separately for reconstruction, simulation and other processing.
  • The quantitative experimental results on real data show that this method can directly detect the target of ships with Kelvin wakes and automatically extract the velocity of ships.

2. Dataset Description

In images, ship wakes are the only motion features of ships, but there is currently no public dataset showing the correspondence between ship wakes and ship velocity. Therefore, this paper uses the optical remote sensing image and the corresponding automatic identification system (AIS) data to construct a ship Kelvin wake dataset with real velocity and real heading, namely, the optical ship velocity dataset (OSVD). The OSVD is derived from large-scale, high-resolution panchromatic and multispectral images obtained by the Jilin-1 push-sweep. First, ships with Kelvin wakes were selected from 61 ultrahigh-resolution remote sensing images (Figure 2 is an example of the above selection). In addition, through rigorous data cleaning, we processed the large amount of AIS data obtained, including removing duplicate entries, filtering out anomalies in speed and heading [21] and eliminating data with abnormal positions [22], ultimately resulting in high-quality and reliable AIS data. According to the shooting time and area information of the remote sensing image, the cleaned AIS point data were retrieved and superimposed into the image. Then, the longitude, latitude, size and heading of the target ship are sorted and matched with the AIS point data. Finally, the velocity information of the target ship corresponding to the AIS is extracted and arranged in the real label of the dataset. The distribution of ship targets in marine scenes is sparse, which makes it difficult to find ships with obvious wakes. Finally, the OSVD constructed in this paper contains 61 optical remote sensing images.

3. Methodology

3.1. Ship Direction Extraction

In the complex sea background, the wake is difficult to define and extract, and the direct detection of the wake has considerable problems, including misclassification and blurred boundaries. Therefore, it is often necessary to use a wake reconstruction algorithm to restore the original features of the wake as much as possible. Thus, the whole process is complicated and slow, which affects the velocity and heading analysis. Using the target detection algorithm to directly detect the ship to obtain the heading information of the ship has better stability and robustness. In this paper, the YOLOv5 model, which has a lower amount of calculation, fast recognition velocity, and is friendly to small targets, is used for velocity extraction.
In real remote sensing images, targets can be distributed in any direction. This paper improves the ship target detection network in optical remote sensing images. The original YOLOv5 network can only detect horizontal boxes, making it difficult to accurately express the target’s position and range. If the angle between the target’s edge and the coordinate axis is large, the horizontal rectangular box will contain a lot of redundant information. To address this issue, we added an angle prediction channel and replaced the horizontal rectangular box with a rotated rectangular box, significantly reducing redundant information. By constructing a new angle loss function to constrain the model and increasing the network’s output dimensions, the detection frame becomes a rotated rectangular frame. For ship targets with a large aspect ratio, the detection results can be more accurate, minimizing redundant information in the detection box. The angle loss function uses the L2 norm loss function, and its expression is shown in Equation (1):
L a n g = i N I i o b j C θ i O θ i 2
Among them, I i o b j means that I i o b j is equal to 1 when there is a target of interest in the i-th rectangular box and is equal to 0 if it does not exist. A value of C θ i means that the output angle value is finally predicted by the network model, and O θ i denotes the rotation angle of the real target rectangular box obtained automatically from the point position.
According to the rotating target detection algorithm, accurate position information of the target can be obtained. In determining the angle of a ship, we utilized the five-parameter definition method and the long-side definition method. The five parameters include the x-coordinate and y-coordinate of the center of the detection box, and the width w, height h and angle θ of the box. The five-parameter definition method allows for higher detection accuracy and computational efficiency in the field of rotated object detection. It also demonstrates excellent robustness and adaptability, making it suitable for various application scenarios. On the other hand, the long-side definition method calculates the center point coordinates of the rotated rectangular target, the length of the long side, the length of the short side and the rotation angle of the long side relative to the horizontal axis to accurately describe the target’s boundary and orientation. For ships, it can be regarded as a rectangle. The longer sides of the rectangle are the sides of the ship, while the shorter sides correspond to the bow and stern of the ship. Since the detection method of the rotating rectangular frame is adopted, the direction parallel to the long side of the detection rectangular frame is the bow and stern line of the ship. From the gray distribution outside the two short sides of the rectangular box, the bow with the smaller gray variance is the ship’s bow because the stern has an obvious turbulent wake, so it has a larger gray variance.

3.2. Velocity Analysis

According to the existing studies, the wake elevations of Kelvin wakes from a ship moving along the x-axis at a speed of V can be described as follows [23]:
h w = Re π 2 π 2 A φ e j k x φ x + k y φ y
In the formula, R e represents the real part; A φ is the free spectrum function of the ship, which is determined by the ship’s own parameters; φ is the angle between the wave propagation direction and the opposite direction of the ship’s motion; k x φ and k y φ are the wavenumbers along the x and y directions, respectively; k x φ and k y φ can be pushed out by k φ   =   g g V 2 COS 2 φ V 2 CO S 2 φ ; and g is the gravitational acceleration.
Equation (2) shows that the Kelvin wake wave elevations are related to the current velocity V of the ship. After further research, the relationship between the wavelength λ of the Kelvin wake transverse wave and the velocity V of the ship can be obtained as follows:
λ   =   2 π V 2 CO S 2 φ 2 π V 2 COS 2 φ g g
Then, Equation (2) is transformed into the two-dimensional frequency domain in Fourier transform, and the Kelvin wake in the frequency domain can be obtained as the wave elevation spectrum:
S α , β = π 2 π 2 A φ δ α k x φ k x φ 2 π 2 π δ β k y φ k y φ 2 π 2 π d φ
where δ is the Dirac function. The nonzero values appear only when the following relationship is satisfied:
α k x φ k x φ 2 π 2 π = 0
β k y φ k y φ 2 π 2 π = 0
According to k x φ = g sin φ se c 2 φ g sin φ se c 2 φ V 2 V 2 and k y φ = g sec φ g sec φ V 2 V 2 , the feature distribution of the wake elevations of Kelvin’s wake in the frequency domain can be obtained as follows:
α = g g 2 π 2 π V 2 cos φ
β = g sec φ g sec φ 2 π 2 π V 2
In this paper, 3D simulation modeling of the sea surface with Kelvin wakes is carried out. We used MATLAB software version R2022b to perform 3D modeling of the ship’s Kelvin waves, simulating parameters such as speed, wavelength, and wave height. By rendering the 3D model, we can visually observe the three-dimensional form of the ship’s Kelvin waves, which helps us better understand the propagation and attenuation patterns of the waves.
Figure 3 shows the simulated Kelvin wakes based on Equation (1) and the corresponding spectrum in the 2D frequency domain and compares it with the 2D spectrum of the ship Kelvin wake in the real optical remote sensing image. The ship velocity V and the headings φ are V = 14 m/s and φ = 45 for Figure 3(b1). Figure 3(b3) is the two-dimensional spectrum of the ship’s Kelvin wake in the real optical remote sensing image. Compared with the Kelvin simulated wake in Figure 3(b1), the low-frequency information is very close to the analog spectral image. However, in addition to the Kelvin wake, the real optical remote sensing image also contains a large amount of noise generated by the sea surface [24], which makes the low-frequency information of the spectral image less obvious and difficult to extract. This is also a challenging problem for analyzing ship velocity. In addition, for ship velocities of V = 14 m/s and g = 9 . 8 m m s 2 s 2 , according to the above formula, Figure 3(b4), the Kelvin wake elevation spectrum curve is drawn, which is consistent with the simulated spectrum and the real spectrum. This also verifies the correctness of the formula derivation and the applicability of the theoretical formula in real optical remote sensing images.
The discretization of continuous signals is necessary because computers cannot handle continuous signals. In the actual image processing process, it is necessary to perform a discrete Fourier transform on remote sensing images, that is, for Equation (2) to perform a discrete Fourier transform. Therefore, the above derivation process can be further extended. For a Kelvin wake image with width w and height h, the wave height spectrum image obtained after performing a discrete Fourier transform can be described as follows:
S ( α , β ) = π 2 π 2 A ( φ ) x = 0 w 1 y = 0 h 1 e j 2 π α w k x ( φ ) 2 π x + β h k y ( φ ) 2 π y d φ
At this point, the values in the wake wave height spectrum must satisfy the following conditions:
α w k x ( φ ) 2 π = 0
β h k y ( φ ) 2 π = 0
Based on the above results, further analysis can determine the relationship between the ship’s speed and the α - β coordinates in the wave height spectrum’s frequency domain. According to k ( φ ) = k x ( φ ) 2 + k y ( φ ) 2 , we can derive the following:
k φ = 2 π α 2 w 2 + β 2 h 2
where w is the width of the image containing the Kelvin wakes, and h is the height. When φ = 0 and w = h , then we have
V 2 = h g 2 π α 2 + β 2
When the spatial resolution of the image is r (m/pixel) in both the x and y directions, after unit conversion, Equation (13) is converted to the true velocity as follows:
V 2 = h g r 2 2 π α 2 + β 2
According to Equation (14), d = α 2 + β 2 and k = h g r 2 2 π can be written as follows:
V 2 = k d
The parameters of k are all known. From the definition of d, its size is the distance from the intersection point of the Kelvin wake elevation spectrum curve and ship course to the center point of the spectrum. Therefore, the next step is to extract d in the 2D spectral image of the remote sensing image. To more intuitively show why extracting d can analyze the velocity, here are a few examples. The lower the frequency of the sine wave is, the closer the symmetrical frequency point is to the center of the spectrum [25]. As the frequency continues to increase, the symmetrical frequency point is farther away from the center of the spectrum [26]. It is well known that the distance between frequency points is closely related to the frequency of the sine wave. The two-dimensional spectral image of the remote sensing image is also obtained by decomposing the signal into sine waves according to the Fourier transform. Figure 4 shows the distribution of the spectral images of different frequencies. Figure 4(a1,a2) are low-frequency and high-frequency sine waves, respectively. Figure 4(b1,b2) are the spectrum images corresponding to Figure 4(a1,a2), respectively. After the spectrum is centralized, the frequency of the sine wave is closer to the center. The closer the frequency is, the lower the frequency is; the further away from the center it is, the higher the frequency is. Figure 4(b3,b4) show the spectral images of the optical remote sensing images with the true velocity of the ship being 11.00 m/s and 19.10 m/s, respectively, where the red point is the position of k. After the spectrum is centralized, the closer to the center k is, the greater the true velocity of the ship is.
Therefore, we can analyze the ship velocity by the following steps. First, taking the position coordinates of the ship detected by the target detection algorithm as the center point, the high-resolution optical remote sensing image is sliced to obtain the ship image containing the Kelvin wake. Second, the image is preprocessed to remove redundant noise outside the Kelvin wake [27]. Then, a Fourier transform is performed, and image processing operations, such as threshold filtering and removal of small, connected regions, are performed on the obtained two-dimensional spectral image of the Kelvin wake to make the spectral response of the Kelvin wake more obvious. Finally, a straight line is drawn from the center point of the two-dimensional spectrum along the bow and stern lines of the ship, and the straight line extends to the wave elevation spectral curve of the Kelvin wake. This line segment is the desired parameter k. Since the Fourier transform is center-conjugate symmetric, it is not necessary to consider the bow and stern of the ship. After the parameter k is obtained, the parameter is brought into Equation (15) for calculation, and the analysis of the ship velocity of the optical remote sensing image can be completed.

4. Experiments

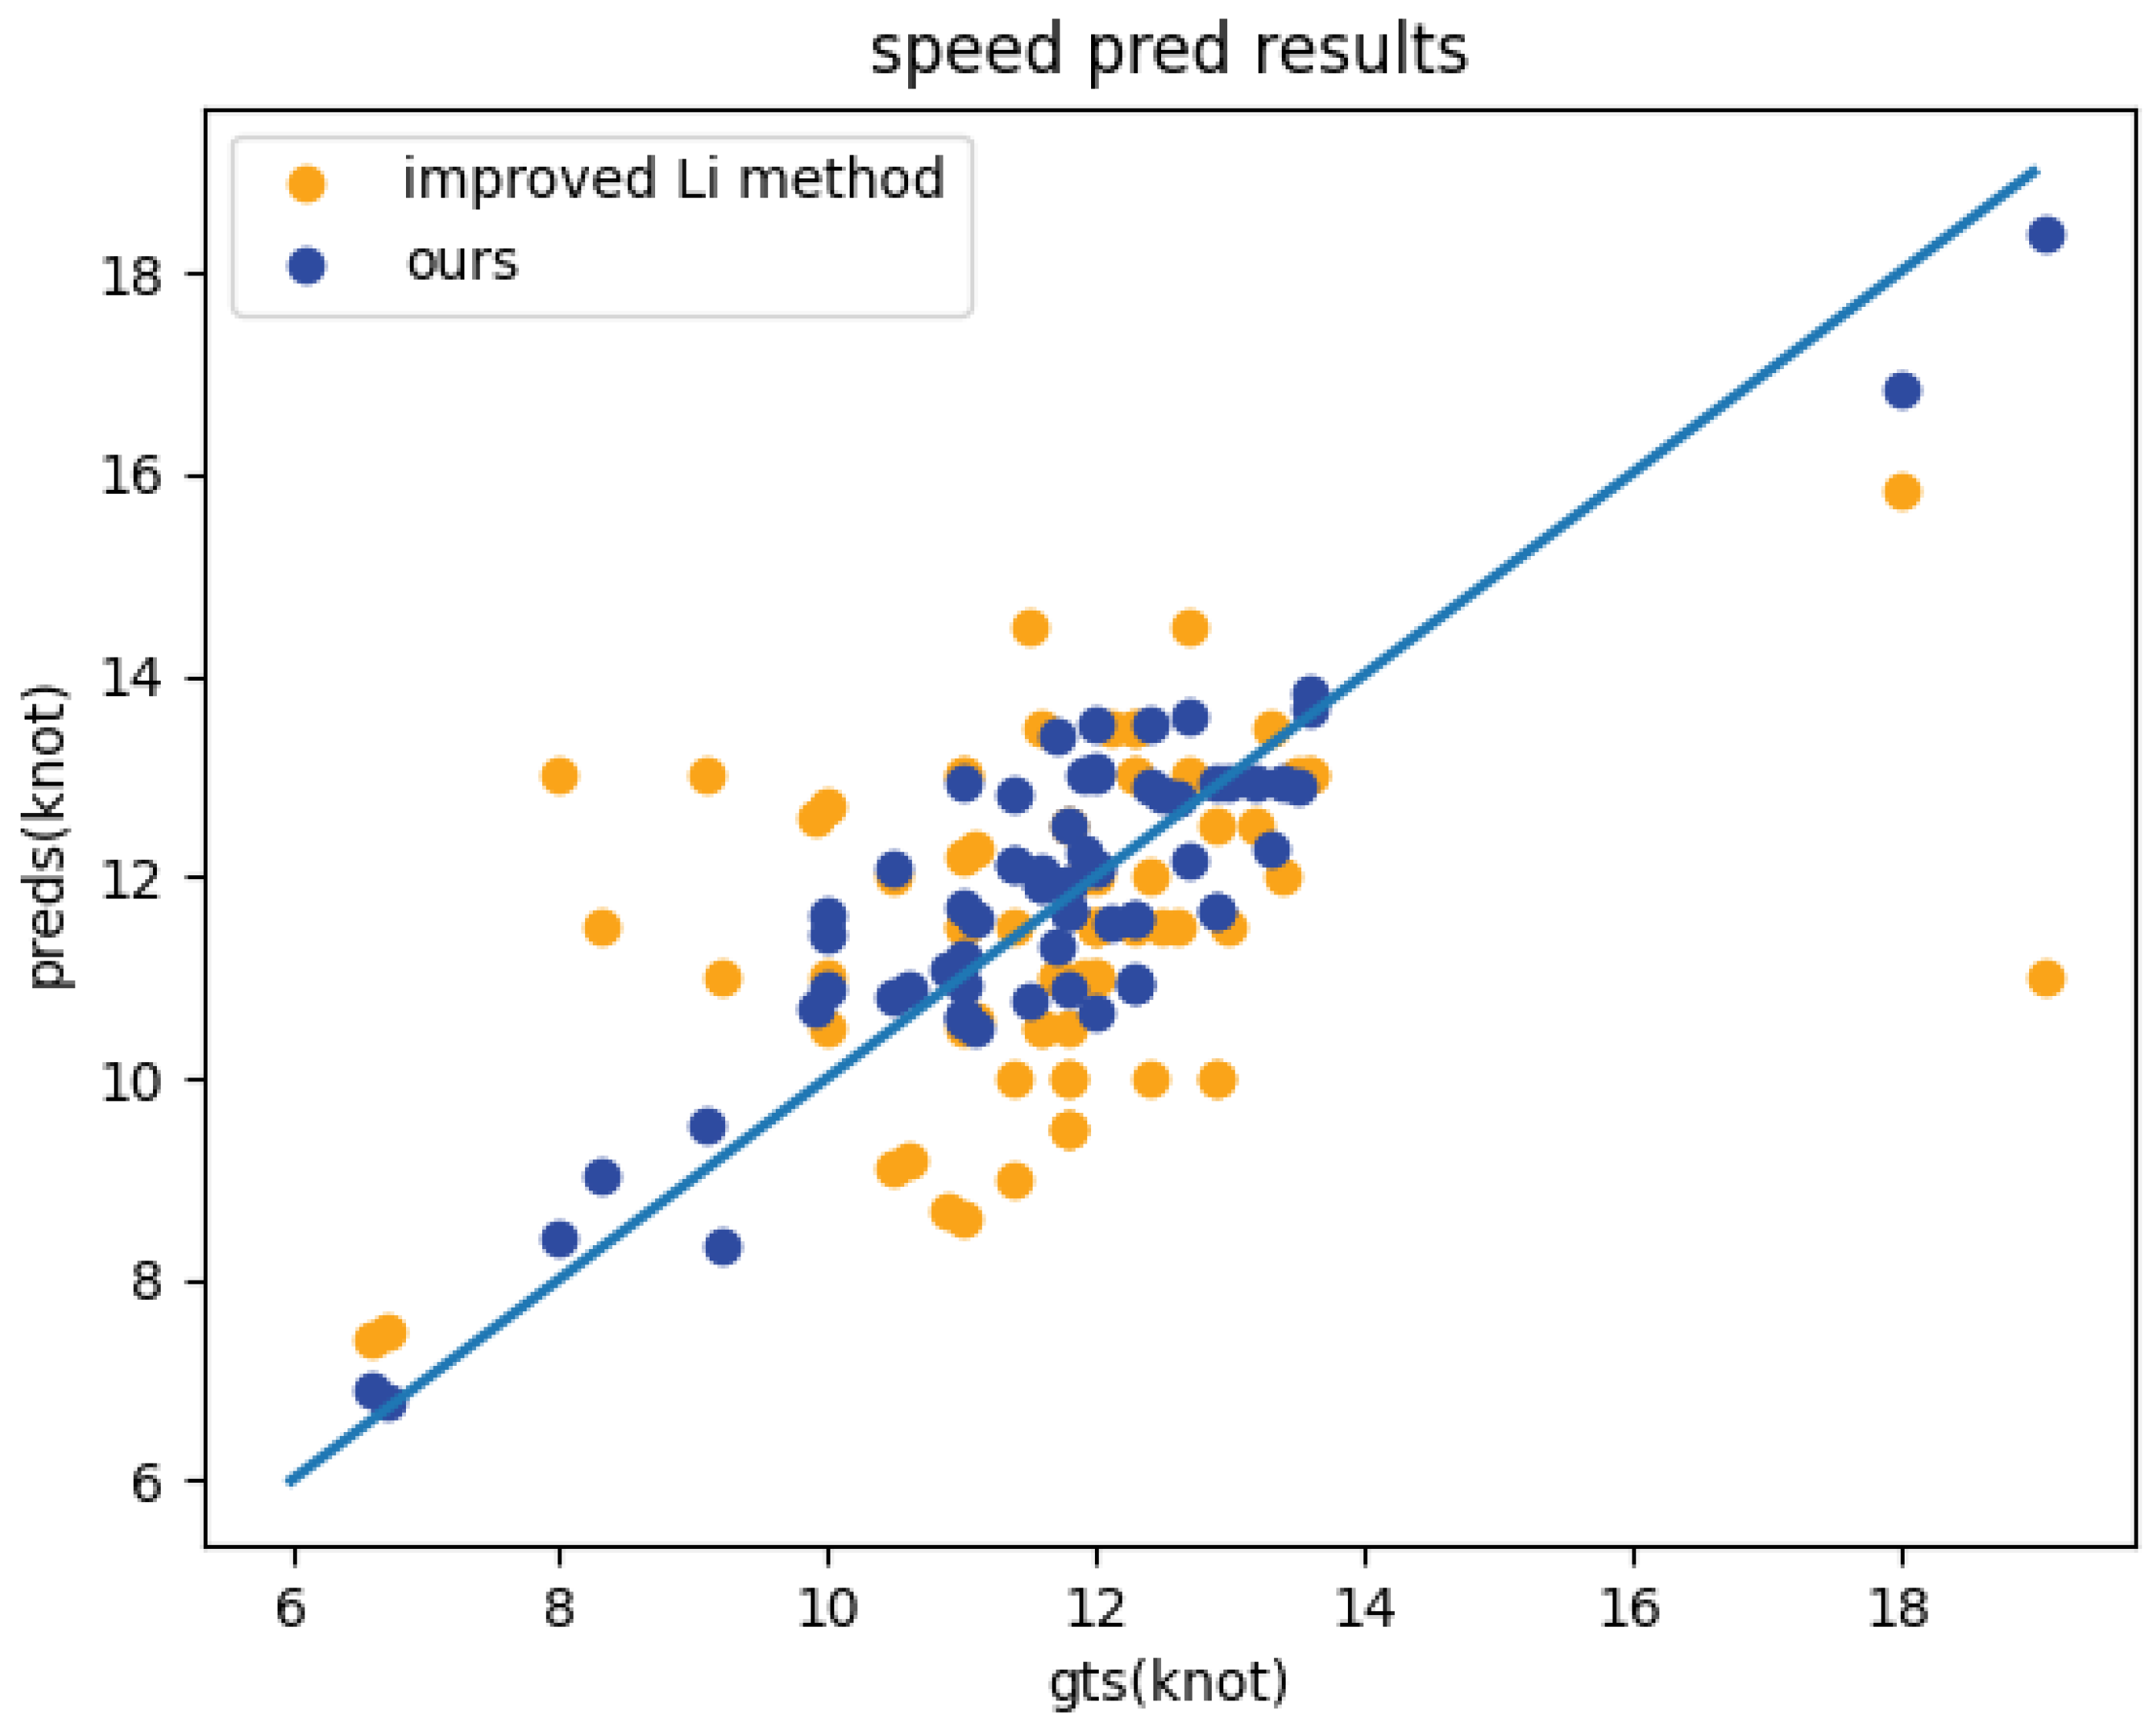
4.1. Evaluation Index of Ship Velocity Analysis
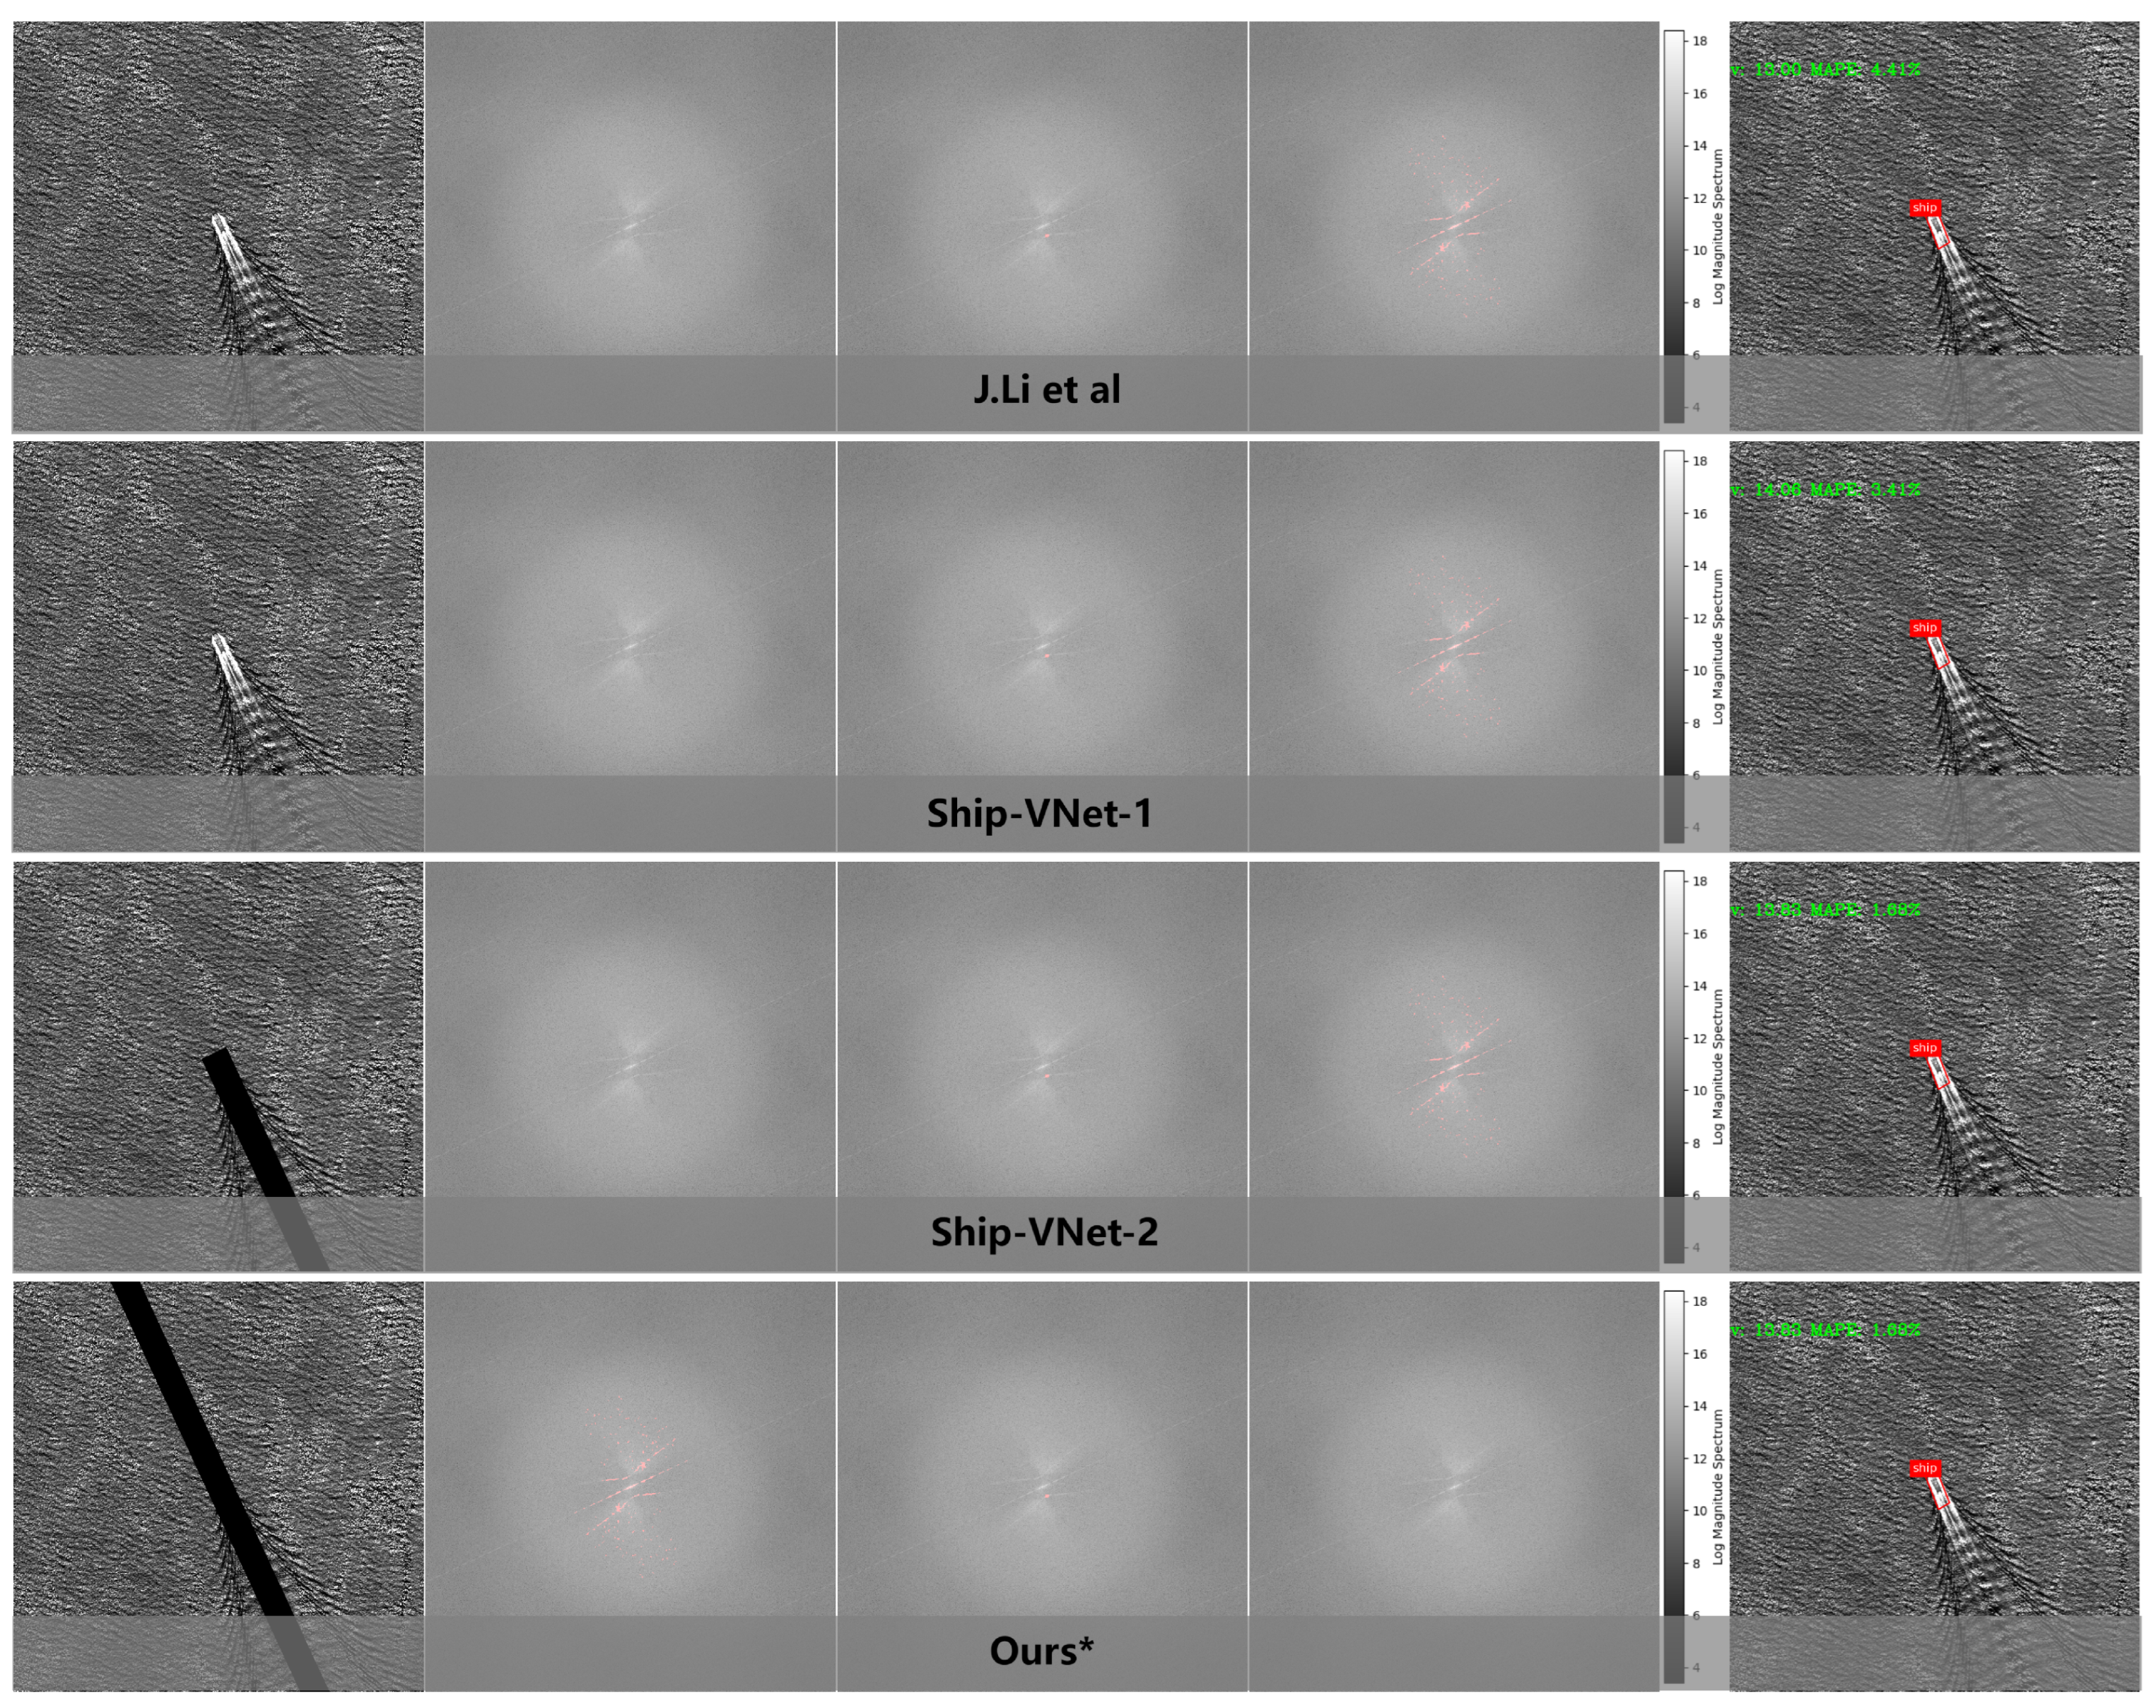
Since the velocity is directional, to prevent the cancellation of positive and negative errors and to achieve a more accurate evaluation of the model, this paper uses the mean absolute percentage error (MAPE) as the evaluation metric for velocity analysis, defined as follows:
MAPE v , v ˜ = 1 n s a m p l e s i = 0 n s a m p l e s 1 v i v ˜ i v i

4.2. Results

Figure 5 shows part of the analysis results of Ship-VNet on the homemade dataset OSVD. In the quantitative accuracy test, we compare the ship velocity analyzed by Ship-VNet with the AIS data. Compared with the AIS data, the ship velocity MAPE analyzed by Ship-VNet is 6.07%, which means that the accuracy of Ship-VNet is 93.93%. Figure 6 is the scatter plot of the predicted ship velocity and real AIS velocity obtained by Li’s method and Ship-VNet.
In the process of constructing Ship-VNet, the turbulent wake of the ship has a certain influence on the automatic extraction of the required parameters from the two-dimensional spectral image. In this paper, the two short edges of the rotating rectangle are extended to both ends of the ship head and tail lines, respectively, and then the inside of the rectangle is filled with the maximum gray value. However, the turbulent wake is only generated at the stern of the ship. The above operations include the bow and stern of the ship. After experiments and discussions, this paper finds that retaining the original gray value for the bow direction of the ship is necessary to extract and analyze the velocity of the ship in the frequency domain. The parameters have no effect, and to retain the gray value of the bow direction, the gray value variance needs to be calculated to distinguish the bow and stern, which increases the calculation amount of the model.
To verify the advantages of Ship-VNet, a comparative experiment was conducted using the OSVD dataset constructed in this paper. However, there are very few studies on the use of optical remote sensing images to analyze the velocity of ships, so this paper only compares the method of Li et al. [20], which also uses the Kelvin wake spectrum to analyze the velocity of ships. Li et al. [20] constructed a simulated Kelvin wake wave hyperspectral curve in the frequency domain according to the relationship between the derived Kelvin wake elevation spectrum curve and the ship’s direction and velocity. The numerical range of the ship’s direction and velocity is given in advance, and through the defined matching matrix, the maximum value fitting of the simulated curve and the Kelvin wake spectrum is performed to estimate the ship’s velocity. Unlike the simulated Kelvin wake, which has clear frequency domain features, the real optical remote sensing image contains considerable sea surface noise [28], resulting in more low-frequency redundant information after converting the frequency domain. Therefore, the ship’s heading extracted by Li et al.’s [20] method in the frequency domain has a large error, which makes it difficult to fit the simulated Kelvin wake wave hyperspectral curve constructed by this method with the real wake spectrum in the frequency domain. In contrast, Ship-VNet uses a variety of threshold filtering methods to directly process the frequency domain of optical remote sensing images, and combined with the ship heading detected by the ship target, the position of the Kelvin wake wave hyperspectral curve can be more accurately located. In Table 1, the results of Ship-VNet and Li et al.’s [20] method and the method of unmasked turbulent wakes in the OSVD dataset are shown. Experiments show that Ship-VNet reduces the MAPE by 6.32% compared with the method of Li et al. [20]. Compared with Ship-VNet-1, which does not mask the turbulent wake, the MAPE is reduced by 4.75% in OSVD, and the effect is significantly improved. Figure 7 shows the results of different methods on the same image.

4.3. Further Work

Although this study primarily focuses on optical remote sensing images, the wake-based approach may also be applicable to synthetic aperture radar (SAR) images. However, the remote sensing images required for the experiment must be wide-swath and captured while the ship is in motion. Currently, such suitable SAR and ISAR images are relatively scarce, preventing us from conducting this experiment at this time. Our next step will be to collect suitable SAR remote sensing images and conduct experiments using our method to predict ship speed in SAR images.
Additionally, noise has a certain impact on the spectrogram generated by the Fourier transform in optical remote sensing images. In our future research, we will focus on analyzing the effect of noise on the accuracy of our experiments and work to further optimize and improve noise handling methods. We believe that employing the correct denoising techniques will significantly enhance the model’s accuracy and robustness.
Finally, our current method primarily focuses on the estimation of translational motion and has not yet been extended to estimate rotational motion parameters. We have prioritized ensuring the accuracy and reliability of translational motion estimation, while also recognizing the importance of rotational motion estimation. Additionally, Ship-VNet performs poorly on Kelvin wakes with large curvature and unconventional wakes. Therefore, in future research, we plan to not only delve deeper into the estimation of rotational motion parameters but also improve our method to better handle these complex wakes, enhancing its overall comprehensiveness and practicality.

5. Conclusions

The innovation of this paper lies in the proposal of Ship-VNet, a model for ship velocity analysis in optical remote sensing images based on Kelvin wakes. First, the improved target detection algorithm is used to detect the ship target, the coordinate information of the rotating detection frame is converted into the ship heading information, and the image of a certain pixel area containing the ship wake is retained with the rotating detection frame as the center. Then, the image is subjected to a discrete Fourier transform to make the spectral curve of the Kelvin wake clearer in the frequency domain. With the ship heading information, the parameters needed to calculate the ship velocity are automatically extracted to complete the ship velocity analysis. This paper does not directly detect targets in wakes with more fragile features but adopts a method of processing ships and accompanying wakes in the frequency domain. To verify the model effect in the future, this paper constructs a dataset with real AIS ship velocity information. The experimental results show that the Ship-VNet model is more accurate and robust than the existing ship velocity analysis algorithms.

Author Contributions

Conceptualization: M.G.; Methodology: W.K.; Software: M.G.; Validation: L.M.; formal analysis: M.G.; investigation: M.G. and L.W.; resources: W.K.; data curation: L.W.; writing—original draft preparation: L.M. and Y.H.; writing—review and editing: S.F., L.M. and K.Z.; visualization: Y.H.; supervision: S.F.; project administration: S.F.; funding acquisition: M.G. All authors have read and agreed to the published version of the manuscript.

Funding

This work was supported by the Basic scientific Research Project of Liaoning Provincial Department of Education (JYTMS20230818) and Applied basic research project of Liaoning Province (2022JH2/101300275) and National Natural Science Foundation project of China (61971210).

Data Availability Statement

The public dataset we used is HRSC 2016. The dataset link is as follows: https://www.kaggle.com/datasets/guofeng/hrsc2016.

Conflicts of Interest

The authors declare no conflicts of interest.

References

  1. Chen, X.; Ling, J.; Wang, S.; Yang, Y.; Luo, L.; Yan, Y. Ship detection from coastal surveillance videos via an ensemble Canny-Gaussian-morphology framework. J. Navig. 2021, 74, 1252–1266. [Google Scholar] [CrossRef]
  2. Ray, C.; Dréo, R.; Camossi, E.; Jousselme, A.L.; Iphar, C. Heterogeneous integrated dataset for maritime intelligence, surveillance, and reconnaissance. Data Brief 2019, 25, 104141. [Google Scholar] [CrossRef] [PubMed]
  3. Xu, Y.; Hou, J.; Zhu, X.; Wang, C.; Shi, H.; Wang, J.; Li, Y.; Ren, P. Hyperspectral Image Super-Resolution with ConvLSTM Skip-Connections. IEEE Trans. Geosci. Remote Sens. 2024, 62, 1–16. [Google Scholar] [CrossRef]
  4. Bassam, A.M.; Phillips, A.B.; Turnock, S.R.; Wilson, P.A. Artificial neural network based prediction of ship speed under operating conditions for operational optimization. Ocean. Eng. 2023, 278, 114613. [Google Scholar] [CrossRef]
  5. Lang, X.; Wu, D.; Mao, W. Physics-informed machine learning models for ship speed prediction. Expert Syst. Appl. 2024, 238, 121877. [Google Scholar] [CrossRef]
  6. Ren, W.J.; Liu, P.; Ren, X.C.; Jin, Y.Q. Sar image simulation of ship turbulent wake using semi-empirical energy spectrum. IEEE J. Multiscale Multiphysics Comput. Tech. 2021, 6, 1–7. [Google Scholar] [CrossRef]
  7. Stapleton, N. Bright narrow V-shaped wakes observed by the NASA/JPL AIRSAR during the Loch Linnhe Experiment 1989. In Proceedings of the 1995 International Geoscience and Remote Sensing Symposium, IGARSS’95, Quantitative Remote Sensing for Science and Applications, Firenze, Italy, 10–14 July 1995; Volume 3, pp. 1646–1648. [Google Scholar]
  8. Meunier, P.; Le Dizès, S.; Redekopp, L.; Spedding, G. Internal waves generated by a stratified wake: Experiment and theory. J. Fluid Mech. 2018, 846, 752–788. [Google Scholar] [CrossRef]
  9. Liu, Y.; Zhao, J.; Qin, Y. A novel technique for ship wake detection from optical images. Remote Sens. Environ. 2021, 258, 112375. [Google Scholar] [CrossRef]
  10. Liu, Y.; Deng, R. Ship wakes in optical images. J. Atmos. Ocean. Technol. 2018, 35, 1633–1648. [Google Scholar] [CrossRef]
  11. Tunaley, J.K. The estimation of ship velocity from SAR imagery. In Proceedings of the IGARSS 2003—IEEE International Geoscience and Remote Sensing Symposium, IEEE Cat. No. 03CH37477, Toulouse, France, 21–25 July 2003; Volume 1, pp. 191–193. [Google Scholar]
  12. Zilman, G.; Zapolski, A.; Marom, M. The speed and beam of a ship from its wake’s SAR images. IEEE Trans. Geosci. Remote Sens. 2004, 42, 2335–2343. [Google Scholar] [CrossRef]
  13. Panico, A.; Graziano, M.D.; Renga, A. SAR-based vessel velocity estimation from partially imaged Kelvin pattern. IEEE Geosci. Remote Sens. Lett. 2017, 14, 2067–2071. [Google Scholar] [CrossRef]
  14. Sun, Y.X.; Liu, P.; Jin, Y.Q. Ship wake components: Isolation, reconstruction, and characteristics analysis in spectral, spatial, and TerraSAR-X image domains. IEEE Trans. Geosci. Remote Sens. 2018, 56, 4209–4224. [Google Scholar] [CrossRef]
  15. Zilman, G.; Zapolski, A.; Marom, M. On detectability of a ship’s Kelvin wake in simulated SAR images of rough sea surface. IEEE Trans. Geosci. Remote Sens. 2014, 53, 609–619. [Google Scholar] [CrossRef]
  16. Ursell, F. On Kelvin’s ship-wave pattern. J. Fluid Mech. 1960, 8, 418–431. [Google Scholar] [CrossRef]
  17. Kang, K.m.; Kim, D.j. Ship velocity estimation from ship wakes detected using convolutional neural networks. IEEE J. Sel. Top. Appl. Earth Obs. Remote Sens. 2019, 12, 4379–4388. [Google Scholar] [CrossRef]
  18. Graziano, M.D.; D’Errico, M.; Rufino, G. Ship heading and velocity analysis by wake detection in SAR images. Acta Astronaut. 2016, 128, 72–82. [Google Scholar] [CrossRef]
  19. Tuck, E.; Collins, J.; Wells, W. On ship wave patterns and their spectra. J. Ship Res. 1971, 15, 11–21. [Google Scholar] [CrossRef]
  20. Li, J.; Wang, L.; Zhang, M.; Jiao, Y.C.; Liu, G. Ship velocity automatic estimation method via two-dimensional spectrum pattern of Kelvin wakes in SAR images. IEEE J. Sel. Top. Appl. Earth Obs. Remote Sens. 2021, 14, 4779–4786. [Google Scholar] [CrossRef]
  21. Lv, T.; Tang, P.; Zhang, J. A Real-Time AIS Data Cleaning and Indicator Analysis Algorithm Based on Stream Computing. Sci. Program. 2023, 2023, 8345603. [Google Scholar] [CrossRef]
  22. Liu, Z.; Wu, Z.; Zheng, Z.; Wang, X.; Guedes Soares, C. Modelling dynamic maritime traffic complexity with radial distribution functions. Ocean. Eng. 2021, 241, 109990. [Google Scholar] [CrossRef]
  23. Oumansour, K.; Wang, Y.; Saillard, J. Multifrequency SAR observation of a ship wake. IEEE Proc. Radar Sonar Navig. 1996, 143, 275–280. [Google Scholar] [CrossRef]
  24. Wang, H.; Sun, S.; Bai, X.; Wang, J.; Ren, P. A Reinforcement Learning Paradigm of Configuring Visual Enhancement for Object Detection in Underwater Scenes. IEEE J. Ocean. Eng. 2023, 48, 443–461. [Google Scholar] [CrossRef]
  25. Ren, Y.; Zheng, M.; Zhang, L.; Fan, H.; Xie, Y. An Adaptive False Target Suppression and Radial Velocity Estimation Method of Moving Targets Based on Image-Domain for High-Resolution and Wide-Swath SAR. IEEE Trans. Geosci. Remote Sens. 2024, 62, 1–18. [Google Scholar] [CrossRef]
  26. Ren, Y.; Wang, J. Velocity Estimation of Moving Targets in Multichannel SAR Images via Optimally-Weighted Velocity Averaging Based on MUSIC Algorithm. In Proceedings of the 2021 CIE International Conference on Radar (Radar), Haikou, China, 15–19 December 2021; pp. 966–969. [Google Scholar]
  27. Tao, X.; Paoletti, M.E.; Wu, Z.; Haut, J.M.; Ren, P.; Plaza, A. An Abundance-Guided Attention Network for Hyperspectral Unmixing. IEEE Trans. Geosci. Remote Sens. 2024, 62, 5505414. [Google Scholar] [CrossRef]
  28. Wang, H.; Zhang, W.; Bai, L.; Ren, P. Metalantis: A Comprehensive Underwater Image Enhancement Framework. IEEE Trans. Geosci. Remote Sens. 2024, 62, 5618319. [Google Scholar] [CrossRef]
Figure 1. The flow chart of Ship-VNet.
Electronics 13 03468 g001
Figure 2. Selection of ships with Kelvin wakes from remote sensing images (The red rectangle represents the selected area of the remote sensing image that contains the Kelvin wake).
Electronics 13 03468 g002
Figure 3. Comparison of simulated Kelvin wakes and real Kelvin wakes. (a1) Simulated Kelvin wake, V = 14 m/s, φ = 0 ; (b1) 2D spectra of (a1); (a2) Simulated Kelvin wake, V = 14 m/s, φ = 45 ; (b2) 2D spectra of (a2); (a3) Real Kelvin wake; (b3) 2D spectra of (a3); (a4) 3D simulation modeling of Kelvin wake; (b4) Drawing Kelvin wake elevation spectrum curve according to the formula.
Electronics 13 03468 g003
Figure 4. Spectral image distribution of different frequencies. (a1) Low−frequency sine wave; (b1) 2D spectra of (a1); (a2) High−frequency sine wave; (b2) 2D spectra of (a2); (a3) Real Kelvin wake, V = 11.00 m/s; (b3) 2D spectra of (a3); (a4) Real Kelvin wake, V = 19.10 m/s; (b4) 2D spectra of (a4).
Electronics 13 03468 g004
Figure 5. Partial analysis results for Ship-VNet (The red rectangle represents the identified position of the ship. The green text displays the predicted information of the ship, where “v” represents the ship’s speed, and “MAPE” stands for the Mean Absolute Percentage Error).
Electronics 13 03468 g005
Figure 6. Ship-VNet obtains a scatter plot of ship velocity and true AIS velocity.
Electronics 13 03468 g006
Figure 7. Ship-VNet comparative experimental results (The red rectangle represents the identified position of the ship. The green text displays the predicted information of the ship, where “v” represents the ship’s speed, and “MAPE” stands for the Mean Absolute Percentage Error).
Electronics 13 03468 g007
Table 1. Comparative experiment of Ship-VNet (Bold font represents the best-performing method in the table).
MethodKelvin WakeTurbulent WakeAdditional CalculationsMAPE
Li et al. [20]--12.39%
Ship-Net-1-10.82%
Ship-Net-2-6.07%
Ours--6.07%
Disclaimer/Publisher’s Note: The statements, opinions and data contained in all publications are solely those of the individual author(s) and contributor(s) and not of MDPI and/or the editor(s). MDPI and/or the editor(s) disclaim responsibility for any injury to people or property resulting from any ideas, methods, instructions or products referred to in the content.

