Abstract
To address the challenges of high model complexity and low accuracy in detecting small targets in insulator defect detection using UAV aerial imagery, we propose a lightweight algorithm, PAL-YOLOv8. Firstly, the baseline model, YOLOv8n, is enhanced by incorporating the PKI Block from PKINet to improve the C2f module, effectively reducing the model complexity and enhancing feature extraction capabilities. Secondly, Adown from YOLOv9 is employed in the backbone and neck for downsampling, which retains more feature information while reducing the feature map size, thus improving the detection accuracy. Additionally, Focaler-SIoU is used as the bounding-box regression loss function to improve model performance by focusing on different regression samples. Finally, pruning is applied to the improved model to further reduce its size. The experimental results show that PAL-YOLOv8 achieves an mAP50 of 95.0%, which represents increases of 5.5% and 2.6% over YOLOv8n and YOLOv9t, respectively. Furthermore, GFLOPs is only 3.9, the model size is just 2.7 MB, and the parameter count is only 1.24 × 10⁶.
1. Introduction
Recently, due to advancements in smart grids and object recognition technology, UAV inspections have been widely adopted [1]. Their convenience, efficiency, and safety have led to widespread adoption in powerline inspections [2], greatly enhancing the efficiency of insulator defect detection.
However, UAV inspections also face significant challenges. The varying flight altitudes and angles during image capture result in more small targets in UAV aerial imagery compared to horizontally captured natural images, increasing the difficulty of target detection [3]. Additionally, the limited resources on UAV platforms make it challenging to embed target detection models with high computational and storage requirements [4]. Therefore, optimizing model complexity and detection accuracy are crucial for UAV inspections. Moreover, detection accuracy plays a crucial role in multimodal applications. De Curtò et al. [5] demonstrated a multimodal application of semantic scene understanding by integrating CLIP, YOLOv7, and GPT-3, where the detection accuracy of YOLOv7 significantly impacted the quality of the final text generation. Thus, improving the accuracy of insulator detection lays a foundation for future multimodal applications.
Traditional detection methods based on Canny edge detection [6] and SVM algorithms [7] demonstrate good performance in scenarios with clear-cut features and uncomplicated backgrounds, but often do not fulfill the precise detection requirements in complex, real-world settings. In recent years, defect detection methods leveraging convolutional neural networks have become a focus of research [8]. Target detection models can be divided into single-stage [9] and two-stage models based on their detection stages [10]. Compared to single-stage models, two-stage models exhibit disadvantages, including high training difficulty, increased computational cost, and slower detection speed, making them impractical for insulator defect detection [11]. The YOLO series [12], as a single-stage model, can simultaneously perform classification and regression operations. This approach achieves a better balance between efficiency and accuracy. Xu et al. [13] utilized Mobilenet-V1 to make the backbone of YOLOv4 lightweight and introduced depth-wise separable convolutions to decrease the parameter count. Although this improvement effectively reduced the parameter count, the model’s weight remained substantial. Yi et al. [14] optimized the neck structure in YOLOv5 using the VoV-GSCSP module to reduce GFLOPs. Additionally, they introduced the MaECA attention module and employed the HardSwish function in the SPPF to improve the detection accuracy. However, GFLOPs still need further reductions. Hu et al. [15] introduced the AWDMSM module, CBAM module, and decoupled detection head into YOLOv5, which enhanced the model’s detection accuracy and convergence speed. However, this insulator detection model’s parameter count requires further optimization. Zheng et al. [16], based on YOLOv7, improved anchor box clustering using the K-means++ clustering algorithm and introduced the CoordAtt and HorBlock modules to enhance the expressiveness of the feature map. This insulator defect detection algorithm improved the detection accuracy, but ignored issues related to the parameter count and amount of computation. Chang et al. [17] reduced the impact of occlusions on insulator detection accuracy by modifying the YOLOv7 network structure and integrating the GAM module. These modifications also reduced the parameter count, but the model size remained over 60 MB. He et al. [18] combined the Swin Transformer with the C2f module in YOLOv8 and used the BiFPN structure and small-target detection layers to optimize the neck and head. This combination resulted in more comprehensive feature information. Although this algorithm excelled in insulator defect detection, it had a relatively high GFLOPs. Chen et al. [19] enhanced the feature fusion capabilities of YOLOv8 by optimizing the SPPF module and the upsampling module, while the number of detection heads was increased to improve the accuracy of detecting small insulator defects. Although the accuracy of insulator defect detection was improved, the parameter count and GFLOPs also increased. Liu et al. [20] introduced the BiFPN structure and LSKA attention mechanism into YOLOv8, which enhanced feature extraction capabilities. Lightweight detection heads were used to reduce model complexity. However, the model’s accuracy was still low, and there was room for further reductions in the parameter count and GFLOPs.
The YOLOv8n model is improved in four ways in this study to improve the accuracy and reduce the complexity of the insulator defect detection model.
- The C2f module is improved using the PKI Block, which reduces the model’s amount of computation and parameter count while enhancing feature extraction capabilities.
- The Adown downsampling module from YOLOv9 is introduced to replace the original CBS downsampling module, thereby obtaining richer feature information.
- The loss function is used to replace the loss function, enhancing the overall model performance.
- The Layer-Adaptive Magnitude-based Pruning (LAMP) algorithm is applied to further compress the model size.
2. YOLOv8 Algorithm
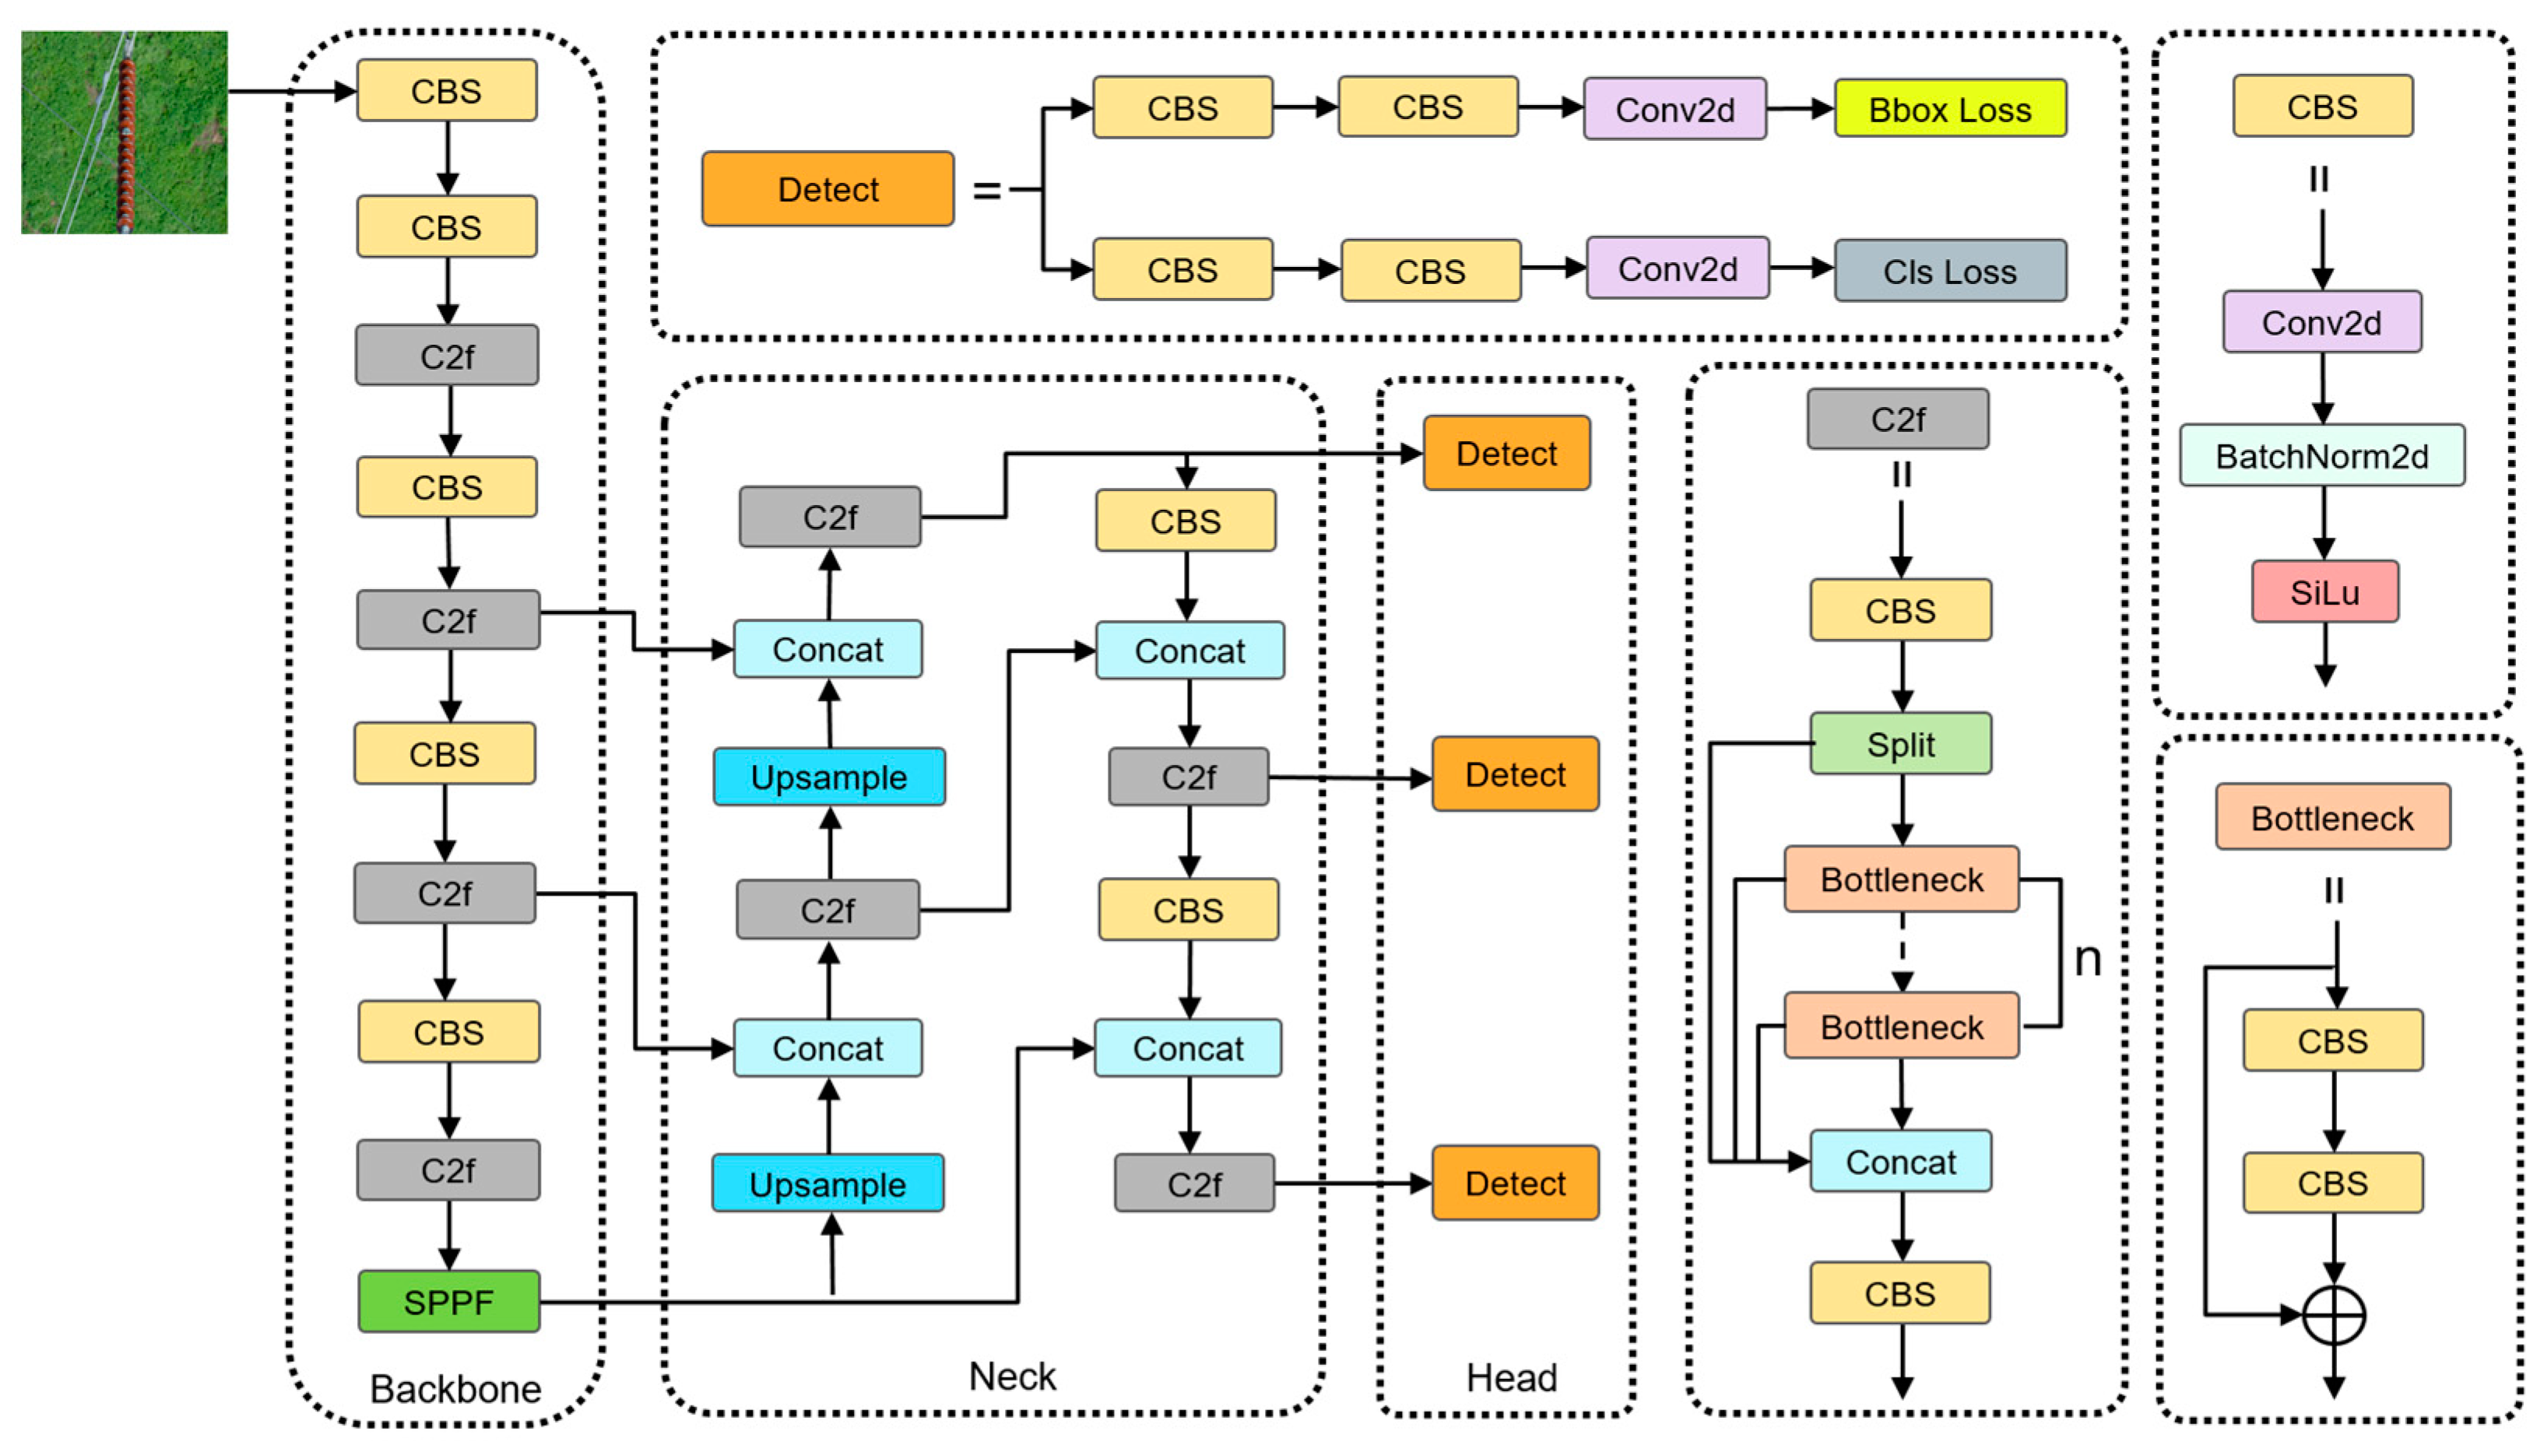
YOLOv8 is developed based on YOLOv5, incorporating different network depths and widths. It comes in five versions. Among them, YOLOv8n has the lowest amount of computation and parameter count, making it easier to deploy on embedded devices. Therefore, this study selects YOLOv8n as the baseline model for algorithm improvement. YOLOv8 is primarily composed of three components: the backbone, the neck, and the head, as shown in Figure 1.
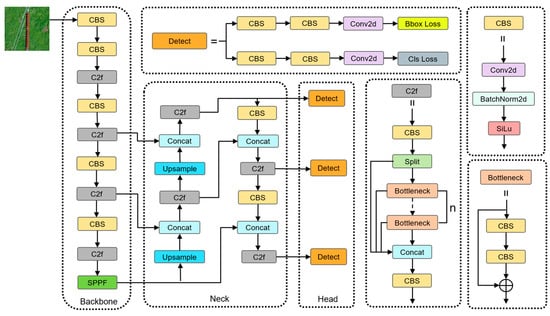
Figure 1.
YOLOv8 network architecture.
The backbone consists of three modules: CBS, C2f, and SPPF. The CBS and C2f modules are primarily used for feature extraction, capturing object shapes, textures, and deep semantic information. The SPPF module enhances feature map representation by merging features at different scales. The neck section employs a PAN-FPN structure, achieving the bidirectional fusion of low-level and high-level features, thereby improving the detection capability for targets of various scales. The head section uses an anchor-free decoupled head, separating the regression and classification branches, which reduces task interference and enhances detection efficiency.
3. PAL-YOLOv8 Algorithm
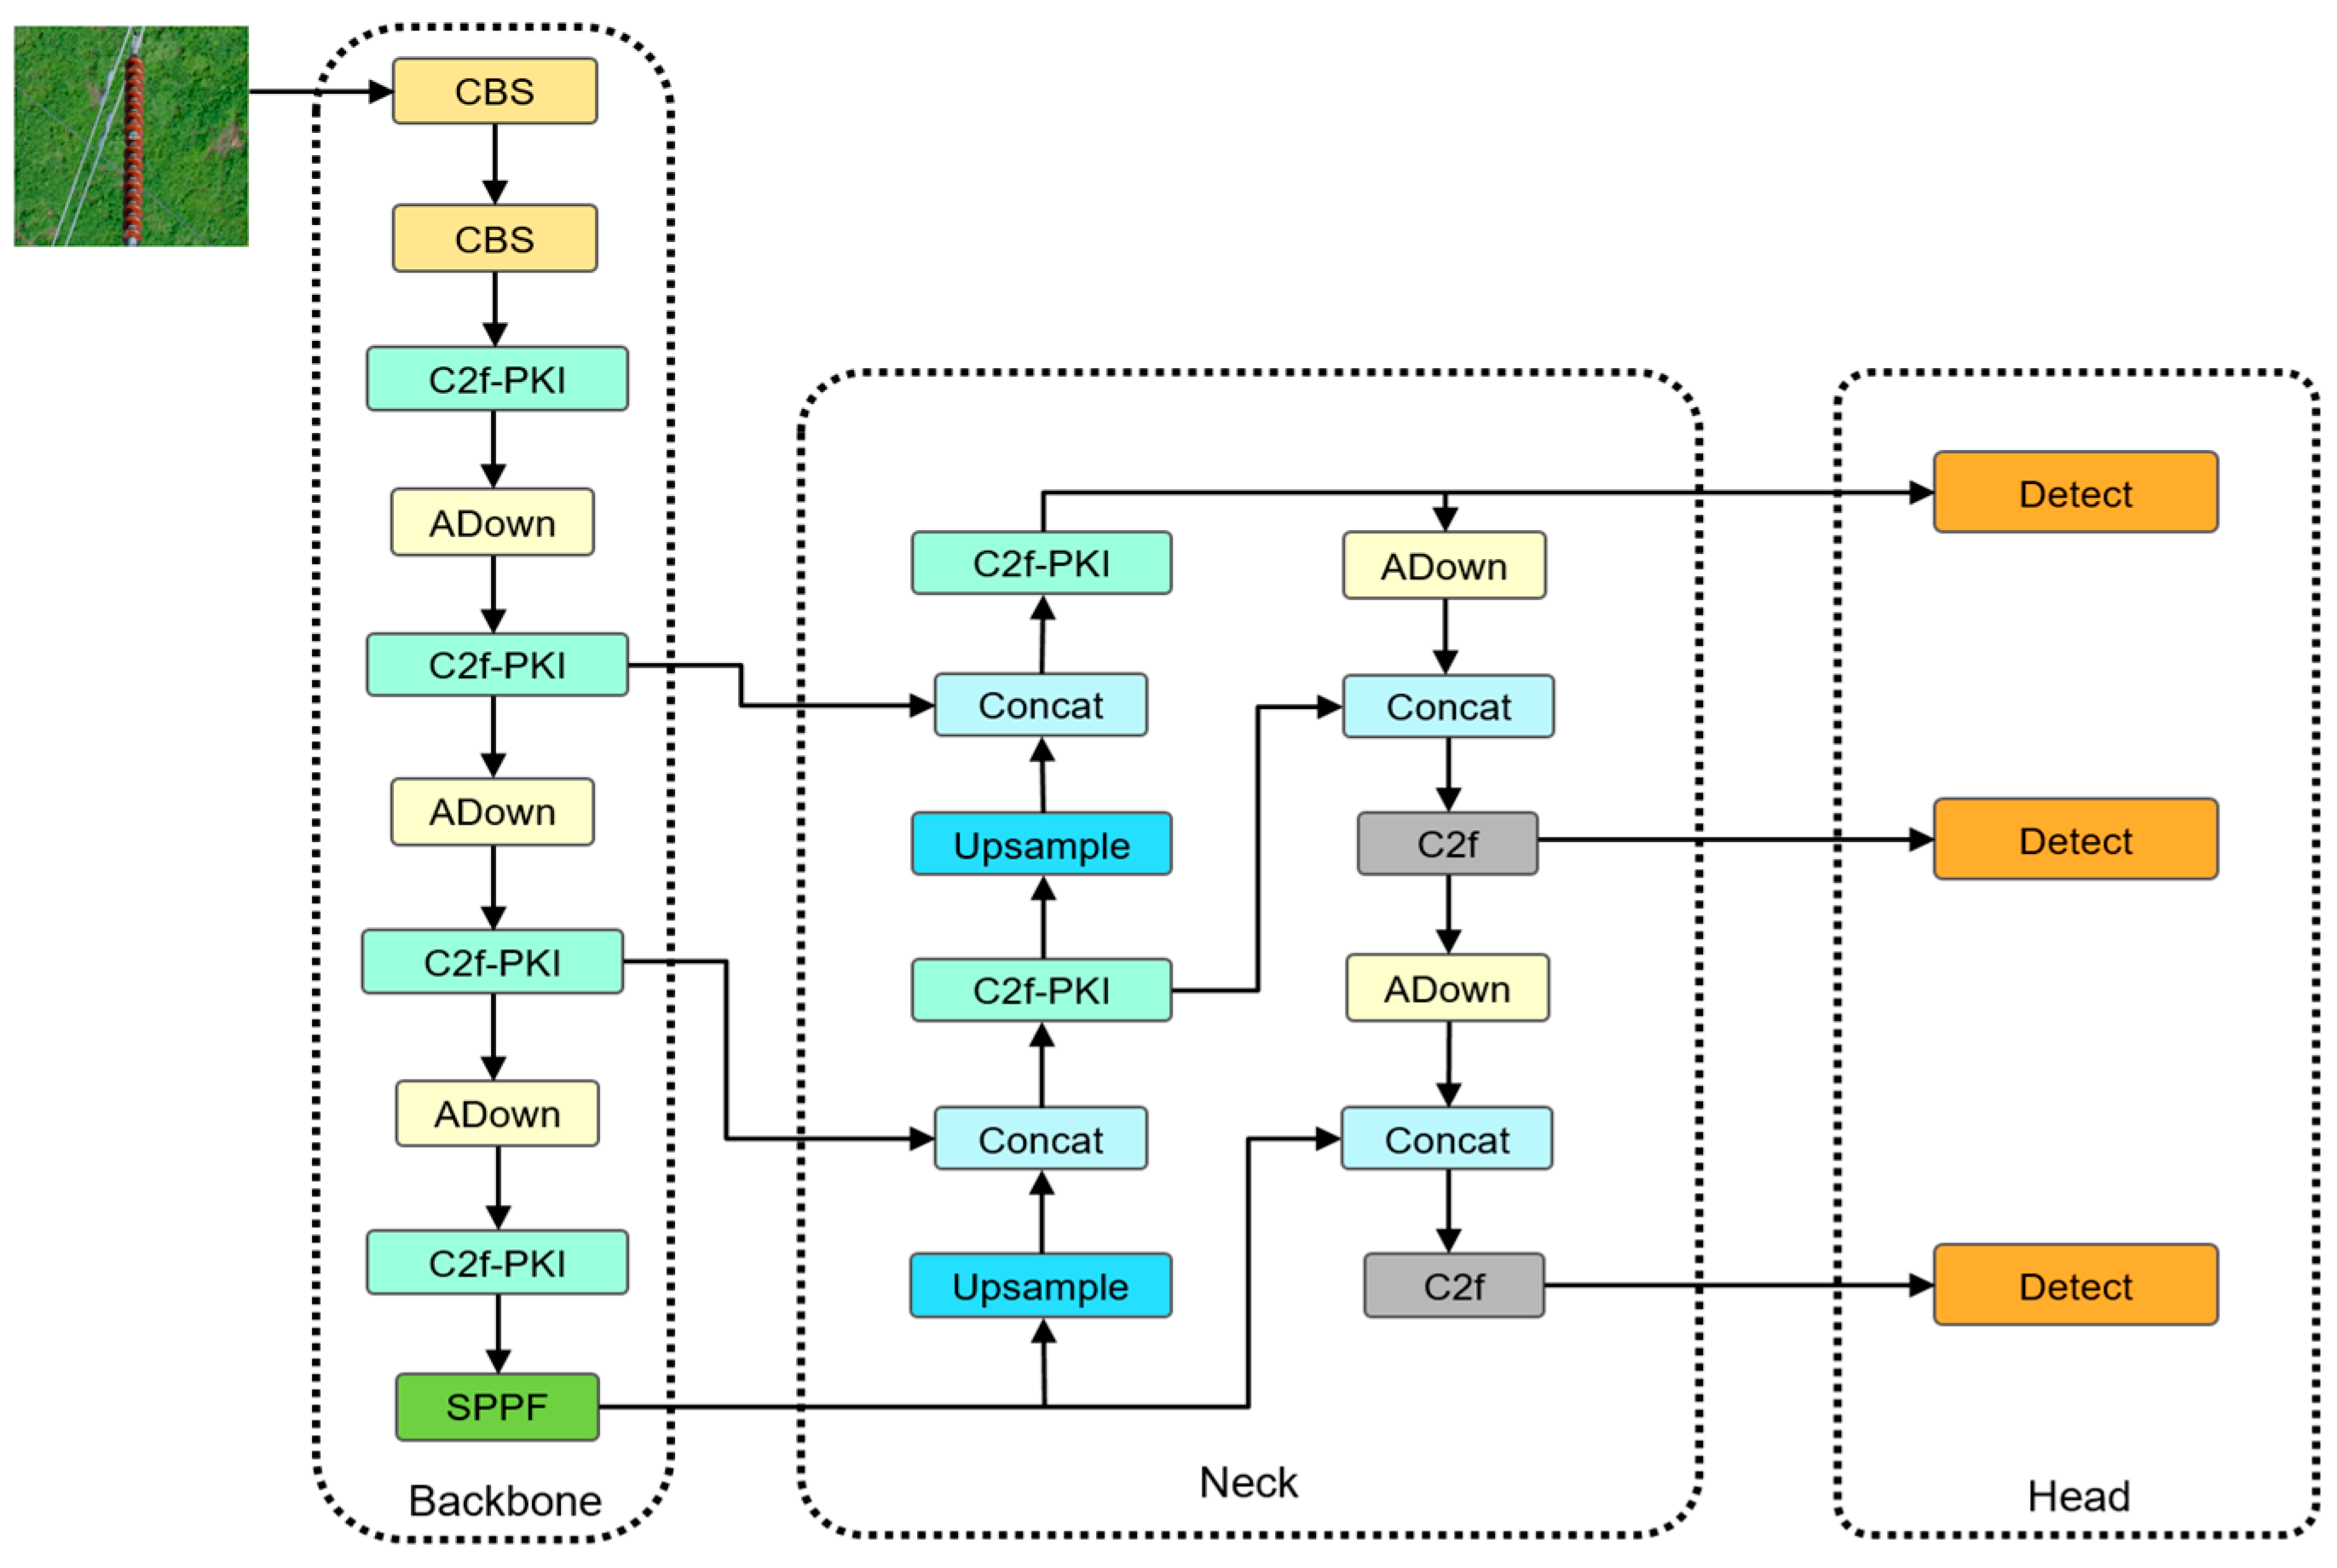
The PAL-YOLOv8 algorithm improves upon the YOLOv8n algorithm in four aspects, successfully reducing the model complexity and enhancing the detection accuracy. The network structure of PAL-YOLOv8 is shown in Figure 2.

Figure 2.
PAL-YOLOv8 network architecture.
First, the C2f-PKI module is constructed using the PKI Block from PKINet, replacing part of the original C2f modules. This enhances the feature extraction capabilities while reducing the model complexity. Second, the Adown downsampling module replaces the CBS downsampling module, improving the model’s detection performance. Additionally, Focaler-SIoU is used as the bounding-box regression loss function, focusing on different regression samples to enhance the detector’s performance across different detection tasks. Finally, the LAMP algorithm is employed to reduce model complexity and further enhance the detection accuracy.
3.1. C2f-PKI Module
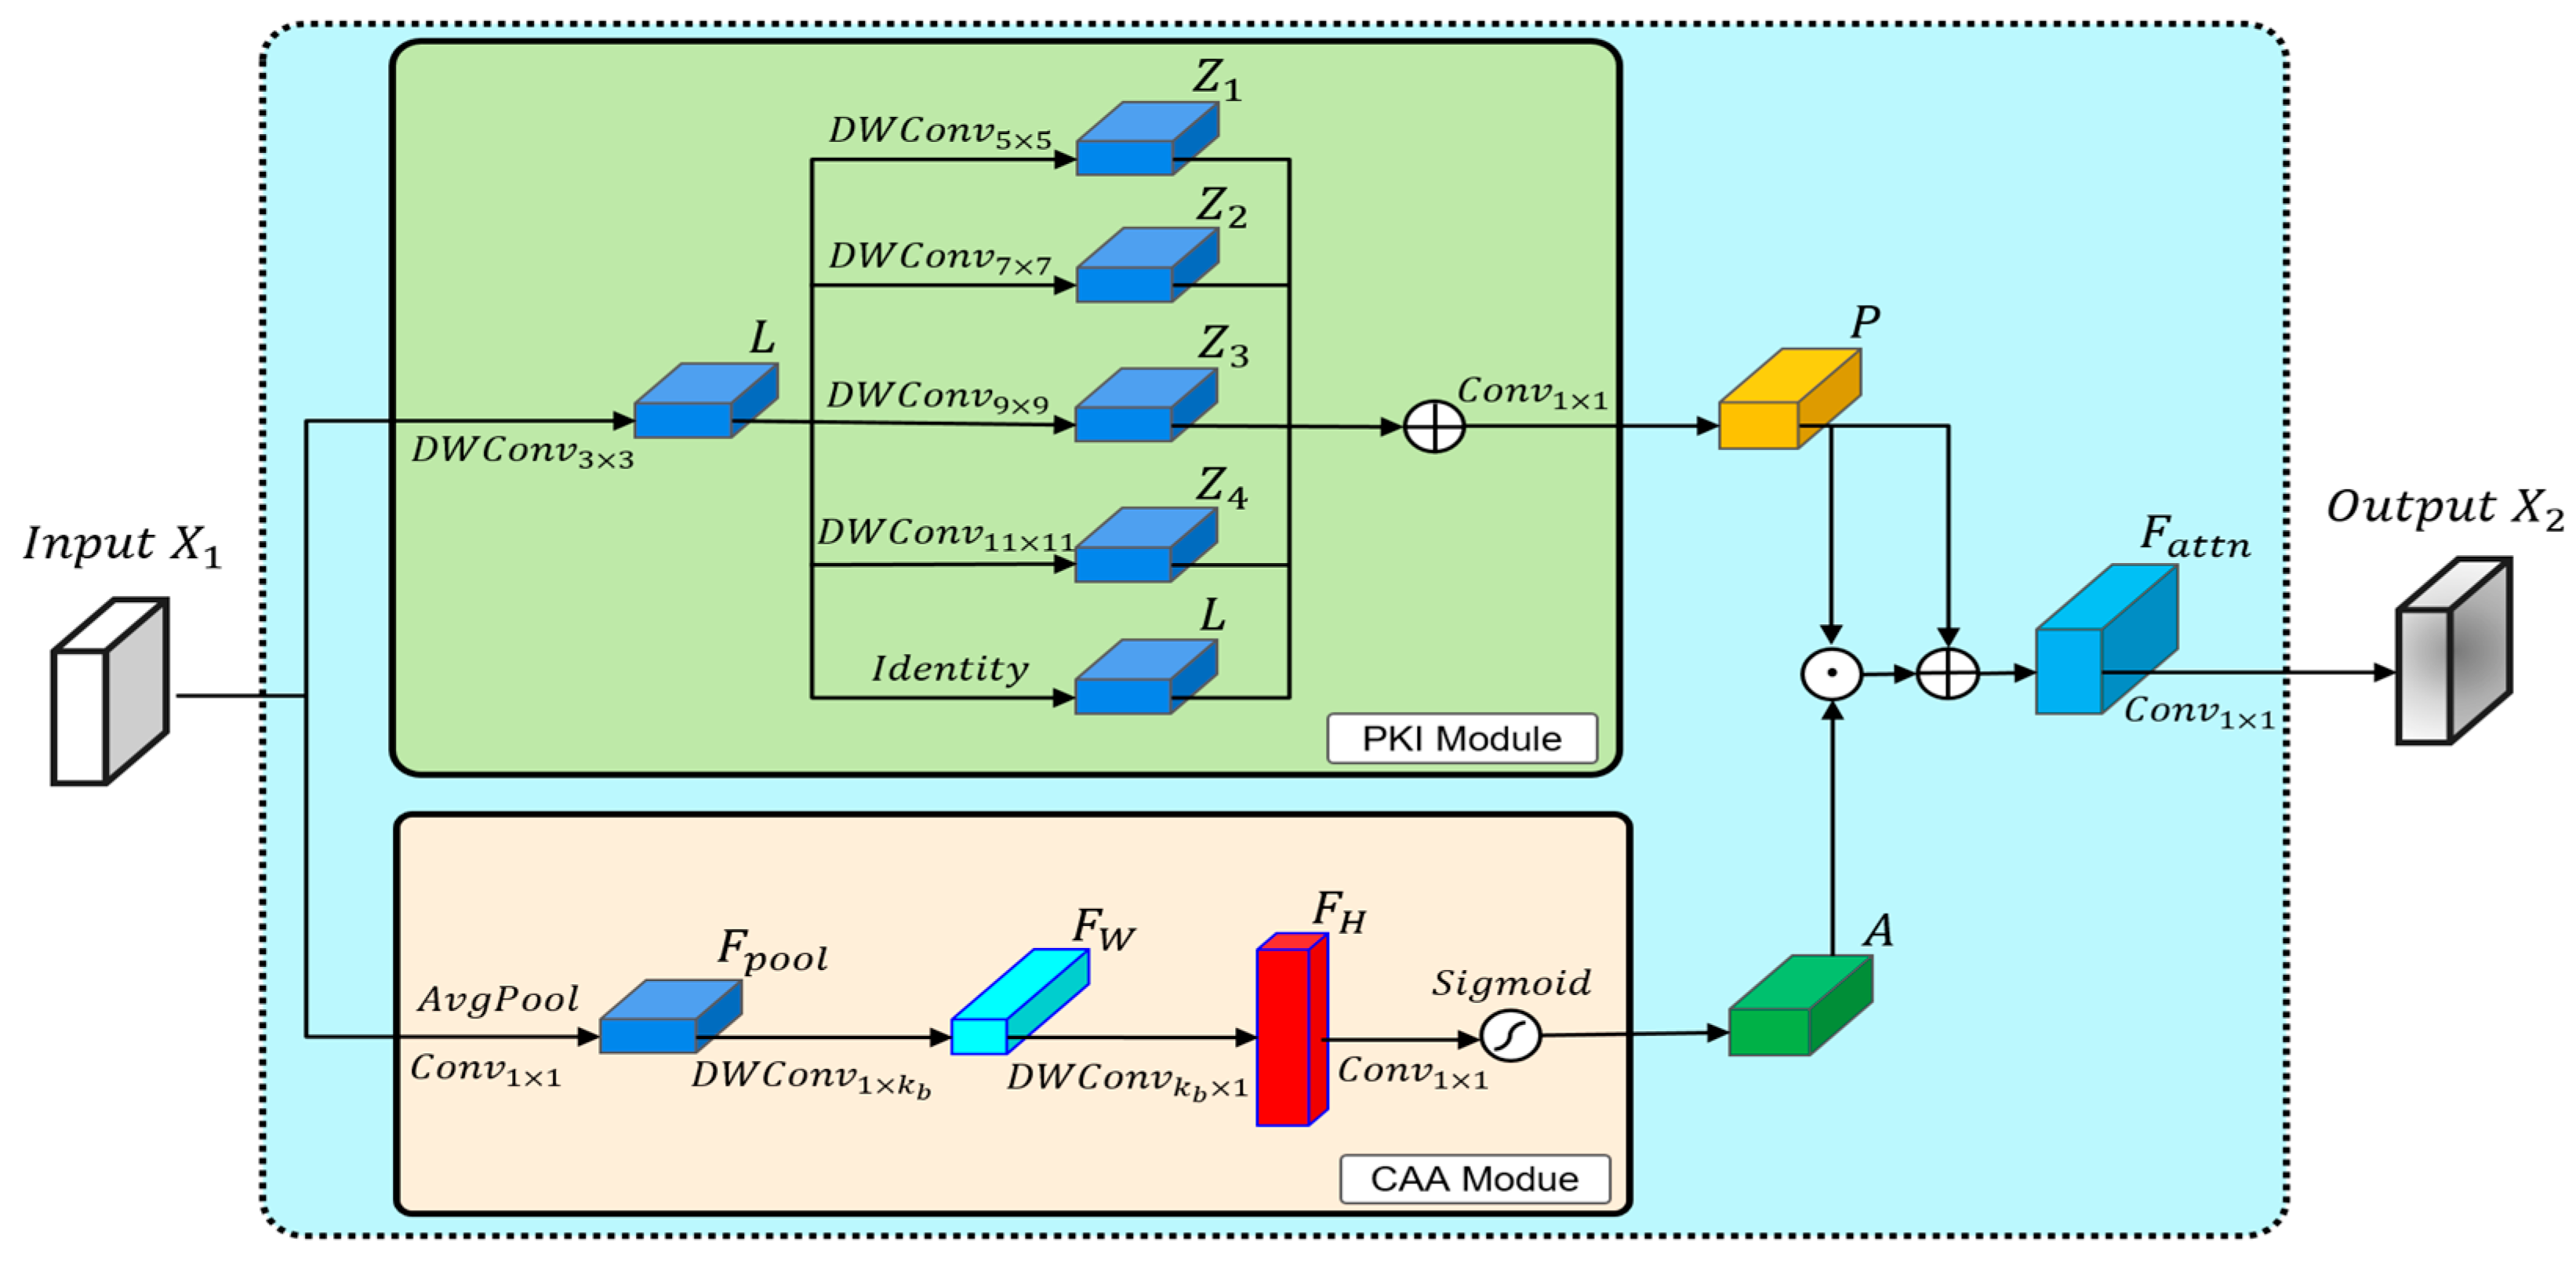
In YOLOv8n, the C2f module enhances the target detection performance by integrating feature information from different channels. However, it performs poorly when handling small insulator defects in aerial images. Additionally, the C2f module consists of standard convolutions and bottleneck modules, which increase both the parameter count and amount of computation of the model. The Poly Kernel Inception Network (PKINet) [21] is a novel neural network architecture proposed by CVPR 2024. Its core concept is to capture multi-scale object features using parallel depth-wise convolutions. Moreover, this architecture integrates a Context Anchor Attention (CAA) module to capture the features of elongated objects and reduce the network’s parameter count. This study improves the C2f module by introducing the PKI Block from PKINet. The structure of the PKI Block is shown in Figure 3.
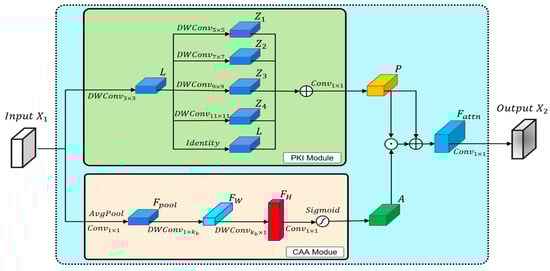
Figure 3.
PKI Block.
The PKI Block includes the PKI module and the CAA module. The PKI module uses 3 × 3 depth-wise convolutions to extract local information, and employs parallel depth-wise convolutional kernels of different sizes to extract multi-scale object features. The expression for the PKI module is as follows.
represents the extracted local features, denotes the extracted multi-scale features, and signifies the output features. Based on the value of in reference [21], in the C2f-PKI module, .
In the CAA module, two depth-wise strip convolutions are introduced to better capture the features of elongated objects while reducing the parameter count. The expression for the CAA module is as follows.
represents the average pooling operation, denotes the pooled features, and and indicate the strip convolution features in the two depth directions. Compared to traditional × 2D depth-wise convolutions, using two 1D depth-wise convolutions not only achieves the same effect, but also reduces the parameter count by /2. Based on the experimental results in Section 4.3, it is concluded that yields a higher detection accuracy in the C2f-PKI module. represents the output features.
After obtaining the output features from the CAA and PKI modules, the output features of the PKI Block can be derived.
represents the enhanced features obtained through element-wise multiplication and summation, while denotes the output features.
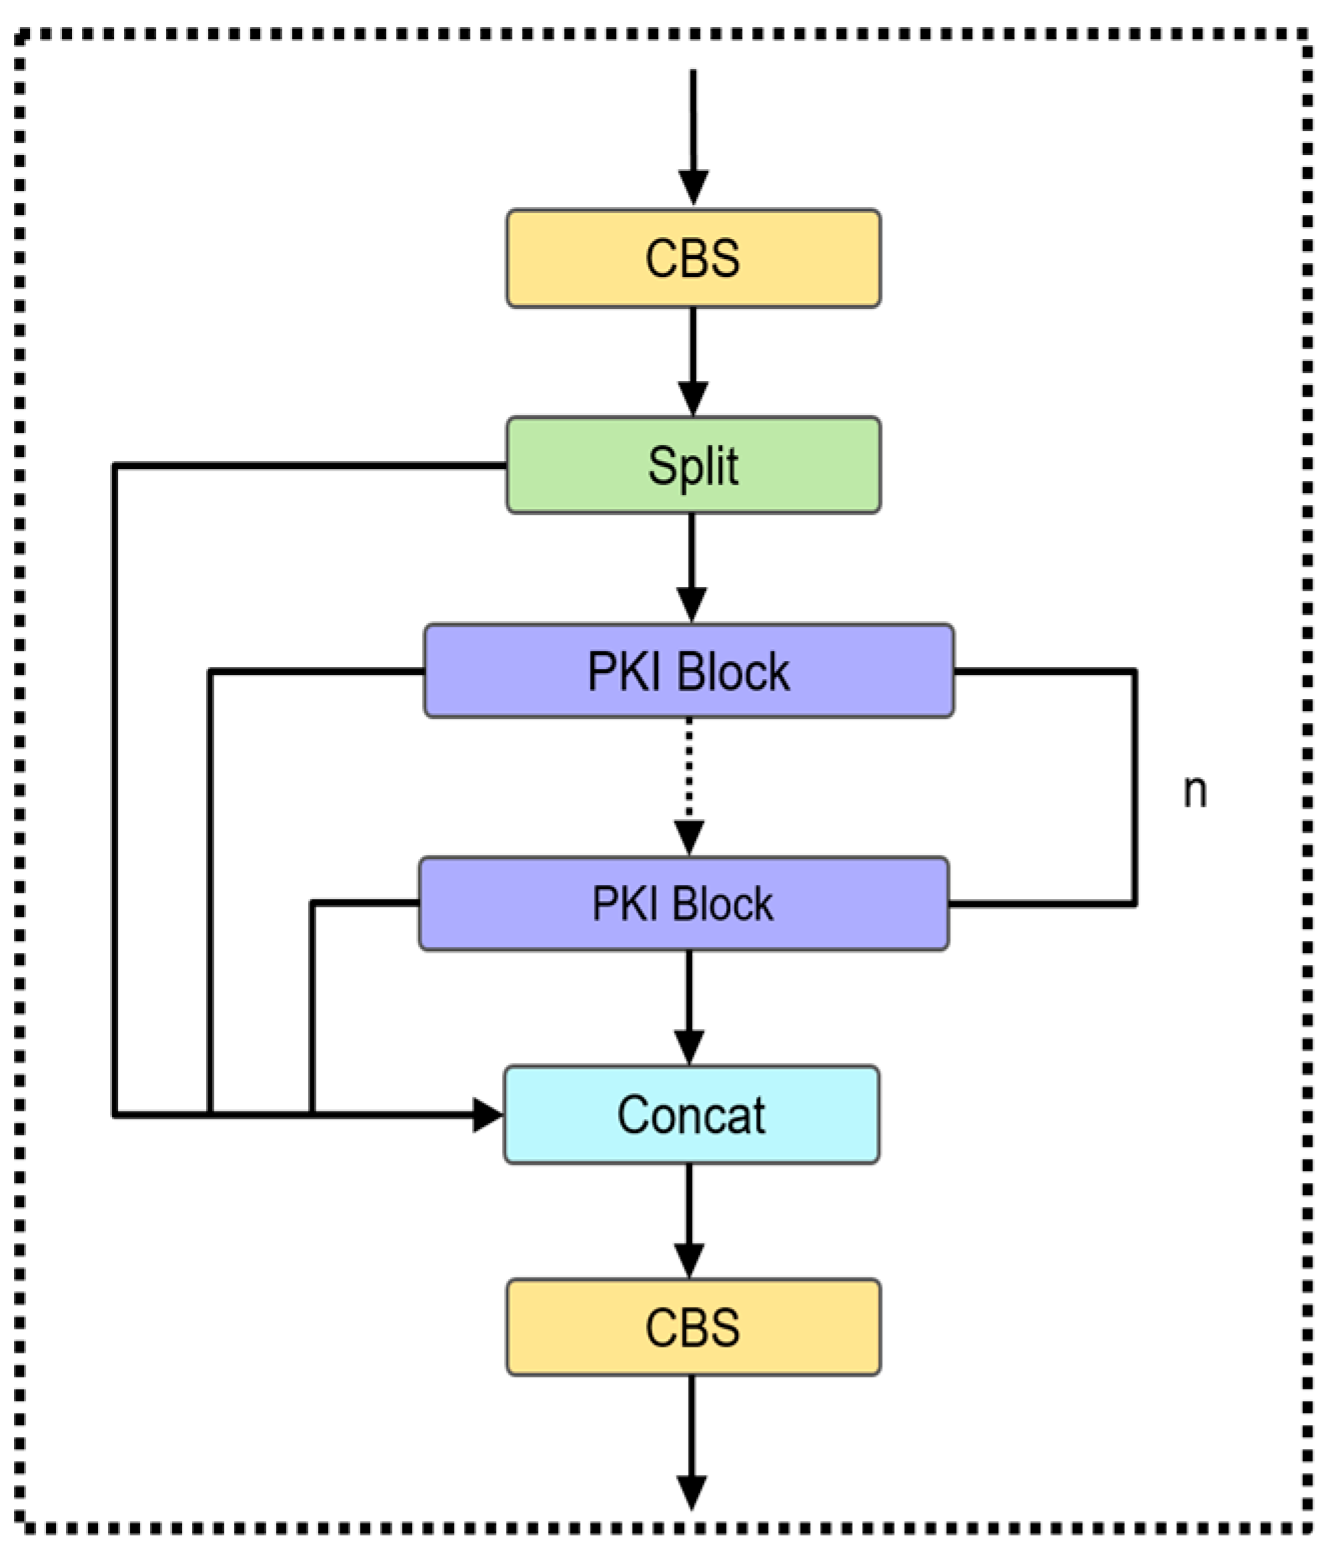
To enhance the detection accuracy of the model and reduce its parameter count, we replace the bottleneck modules in C2f with PKI Blocks. The improved C2f-PKI module is shown in Figure 4.

Figure 4.
C2f-PKI module.
3.2. Adown Downsampling Module
The downsampling module in YOLOv8n results in the loss of some detailed information when reducing the feature map size, which particularly affects the detection performance for small insulator defects. The Adown module, newly introduced in YOLOv9 [22], can retain more feature information while reducing the feature map size. Therefore, we used the Adown downsampling module to optimize YOLOv8n.
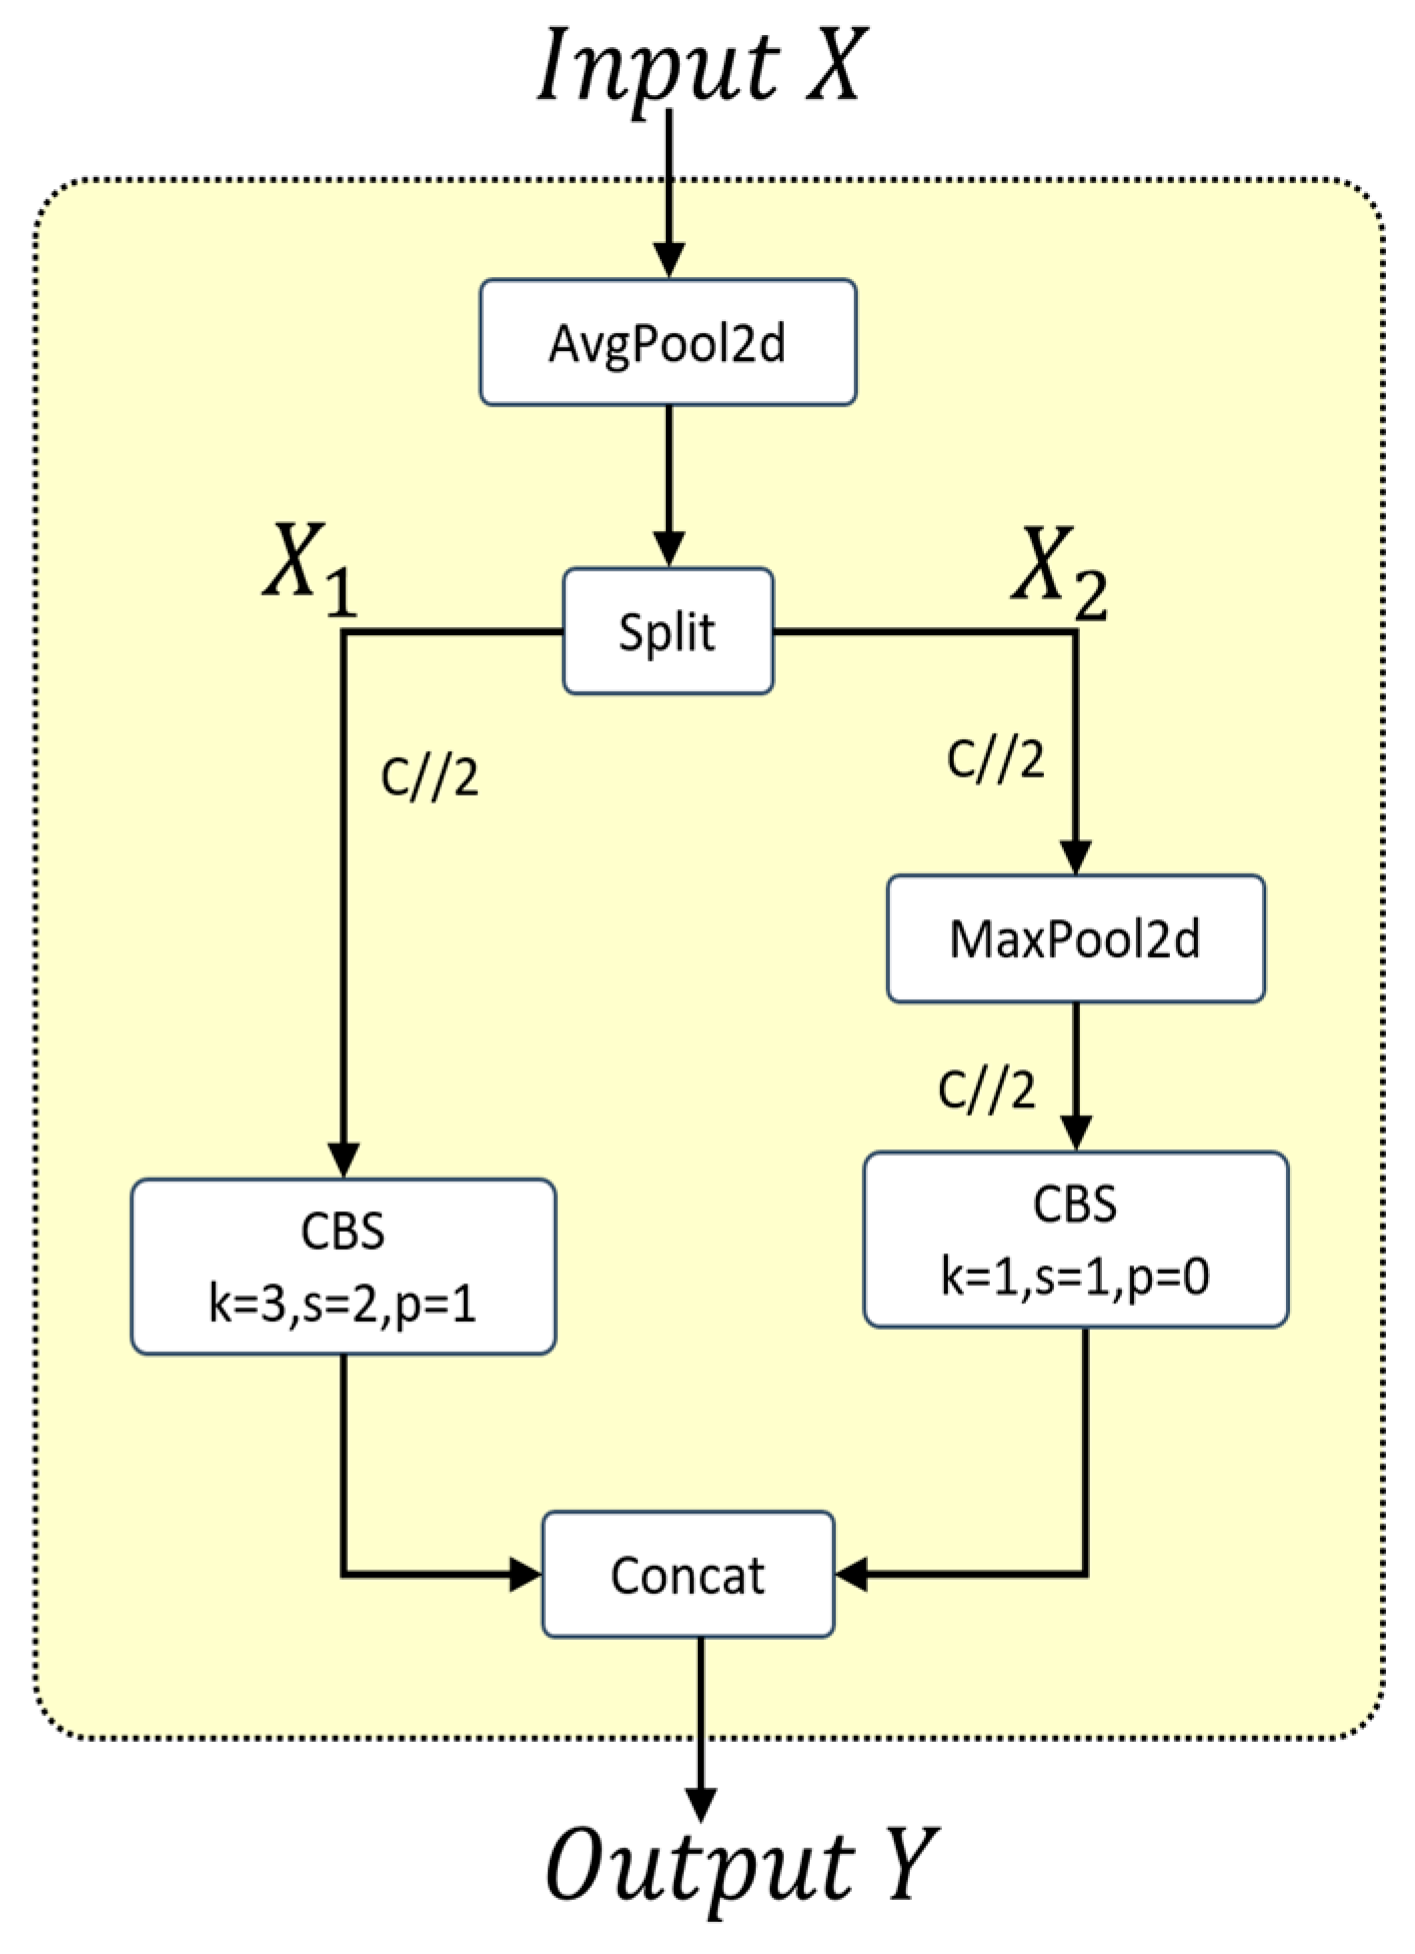
As shown in Figure 5, in the Adown downsampling module, the input feature map, , first undergoes an average pooling operation. The feature map is then split along the channel dimension into two sub-feature maps: and . undergoes a CBS operation, while is processed through a max pooling operation, then a CBS operation. Finally, the two sub-feature maps are concatenated to produce the output feature map, , of the Adown module. The Adown module extracts rich feature information and fuses features from different scales to generate more representative feature maps.
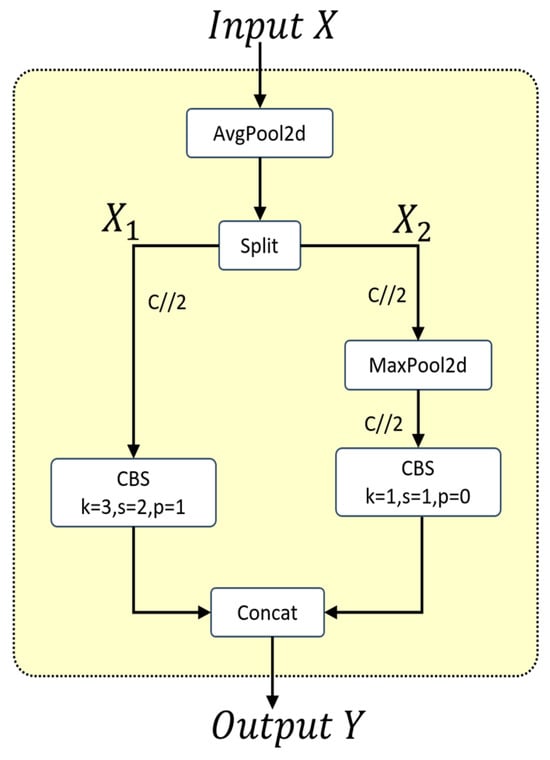
Figure 5.
Adown downsampling module.
3.3. Optimizing the Loss Function
In the task of insulator defect detection, samples can be classified into difficult and easy based on the detection complexity, with small defect samples considered as difficult samples. The [23] loss function in YOLOv8n improves the regression performance through the geometric relationship between bounding boxes, but overlooks the impact of sample difficulty on bounding-box regression. To enhance the model’s detection performance, the Focaler-SIoU loss function is introduced for PAL-YOLOv8. The model’s focus on different regression samples is enhanced by using Focaler-IoU [24]. SioU [25], building on , incorporates the angular loss between anchor boxes and ground-truth boxes within the bounding-box regression loss function. The definition is as follows.
Among them, represents the distance loss, represents the shape loss, and the distance loss, , is calculated through the angle loss . The angle loss, , is defined as follows:
The angle loss, , represents the minimum angle between the line connecting the center points of the ground-truth box and the anchor box. When the angle is 45°, equals . After accounting for the angle cost, the distance loss, , is redefined as follows:
Shape loss, , primarily describes the shape difference between the ground-truth box and the anchor box. As specified in [25], the parameter is set to 4. The terms and denote the relative differences in the width and height between the predicted box and the ground-truth box, respectively.
Focaler-IoU employs a linear interval mapping technique to redefine the loss. It is defined as follows:
The values of and determine the focus of on different regression samples, where .
The Focaler-IoU loss is applied to the bounding-box regression loss function. It is defined as follows:
3.4. Model Pruning
To fully leverage the advantages of large models under limited hardware resources, the application of pruning algorithms is increasingly attracting attention. Pruning reduces the parameter count and amount of computation by eliminating unimportant weights from the model, thereby enhancing the ease of model deployment. To further reduce the model size and streamline the pruning process, this study employs the Layer-Adaptive Magnitude-based Pruning (LAMP) [26] algorithm to prune the improved model, followed by fine-tuning to restore its performance. The LAMP algorithm requires no hyperparameter adjustments and relies solely on LAMP scores to accomplish the pruning task. Assuming each weight tensor is flattened into a one-dimensional vector, let and denote the weight indices, and represent the weight item corresponding to index . When , . The LAMP score for the index of the weight tensor is defined as follows:
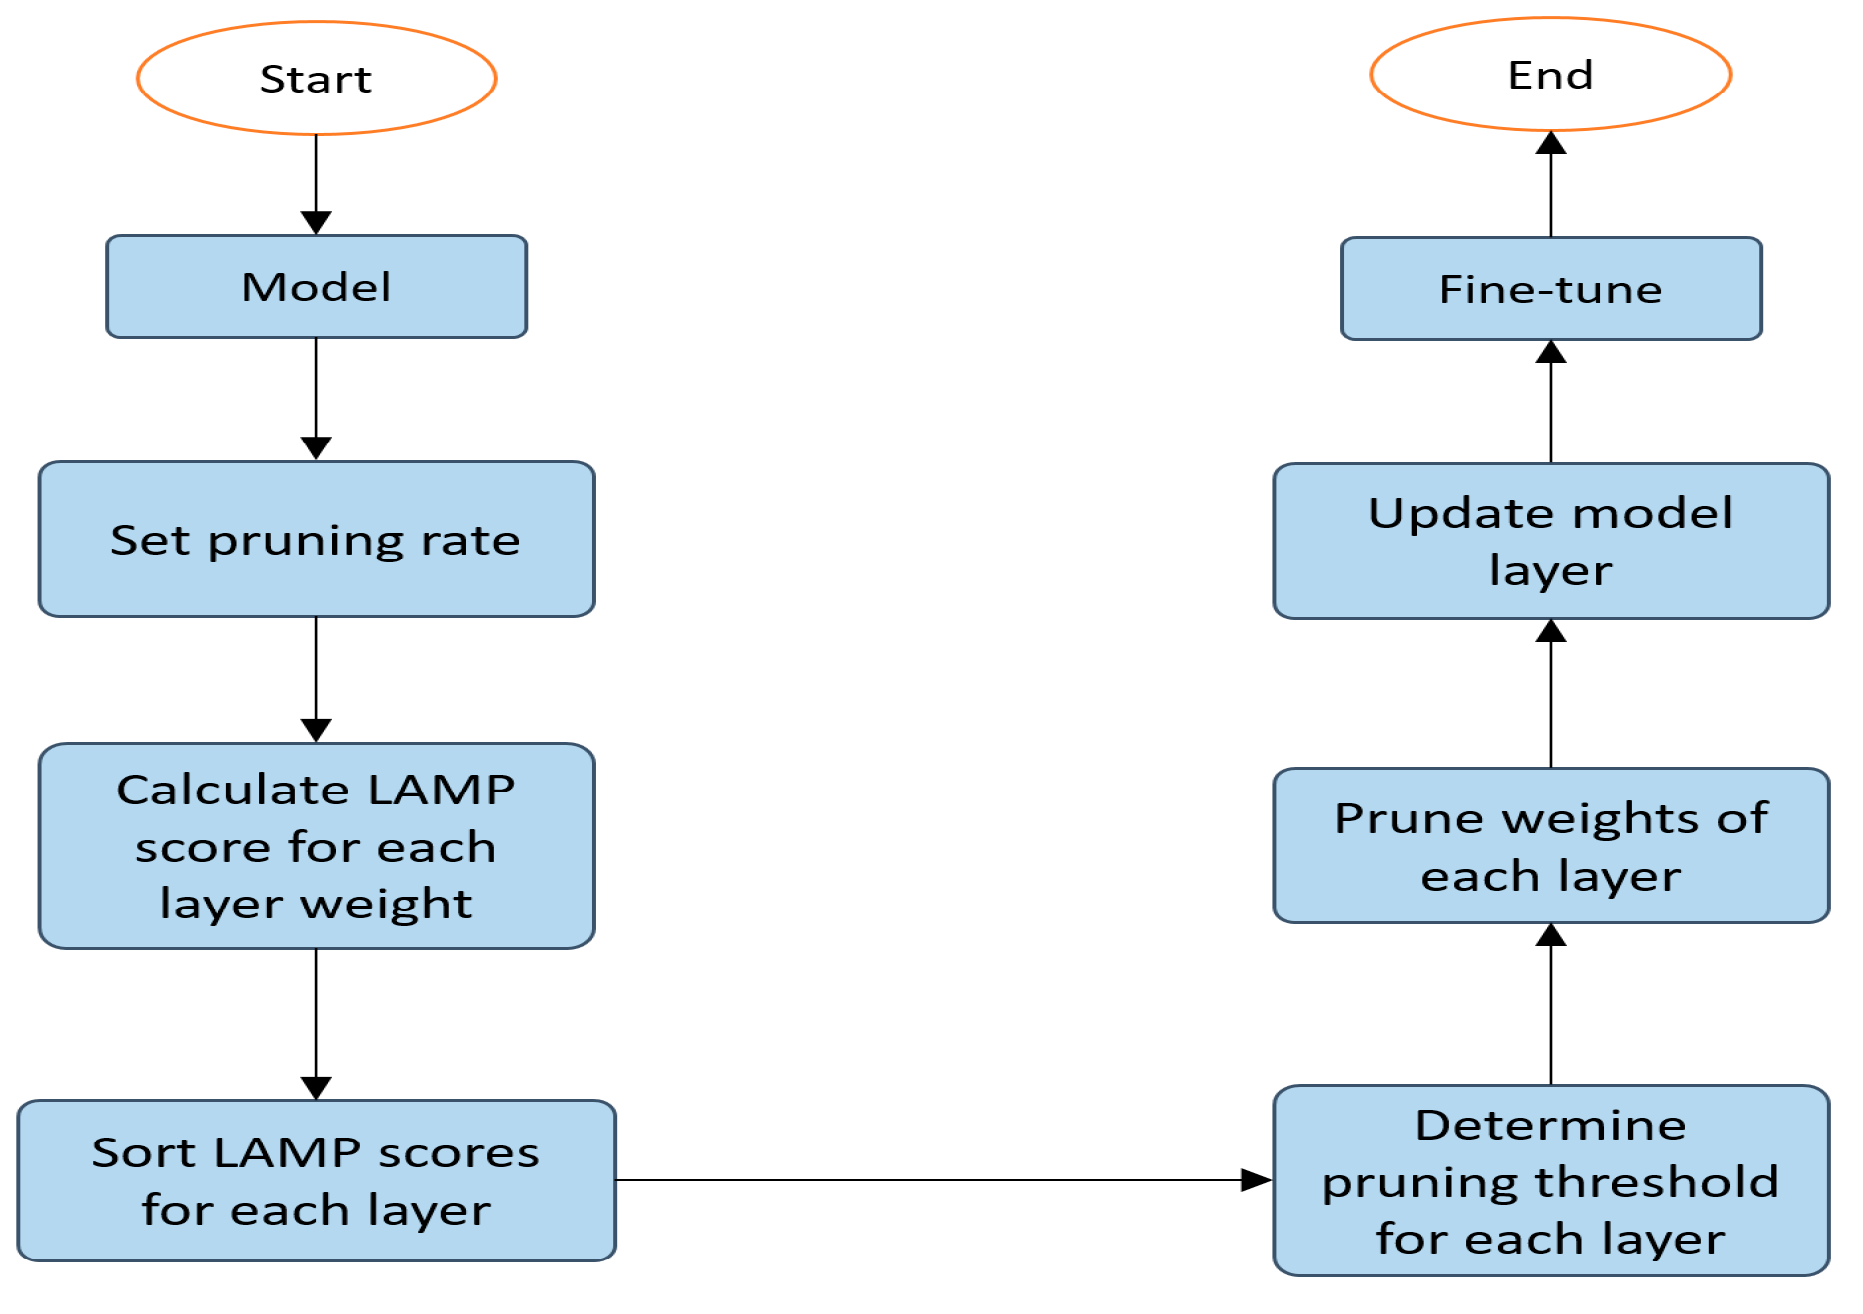
The LAMP uniform pruning process shown in Figure 6. First, input the improved model and the pruning rate. Next, flatten the weights of each layer and calculate their corresponding LAMP scores. Then, retain the weights with higher LAMP scores according to the pruning rate. Finally, update the model with the pruned weights.
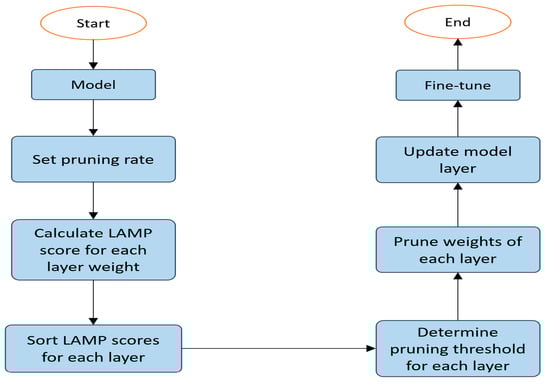
Figure 6.
Uniform pruning flowchart.
After pruning, the model becomes more streamlined, but its accuracy drops significantly. Therefore, fine-tuning is required to restore its accuracy. By choosing an appropriate pruning rate, pruning effectively removes redundant parameters while retaining key features, resulting in a fine-tuned model that surpasses the pre-pruned model in accuracy.
4. Experiments
4.1. Dataset and Experimental Environment
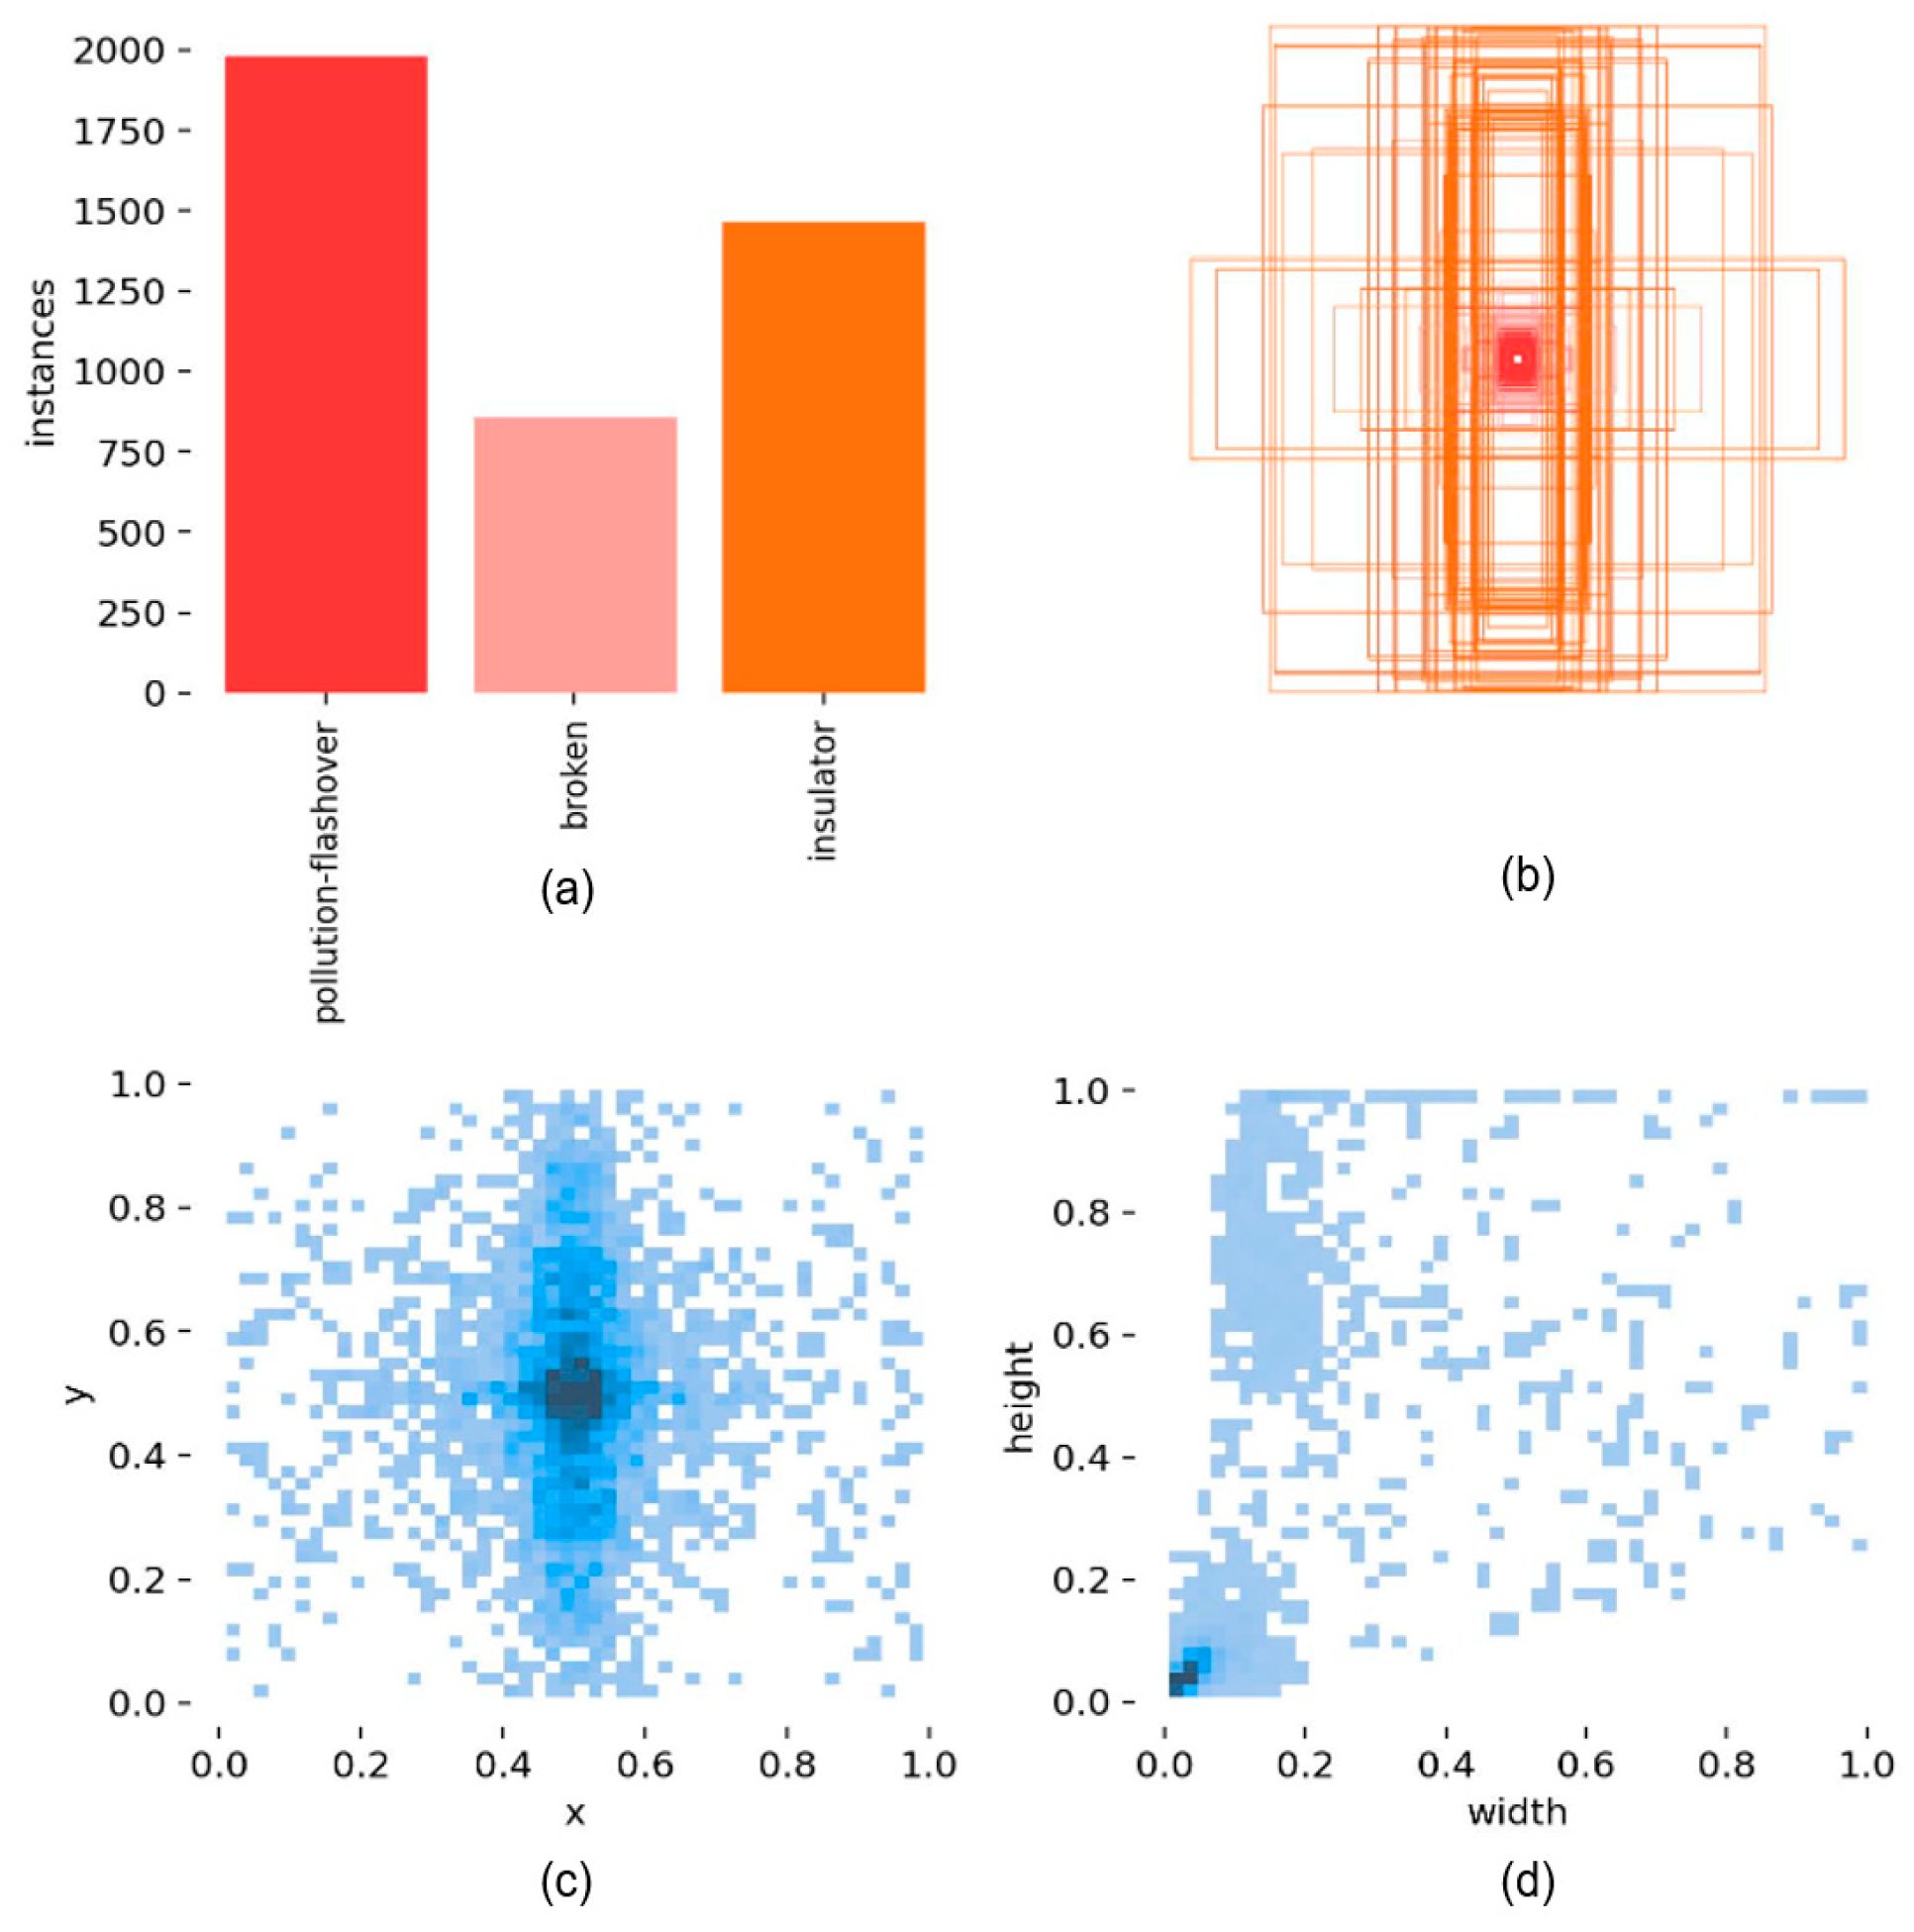
This study uses the public insulator defect dataset from 2022 as the experimental dataset [16]. The dataset includes 1600 images, covering two types of defects: pollution flashover and broken. Most images have a width and height greater than 2000 pixels. The dataset is divided into training, validation, and test sets in an 8:1:1 ratio, and the model performance is evaluated on the test set. During the model training phase, data augmentation methods, including scaling, hue adjustment, rotation, and Mosaic, are employed to enhance the model’s generalization ability and robustness. The basic information of the training set is presented in Figure 7. It is evident that the dataset contains images of various sizes, mainly focusing on small- and medium-sized targets.
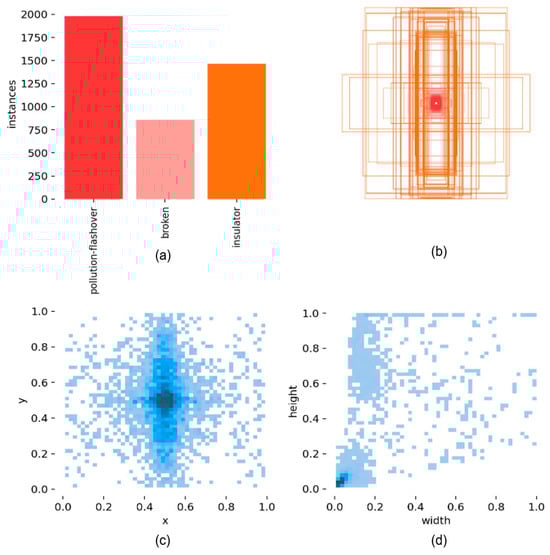
Figure 7.
Basic information of the training set: (a) number of categories; (b) size of target boxes (larger target boxes are used to represent insulator targets, while smaller target boxes indicate defect targets); (c) distribution of object center points within the images; (d) aspect ratio of objects relative to the original images.
The hardware environment for this experiment consists of an Nvidia GeForce RTX 3090 GPU and an AMD EPYC 7B12 64-core processor. The operating system is Ubuntu 20.04. The experimental environment includes PyTorch 1.13.1, CUDA 11.7, and Python 3.8.10. The experimental parameter settings are shown in Table 1.

Table 1.
Experimental parameter settings.
4.2. Evaluation Metrics
In this study, precision, recall, and mean average precision (mAP) are used as evaluation metrics to assess the detection performance of the algorithm. They are defined as follows:
FP (false positive) represents the number of falsely predicted negative samples, FN (false negative) indicates the number of falsely predicted positive samples, and TP (true positive) denotes the number of correctly predicted positive samples. AP reflects the accuracy of target detection for a single category, while mAP represents the average AP value across multiple categories.
Additionally, metrics to evaluate model complexity and computational efficiency are introduced, including GFLOPs, parameters, model size, and FPS. Lower GFLOPs and model size indicate lower model complexity. For real-time detection tasks, an FPS exceeding 30 is required [27].
4.3. Ablation Experiments
The effects of various improvement modules in PAL-YOLOv8 on the accuracy and lightweight aspects of the insulator defect detection model are validated through an ablation experiment, as shown in Table 2. Experiment A represents the baseline model YOLOv8n’s performance on the dataset. In Experiment B, the C2f-PKI module replaces part of the C2f modules in YOLOv8n, significantly improving the model’s accuracy while reducing the complexity. Experiment C extends Experiment B by using the Adown downsampling module to replace the original downsampling module, further optimizing the model’s accuracy and complexity. In Experiment D, the Focaler-SIoU loss function is introduced based on Experiment C, increasing the mAP50 to and mAP50–95 to . Experiment E incorporates the LAMP algorithm on the basis of Experiment D, removing redundant network connections and weights. Compared with Experiment D, it has a higher mAP50, higher mAP50–95, and more FPS, while parameters, model size, and GFLOPs decrease by , , and , respectively. Overall, higher detection accuracy and reduced model complexity are demonstrated by the improved model.
Table 2.
Results of ablation experiments.
The experimental results for different values in PAL-YOLOv8 are shown in Table 3. According to reference [21], is defined as , where j is related to the depth n of the PKI Block in the C2f-PKI module. As the PKI Block deepens, the receptive field of the CAA module increases accordingly. However, the experimental results indicate that increasing the receptive field does not improve the detection accuracy of insulator defects. Therefore, a fixed value of is deemed more appropriate for PAL-YOLOv8.
Table 3.
Comparative experiment on different values in PAL-YOLOv8.
4.4. Comparison Experiments of Loss Functions
To validate the effectiveness of Focaler-SIoU, it is compared with [28], [29], [30], Focaler-CioU, and Focaler-EioU, as shown in Table 4.
Table 4.
Results of comparison experiments of loss functions.
Compared to other loss functions, Focaler-SIoU achieves higher mAP50 and mAP50–95. Figure 8 illustrates the loss variations in Focaler-SIoU and baseline during training. Focaler-SIoU shows a more significant decrease and faster convergence compared to .
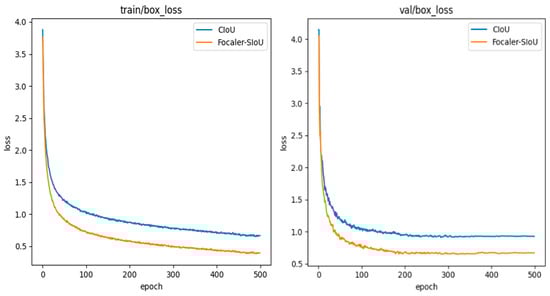
Figure 8.
Comparison of Focaler-SIoU and .
To identify the optimal values for the Focaler-SIoU hyperparameters and , we designed a hyperparameter comparison experiment, as shown in Table 5. First, is fixed, and then is incrementally adjusted to observe changes in the model’s accuracy. When , mAP50, and mAP50–95 reach their maximum values, is fixed, and is incrementally adjusted, showing that mAP50 and mAP50–95 reach their maximum values when .
Table 5.
Results of comparison experiments on Focaler-SIoU loss function hyperparameters.
4.5. Comparison Experiments of Pruning Rates
To validate the model’s performance under different pruning rates, we pruned the model at various rates and fine-tuned the pruned models. As shown in Table 6, as the pruning rate increases, the parameter count, model size, and amount of computation decrease. However, the detection accuracy does not necessarily decrease with higher pruning rates. When the pruning rates are and , the model’s accuracy surpasses that of the unpruned model’s accuracy, indicating that the LAMP algorithm effectively removes redundant network connections and weights, thereby enhancing the model’s generalization ability. Although the model’s complexity is lower at a pruning rate, the accuracy drops significantly compared to the pruning rate. After considering both the model complexity and accuracy, this study ultimately selects 41% as the optimal pruning rate for the improved model.
Table 6.
Results of comparison experiments of pruning rates.
4.6. Model Comparison Experiments
To further validate the superiority of the proposed algorithm, we conducted comparative experiments between PAL-YOLOv8 and other algorithms in the YOLO series [31], as shown in Table 7.
Table 7.
Results of model comparison experiments.
Compared with YOLOv5s, PAL-YOLOv8 has fewer parameters, smaller model size, and fewer calculations, while increasing mAP50 by and mAP50–95 by . Compared with YOLOv7-tiny, PAL-YOLOv8 has fewer parameters, smaller model size, and fewer calculations, while increasing mAP50 by 3.1% and mAP50–95 by 6.4%. Compared with YOLOv8s, PAL-YOLOv8 has fewer parameters, smaller model size, and fewer calculations, while increasing mAP50 by 4.3% and mAP50–95 by 2.7%. Compared with YOLOv9s, PAL-YOLOv8 has fewer parameters, smaller model size, and fewer calculations, while increasing mAP50 by and mAP50–95 by . YOLOv8n, YOLOv9t, YOLOv10n [32], and PAL-YOLOv8 all have the advantages of fewer parameters and lower computation rates. However, PAL-YOLOv8 demonstrates a higher detection accuracy and lower model complexity compared to YOLOv8n, YOLOv9t, and YOLOv10n. Overall, PAL-YOLOv8 improves the detection accuracy while maintaining a lightweight model.
4.7. Generalization Experiments
To further evaluate the generalization capability of the PAL_YOLOv8 model, experiments were conducted on the photovoltaic cell defect detection dataset PVEL-AD [33] and the wind turbine blade defect detection dataset obtained from Ro-boflow (https://universe.roboflow.com/fan-z3bkk/lastfan1, accessed on 30 August 2024). The experimental results are presented in Table 8. Compared to the baseline YOLOv8n model, PAL_YOLOv8 demonstrates a higher detection accuracy for both types of defects while also reducing the model’s complexity. These results indicate that the PAL_YOLOv8 model exhibits a notable generalization ability.
Table 8.
Results of generalization experiments.
4.8. Visualization Analysis
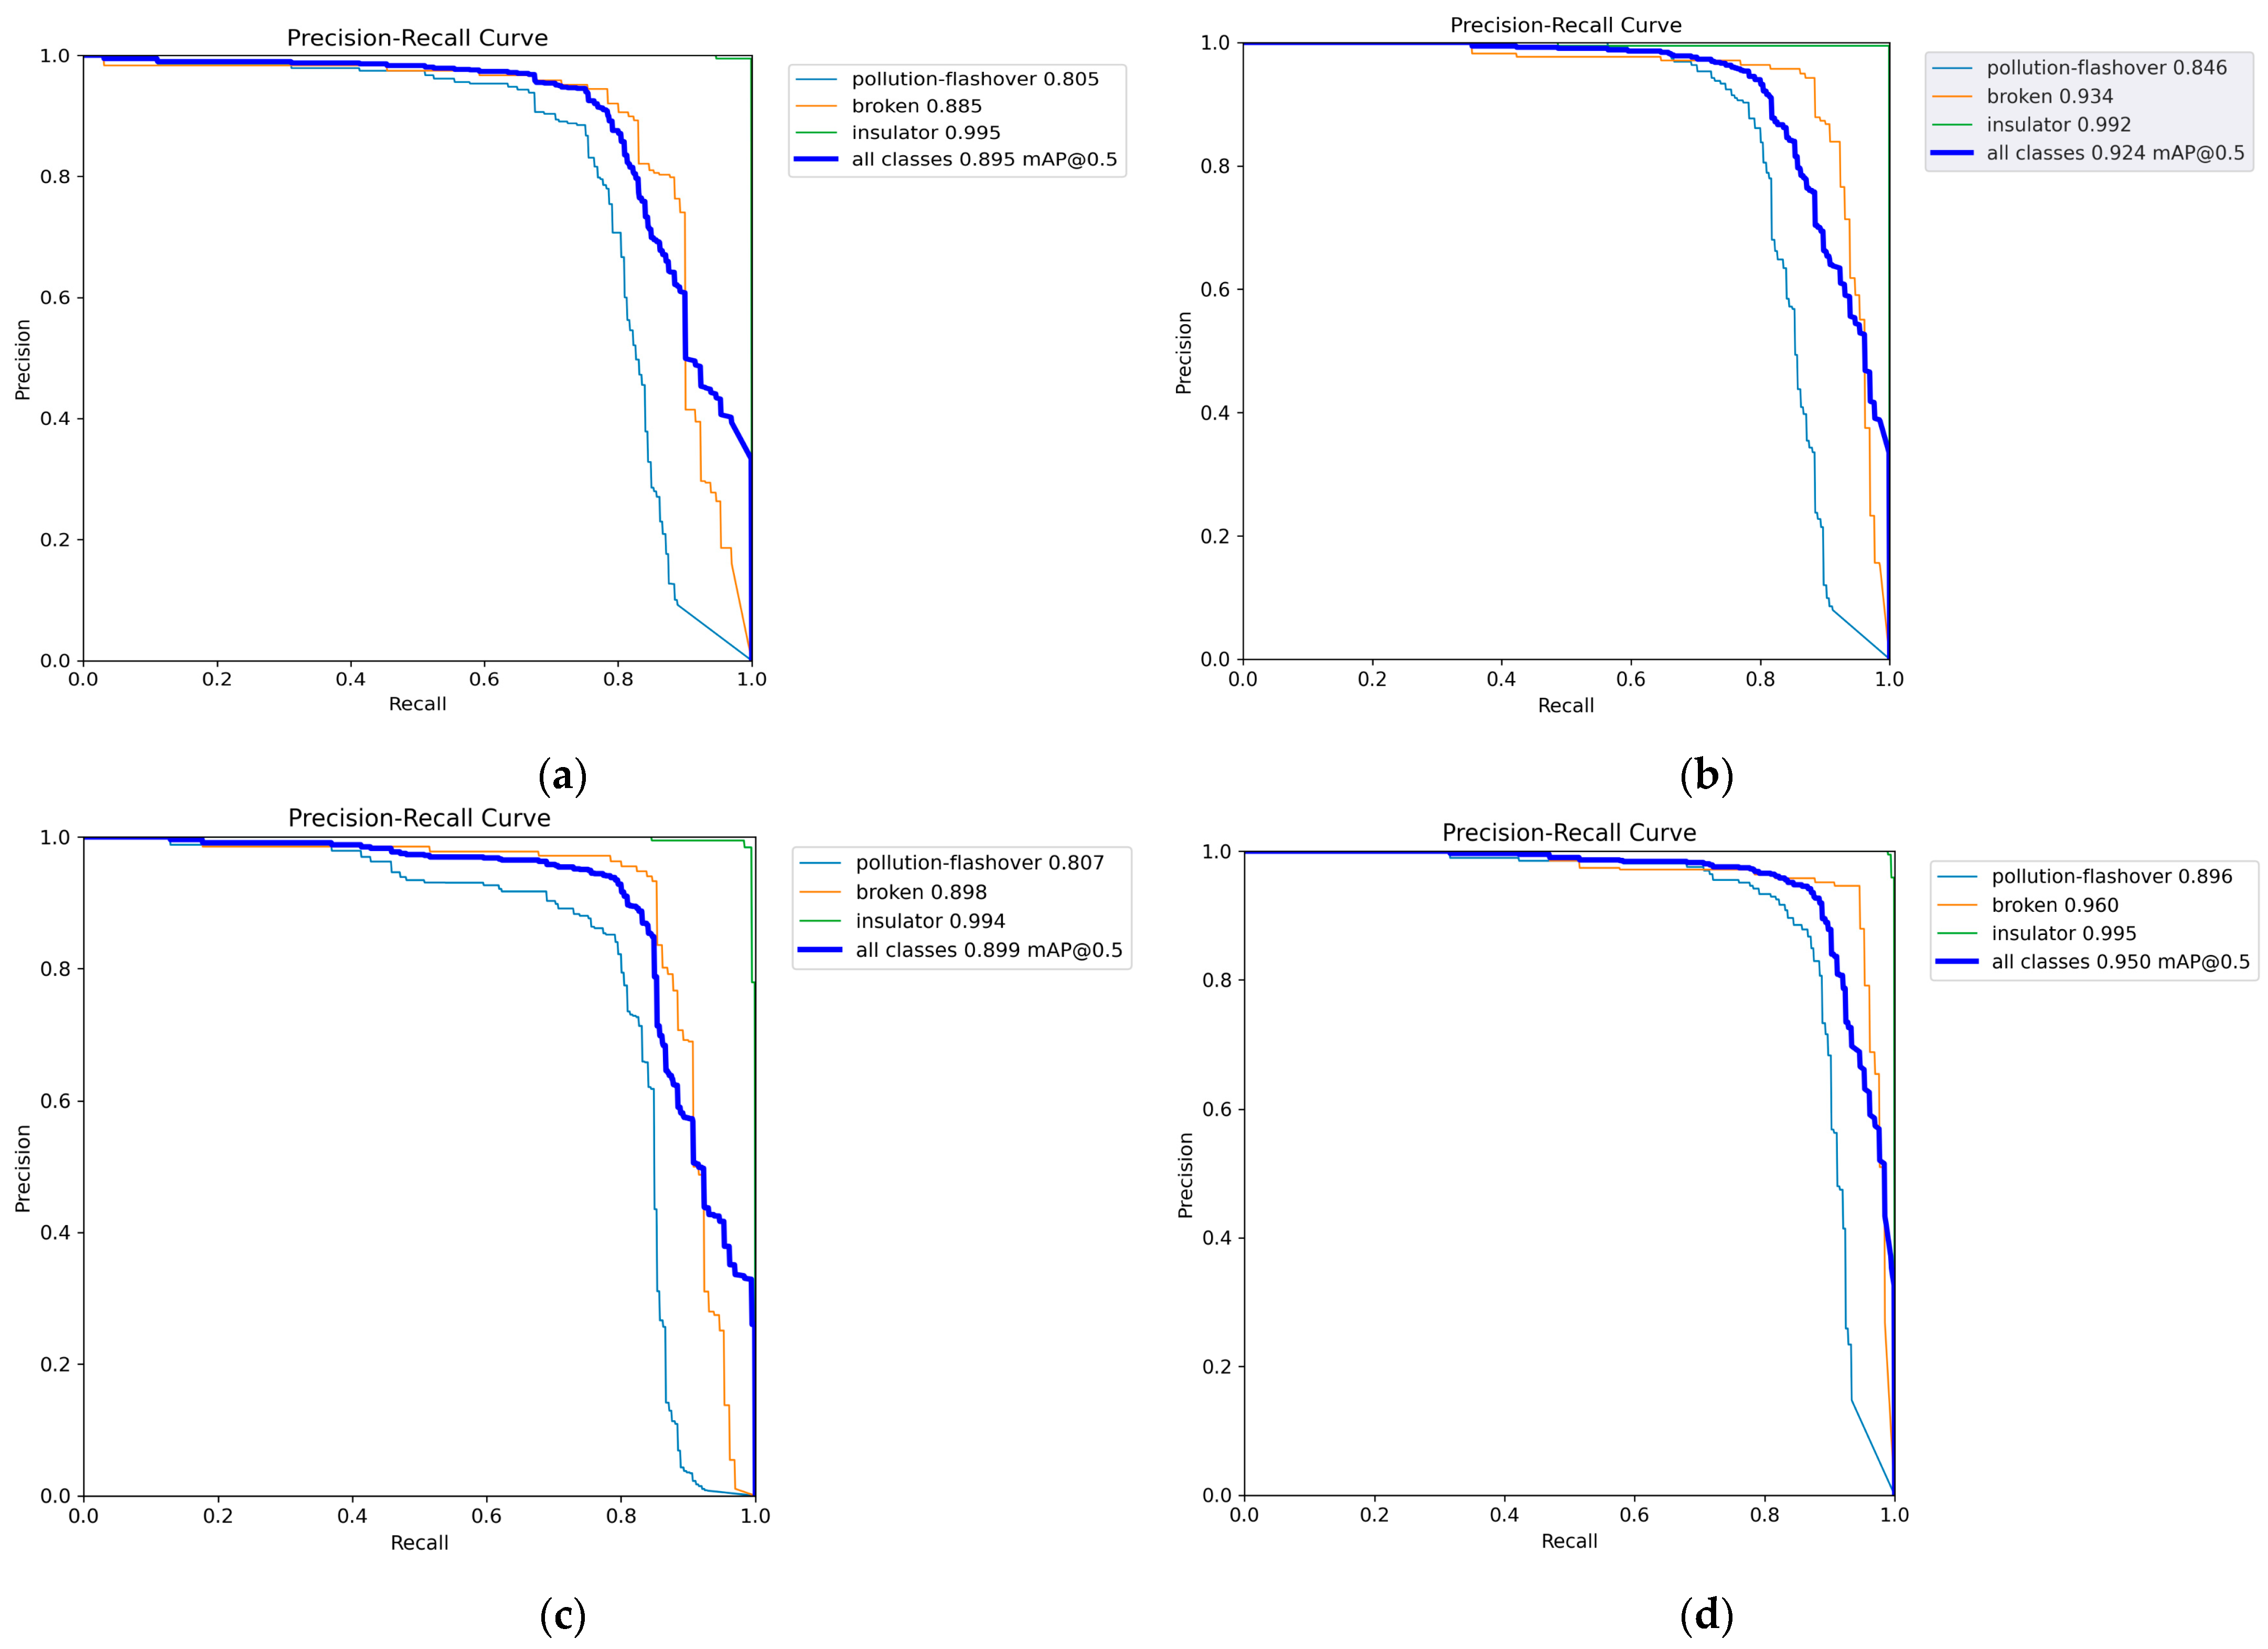
The precision–recall curves of the evaluation results for YOLOv8n, YOLOv9t, YOLOv10n, and PAL-YOLOv8 are shown in Figure 9. Compared to YOLOv8n, YOLOv9t, and YOLOv10n, PAL-YOLOv8 significantly improves the AP values for the pollution-flashover and broken defect categories.
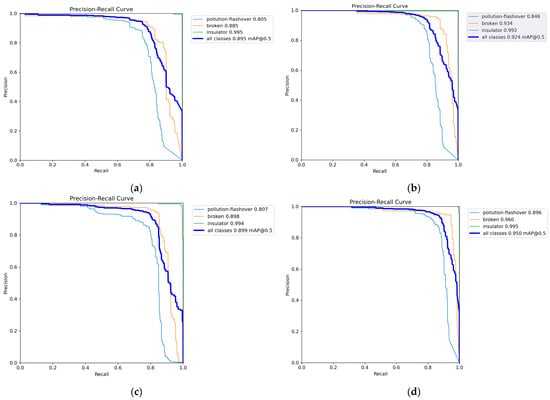
Figure 9.
Precision–recall curve comparisons: (a) YOLOv8n precision–recall curve; (b) YOLOv9t precision–recall curve; (c) YOLOv10n precision–recall curve; (d) PAL-YOLOv8 precision–recall curve.
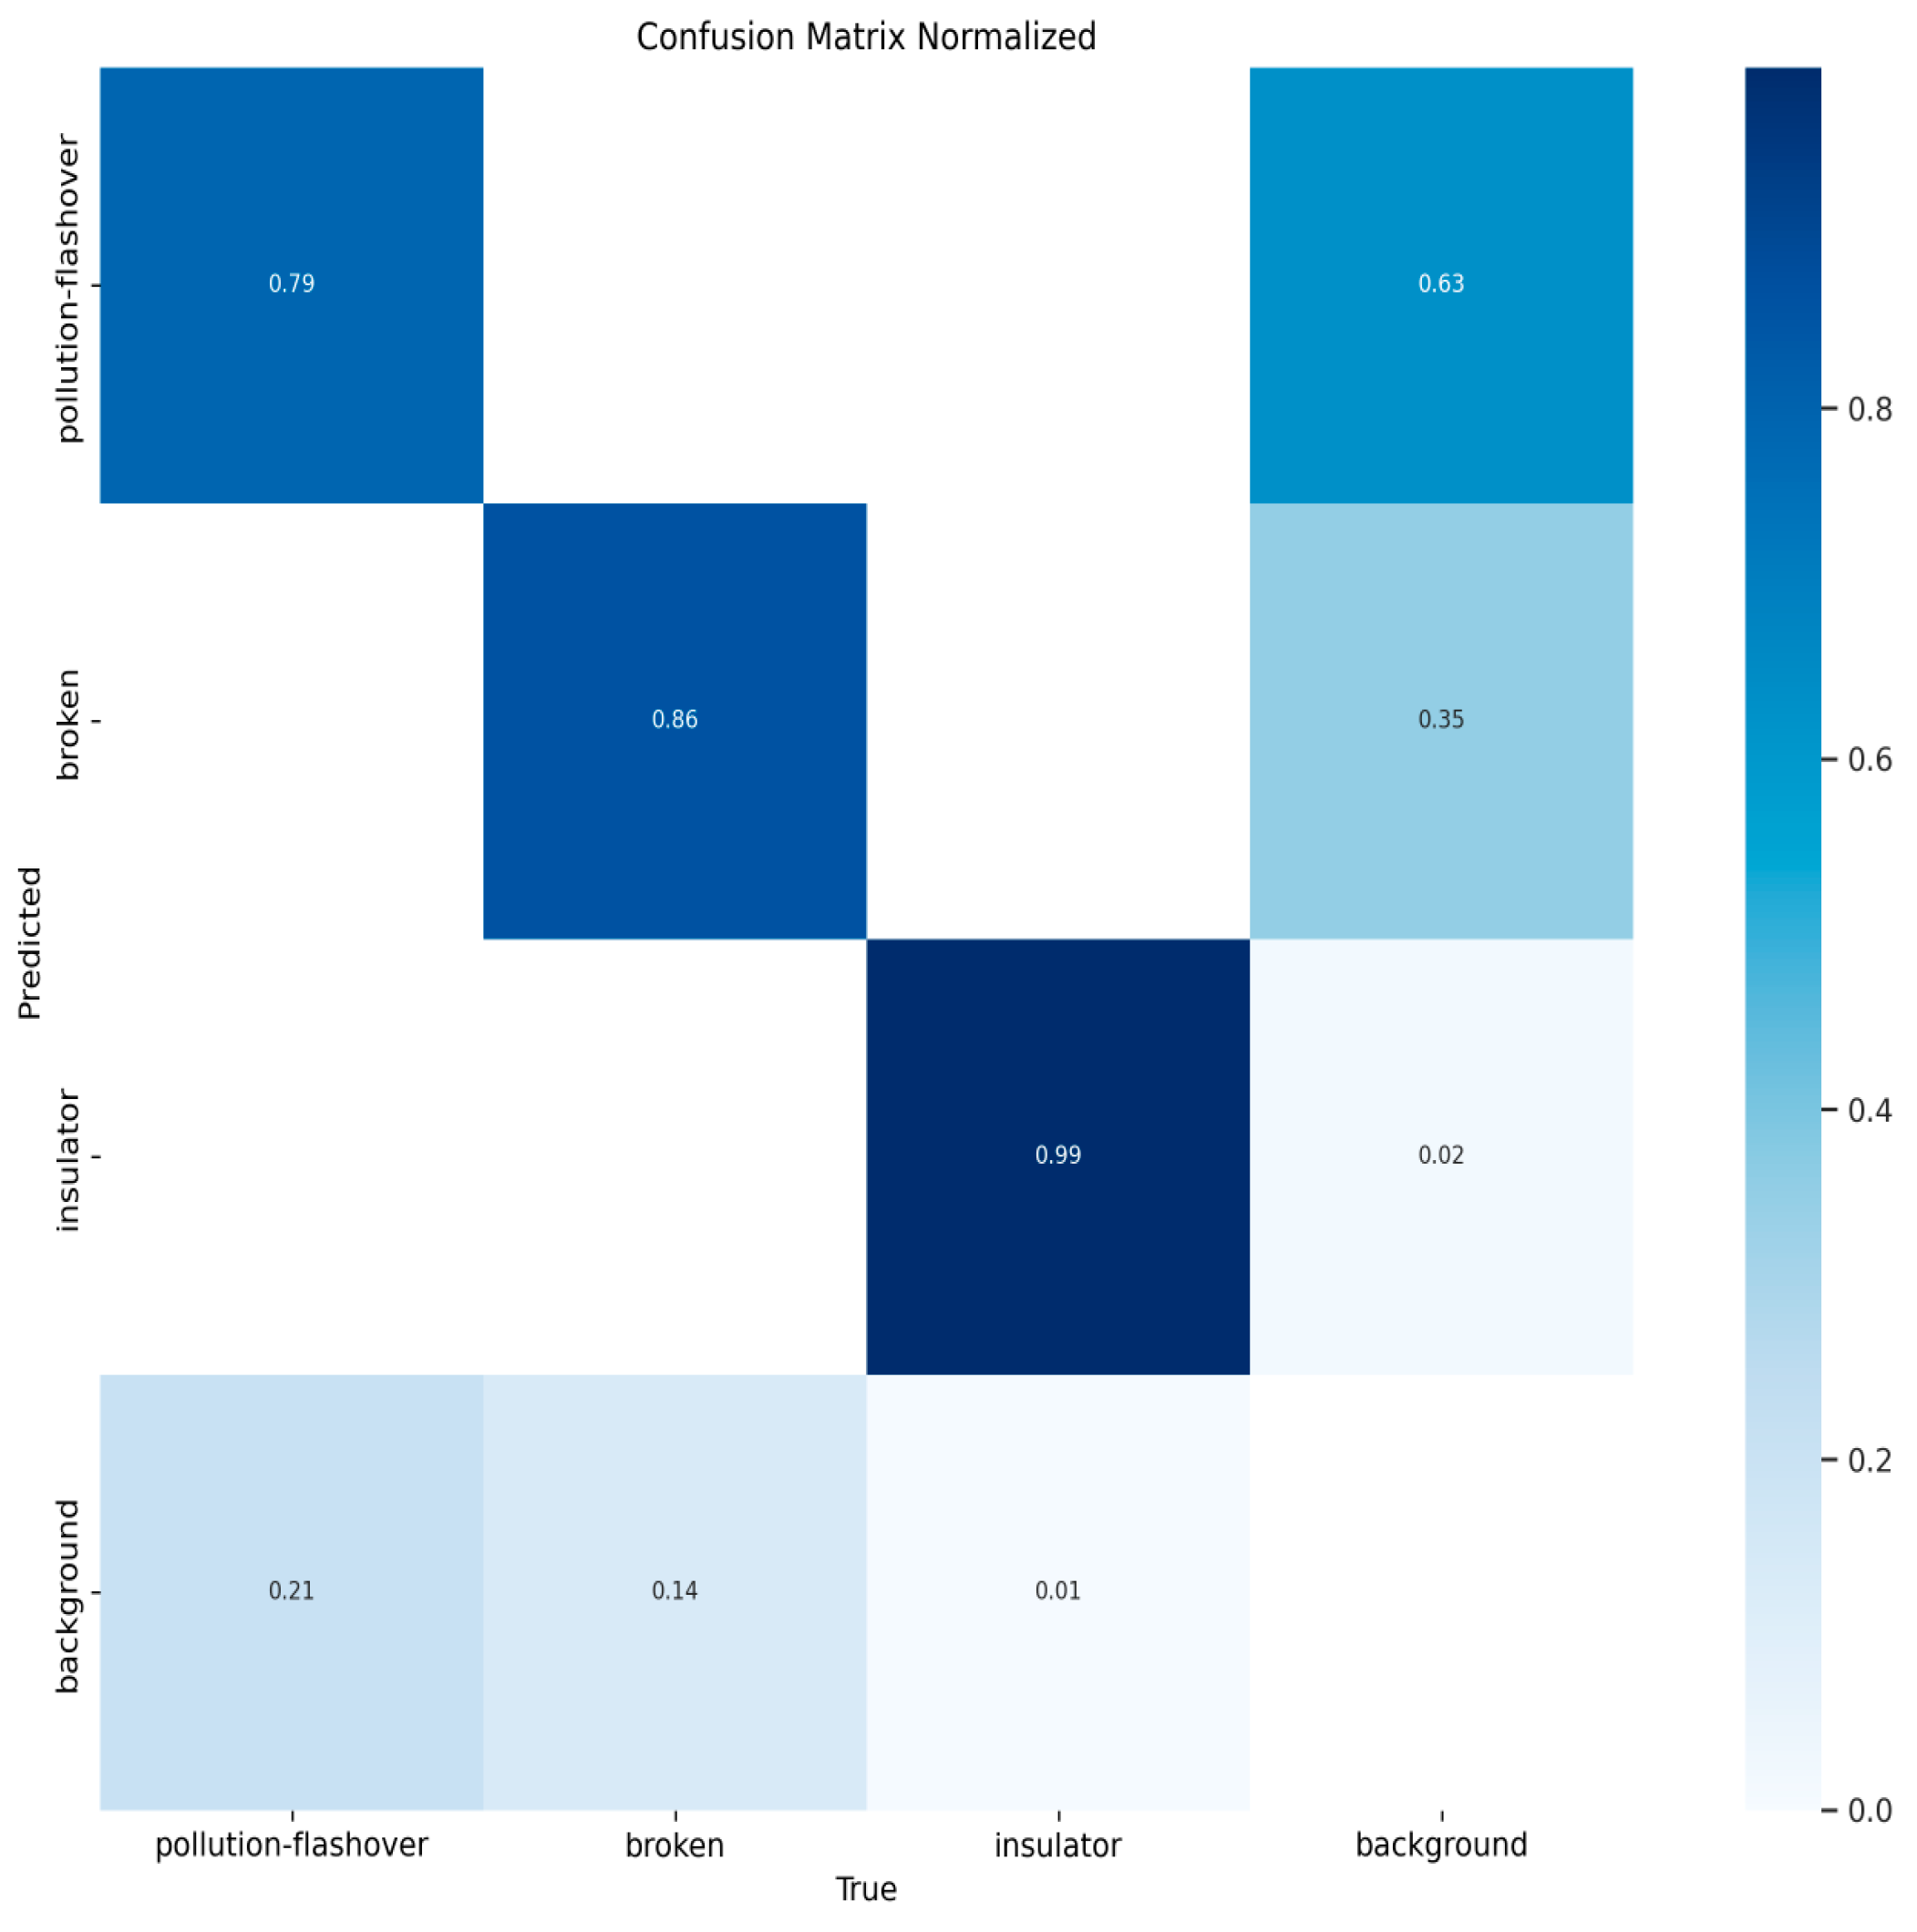
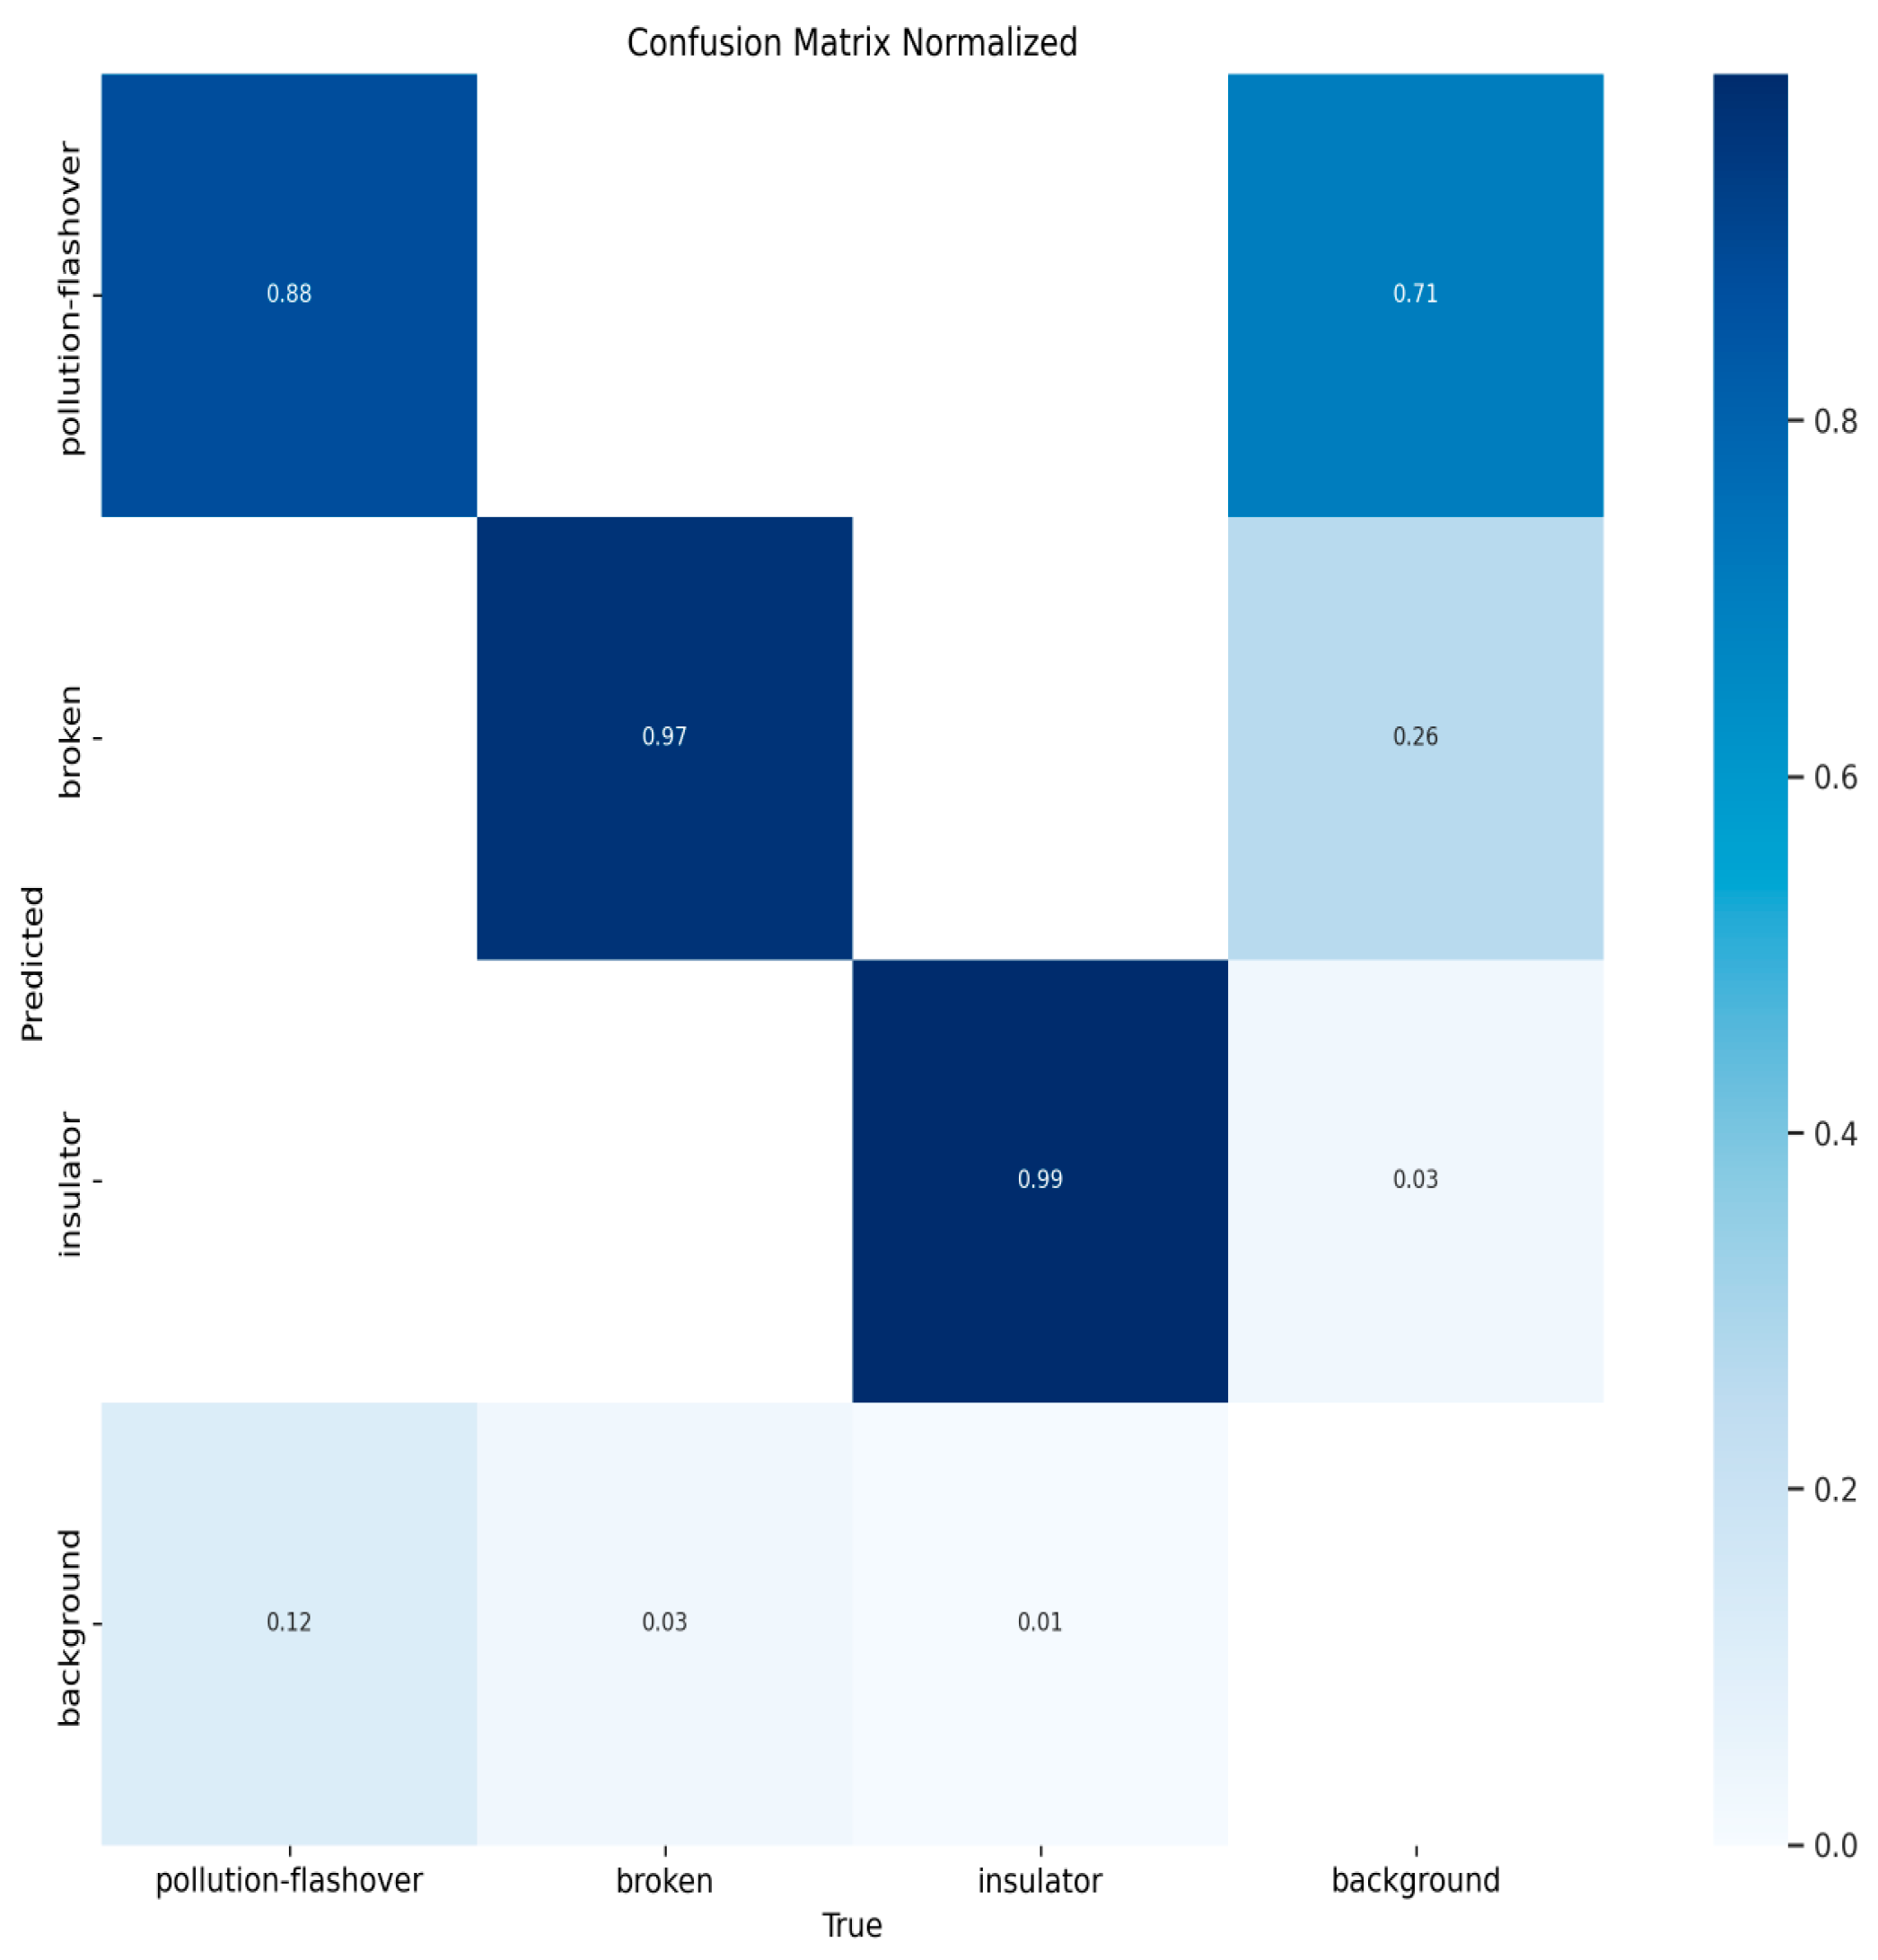
Figure 10, Figure 11, Figure 12 and Figure 13 show the confusion matrices for YOLOv8n, YOLOv9t, YOLOv10n, and PAL-YOLOv8, respectively. In these figures, the elements along the diagonal represent the percentage of correctly predicted sample counts, while the elements in the lower triangular region indicate the percentage of missed sample counts. Compared to the other models, PAL-YOLOv8 achieves the highest correct detection rate and the lowest missed detection rate.
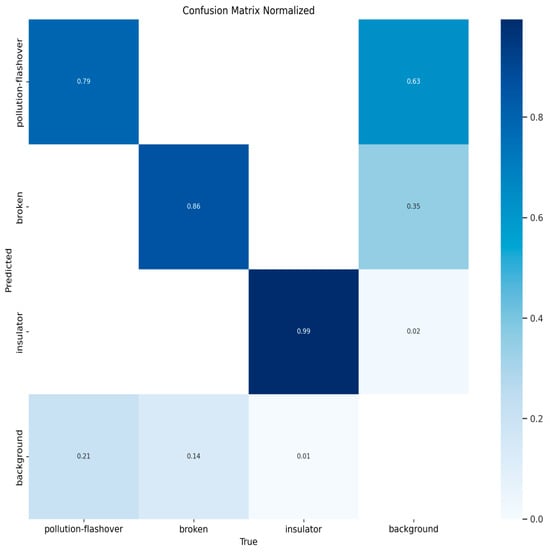
Figure 10.
YOLOv8n confusion matrix.
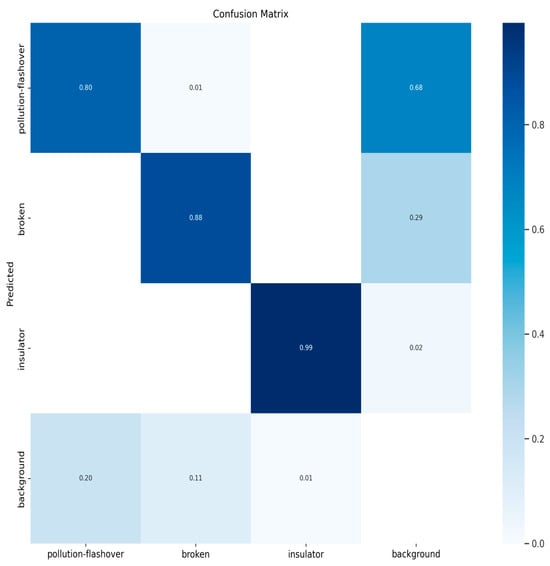
Figure 11.
YOLOv9t confusion matrix.
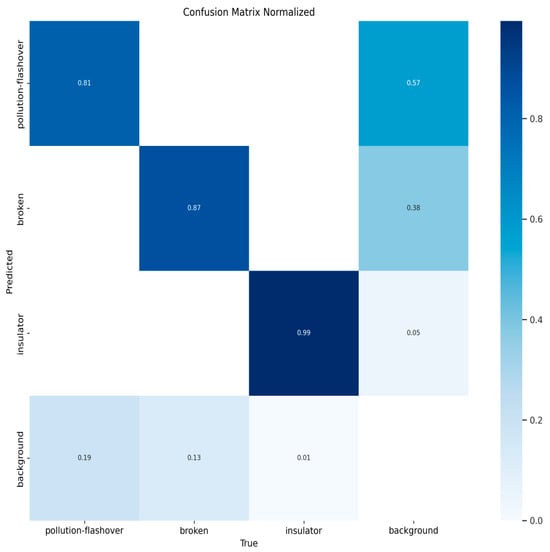
Figure 12.
YOLOv10n confusion matrix.
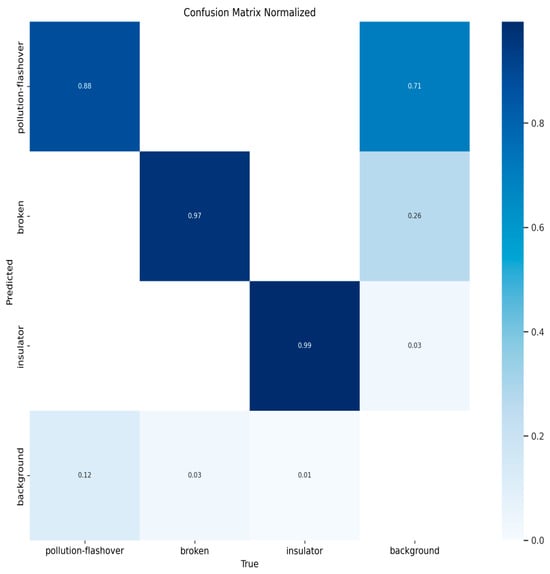
Figure 13.
PAL-YOLOv8 confusion matrix.
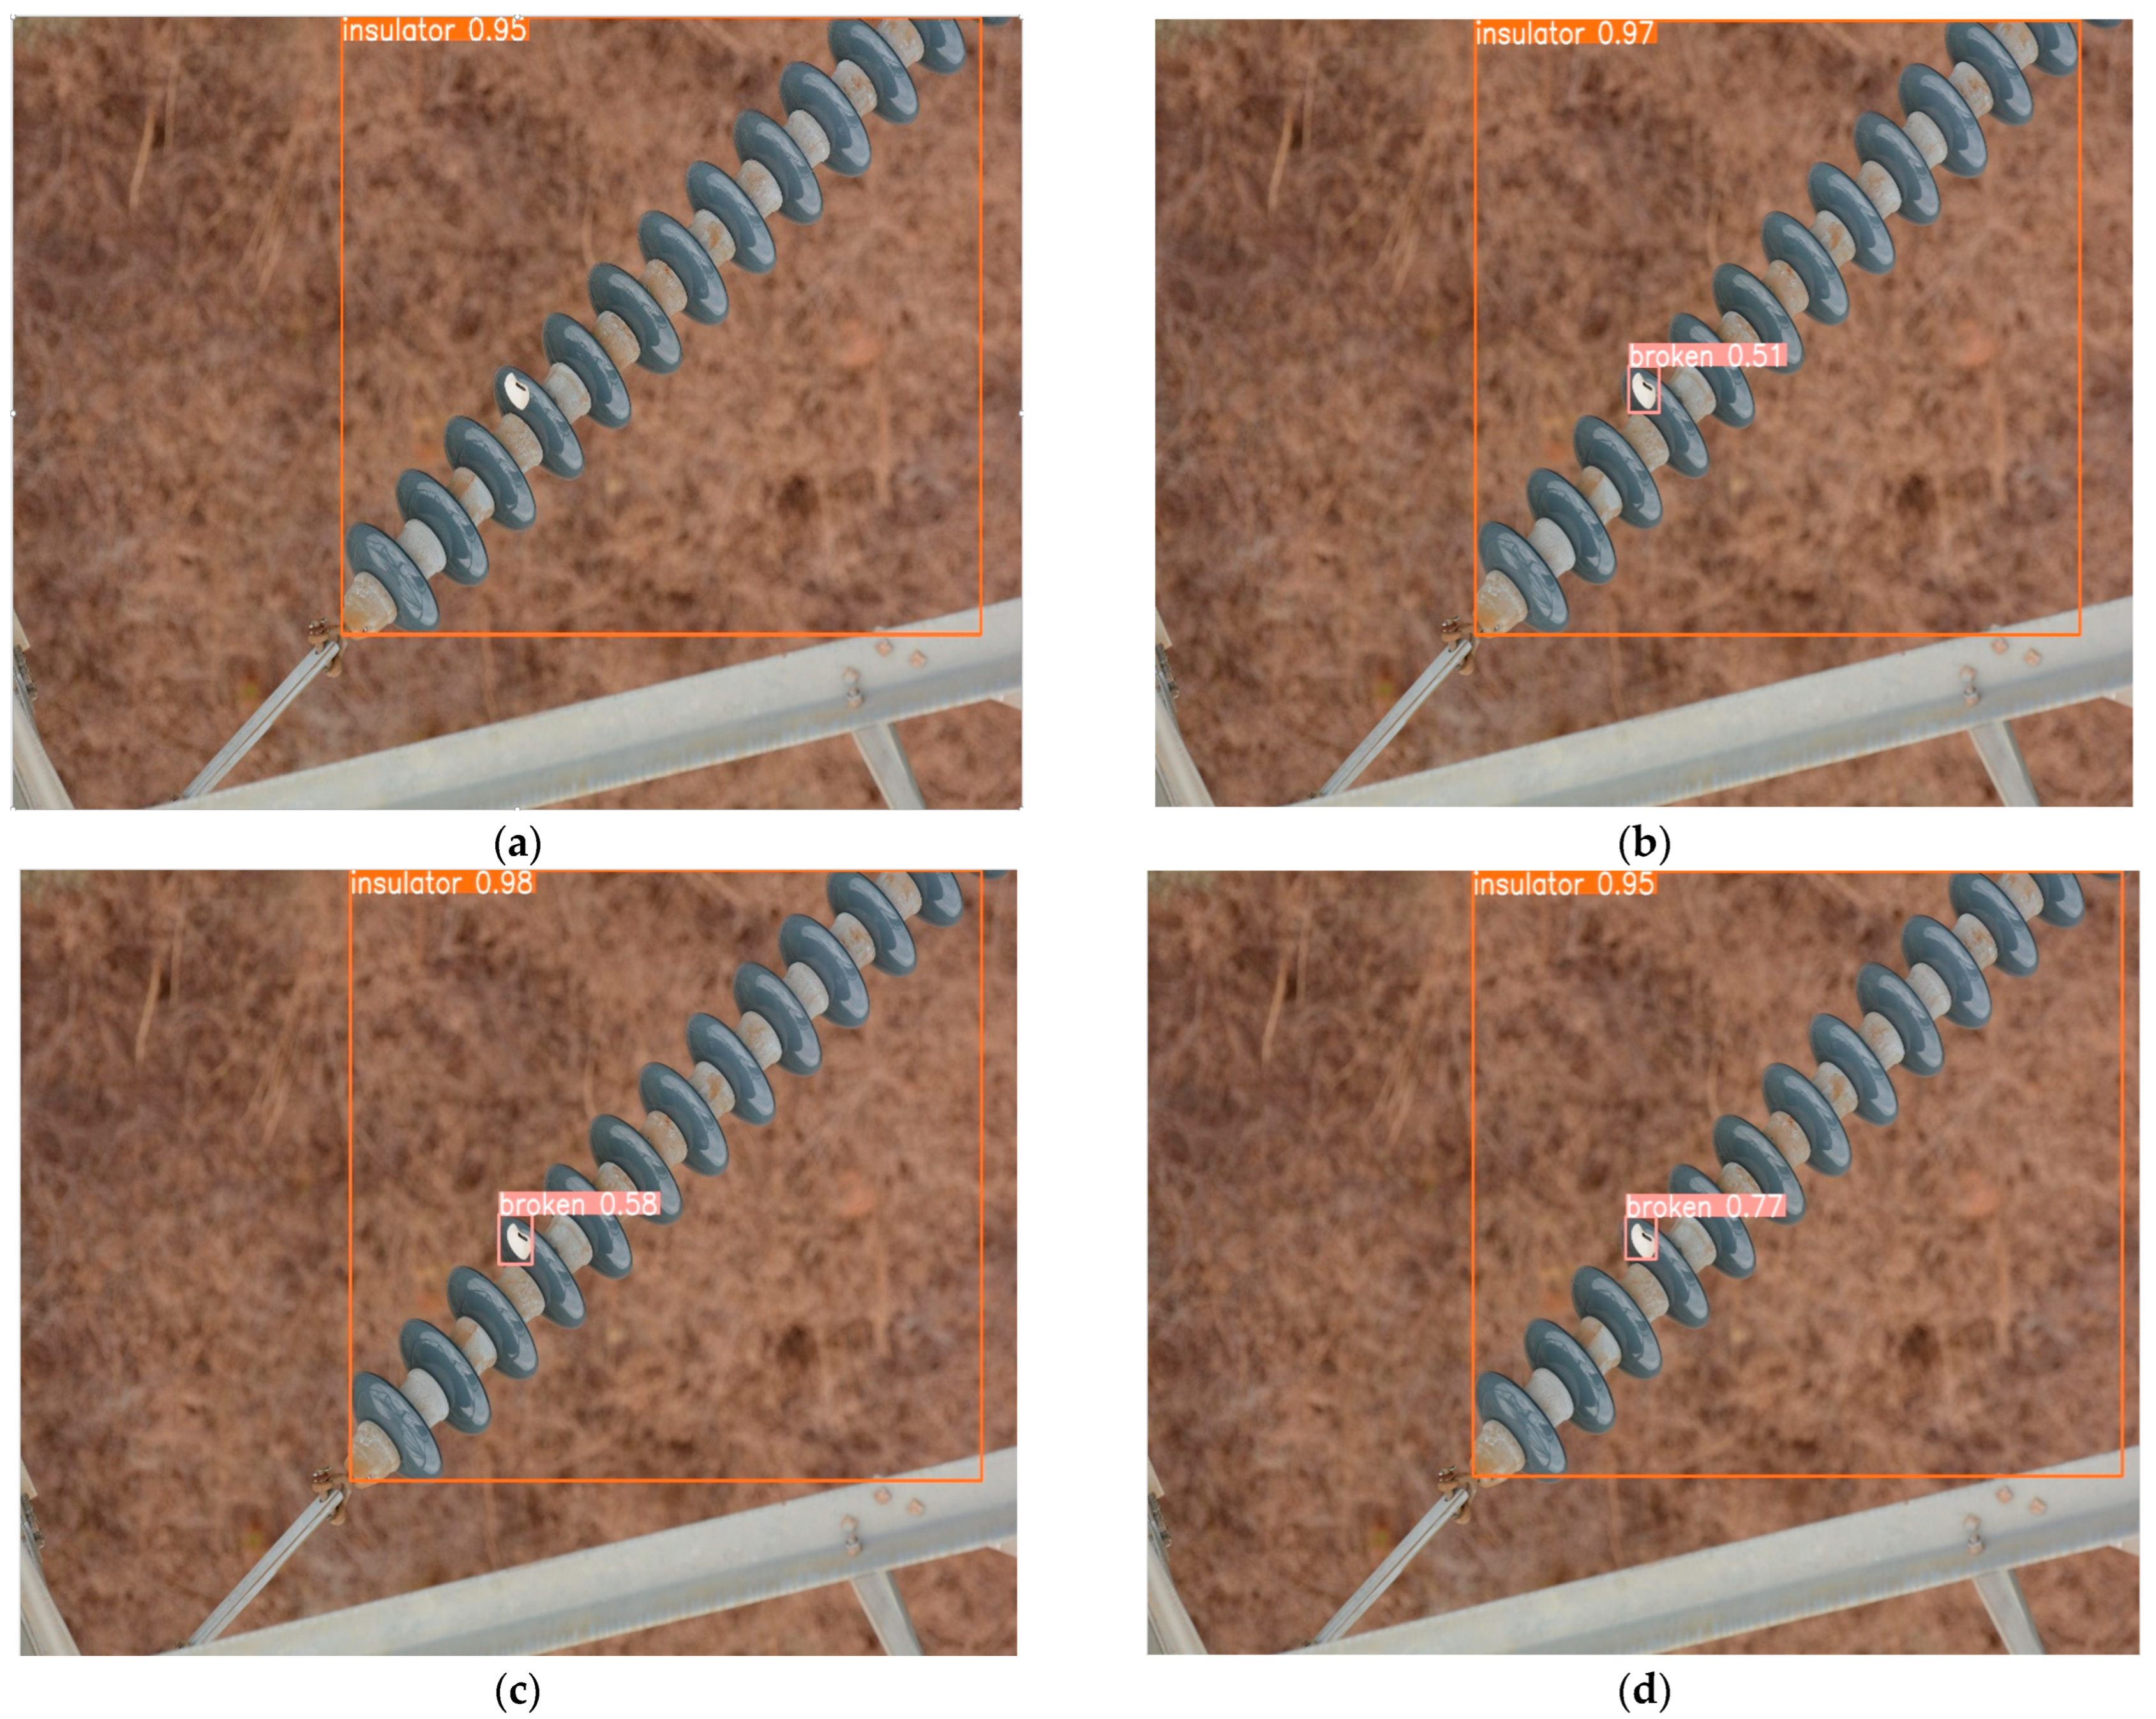
To visually demonstrate the effectiveness of PAL-YOLOv8 in detecting insulator defects and its application value in electrical infrastructure maintenance, we selected three images from the test set that contain small insulator defects for detection and visualization. These results are compared with those of YOLOv8n, YOLOv9t, and YOLOv10n, as shown in Figure 14, Figure 15 and Figure 16.
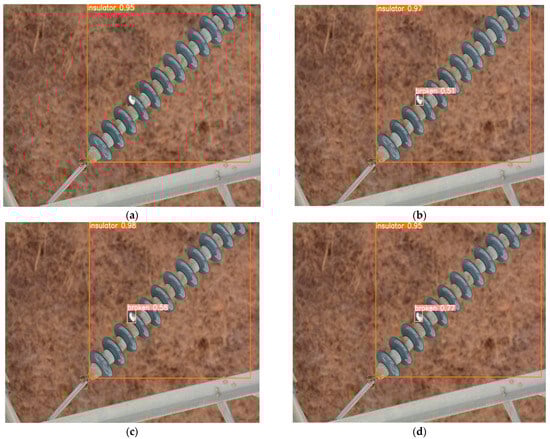
Figure 14.
Comparison of detection results for small insulator defects: (a) YOLOv8n detection results; (b) YOLOv9t detection results; (c) YOLOv10n detection results; (d) PAL-YOLOv8 detection results.
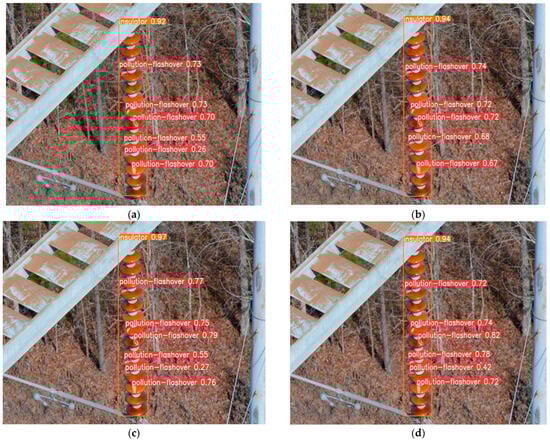
Figure 15.
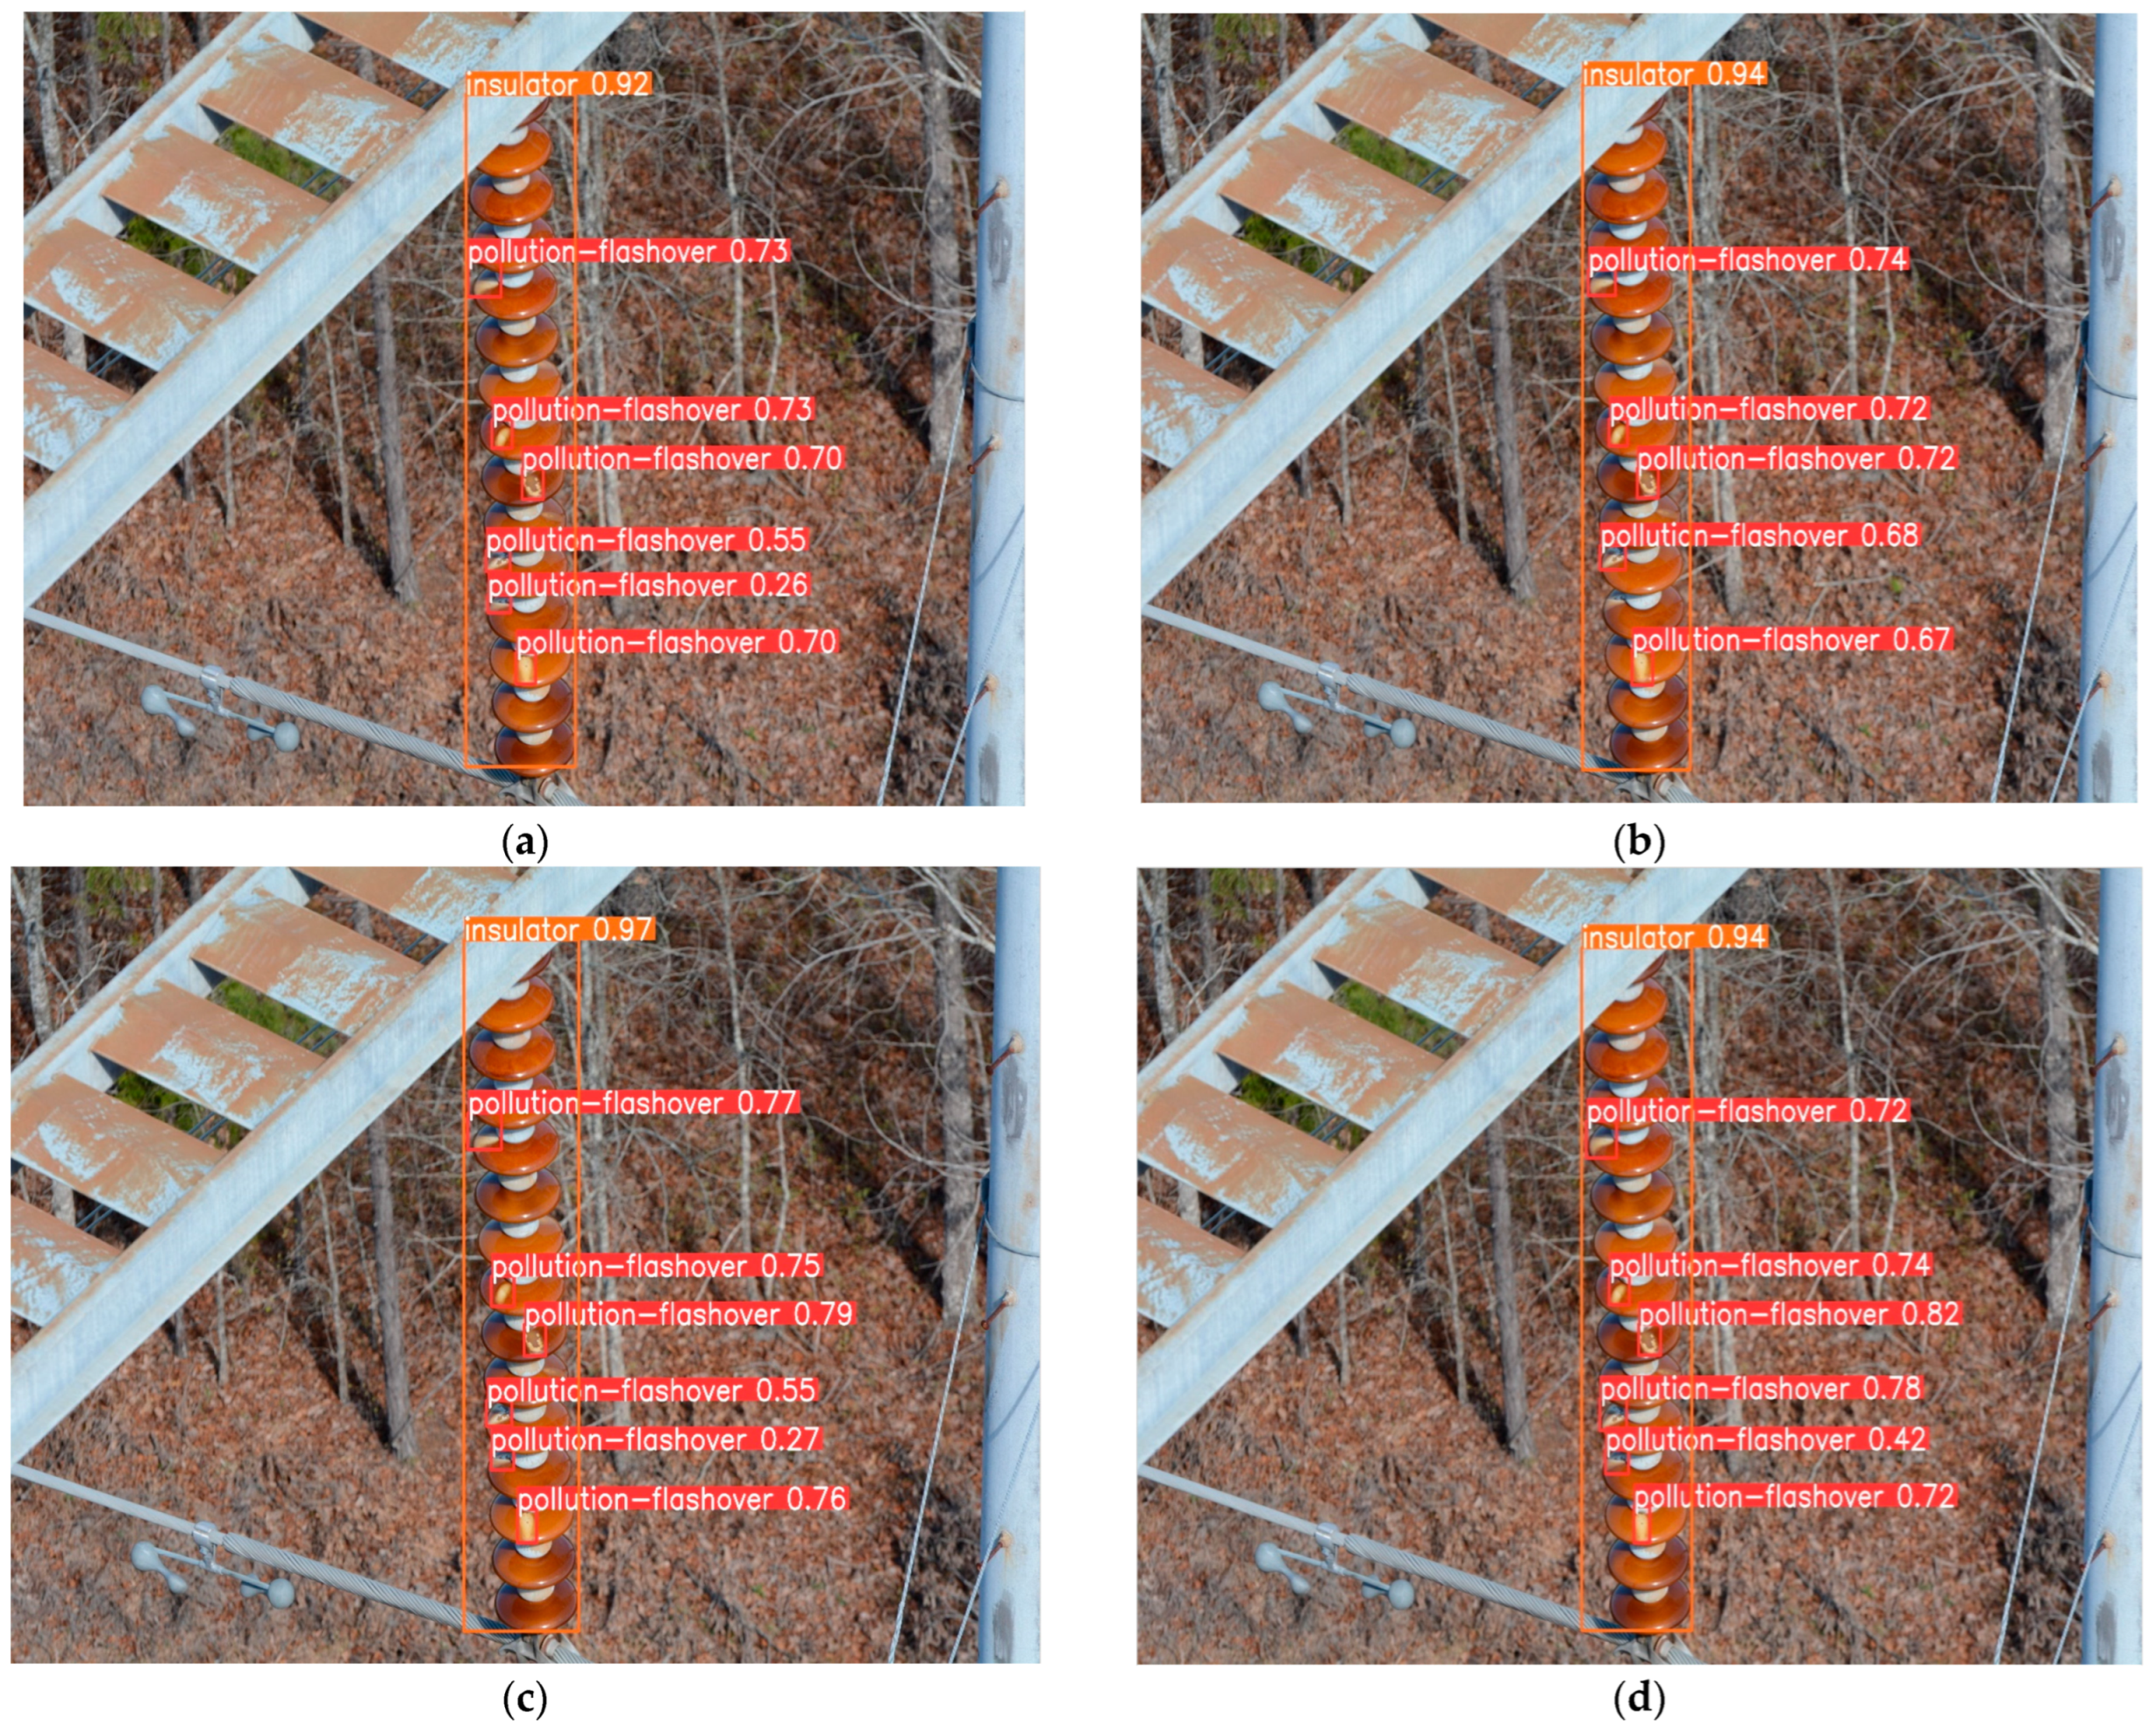
Comparison of detection results for dense small insulator defects: (a) YOLOv8n detection results; (b) YOLOv9t detection results; (c) YOLOv10n detection results; (d) PAL-YOLOv8 detection results.
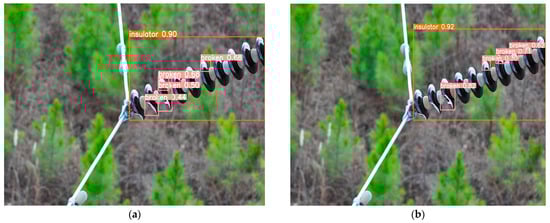
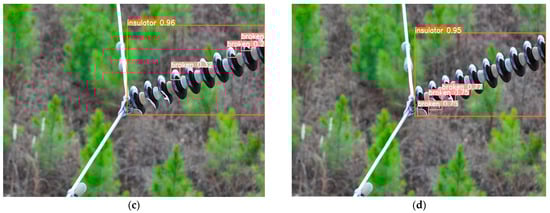
Figure 16.
Comparison of defect detection results for special material insulators: (a) YOLOv8n detection results; (b) YOLOv9t detection results; (c) YOLOv10n detection results; (d) PAL-YOLOv8 detection results.
Figure 14 shows the detection results of different models for small broken defects. It can be observed that all models except YOLOv8n correctly detect the broken defects in the images. Figure 15 shows the detection results of different models for dense, small, pollution-flashover defects. Among all the models, only YOLOv9t exhibited one missed detection, while YOLOv8n, YOLOv10, and PAL-YOLOv8 demonstrated superior performances in detecting dense, small targets compared to YOLOv9t. The insulators in Figure 16 exhibit reflectivity due to their material properties, resulting in poor performances by YOLOv8n, YOLOv9t, and YOLOv10n in detecting defects on this type of insulator. YOLOv8n shows one missed detection and several false positives, YOLOv9t has two missed detections and several false positives, and YOLOv10n performs the worst with three missed detections and several false positives. In contrast, PAL-YOLOv8 accurately detects all broken defects without any false positives. These results indicate that PAL-YOLOv8 has higher accuracy in detecting small insulator defects and can effectively contribute to the maintenance of electrical infrastructure.
5. Conclusions
This study proposes a PAL-YOLOv8 algorithm based on the YOLOv8n algorithm, thereby improving the accuracy of detecting small insulator defects while reducing both the amount of computation and the parameter count. First, the C2f module is improved using the PKI Block from PKINet, thereby reducing model complexity and enhancing feature extraction capabilities. Second, the Adown downsampling module from YOLOv9 is adopted to supersede the downsampling module in YOLOv8n, allowing for the capture of richer feature information. Additionally, the Focaler-SIoU loss function is introduced to enhance the detection performance. Finally, the LAMP algorithm is employed to remove redundant network connections and weights. Experimental results show that the PAL-YOLOv8 algorithm achieves mAP50 and mAP50–95 values of and , respectively, on the insulator defect detection dataset, with parameters reduced to , model size reduced to 2.7 MB, and GFLOPs reduced to 3.9.
In the future, detection accuracy will be further enhanced through distillation techniques, and the model will be deployed on embedded devices. Given the limited types of external defects on insulators, detecting internal defects is also crucial. We will continue to focus on insulator defect detection datasets to improve and expand the range of defect types.
Author Contributions
Conceptualization, D.Z. and K.C.; methodology, K.H. and K.C.; software, D.Z. and H.J.; validation, C.K. and D.Z.; analysis, K.H. and H.J.; writing—original draft, C.K.; supervision, H.J. All authors have read and agreed to the published version of the manuscript.
Funding
This research was supported by the MSIT (Ministry of Science and ICT), Korea, under the Innovative Human Resource Development for Local Intellectualization support program (IITP-2024-RS-2022-00156334) supervised by the IITP (Institute for Information & communications Technology Planning & Evaluation). This research was support by “Regional Innovation Strategy (RIS)”, through the Nation Research Foundation of Korea (NRF), funded by the Ministry of Education (MOE2021RIS-004).
Data Availability Statement
Data are contained within the article.
Acknowledgments
The authors also greatly appreciate the anonymous reviewers and academic editor for their careful comments and valuable suggestions to improve the manuscript.
Conflicts of Interest
The authors declare no conflicts of interest.
Abbreviations
| UAV | Unmanned Aerial Vehicle |
| PKINet | Poly Kernel Inception Network |
| LAMP | Layer-Adaptive Magnitude-based Pruning |
| PAN-FPN | Path Aggregation Network—Feature Pyramid Network |
| CAA | Context Anchor Attention |
| CioU | Complete IoU |
| GFLOPs | Giga Floating-Point Operations Per Second |
| FPS | Frames Per Second |
References
- Li, X.; Li, Z.; Wang, H.; Li, W. Unmanned aerial vehicle for transmission line inspection: Status, standardization, and perspectives. Front. Energy Res. 2021, 9, 713634. [Google Scholar] [CrossRef]
- Liu, Y.; Huang, X.; Liu, D. Weather-Domain Transfer-Based Attention YOLO for Multi-Domain Insulator Defect Detection and Classification in UAV Images. Entropy 2024, 26, 136. [Google Scholar] [CrossRef] [PubMed]
- Luo, X.; Wu, Y.; Zhao, L. YOLOD: A target detection method for UAV aerial imagery. Remote Sens. 2022, 14, 3240. [Google Scholar] [CrossRef]
- Wang, G.; Chen, Y.; An, P.; Hong, H.; Hu, J.; Huang, T. UAV-YOLOv8: A small-object-detection model based on improved YOLOv8 for UAV aerial photography scenarios. Sensors 2023, 23, 7190. [Google Scholar] [CrossRef]
- De Curtò, J.; De Zarza, I.; Calafate, C.T. Semantic scene understanding with large language models on unmanned aerial vehicles. Drones 2023, 7, 114. [Google Scholar] [CrossRef]
- Zhang, C.; Liu, X.; Chen, B.; Yin, P.; Li, J.; Li, Y.; Meng, X. Insulator profile detection of transmission line based on traditional edge detection algorithm. In Proceedings of the 2020 IEEE International Conference on Artificial Intelligence and Computer Applications (ICAICA), Dalian, China, 27–29 June 2020; pp. 267–269. [Google Scholar]
- Damodaran, S.; Shanmugam, L.; Swaroopan, N. Classification of insulators based on k-means and SVM. AIP Conf. Proc. 2023, 2917, 050010. [Google Scholar]
- Li, Z.; Liu, F.; Yang, W.; Peng, S.; Zhou, J. A survey of convolutional neural networks: Analysis, applications, and prospects. IEEE Trans. Neural Netw. Learn. Syst. 2021, 33, 6999–7019. [Google Scholar] [CrossRef] [PubMed]
- Liu, C.; Wu, Y.; Liu, J.; Han, J. MTI-YOLO: A light-weight and real-time deep neural network for insulator detection in complex aerial images. Energies 2021, 14, 1426. [Google Scholar] [CrossRef]
- Liang, F.; Zhou, Y.; Chen, X.; Liu, F.; Zhang, C.; Wu, X. Review of target detection technology based on deep learning. In Proceedings of the 5th International Conference on Control Engineering and Artificial Intelligence, Sanya, China, 14–16 January 2021; pp. 132–135. [Google Scholar]
- Liu, M.; Zhang, M.; Chen, X.; Zheng, C.; Wang, H. YOLOv8-LMG: An Improved Bearing Defect Detection Algorithm Based on YOLOv8. Processes 2024, 12, 930. [Google Scholar] [CrossRef]
- Li, C.; Li, L.; Jiang, H.; Weng, K.; Geng, Y.; Li, L.; Ke, Z.; Li, Q.; Cheng, M.; Nie, W. YOLOv6: A single-stage object detection framework for industrial applications. arXiv 2022, arXiv:2209.02976. [Google Scholar]
- Xu, S.; Deng, J.; Huang, Y.; Ling, L.; Han, T. Research on insulator defect detection based on an improved mobilenetv1-yolov4. Entropy 2022, 24, 1588. [Google Scholar] [CrossRef]
- Yi, W.; Ma, S.; Li, R. Insulator and defect detection model based on improved YOLO-S. IEEE Access 2023, 11, 93215–93226. [Google Scholar] [CrossRef]
- Hu, Y.; Wen, B.; Ye, Y.; Yang, C. Multi-Defect Detection Network for High-Voltage Insulators Based on Adaptive Multi-Attention Fusion. Appl. Sci. 2023, 13, 13351. [Google Scholar] [CrossRef]
- Zheng, J.; Wu, H.; Zhang, H.; Wang, Z.; Xu, W. Insulator-defect detection algorithm based on improved YOLOv7. Sensors 2022, 22, 8801. [Google Scholar] [CrossRef]
- Chang, R.; Zhou, S.; Zhang, Y.; Zhang, N.; Zhou, C.; Li, M. Research on insulator defect detection based on improved YOLOv7 and multi-UAV cooperative system. Coatings 2023, 13, 880. [Google Scholar] [CrossRef]
- He, Z.; Yang, W.; Liu, Y.; Zheng, A.; Liu, J.; Lou, T.; Zhang, J. Insulator Defect Detection Based on YOLOv8s-SwinT. Information 2024, 15, 206. [Google Scholar] [CrossRef]
- Chen, Y.; Liu, H.; Chen, J.; Hu, J.; Zheng, E. Insu-YOLO: An insulator defect detection algorithm based on multiscale feature fusion. Electronics 2023, 12, 3210. [Google Scholar] [CrossRef]
- Liu, D. Study on insulator defect detection based on improved YOLOv8. J. Phys. Conf. Ser. 2024, 2770, 012009. [Google Scholar] [CrossRef]
- Cai, X.; Lai, Q.; Wang, Y.; Wang, W.; Sun, Z.; Yao, Y. Poly kernel inception network for remote sensing detection. In Proceedings of the IEEE/CVF Conference on Computer Vision and Pattern Recognition, Seattle, WA, USA, 17–21 June 2024; pp. 27706–27716. [Google Scholar]
- Wang, C.Y.; Yeh, I.H.; Liao, H.Y.M. Yolov9: Learning what you want to learn using programmable gradient information. arXiv 2024, arXiv:2402.13616. [Google Scholar]
- Zheng, Z.; Wang, P.; Ren, D.; Liu, W.; Ye, R.; Hu, Q.; Zuo, W. Enhancing geometric factors in model learning and inference for object detection and instance segmentation. IEEE Trans. Cybern. 2021, 52, 8574–8586. [Google Scholar] [CrossRef]
- Zhang, H.; Zhang, S. Focaler-IoU: More Focused Intersection over Union Loss. arXiv 2024, arXiv:2401.10525. [Google Scholar]
- Gevorgyan, Z. SIoU loss: More powerful learning for bounding box regression. arXiv 2022, arXiv:2205.12740. [Google Scholar]
- Lee, J.; Park, S.; Mo, S.; Ahn, S.; Shin, J. Layer-adaptive sparsity for the magnitude-based pruning. arXiv 2020, arXiv:2010.07611. [Google Scholar]
- Zhang, J.; Hua, Y.; Chen, L.; Li, L.; Shen, X.; Shi, W.; Wu, S.; Fu, Y.; Lv, C.; Zhu, J. EMR-YOLO: A Study of Efficient Maritime Rescue Identification Algorithms. J. Mar. Sci. Eng. 2024, 12, 1048. [Google Scholar] [CrossRef]
- Zhang, Y.F.; Ren, W.; Zhang, Z.; Jia, Z.; Wang, L.; Tan, T. Focal and efficient IOU loss for accurate bounding box regression. Neurocomputing 2022, 506, 146–157. [Google Scholar] [CrossRef]
- Liu, C.; Wang, K.; Li, Q.; Zhao, F.; Zhao, K.; Ma, H. Powerful-IoU: More straightforward and faster bounding box regression loss with a nonmonotonic focusing mechanism. Neural Netw. 2024, 170, 276–284. [Google Scholar] [CrossRef]
- Siliang, M.; Yong, X. MPDIoU: A loss for efficient and accurate bounding box regression. arXiv 2023, arXiv:2307.07662. [Google Scholar]
- Wang, C.Y.; Bochkovskiy, A.; Liao, H.Y.M. YOLOv7: Trainable bag-of-freebies sets new state-of-the-art for real-time object detectors. In Proceedings of the IEEE/CVF Conference on Computer Vision and Pattern Recognition, Vancouver, BC, Canada, 17–24 June 2023; pp. 7464–7475. [Google Scholar]
- Wang, A.; Chen, H.; Liu, L.; Chen, K.; Lin, Z.; Han, J.; Ding, G. Yolov10: Real-time end-to-end object detection. arXiv 2024, arXiv:2405.14458. [Google Scholar]
- Su, B.; Zhou, Z.; Chen, H. PVEL-AD: A large-scale open-world dataset for photovoltaic cell anomaly detection. IEEE Trans. Ind. Inform. 2022, 19, 404–413. [Google Scholar] [CrossRef]


Disclaimer/Publisher’s Note: The statements, opinions and data contained in all publications are solely those of the individual author(s) and contributor(s) and not of MDPI and/or the editor(s). MDPI and/or the editor(s) disclaim responsibility for any injury to people or property resulting from any ideas, methods, instructions or products referred to in the content. |
© 2024 by the authors. Licensee MDPI, Basel, Switzerland. This article is an open access article distributed under the terms and conditions of the Creative Commons Attribution (CC BY) license (https://creativecommons.org/licenses/by/4.0/).