
American Football Play Type and Player Position Recognition


Abstract
1. Introduction
- Creation of one synthetic dataset and two real-world datasets for experiments.
- Design of data augmentation techniques to generate data for three experiments.
- Implementation of a neural network to recognize play types.
- Implementation of a neural network to recognize player positions.
- Development of a post-processing strategy to determine personnel package in offensive play.
- Selection of the best camera placement and its required data augmentation.
2. Related Work
3. Data Preparation
3.1. Data Requirements
- Offensive linemen: Create a five-man wall known as the offensive line. This consists of two tackles on the outside, two guards on the inside, and the center in the middle.
- Quarterback: Located directly behind the center player at a varying distance.
- Running back: Appear behind the offensive line, behind or next to the quarterback. There can typically be one or two running backs in a single formation.
- Tight end: Build off the sides of the offensive line. There can be two tight ends in a single formation.
- Wide receiver: Can be either directly behind the offensive line or far to the left or right of the offensive line. There can be up to five wide receivers in a single formation.
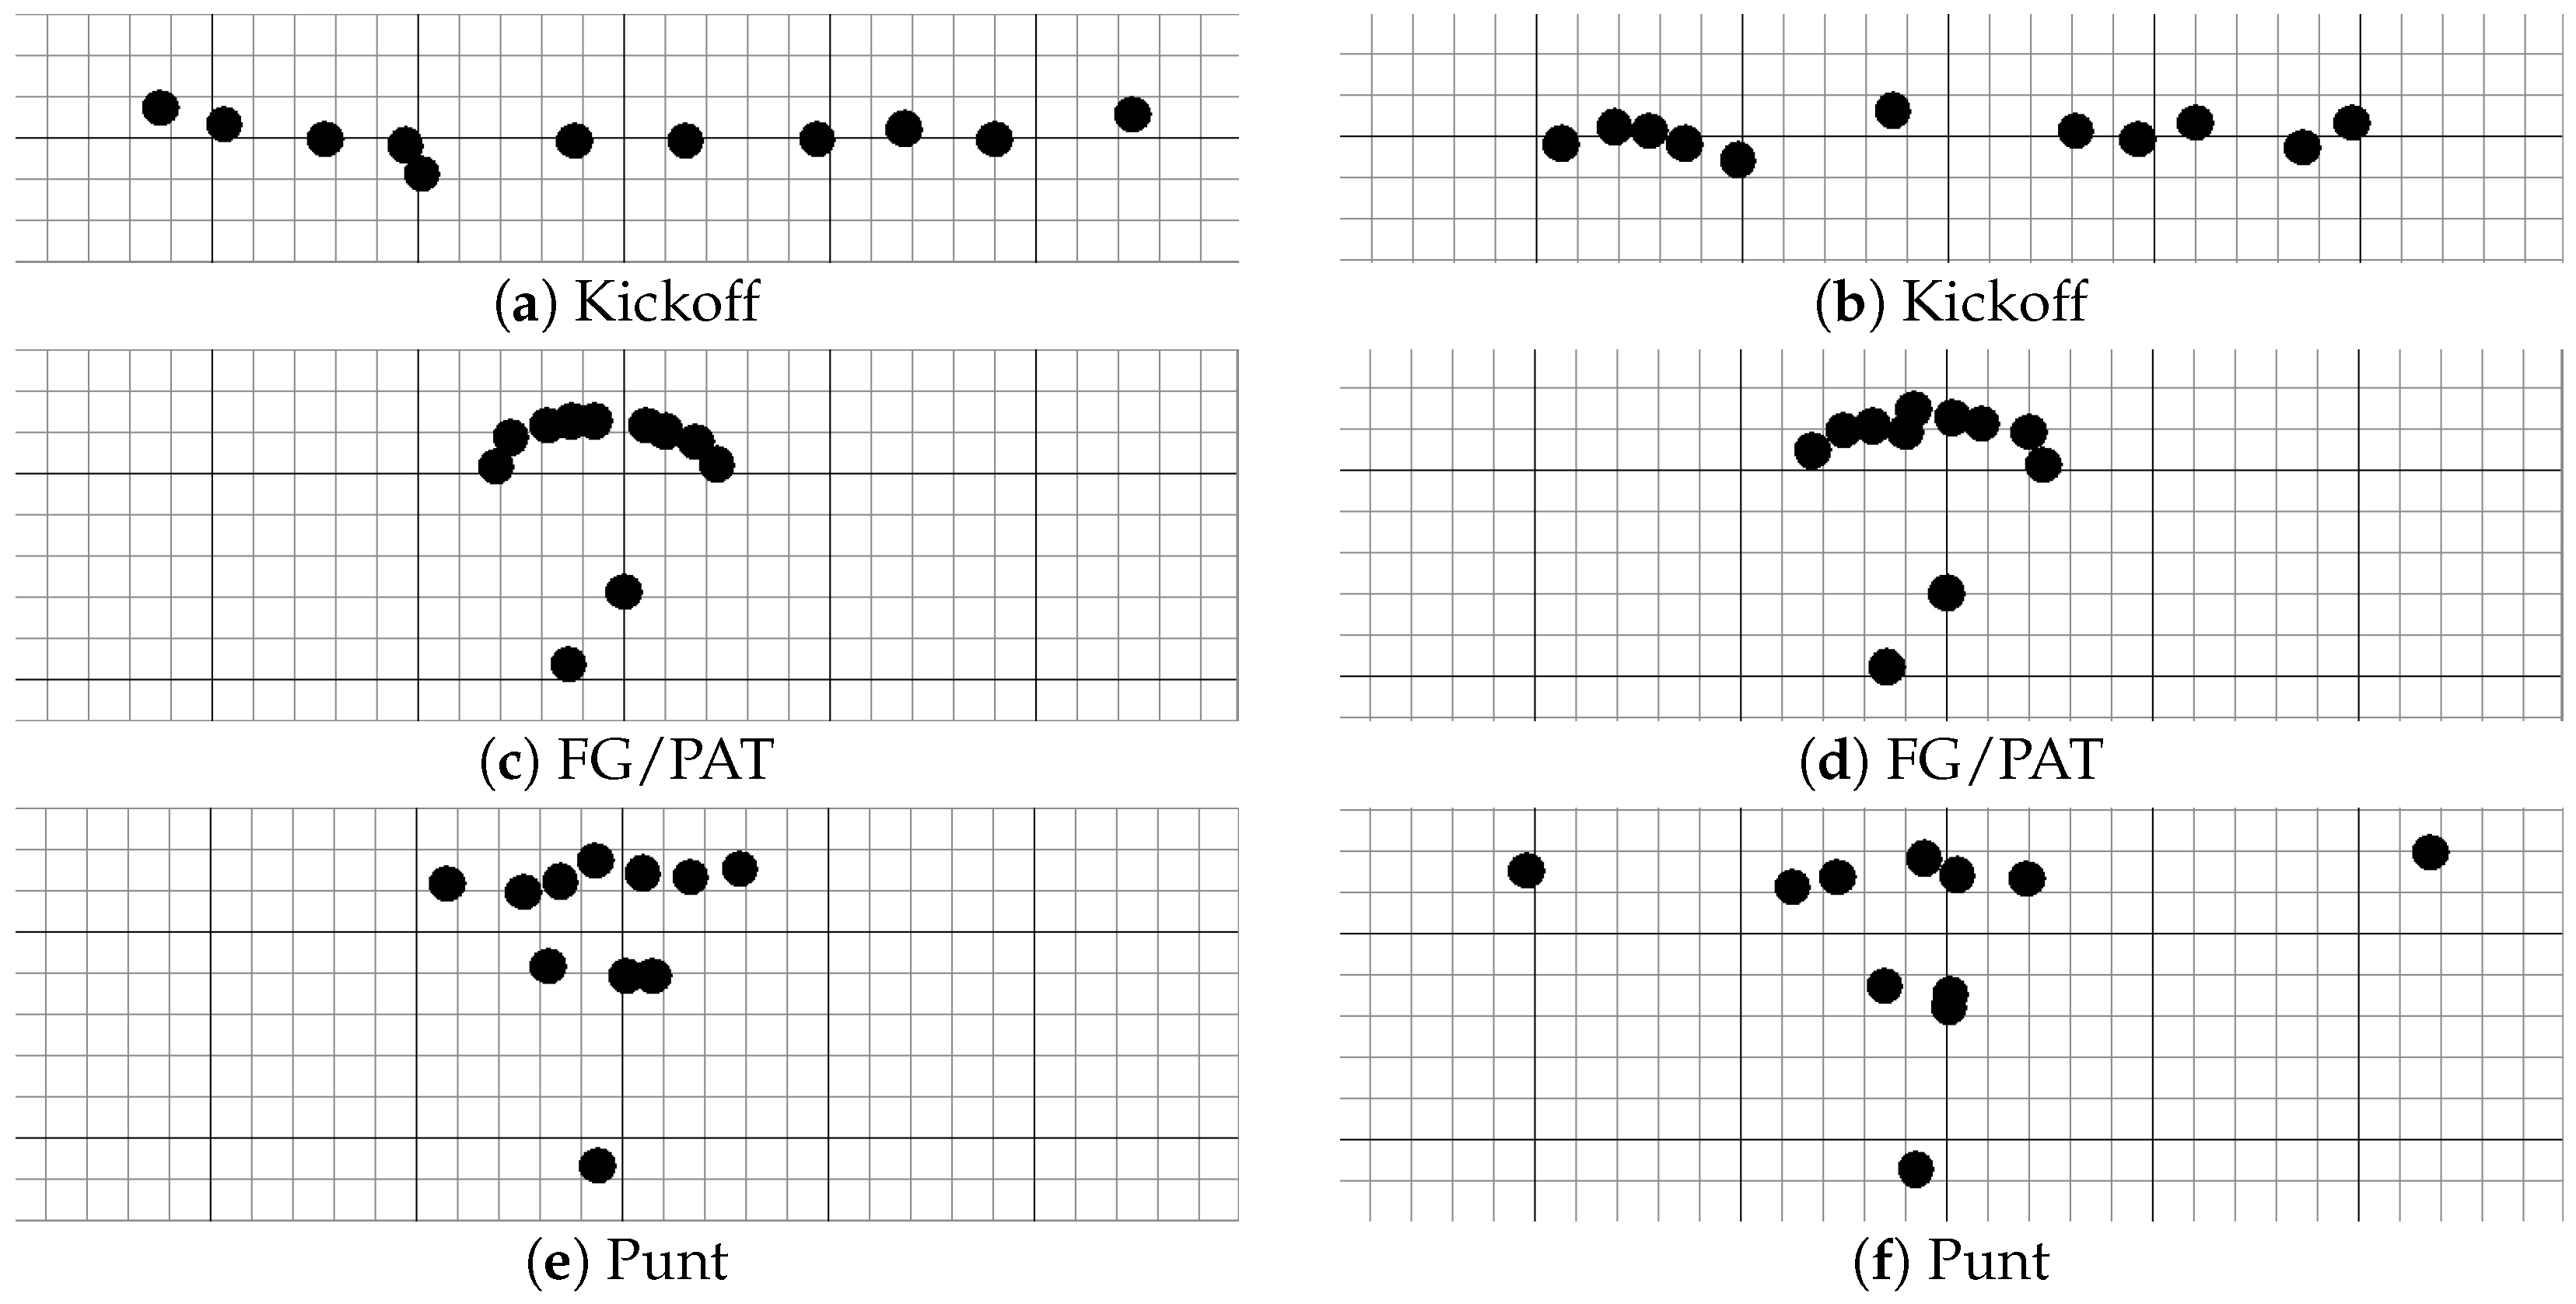
- Kickoff: The 11 players spread out in a line that covers the width of the field. In kickoff play, the team kicking off must have at least four players on each side of the kicker, and no player can be more than five yards behind the restraining line (the line from which the ball is kicked).
- FG/PAT: A tight offensive line with one wing player on either side providing additional protection. The two remaining players are about 8–9 yards behind the offensive line with the holder placing the ball on the ground for the kicker.
- Punt: An offensive line with the punter placed about 15 yards behind. In front of the punter are normally three players ready to block any rushers that get through the offensive line. The remaining two players can either act as tight ends near the offensive line or wide receivers near the sidelines.
3.2. Data and Augmentation for Experiments
- Experiment 1 uses data from the Synthetic Dataset created by designating specific zones for different player positions and the augmentation is achieved by randomly placing players into those zones.
- Experiment 2 uses data from the Completed Dataset (the Original Dataset that was modified by manually inserting missing players) and the augmentation is achieved by adding slight variations to the player locations.
- Experiment 3 uses the same data as Experiment 2 except that up to two offensive linemen are randomly removed in order to replicate the inaccuracies in the player detection algorithm due to camera angle variations and occlusion issues.
3.2.1. Synthetic Data and Augmentation for Experiment 1
3.2.2. Data without Missing Players for Experiment 2
3.2.3. Data with Missing Players for Experiment 3
4. Methodology
4.1. Data Preprocessing
4.2. Models
4.3. Data Postprocessing
5. Experimental Evaluation
5.1. Experiment Using the Synthetic Data
5.2. Experiment Using Data without Missing Players
5.3. Experiment Using Data with Missing Players
5.4. Discussion of Model Performance
6. Conclusions
Author Contributions
Funding
Data Availability Statement
Conflicts of Interest
References
- Herberger, T.A.; Litke, C. The Impact of Big Data and Sports Analytics on Professional Football: A Systematic Literature Review. In Digitalization, Digital Transformation and Sustainability in the Global Economy; Herberger, T.A., Dötsch, J.J., Eds.; Springer Proceedings in Business and Economics; Springer: Cham, Switzerland, 2021; pp. 189–207. [Google Scholar] [CrossRef]
- Passfield, L.; Hopker, J.G. A Mine of Information: Can Sports Analytics Provide Wisdom from Your Data? Int. J. Sport. Physiol. Perform. 2017, 12, 851–855. [Google Scholar] [CrossRef] [PubMed]
- Davis, J.; Bransen, L.; Devos, L.; Jaspers, A.; Meert, W.; Robberechts, P.; Haaren, J.V.; Van Roy, M. Methodology and evaluation in sports analytics: Challenges, approaches, and lessons learned. Mach. Learn. 2024, 113, 1–34. [Google Scholar] [CrossRef]
- Zeng, Z.; Pan, B. A Machine Learning Model to Predict Player’s Positions Based on Performance. In Proceedings of the 9th International Conference on Sport Sciences Research and Technology Support, Setúbal, Portugal, 28–29 October 2021; pp. 36–42. [Google Scholar]
- Oliver, J.L.; Ayala, F.; De Ste Croix, M.B.A.; Lloyd, R.S.; Myer, G.D.; Read, P.J. Using Machine Learning to Improve Our Understanding of Injury Risk and Prediction in Elite Male Youth Football Players. J. Sci. Med. Sport 2020, 23, 1044–1048. [Google Scholar] [CrossRef] [PubMed]
- Solberg, H.M.; Sarkhoosh, M.H.; Gautam, S.; Sabet, S.S.; Pål, H.; Midoglu, C. PLayerTV: Advanced Player Tracking and Identification for Automatic Soccer Highlight Clips. arXiv 2024, arXiv:2407.16076. Available online: https://arxiv.org/abs/2407.16076 (accessed on 9 September 2024).
- Christina Markopoulou, G.P.; Tjortjis, C. Diverse Machine Learning for Forecasting Goal-Scoring Likelihood in Elite Football Leagues. Electronics 2024, 6, 1762–1781. [Google Scholar]
- Zhang, Q.; Wang, Z.; Long, C.; Yiu, S.M. Billiards Sports Analytics: Datasets and Tasks. arXiv 2024, arXiv:2407.19686. [Google Scholar] [CrossRef]
- Papageorgiou, G.; Sarlis, V.; Tjortjis, C. Evaluating the Effectiveness of Machine Learning Models for Performance Forecasting in Basketball: A Comparative Study. Knowl. Inf. Syst. 2024, 66, 4333–4375. [Google Scholar] [CrossRef]
- Lu, W.L.; Ting, J.A.; Little, J.J.; Murphy, K.P. Learning to track and identify players from broadcast sports videos. IEEE Trans. Pattern Anal. Mach. Intell. 2013, 35, 1704–1716. [Google Scholar] [PubMed]
- Tjondronegoro, D.W.; Chen, Y.P.P. Knowledge-Discounted Event Detection in Sports Video. IEEE Trans. Syst. Man Cybern.-Part A Syst. Humans 2010, 40, 1009–1024. [Google Scholar] [CrossRef]
- Jones, J.M. Football Retains Dominant Position as Favorite U.S. Sport. Gallup. 2024. Available online: https://news.gallup.com/poll/4735/sports.aspx (accessed on 8 August 2024).
- Gramlich, J. Football Retains Dominant Position as Favorite U.S. Sport. Gallup. 2024. Available online: https://news.gallup.com/poll/610046/football-retains-dominant-position-favorite-sport.aspx (accessed on 8 August 2024).
- Ayanegui-Santiago, H. Recognizing team formations in multiagent systems: Applications in robotic soccer. In Lecture Notes in Computer Science; Springer: Berlin/Heidelberg, Germany, 2009; Volume 5796, pp. 163–173. [Google Scholar]
- Visser, U.; Drücker, C.; Hübner, S.; Schmidt, E.; Weland, H.G. Recognizing formations in opponent teams. In Lecture Notes in Computer Science; Springer: Berlin/Heidelberg, Germany, 2001. [Google Scholar]
- Newman, J.; Sumsion, A.; Torrie, S.; Lee, D.J. Automated Pre-Play Analysis of American Football Formations Using Deep Learning. Electronics 2023, 12, 726. [Google Scholar] [CrossRef]
- Wright, K.; Torrie, S.; Orr, B.; Lee, D.J. Video Preprocessing for American Football Formation Recognition. In Proceedings of the 2024 Intermountain Engineering, Technology and Computing (IETC), Logan, UT, USA, 13–14 May 2024; pp. 102–107. [Google Scholar] [CrossRef]
- Newman, J.; Lin, J.W.; Lee, D.J.; Liu, J.J. Automatic annotation of American Football Video footage for game strategy analysis. Electron. Imaging 2021, 33, 1–7. [Google Scholar] [CrossRef]
- Teklenburg, L.P. AI-Based Classification of American Football Plays Combining Computer Vision and Historical Play-by-Play Data. Ph.D. Thesis, Technische Hochschule Ingolstadt, Ingolstadt, Germany, 2024. [Google Scholar]
- Atmosukarto, B.; Ghanem, S.A.K.M.; Ahuja, N. Automatic Recognition of Offensive Team Formation in American Football Plays. In Proceedings of the 2013 IEEE Conference on Computer Vision and Pattern Recognition Workshops, Portland, OR, USA, 23–28 June 2013; pp. 991–998. [Google Scholar]
- Shorten, C.; Khoshgoftaar, T.M. A survey on Image Data Augmentation for Deep Learning. J. Big Data 2019, 6, 60. [Google Scholar] [CrossRef]
- Sengupta, P.; Mehta, A.; Rana, P.S. Enhancing Performance of Deep Learning Models with a Novel Data Augmentation Approach. In Proceedings of the 2023 14th International Conference on Computing Communication and Networking Technologies (ICCCNT), Delhi, India, 6–8 July 2023; pp. 1–7. [Google Scholar] [CrossRef]
- Wang, Z.; Wang, P.; Liu, K.; Wang, P.; Fu, Y.; Lu, C.T.; Aggarwal, C.C.; Pei, J.; Zhou, Y. A Comprehensive Survey on Data Augmentation. arXiv 2024, arXiv:2405.09591. [Google Scholar] [CrossRef]
- Xu, M.; Yoon, S.; Fuentes, A.; Sun, D. A Comprehensive Survey of Image Augmentation Techniques for Deep Learning. Pattern Recognitio 2023, 137, 1–12. [Google Scholar] [CrossRef]
- Bravin, R.; Nanni, L.; Loreggia, A.; Brahnam, S.; Paci, M. Varied Image Data Augmentation Methods for Building Ensemble. IEEE Access 2023, 11, 8810–8823. [Google Scholar] [CrossRef]


| Test | Training Data | Test Data | Play | Position |
|---|---|---|---|---|
| 1 | 20,000 Synthetic Data | 100% Original Data | No | Yes |
| 2 | 75% Augmented Completed Data | 25% Completed Data | Yes | Yes |
| 3 | 75% Augmented Completed Data | 25% Original Data | Yes | Yes |
| Player Position | Recognition Accuracy |
|---|---|
| Missing | 99.86% |
| Offensive Lineman | 84.33% |
| Quarterback/Running Back | 95.71% |
| Tight End | 25.15% |
| Left Wide Receiver | 79.76% |
| Right Wide Receiver | 68.53% |
| Play Type | Recognition Accuracy |
|---|---|
| Offensive Play | 98.42% |
| Kickoff | 98.80% |
| FG/PAT | 100.00% |
| Punt | 98.31% |
| Position | Recognition Accuracy |
|---|---|
| Missing | 81.82% |
| Offensive Linemen | 98.92% |
| Quarterback/Running Back | 94.33% |
| Tight End | 0.38% |
| Left Wide Receiver | 95.55% |
| Right Wide Receiver | 94.68% |
| Play Type | Recognition Accuracy |
|---|---|
| Offensive Play | 98.88% |
| Kickoff | 60.71% |
| FG/PAT | 100.00% |
| Punt | 88.71% |
| Player Position | Recognition Accuracy |
|---|---|
| Missing | 96.94% |
| Offensive Linemen | 98.33% |
| Quarterback/Running Back | 94.25% |
| Tight End | 2.38% |
| Left Wide Receiver | 93.00% |
| Right Wide Receiver | 91.64% |
Disclaimer/Publisher’s Note: The statements, opinions and data contained in all publications are solely those of the individual author(s) and contributor(s) and not of MDPI and/or the editor(s). MDPI and/or the editor(s) disclaim responsibility for any injury to people or property resulting from any ideas, methods, instructions or products referred to in the content. |
© 2024 by the authors. Licensee MDPI, Basel, Switzerland. This article is an open access article distributed under the terms and conditions of the Creative Commons Attribution (CC BY) license (https://creativecommons.org/licenses/by/4.0/).
Share and Cite
Hong, A.; Orr, B.; Pan, E.; Lee, D.-J. American Football Play Type and Player Position Recognition. Electronics 2024, 13, 3628. https://doi.org/10.3390/electronics13183628
Hong A, Orr B, Pan E, Lee D-J. American Football Play Type and Player Position Recognition. Electronics. 2024; 13(18):3628. https://doi.org/10.3390/electronics13183628
Chicago/Turabian StyleHong, Audrey, Benjamin Orr, Ephraim Pan, and Dah-Jye Lee. 2024. "American Football Play Type and Player Position Recognition" Electronics 13, no. 18: 3628. https://doi.org/10.3390/electronics13183628
APA StyleHong, A., Orr, B., Pan, E., & Lee, D.-J. (2024). American Football Play Type and Player Position Recognition. Electronics, 13(18), 3628. https://doi.org/10.3390/electronics13183628