Article

Comprehensive Data Augmentation Approach Using WGAN-GP and UMAP for Enhancing Alzheimer’s Disease Diagnosis

Graduate School of Information Science and Technology, Tohoku University, Sendai 980-8579, Japan
*
Authors to whom correspondence should be addressed.
Electronics 2024, 13(18), 3671; https://doi.org/10.3390/electronics13183671
Submission received: 24 August 2024 / Revised: 9 September 2024 / Accepted: 14 September 2024 / Published: 16 September 2024

Abstract

:
In this study, the Wasserstein Generative Adversarial Network with Gradient Penalty (WGAN-GP) was used to improve the diagnosis of Alzheimer’s disease using medical imaging and the Alzheimer’s disease image dataset across four diagnostic classes. The WGAN-GP was employed for data augmentation. The original dataset, the augmented dataset and the combined data were mapped using Uniform Manifold Approximation and Projection (UMAP) in both a 2D and 3D space. The same combined interaction network analysis was then performed on the test data. The results showed that, for the test accuracy, the score was 30.46% for the original dataset (unbalanced), whereas for the WGAN-GP augmented dataset (balanced), it improved to 56.84%, indicating that the WGAN-GP augmentation can effectively address the unbalanced problem.

1. Introduction

Alzheimer’s disease (AD) is a progressive, neurodegenerative disorder that is particularly common in the elderly, and its diagnosis remains a major challenge [1,2,3,4,5,6]. While early and accurate diagnosis is essential for treatment and care planning, the medical imaging data used to diagnose AD often face the problem of diagnostic class imbalance. This imbalance is caused by a markedly different ratio of normal to abnormal samples in the dataset and is known to adversely affect the performance of machine learning models [7]. In particular, disease samples belonging to minority diagnostic classes may not be adequately trained, leading to reduced diagnostic accuracy. To solve this imbalance problem and improve the accuracy of AD diagnosis, we propose a data augmentation method using the Wasserstein Generative Adversarial Network with Gradient Penalty (WGAN-GP). WGAN-GP is a data augmentation method that has more stable learning than conventional GANs and can provide high-quality generated data, which can be applied in the field of medical imaging.
MRI morphometry has long been used to analyze the brain structure in patients with AD. Studies like that of Matsuda [8] have highlighted the importance of brain atrophy measurements, especially in the hippocampus, which is one of the earliest affected regions in AD. Such morphometric analysis is essential in staging the disease and tracking its progression. However, there are limitations in conventional imaging analysis, particularly when faced with variability in imaging data quality and segmentation techniques. For instance, Tubi et al. [9] have demonstrated the influence of segmentation algorithms on the accuracy of white matter hyperintensity (WMH) analysis, a crucial biomarker for cognitive decline associated with AD. Variability in data preprocessing can significantly impact the diagnostic outcomes, particularly when deep learning models are applied. To address these challenges, researchers have explored various advanced machine learning methods. So et al. [10] proposed a deep learning approach using texture features from MRI scans, focusing on hippocampal changes. This research has shown promise in automating the diagnosis process by leveraging imaging features that are often overlooked in traditional visual assessments. Similarly, Kamal et al. [11] employed machine learning frameworks to analyze brain MRI scans, with the aim of enhancing the detection of AD. However, the major issue remains that these models can suffer from data imbalance, as disease samples (especially at early stages) are underrepresented in datasets. This imbalance leads to less accurate models, as the underrepresented minority diagnostic class is not adequately trained. Several studies have proposed data augmentation methods to overcome these limitations. For example, Bhateja et al. [12] introduced a multispectral image fusion technique to enhance the quality of medical imaging data. The combination of multiple imaging modalities, such as MRI and PET, has proven to be a valuable approach for improving diagnostic accuracy [13]. Nevertheless, data augmentation using traditional techniques is often insufficient to fully solve the problem of imbalance. Generative adversarial networks (GANs) have emerged as a powerful tool for generating synthetic data to augment existing datasets.
In recent years, the development of the Wasserstein Generative Adversarial Network with Gradient Penalty (WGAN-GP) has shown potential in generating high-quality synthetic medical imaging data. The WGAN-GP has been specifically designed to stabilize the learning process of GANs and can produce realistic, high-resolution images, making it particularly suitable for medical imaging applications [14]. By integrating the WGAN-GP with neuroimaging data, the imbalance problem in AD diagnosis can be mitigated, allowing for more robust training of machine learning models. For instance, Sajjad et al. [15] utilized a deep convolutional generative adversarial network (DCGAN) for synthetic data augmentation in PET imaging for AD classification, demonstrating significant improvements in diagnostic performance. Similarly, other studies have applied advanced generative techniques to augment MRI data and enhance the training of machine learning models in AD research [16,17,18,19,20]. It is also being applied to algorithms for early detection [20,21] and to research into disease screening methods in combination with other signals such as Electroencephalograms (EEGs) [22,23].
In this paper, a combined dataset of generated and original data was mapped into a 2D and 3D space using Uniform Manifold Approximation and Projection (UMAP) for visual analysis.

2. Methods

2.1. Dataset

The Alzheimer’s MRI dataset utilized in this study was sourced from Kaggle (https://www.kaggle.com/datasets/lukechugh/best-alzheimer-mri-dataset-99-accuracy/data accessed on 13 September 2024). This dataset comprises a collection of MRI images categorized into four distinct diagnostic classes relevant to Alzheimer’s disease diagnosis: Non-Demented, Very Mildly Demented, Mildly Demented and Moderately Demented. The original dataset presented an imbalance among the diagnostic classes, which could negatively impact the accuracy of classification models. Each category included 100, 70, 28 and 2 patients, respectively, and each patient’s brain was scanned on a 32-slice horizontal-axis MRI. MRI images were acquired using a 1.5 Tesla MRI scanner in a T1-weighted sequence. The images have a resolution of 128 × 128 pixels and are in “.jpg” format. All images were preprocessed to remove the skull.

2.2. Data Augmentation Using WGAN-GP

To address the issue of diagnostic class imbalance, we employed the Wasserstein Generative Adversarial Network with Gradient Penalty (WGAN-GP). The WGAN-GP is a variant of GANs designed to generate high-quality synthetic data while maintaining stability during training. The model was trained on the original MRI images to generate synthetic samples for the underrepresented diagnostic classes. These synthetic data were then combined with the original dataset to create a balanced augmented dataset. The WGAN-GP was implemented using Python and the TensorFlow library, with specific hyperparameters tuned to optimize the quality of generated images.
To perform this process, we first defined the paths and labels of the dataset to be used for Alzheimer’s disease diagnosis. The dataset contains both the original actual images and the images generated by WGAN-GP. Labels were set to distinguish between the actual data and the generated data. Next, feature extraction was performed. As image loading and preprocessing, images in the dataset were loaded and converted to grayscale. After conversion, the images were changed to the ubyte format for easy handling by the algorithm. The GLCM (Gray Level Co-occurrence Matrix) was then computed. The GLCM was computed for the grayscale images, and contrast and correlation were extracted as texture features. For each image in the original dataset, the aforementioned feature extraction was performed. The features were labeled as “non-GAN” (real data). Features were extracted for the combined dataset of the original dataset and the dataset generated by the GAN in the same way; the data generated by the GAN were labeled as “generated by GAN (generated data)”. The extracted features for all images were compiled into a list, which was converted into a NumPy array and scaled using StandardScaler to normalize the extracted features. This homogenizes the value range of the features and improves the performance of subsequent dimensionality reduction methods. After dimensionality reduction was performed on the scaled data using PCA and t-SNE, scatter plots of the original dataset, the GAN-generated dataset and the combined dataset were plotted using 2D and 3D dimensionality reduction with UMAP. This compares the differences in the visual distribution of each dataset. Finally, the scaled feature data were output and saved in a format that can be used for the next processing steps and algorithms (Figure 1).
Learning in WGAN-GP is characterized by the fact that it does not use the format commonly used in identification, in which the correct answer label is paired with the expected result [24,25], but rather defines its own loss function, rather than using an already defined function such as binary_cross_entropy. The procedure for defining a unique loss function and passing it to the optimizer for training is as follows: (1) create a model, (2) define the loss function, (3) instantiate the optimizer, specify the weights to be trained in the updates method, and (4) create the input, output and instantiated. The code for WGAN-GP is available as an open source resource (keras-contrib/examples/improved_wgan.py accessed on 13 September 2024) and has recently been applied in the field of medical image processing [26,27].

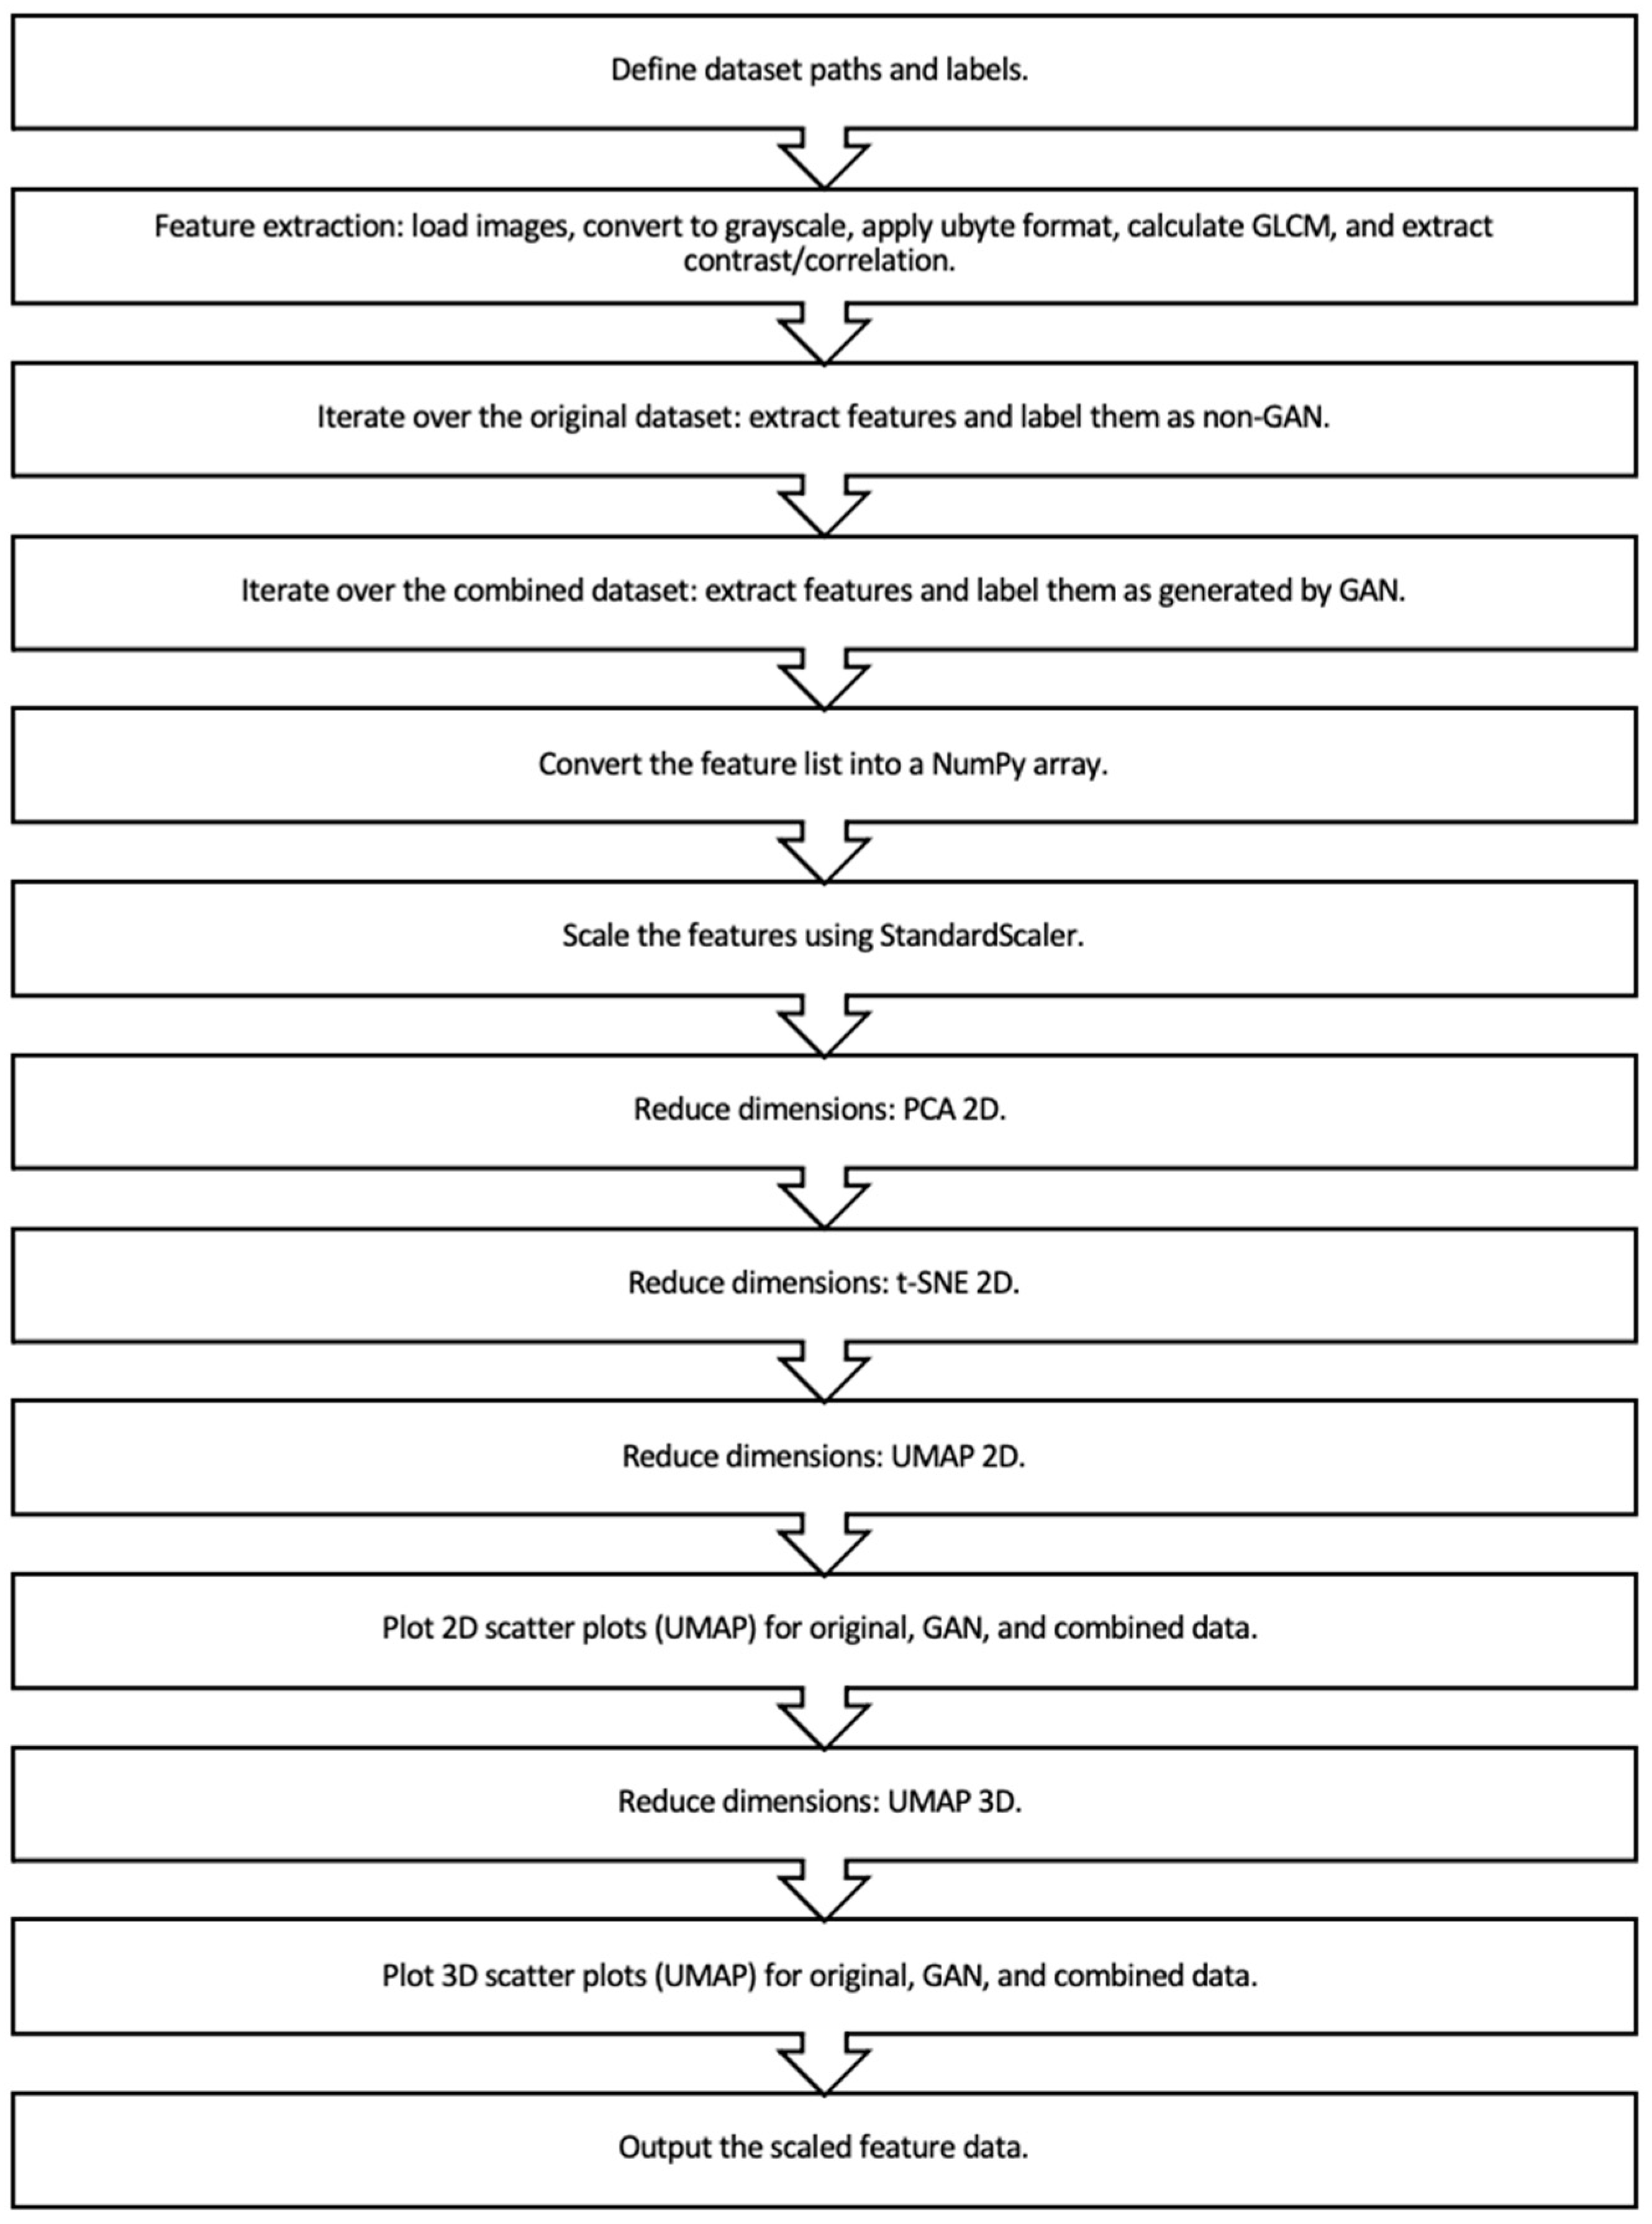
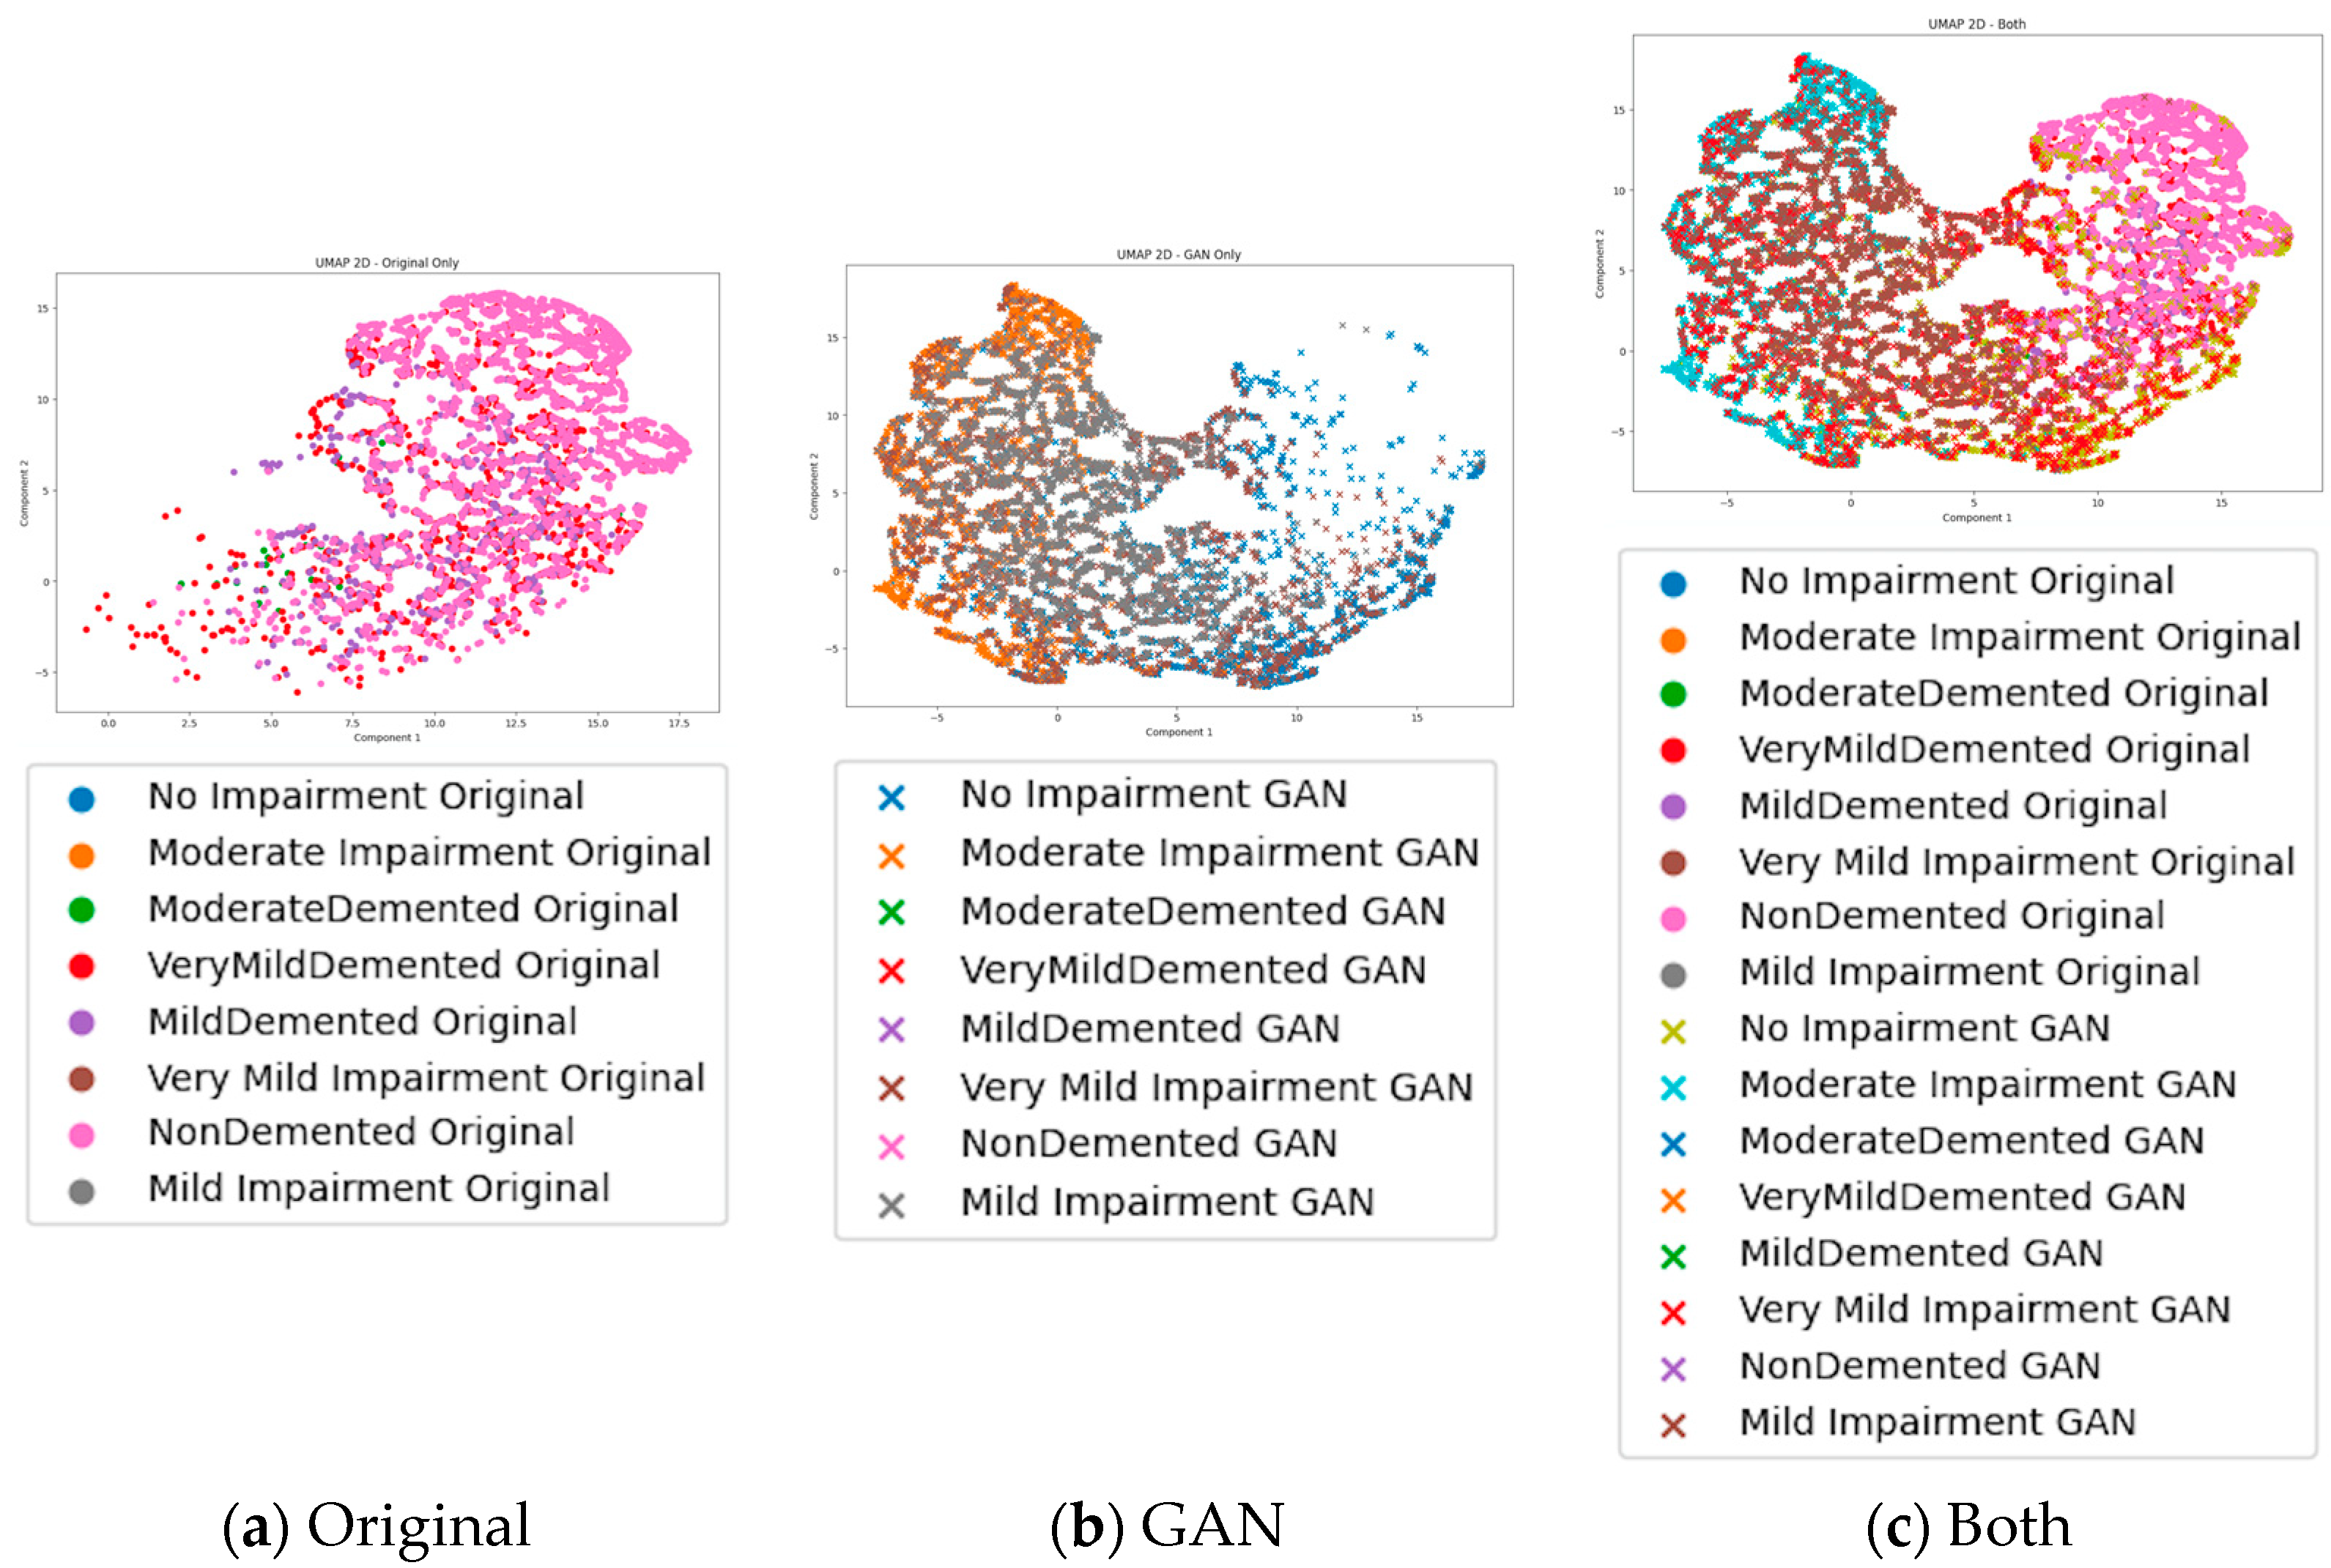
2.3. Dimensionality Reduction and Visualization with UMAP

After data augmentation, we applied Uniform Manifold Approximation and Projection (UMAP) for dimensionality reduction and visualization. UMAP is a non-linear dimensionality reduction technique that preserves the global structure of high-dimensional data when projected into lower-dimensional spaces. We used UMAP to project both the original and augmented datasets into 2D and 3D spaces. This mapping allowed us to visually assess the distribution and separability of the different diagnostic classes in both the original and augmented datasets.

2.4. Classification and Evaluation

To evaluate the effectiveness of WGAN-GP augmentation, we employed a classification model based on a Random Forest classifier, which was chosen for its ability to handle imbalanced datasets. The model was trained using both the original (unbalanced) dataset and the WGAN-GP augmented (balanced) dataset. We utilized supervised learning with cross-validation to ensure the robustness of the model, splitting the data into training and validation sets. Data preprocessing was a critical step before training the model. Two different preprocessing pipelines were compared: (1) standard scaling, where features were normalized to have zero mean and unit variance, and (2) min–max scaling, which rescaled features to a [0, 1] range. The classification model was trained on the datasets prepared using both methods, and their impact on model performance was evaluated. The model’s performance was tested on a separate test set, where accuracy, precision, recall, and F1-scores were computed for both the original and augmented datasets. Additionally, we used 2D UMAP projections to visualize the diagnostic class separability and assess classification accuracy across different diagnostic class distributions. The improvement in classification metrics from the original to the augmented dataset was used as a key indicator of the success of the augmentation process.
The performance before and after data enhancement was objectively evaluated using the Learned Perceptual Image Patch Similarity (LPIPS) metric with a trained network. Deep learning is a machine learning technique that has attracted attention for its extremely high accuracy in image classification tasks. LPIPS, a typical measure of distance between images, is calculated based on the deep features output by the convolutional layer of a trained image classification network, such as AlexNet or VGG, for an input image [28]. LPIPS, which uses feature extraction based on deep learning, has been shown to be more accurate than conventional methods that focus only on pixel brightness and contrast. In recent years, LPIPS has shown high versatility in quantifying the color patterns of living organisms [29,30,31] and has become popular for various comparative analyses because it can be equally accurate with a single simple and objective criterion based on deep learning.

2.5. Software and Tools

The entire process, from data augmentation to dimensionality reduction and classification, was implemented using Python. Key libraries included TensorFlow for the WGAN-GP implementation, UMAP-learn for dimensionality reduction and Scikit-learn for classification and evaluation.

3. Results

The results of the 2D UMAP and 3D UMAP analyses are shown in Figure 2 and Figure 3. The classification heatmaps are shown in Figure 4. 2D and 3D UMAP analysis results show that the UMAP projection improves diagnostic class separation and clustering in the augmented and combined datasets compared to the original datasets, reflecting the benefits of data augmentation by the WGAN-GP. The results reflect that, in particular, the improved separation in 3D space further supports the utility of the WGAN-GP to address diagnostic class imbalances and improve diagnostic accuracy. The classification accuracy of the original unbalanced dataset was 30.46%, whereas the classification accuracy of the diseases after applying the WGAN-GP for data augmentation was 56.84%, a significant improvement. The performance before and after data augmentation was evaluated using LPIPS, with an average LPIPS score of (0, 0.205).

4. Discussion

There are some studies on disease visualization by machine learning for patients with chronic kidney disease and on screening for obesity [32,33]. However, there are few examples of studies on Alzheimer’s classification, and only a few studies on brain circuitry in health and disease from linear and non-linear approaches using PCA, multidimensional scaling (MDS), iso-mapping, local linear embedding (LLE), Laplacian eigenmaps (LEM), t-SNE neural manifolds of dynamics [34] and proposing a framework for removing confounding effects from distance-based dimensionality reduction methods [35]. In this work, we have already shown that similarity- and graph structure-preserving dimensionality reduction tools such as t-SNE and UMAP can capture complex biological patterns in high-dimensional data. We use the WGAN-GP for the purpose of enhancing pathological diagnosis, which is novel in this respect.
Overall, the results confirm that the WGAN-GP augmentation leads to significant improvements in the classification performance of Alzheimer’s disease diagnosis models. The increased accuracy from 30.46% to 56.84% in the 2D UMAP analysis demonstrates the potential of this approach to mitigate the issues associated with unbalanced datasets and to enhance the reliability of medical imaging diagnoses. WGAN-GP successfully addressed the problem of diagnostic class imbalance within the Alzheimer’s disease image dataset and, when combined with the UMAP technique, significantly improved diagnostic accuracy. The most significant improvement was observed in 2D UMAP mapping, and this significant improvement highlights the importance of data enhancement in medical imaging, especially when dealing with diagnostic class imbalances that are common in real-world datasets. The effectiveness of WGAN-GP in generating high-quality synthetic data may have contributed to enhanced discrimination of Alzheimer’s disease among the four diagnostic classes, as observed in the UMAP visualization. The expanded dataset provided a more balanced representation of the diagnostic classes and allowed the model to better capture underlying patterns in the data. In addition, the dimensionality reduction provided by UMAP played an important role in visualizing the structure of the dataset in both the2D and 3D space; the combination of the WGAN-GP and UMAP not only improved diagnostic accuracy, but also allowed for a clearer understanding of the complex relationships among the different diagnostic classes in the dataset. The results of this study were as follows. This approach may be particularly useful when exploring other medical imaging datasets that suffer from similar problems of diagnostic class imbalance and high dimensionality. The method has the potential for broader application in medical imaging and other domains where data imbalance and high dimensionality are important issues.
However, while the results are promising, further research is needed to improve the augmentation process and to assess its generality across different datasets and diagnostic tasks. In addition, integrating the WGAN-GP with other data augmentation techniques to further increase the robustness of the model is a future challenge. Some limitations of this work are that only UMAP is used for visualization and not t-SNE, a method that preserves both global and local structures well. t-SNE has execution time issues, and there have been proposals, e.g., LargeVis [36,37,38], to solve them, but the execution time increases exponentially as the embedding dimension increases. UMAP is adopted in this study because its execution time is almost constant regardless of the number of embedded dimensions, but studies comparing it with t-SNE have been increasing in recent years [39,40,41], and this is a future issue. Furthermore, the role of genetic factors in the development of Alzheimer’s disease as well as other neurodegenerative diseases such as Parkinson’s disease will need to be examined in the future. Half of Parkinson’s patients develop dementia, and many studies suggest that Alzheimer’s disease is hereditary (e.g., a small proportion of all Alzheimer’s disease is familial, and in familial Alzheimer’s disease, if one of the parents has a genetic mutation, the odds of the child developing the disease are high) [42,43,44,45,46,47,48,49,50,51]. Applications for early screening for Parkinson’s disease would be medically useful. Incorporating state-of-the-art image enhancement methods and applications related to restoration to eliminate the negative effects of noise, such as single image norm normalization [52] and multiobjective haze removal methods [53], is a concurrent challenge.

5. Conclusions

In this study, we presented a comprehensive data augmentation approach using the Wasserstein Generative Adversarial Network with Gradient Penalty (WGAN-GP) combined with Uniform Manifold Approximation and Projection (UMAP) to enhance the diagnostic accuracy of Alzheimer’s disease (AD) through medical imaging. The main challenge addressed in this research was the inherent diagnostic class imbalance in the Alzheimer’s disease dataset, which significantly affects the performance of machine learning models in medical diagnosis.
Our results demonstrated that the WGAN-GP is an effective method for generating high-quality synthetic data, which, when combined with the original data, helps to mitigate the diagnostic class imbalance problem. Specifically, the use of WGAN-GP to augment the dataset led to a significant improvement in test accuracy, increasing from 30.46% with the original unbalanced dataset to 56.84% with the augmented dataset. This indicates that the synthetic data generated by WGAN-GP not only increased the quantity of data but also preserved critical features necessary for accurate diagnosis.

Author Contributions

D.H.; conceptualization, methodology, research and drafting; T.A., I.K. and Y.Y.; visualization, editing, supervision and project management. E.Y.; conceptualization, methodology, writing, reviewing, editing, supervision and obtaining funding. All authors have read and agreed to the published version of the manuscript.

Funding

This research was funded by New Energy and Industrial Technology Development Organization (NEDO), public–private support project for discovering young researchers (E.Y.).

Data Availability Statement

The Alzheimer’s MRI dataset utilized in this study was sourced from Kaggle (https://www.kaggle.com/datasets/lukechugh/best-alzheimer-mri-dataset-99-accuracy/data, accessed on 13 September 2024). This dataset comprises a collection of MRI images categorized across multiple classes relevant to Alzheimer’s disease diagnosis.

Acknowledgments

The authors wish to acknowledge Junichiro Hayano, Nagoya City University of medical sciences for his help in interpreting the significance of the results of this study.

Conflicts of Interest

The authors declare no conflicts of interest.

References

  1. Scheltens, P.; De Strooper, B.; Kivipelto, M.; Holstege, H.; Chételat, G.; Teunissen, C.E.; Cummings, J.; van der Flier, W.M. Alzheimer’s disease. Lancet 2021, 397, 1577–1590. [Google Scholar] [CrossRef] [PubMed]
  2. Lane, C.A.; Hardy, J.; Schott, J.M. Alzheimer’s disease. J. Neurol. 2018, 25, 59–70. [Google Scholar] [CrossRef] [PubMed]
  3. Bondi, M.W.; Edmonds, E.C.; Salmon, D.P. Alzheimer’s Disease: Past, Present, and Future. J. Int. Neuropsychol. Soc. 2017, 23, 818–831. [Google Scholar] [CrossRef] [PubMed]
  4. Graff-Radford, J.; Yong, K.X.X.; Apostolova, L.G.; Bouwman, F.H.; Carrillo, M.; Dickerson, B.C.; Rabinovici, G.D.; Schott, J.M.; Jones, D.T.; Murray, M.E. New insights into atypical Alzheimer’s disease in the era of biomarkers. Lancet Neurol. 2021, 20, 222–234. [Google Scholar] [CrossRef] [PubMed]
  5. Mantzavinos, V.; Alexiou, A. Biomarkers for Alzheimer’s Disease Diagnosis. Curr. Alzheimer Res. 2017, 14, 1149–1154. [Google Scholar] [CrossRef] [PubMed]
  6. Horvath, A.; Szucs, A.; Csukly, G.; Sakovics, A.; Stefanics, G.; Kamondi, A. EEG and ERP biomarkers of Alzheimer’s disease: A critical review. Front. Biosci. 2018, 23, 183–220. [Google Scholar] [CrossRef] [PubMed]
  7. Chugh, L. Addressing Data Scarcity and Class Imbalance in Alzheimer’s Using WGANs-GP. Master’s Thesis, Northumbria University, Newcastle, UK, 2023; pp. 1–12. [Google Scholar]
  8. Matsuda, H. MRI Morphometry in Alzheimer’s Disease. Ageing Res. Rev. 2016, 30, 17–24. [Google Scholar] [CrossRef]
  9. Tubi, M.A.; Feingold, F.W.; Kothapalli, D.; Hare, E.T.; King, K.S.; Thompson, P.M.; Braskie, M.N.; Alzheimer’s Disease Neuroimaging Initiative. White Matter Hyperintensities and Their Relationship to Cognition: Effects of Segmentation Algorithm. Neuroimage 2020, 206, 116327. [Google Scholar] [CrossRef]
  10. So, J.H.; Madusanka, N.; Choi, H.K.; Choi, B.K.; Park, H.G. Deep Learning for Alzheimer’s Disease Classification Using Texture Features. Curr. Med. Imaging Rev. 2019, 15, 689–698. [Google Scholar] [CrossRef]
  11. Kamal, M.; Pratap, A.R.; Naved, M.; Zamani, A.S.; Nancy, P.; Ritonga, M.; Shukla, S.K.; Sammy, F. Machine Learning and Image Processing Enabled Evolutionary Framework for Brain MRI Analysis for Alzheimer’s Disease Detection. Comput. Intell. Neurosci. 2022, 2022, 5261942, Erratum in Comput. Intell. Neurosci. 2023, 2023, 9817176. [Google Scholar] [CrossRef]
  12. Bhateja, V.; Moin, A.; Srivastava, A.; Bao, L.N.; Lay-Ekuakille, A.; Le, D.N. Multispectral Medical Image Fusion in Contourlet Domain for Computer-Based Diagnosis of Alzheimer’s Disease. Rev. Sci. Instrum. 2016, 87, 074303. [Google Scholar] [CrossRef] [PubMed]
  13. Ohba, M.; Kobayashi, R.; Kirii, K.; Fujita, K.; Kanezawa, C.; Hayashi, H.; Kawakatsu, S.; Otani, K.; Kanoto, M.; Suzuki, K. Comparison of Alzheimer’s Disease Patients and Healthy Controls in the Easy Z-Score Imaging System with Differential Image Reconstruction Methods Using SPECT/CT: Verification Using Normal Database of Our Institution. Ann. Nucl. Med. 2021, 35, 307–313. [Google Scholar] [CrossRef] [PubMed]
  14. Alghamedy, F.H.; Shafiq, M.; Liu, L.; Yasin, A.; Khan, R.A.; Mohammed, H.S. Machine Learning-Based Multimodel Computing for Medical Imaging for Classification and Detection of Alzheimer Disease. Comput. Intell. Neurosci. 2022, 2022, 9211477. [Google Scholar] [CrossRef] [PubMed]
  15. Mirzaei, G.; Adeli, A.; Adeli, H. Imaging and Machine Learning Techniques for Diagnosis of Alzheimer’s Disease. Rev. Neurosci. 2016, 27, 857–870. [Google Scholar] [CrossRef] [PubMed]
  16. Jha, D.; Kim, J.I.; Kwon, G.R. Diagnosis of Alzheimer’s Disease Using Dual-Tree Complex Wavelet Transform, PCA, and Feed-Forward Neural Network. J. Healthc. Eng. 2017, 2017, 9060124. [Google Scholar] [CrossRef]
  17. Lorenzi, M.; Simpson, I.J.; Mendelson, A.F.; Vos, S.B.; Cardoso, M.J.; Modat, M.; Schott, J.M.; Ourselin, S. Multimodal Image Analysis in Alzheimer’s Disease via Statistical Modelling of Non-local Intensity Correlations. Sci. Rep. 2016, 6, 22161. [Google Scholar] [CrossRef]
  18. Klöppel, S.; Kotschi, M.; Peter, J.; Egger, K.; Hausner, L.; Frölich, L.; Förster, A.; Heimbach, B.; Normann, C.; Vach, W.; et al. Separating Symptomatic Alzheimer’s Disease from Depression Based on Structural MRI. J. Alzheimers Dis. 2018, 63, 353–363. [Google Scholar] [CrossRef]
  19. Sajjad, M.; Ramzan, F.; Khan, M.U.G.; Rehman, A.; Kolivand, M.; Fati, S.M.; Bahaj, S.A. Deep Convolutional Generative Adversarial Network for Alzheimer’s Disease Classification Using Positron Emission Tomography (PET) and Synthetic Data Augmentation. Microsc. Res. Tech. 2021, 84, 3023–3034. [Google Scholar] [CrossRef]
  20. Toshkhujaev, S.; Lee, K.H.; Choi, K.Y.; Lee, J.J.; Kwon, G.R.; Gupta, Y.; Lama, R.K. Classification of Alzheimer’s Disease and Mild Cognitive Impairment Based on Cortical and Subcortical Features from MRI T1 Brain Images Utilizing Four Different Types of Datasets. J. Healthc. Eng. 2020, 2020, 3743171. [Google Scholar] [CrossRef]
  21. Alberdi, A.; Aztiria, A.; Basarab, A. On the Early Diagnosis of Alzheimer’s Disease from Multimodal Signals: A Survey. Artif. Intell. Med. 2016, 71, 1–29. [Google Scholar] [CrossRef]
  22. Drzezga, A. Diagnosis of Alzheimer’s Disease with [18F]PET in Mild and Asymptomatic Stages. Behav. Neurol. 2009, 21, 101–115. [Google Scholar] [CrossRef] [PubMed]
  23. Hulbert, S.; Adeli, H. EEG/MEG- and Imaging-Based Diagnosis of Alzheimer’s Disease. Rev. Neurosci. 2013, 24, 563–576. [Google Scholar] [CrossRef] [PubMed]
  24. Zhu, F.; Wang, X.; Huang, C.; Alhammadi, A.; Chen, H.; Zhang, Z.; Yuen, C.; Debbah, M. Beamforming Inferring by Conditional WGAN-GP for Holographic Antenna Arrays. IEEE Commun. Lett. 2024, 28, 3402102. [Google Scholar] [CrossRef]
  25. Jalayer, M.; Jalayer, R.; Kaboli, A.; Orsenigo, C.; Vercellis, C. Automatic Visual Inspection of Rare Defects: A Framework Based on GP-WGAN and Enhanced Faster R-CNN. In Proceedings of the 2021 IEEE International Conference on Industry 4.0, Artificial Intelligence, and Communications Technology (IAICT), Bandung, Indonesia, 27–28 July 2021; p. 9532584. [Google Scholar] [CrossRef]
  26. Saadatinia, M.; Salimi-Badr, A. An Explainable Deep Learning-Based Method for Schizophrenia Diagnosis Using Generative Data-Augmentation. IEEE Access 2024, 12, 3428847. [Google Scholar] [CrossRef]
  27. Luleci, F.; Catbas, F.N.; Avci, O. Generative Adversarial Networks for Labeled Acceleration Data Augmentation for Structural Damage Detection. J. Civ. Struct. Health Monit. 2022, 12, 627–641. [Google Scholar] [CrossRef]
  28. Zhang, R.; Isola, R.; Efros, A.A.; Shechtman, E.; Wang, O. The Unreasonable Effectiveness of Deep Features as a Perceptual Metric. In Proceedings of the IEEE Conference on Computer Vision and Pattern Recognition, Salt Lake City, UT, USA, 18–23 June 2018; pp. 586–595. [Google Scholar]
  29. Wham, D.C.; Ezray, B.; Hines, H.M. Measuring Perceptual Distance of Organismal Color Pattern Using the Features of Deep Neural Networks. bioRxiv 2019, 736306. Available online: https://www.biorxiv.org/content/10.1101/736306v1.full (accessed on 13 September 2024).
  30. Endler, J.A. A Framework for Analysing Colour Pattern Geometry: Adjacent Colours. Biol. J. Linn. Soc. 2012, 107, 233–253. [Google Scholar] [CrossRef]
  31. Wilson, J.S.; Jahner, J.P.; Forister, M.L.; Sheehan, E.S.; Williams, K.A.; Pitts, J.P. North American Velvet Ants Form One of the World’s Largest Known Müllerian Mimicry Complexes. Curr. Biol. 2015, 25, R704–R706. [Google Scholar] [CrossRef]
  32. Kalidoss, R.; Umapathy, S.; Thirunavukkarasu, U.R. A breathalyzer for the assessment of chronic kidney disease patients’ breathprint: Breath flow dynamic simulation on the measurement chamber and experimental investigation. Biomed. Signal Process. Control 2021, 70, 103060. [Google Scholar] [CrossRef]
  33. Umapathy, S.; Thanaraj, K.P.; Sangamithirai, K. Computer aided diagnosis of obesity based on thermal imaging using various convolutional neural networks. Biomed. Signal Process. Control 2021, 63, 102233. [Google Scholar] [CrossRef]
  34. Mitchell-Heggs, R.; Prado, S.; Gava, G.P.; Go, M.A.; Schultz, S.R. Neural manifold analysis of brain circuit dynamics in health and disease. J. Comput. Neurosci. 2023, 51, 1–21. [Google Scholar] [CrossRef] [PubMed]
  35. Chen, A.A.; Clark, K.; Dewey, B.E.; DuVal, A.; Pellegrini, N.; Nair, G.; Jalkh, Y.; Khalil, S.; Zurawski, J.; Calabresi, P.A.; et al. PARE: A framework for removal of confounding effects from any distance-based dimension reduction method. PLoS Comput. Biol. 2024, 20, e1012241. [Google Scholar] [CrossRef] [PubMed]
  36. Zhao, Y.; Li, P.; Ding, H.; Cao, J.; Yan, W. Harmonic Reducer Performance Prediction Algorithm Based on Multivariate State Estimation and LargeVis Dimensionality Reduction. IEEE Access 2023, 11, 126762–126774. [Google Scholar] [CrossRef]
  37. Han, H.; Zhuo, L.; Li, J.; Zhang, J.; Wang, M. Blind image quality assessment with channel attention based deep residual network and extended LargeVis dimensionality reduction. J. Vis. Commun. Image Represent. 2021, 80, 103296. [Google Scholar] [CrossRef]
  38. Zhuo, Z.; Zhou, Z. Low Dimensional Discriminative Representation of Fully Connected Layer Features Using Extended LargeVis Method for High-Resolution Remote Sensing Image Retrieval. Sensors 2020, 20, 4718. [Google Scholar] [CrossRef]
  39. Ravuri, A.; Lawrence, N.D. Towards One Model for Classical Dimensionality Reduction: A Probabilistic Perspective on UMAP and t-SNE. arXiv 2024, arXiv:2405.17412. [Google Scholar] [CrossRef]
  40. Rashmi, R.; Umapathy, S.; Thanaraj, K.P.; Dhanraj, V. Fat-based studies for computer-assisted screening of child obesity using thermal imaging based on deep learning techniques: A comparison with quantum machine learning approach. Soft Comput. 2023, 27, 13093–13114. [Google Scholar] [CrossRef]
  41. Wang, Y.; Huang, H.; Rudin, C.; Shaposhnik, Y. Understanding How Dimension Reduction Tools Work: An Empirical Approach to Deciphering t-SNE, UMAP, TriMap, and PaCMAP for Data Visualization. J. Mach. Learn. Res. 2021, 22, 1–73. [Google Scholar]
  42. López-Ortiz, S.; Pinto-Fraga, J.; Valenzuela, P.L.; Martín-Hernández, J.; Seisdedos, M.M.; García-López, O.; Toschi, N.; Di Giuliano, F.; Garaci, F.; Mercuri, N.B.; et al. Physical Exercise and Alzheimer’s Disease: Effects on Pathophysiological Molecular Pathways of the Disease. Int. J. Mol. Sci. 2021, 22, 2897. [Google Scholar] [CrossRef]
  43. Moon, S.W. Neuroimaging Genetics and Network Analysis in Alzheimer’s Disease. Curr. Alzheimer Res. 2023, 20, 526–538. [Google Scholar] [CrossRef]
  44. Thompson, P.M.; Hayashi, K.M.; Dutton, R.A.; Chiang, M.C.; Leow, A.D.; Sowell, E.R.; De Zubicaray, G.; Becker, J.T.; Lopez, O.L.; Aizenstein, H.J.; et al. Tracking Alzheimer’s Disease. Ann. N. Y. Acad. Sci. 2007, 1097, 183–214. [Google Scholar] [CrossRef] [PubMed]
  45. Reas, E.T.; Shadrin, A.; Frei, O.; Motazedi, E.; McEvoy, L.; Bahrami, S.; van der Meer, D.; Makowski, C.; Loughnan, R.; Wang, X.; et al. Improved Multimodal Prediction of Progression from MCI to Alzheimer’s Disease Combining Genetics with Quantitative Brain MRI and Cognitive Measures. Alzheimers Dement. 2023, 19, 5151–5158. [Google Scholar] [CrossRef] [PubMed]
  46. Chakraborty, D.; Zhuang, Z.; Xue, H.; Fiecas, M.B.; Shen, X.; Pan, W.; Alzheimer’s Disease Neuroimaging Initiative. Deep Learning-Based Feature Extraction with MRI Data in Neuroimaging Genetics for Alzheimer’s Disease. Genes 2023, 14, 626. [Google Scholar] [CrossRef] [PubMed]
  47. Moon, S.W.; Dinov, I.D.; Kim, J.; Zamanyan, A.; Hobel, S.; Thompson, P.M.; Toga, A.W. Structural Neuroimaging Genetics Interactions in Alzheimer’s Disease. J. Alzheimers Dis. 2015, 48, 1051–1063. [Google Scholar] [CrossRef] [PubMed]
  48. Bandres-Ciga, S.; Ahmed, S.; Sabir, M.S.; Blauwendraat, C.; Adarmes-Gómez, A.D.; Bernal-Bernal, I.; Bonilla-Toribio, M.; Buiza-Rueda, D.; Carrillo, F.; Carrión-Claro, M.; et al. The Genetic Architecture of Parkinson Disease in Spain: Characterizing Population-Specific Risk, Differential Haplotype Structures, and Providing Etiologic Insight. Mov. Disord. 2019, 34, 1851–1863. [Google Scholar] [CrossRef]
  49. Lill, C.M.; Hansen, J.; Olsen, J.H.; Binder, H.; Ritz, B.; Bertram, L. Impact of Parkinson’s Disease Risk Loci on Age at Onset. Mov. Disord. 2015, 30, 847–850. [Google Scholar] [CrossRef]
  50. Pfaff, A.L.; Bubb, V.J.; Quinn, J.P.; Koks, S. Reference SVA Insertion Polymorphisms Are Associated with Parkinson’s Disease Progression and Differential Gene Expression. NPJ Parkinsons Dis. 2021, 7, 44. [Google Scholar] [CrossRef]
  51. Leonard, H.; Blauwendraat, C.; Krohn, L.; Faghri, F.; Iwaki, H.; Ferguson, G.; Day-Williams, A.G.; Stone, D.J.; Singleton, A.B.; Nalls, M.A.; et al. Genetic Variability and Potential Effects on Clinical Trial Outcomes: Perspectives in Parkinson’s Disease. J. Med. Genet. 2020, 57, 331–338. [Google Scholar] [CrossRef]
  52. Shan, Y.; Hu, D.; Wang, Z. A Novel Truncated Norm Regularization Method for Multi-channel Color Image Denoising. IEEE Trans. Circuits Syst. Video Technol. 2024, 1-1. [Google Scholar] [CrossRef]
  53. Liu, Y.; Yan, Z.; Tan, J.; Li, Y. Multi-Purpose Oriented Single Nighttime Image Haze Removal Based on Unified Variational Retinex Model. IEEE Trans. Circuits Syst. Video Technol. 2023, 33, 1643–1657. [Google Scholar] [CrossRef]
Figure 1. Flow chart of data preprocessing.
Electronics 13 03671 g001
Figure 2. 2D UMAP visualization; (a) original plot, (b) GAN plot, and (c) both.
Electronics 13 03671 g002
Figure 3. 3D UMAP visualization: (a) original plot; (b) GAN plot; and (c) both. The colors of the plot points are the same as in Figure 2.
Electronics 13 03671 g003
Figure 4. Heatmap showing actual vs predicted: (a) is for the original dataset with diseases classified; and (b) is for the dataset trained by the WGAN-GP, an advanced generative inverse network technique.
Electronics 13 03671 g004
Disclaimer/Publisher’s Note: The statements, opinions and data contained in all publications are solely those of the individual author(s) and contributor(s) and not of MDPI and/or the editor(s). MDPI and/or the editor(s) disclaim responsibility for any injury to people or property resulting from any ideas, methods, instructions or products referred to in the content.

