Article

Research on Hybrid Approach for Maximum Power Point Tracking of Photovoltaic Systems under Various Operating Conditions

College of Information and Electronic Engineering, Shenyang Agricultural University, Shenyang 110866, China
*
Author to whom correspondence should be addressed.
Electronics 2024, 13(19), 3880; https://doi.org/10.3390/electronics13193880
Submission received: 12 July 2024 / Revised: 16 September 2024 / Accepted: 18 September 2024 / Published: 30 September 2024
(This article belongs to the Special Issue Energy Technologies in Electronics and Electrical Engineering)

Abstract

:
Based on the characteristics of the whale optimization algorithm (WOA) and perturbation observation (P&O) method, this paper proposes a novel hybrid approach called the improved chaotic whale optimization combined with perturb and observe (ICWOA-P&O) method for maximum power point tracking (MPPT) control to solve the challenge of low efficiency in photovoltaic (PV) power generation under local shadows. First, the ICWOA is used for a global search to quickly locate the position of the maximum power point (MPP). Then, the P&O method is used for a fine-grained local search to quickly track the position of the global maximum power point (GMPP) with low oscillation. To ensure accuracy, the tracking performance of the ICWOA-P&O method is comprehensively compared with the WOA-P&O, WOA, and PSO models under four conditions: uniform irradiance, static local shading, dynamic shading, and sudden changes in irradiance and temperature. The simulation results verify that under the above four conditions, the ICWOA-P&O method can track the MPP continuously and stably and greatly improves the convergence time and accuracy. Compared with the other three methods, the ICWOA-P&O method can effectively obtain the fastest tracking speed (less than 0.1 s), the highest tracking accuracy (more than 99.97%), the smallest relative error (less than 0.03%), and the smallest oscillation fluctuation. Finally, this study integrated the ICWOA-P&O algorithm into the designed MPPT controller hardware and established a practical PV experimental platform based on the ICWOA-P&O control algorithm for practical tests.

1. Introduction

For many years, fossil-fueled power stations have been the most common source of electricity in most countries. However, burning fossil fuels releases a large amount of greenhouse gases such as carbon dioxide, causing pollution and natural disasters. Due to the above problems, many scholars have proposed using renewable energy instead of fossil fuels to protect the environment, such as wind energy and photovoltaic energy [1]. In the process of photovoltaic power generation, improving the efficiency of power generation and reducing costs are the key focuses of the photovoltaic industry. The core issue in enhancing power generation efficiency is to accurately and quickly achieve MPPT of PV systems [2,3,4,5].
When the solar panels are uniformly irradiated, the power–voltage characteristic curve (P-V) of the system displays a single peak and a single MPP. However, due to the coverage of clouds, trees, and buildings, PV panels often have local shadows. At this moment, the P-V of PV systems displays multiple peak characteristics [6,7,8,9], including multiple localized pole points (LMPPs) and a GMPP. In addition, MPPT techniques, such as constant voltage (CV), perturbation and observation (P&O) [10], incremental conductance (INC) [11], etc., often fall into localized poles and cannot effectively monitor MPPs. In order to realize MPP tracking in multimodal cases [12,13], using intelligent optimization algorithms to optimize the MPP has become a current research hotspot [14]. The problems that need to be considered for maximum power point tracking include tracking speed, tracking accuracy, oscillation size, etc. External variations in irradiance significantly affect the P-V and I-V of solar PV systems [15].
To address complex nonlinear problems, hybrid systems are often employed to enhance overall performance and robustness by leveraging the strengths of various techniques. In applications of MPPT control in PV systems, artificial neural networks (ANNs), fuzzy logic (FL), and optimization algorithms (OAs) are often utilized. These methods perform well in handling uncertainty, improving tracking efficiency, and optimizing system performance.
ANNs have been extensively applied in the field of renewable energy due to their strong capabilities in resource availability prediction [16], operational parameter estimation [17], and nonlinear dynamic system modeling [18]. However, a key limitation of using ANNs in MPPT controllers is that their performance heavily depends on the size and quality of the training dataset. Consequently, for PV systems at different locations, it is usually necessary to repeat data collection and training to maintain the effectiveness of ANNs. Reference [19] introduces an algorithm that integrates ANNs with a fuzzy logic inference engine and Gaussian vectors, showcasing an ability to rapidly converge to MPPs. However, the algorithm’s actual performance does not meet expectations as it still exhibits typical P&O oscillations. This shortcoming may be due to the limited size of the ANN training dataset. To address this issue, reference [20] proposes a hybrid approach that combines the genetic algorithm (GA) with ANN, using the GA to optimize the ANN topology. This method has shown potential in enhancing the overall efficiency of controllers and improving the MPPT performance in PV systems.
FLCs are comparable to ANNs in efficiency due to their relatively low processing complexity. However, designing an effective FLC requires a deep understanding of PV system characteristics. If the FLC rule table is not properly optimized, it may result in additional computational burdens. To overcome these limitations, researchers have explored various intelligent combination methods. For example, reference [21] employs PSO to refine the FLC’s membership functions and rules, thereby enhancing its performance. Additionally, reference [22] proposes integrating FLCs with Hopfield artificial neural networks to address the constraints of static fuzzy rule tables, offering a promising solution to improve the effectiveness of FLCs.
An optimization algorithm is a mathematical technique aimed at finding the optimal solution through an iterative process. These algorithms can be deterministic, such as gradient descent, or stochastic, including methods such as cat swarm optimization (CSO), particle swarm optimization (PSO), grey wolf optimization (GWO), and the whale optimization algorithm (WOA). Reference [23] proposes a territorial particle swarm algorithm that improves tracking speed by intelligently removing regions that cannot reach the maximum power point. Reference [24] utilizes the cat swarm optimization (CSO) algorithm, combined with a chaotic search strategy, to address the issue of “premature convergence” in the CSO algorithm by utilizing the traversal and randomness of chaotic sequences. Reference [25] combines GWO with P&O to address the issues of slow optimization speed and low optimization accuracy when using the GWO algorithm, and the proposed algorithm has a better tracking performance under any external environmental changes. Reference [26] proposes a hybrid butterfly particle swarm and P&O algorithm, which shortens search time by introducing a sensitivity factor and an adaptive weighting factor, and can accurately track the position of GMPPs, reducing the power oscillations in the search space. Reference [27] constructs a hybrid MPPT system that integrates an ANFIS with the HC technique, which has good stability and a short tracking stabilization time under different climate conditions. Meanwhile, research on various intelligent optimization algorithms such as the ant colony optimization algorithm [28], firefly optimization algorithm [29], and genetic algorithm [30] has markedly enhanced the efficiency of MPPT. These algorithms leverage their robust global search capabilities and adaptive optimization mechanisms to significantly enhance the response speed and tracking accuracy of PV systems in dynamic environments, thereby advancing the intelligent development of photovoltaic technology.
Optimization algorithms, including heuristic and meta-heuristic approaches, have powerful global search capabilities, enabling them to find optimal solutions in complex search spaces. These algorithms aim to explore the entire search space, effectively avoiding local optima and identifying global optima. They excel at tuning system parameters, such as optimizing the structure and weights of neural networks in ANNs, as well as refining rules and membership functions in fuzzy logic systems. Compared with manual parameter tuning, optimization algorithms offer automatic and efficient parameter configuration, reduce human intervention, and enhance system performance. Additionally, due to the absence of initial conditions, optimization algorithms are robust in varying environments and conditions. Given these advantages, it is believed that optimization algorithms can track the MPP to achieve more efficient and accurate energy capture.
The WOA is an innovative heuristic optimization algorithm proposed by Professor Mirjalili’s team in 2016. This algorithm is simple to implement and has few parameters, good convergence, a strong global search capability, and excellent robustness, making it an ideal choice for MPPT control. By incorporating additional improvement methods, the WOA can further enhance the energy capture efficiency and tracking performance of photovoltaic systems [31,32,33,34]. Good results have been obtained in many fields. Reference [35] introduces a cosine nonlinear convergence factor and inertia weight factor to improve the whale algorithm, aiming to improve the optimization accuracy and search speed of the system. Reference [36] employs the whale optimization algorithm for tuning the proportional integral controller, aiming to enhance the performance of a 400 kW grid-connected PV system. However, the WOA also has problems such as a slow convergence speed, poor convergence accuracy, and large fluctuations in power oscillations. Currently, many scholars are using hybrid algorithms to deal with the aforementioned problems. The paper proposes a novel MPPT control method. Firstly, an improved chaotic whale algorithm (ICWOA) is proposed based on the standard WOA. By introducing tent chaotic mapping [37,38], the nonlinear convergence factor, and Levy flights, the defects of slow optimization speed and easily falling into local optima in the standard WOA are further solved. Then, the combined method of the ICWOA and P&O is applied to MPPT control, known as the ICWOA-P&O method. Finally, a simulation model is established using Matlab R2019b/Simulink. The outcomes indicate that compared with PSO, the WOA, and the WOA-P&O model, the ICWOA-P&O algorithm has positive advantages and achieves a relatively ideal effect. Furthermore, the GMPP can quickly and accurately search for local shadow occlusion and illumination mutation and shows better tracking performance.
The remainder of this paper is laid out as follows: Section 2 analyzes the photovoltaic power generation principle and output characteristics. Section 3 proposes a multistrategy improved chaotic whale perturbation observation method for MPPT control. Section 4 analyzes the simulation results of MPPT methods using the PSO algorithm, WOA, WOA-P&O algorithm, and ICWOA-P&O algorithm. Section 5 shows the experimental results. Section 6 outlines the conclusions.

2. Analysis of Photovoltaic Power Generation Principle and Output Characteristics

PV power systems are an innovative power generation technology. The PV effect generated by semiconductor materials in solar cells directly converts solar radiation into electrical energy. The PV power generation system includes a PV array, converter, MPPT controller, inverter, and power grid, and its structure is shown in Figure 1.

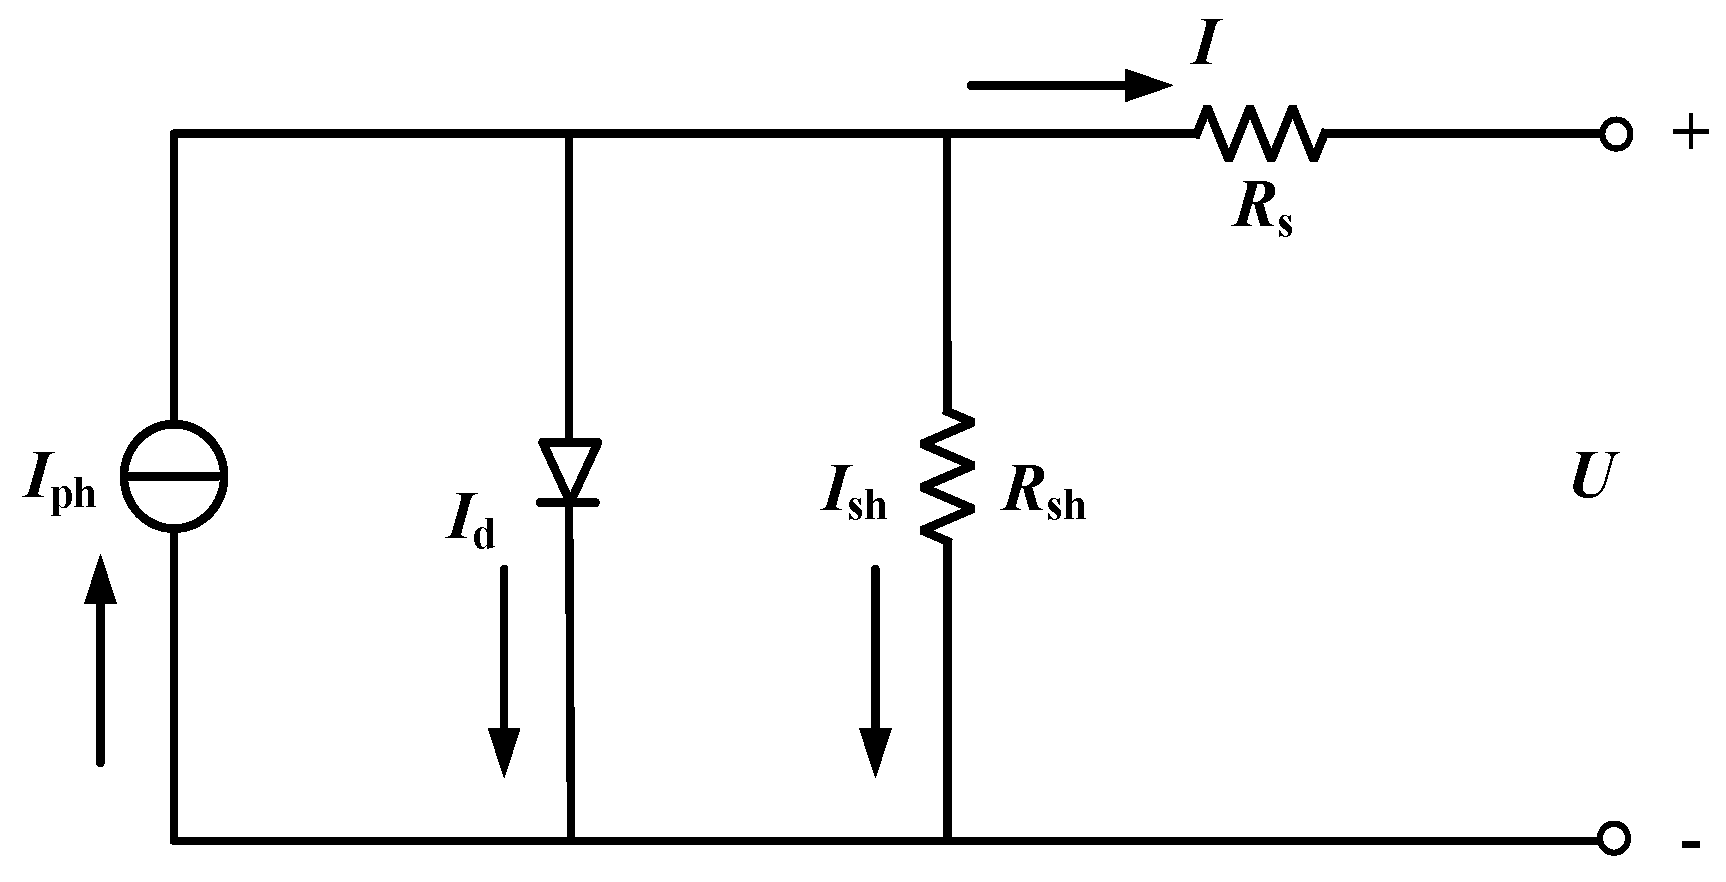
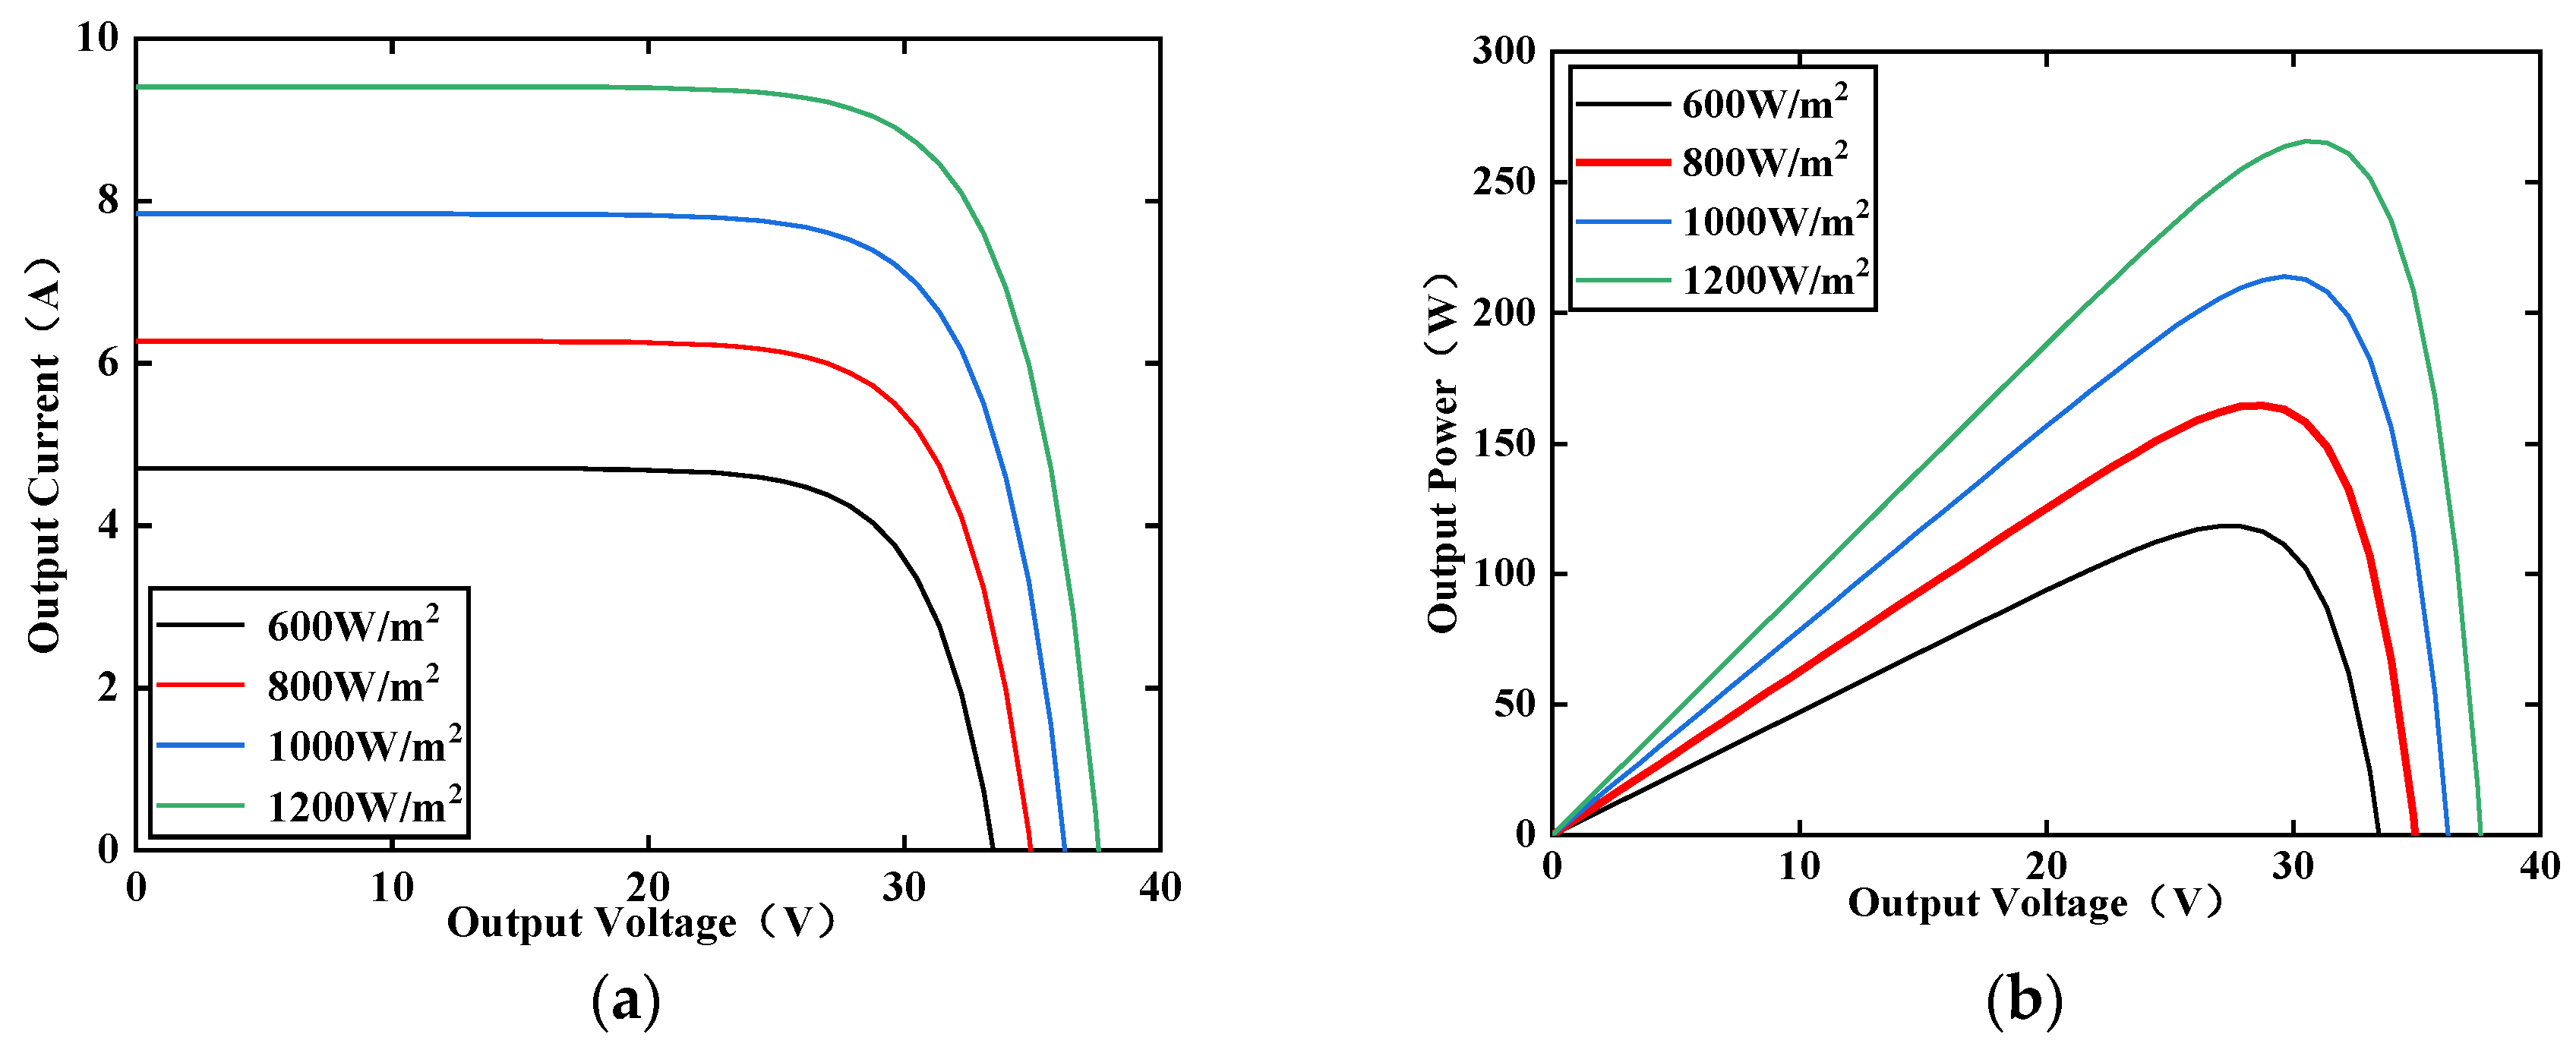
2.1. Mathematical Modeling of Photovoltaic Systems

The physical model of a PV cell, also known as the single-diode model, is shown in Figure 2. In the PV cell model, the magnitude of the series resistance (Rs) is closely related to the material properties of the solar cell itself and other relevant factors. The resistance value of series resistance is often close to zero, whereas the parallel resistance (Rsh) is caused by factors such as the aging of PV panel material, and the resistance value of Rsh is considered to be infinite [39].
According to the equivalent circuit diagram of the PV cell, the output current of the load is as shown in Equation (1):
I = I ph I d I sh
The characteristic equation of the PV I-V curve is given in Equation (2):
I = I ph I 0 exp q U + I r s n k T 1 U + I r s r sh
Typically, larger Rsh and smaller Rs values are often ignored in engineering mathematical modeling, such as the mathematical modeling of PV cells.
I = I p h I 0 exp q U + I r s n k T 1
where Ish is the photogenerated current of the cell, U is the output voltage, I is the output current, I0 is the reverse saturation current, and n is the diode constant factor, which takes the value of 1. k is Boltz’s constant, 1.38 × 10 23   J / K . T is the temperature of the PV cell, and q is the electronic charge constant, 1.6 × 10 19   C .
In Equation (3), the value of the n and I0 parameters is related to the external changing conditions. To facilitate the output characteristic curve of PV cells, it is generally simplified as shown in Equations (4)–(6):
C 1 = 1 I m I sc exp U m C 2 U o c
C 2 = ln 1 I m I sc 1 U m U o c 1
I m = I sc 1 C 1 exp U m C 2 U o c 1
where at the MPP, Im is the output current (IPV), Um is the output voltage (VPV), Isc is the short-circuit current of a PV cell under the condition of reference sunlight irradiance and temperature, and Uoc is the open-circuit voltage under the condition of reference sunlight irradiance and temperature.
In practical applications, due to the impact of external environment changes on the PV cell, the environment cannot be recognized as a constant value. To solve this problem, the PV cell will be calibrated [40], and the setting values of each parameter are shown in Table 1.
To confirm the impact of external environments on the output characteristics of PV cells, the specific conditions are as follows: at a fixed temperature of 25 °C, the irradiance is set to 600 W/m2, 800 W/m2, 1000 W/m2, and 1200 W/m2, respectively. The I-V and P-V characteristic curves of PV output obtained through simulation under the same temperature and different irradiance are shown in Figure 3.
From Figure 3b, when the temperature is 25 °C and the irradiance is 800 W/m2, the VPV at MPP is 28.74 V, and the output power (PPV) is 164.62 W. When the irradiance is 1000 W/m2, the VPV at MPP is 29.62 V, and the PPV is 213.83 W. The results show that when the temperature remains constant and the irradiance increases, the Uoc and Isc increase and the power difference at MPP is larger, so the irradiance has a greater effect on the PPV of the PV cell. In summary, the output characteristics of PV cells are more affected by irradiance and less affected by temperature, so it is more meaningful to analyze and study PV cells under different irradiance.

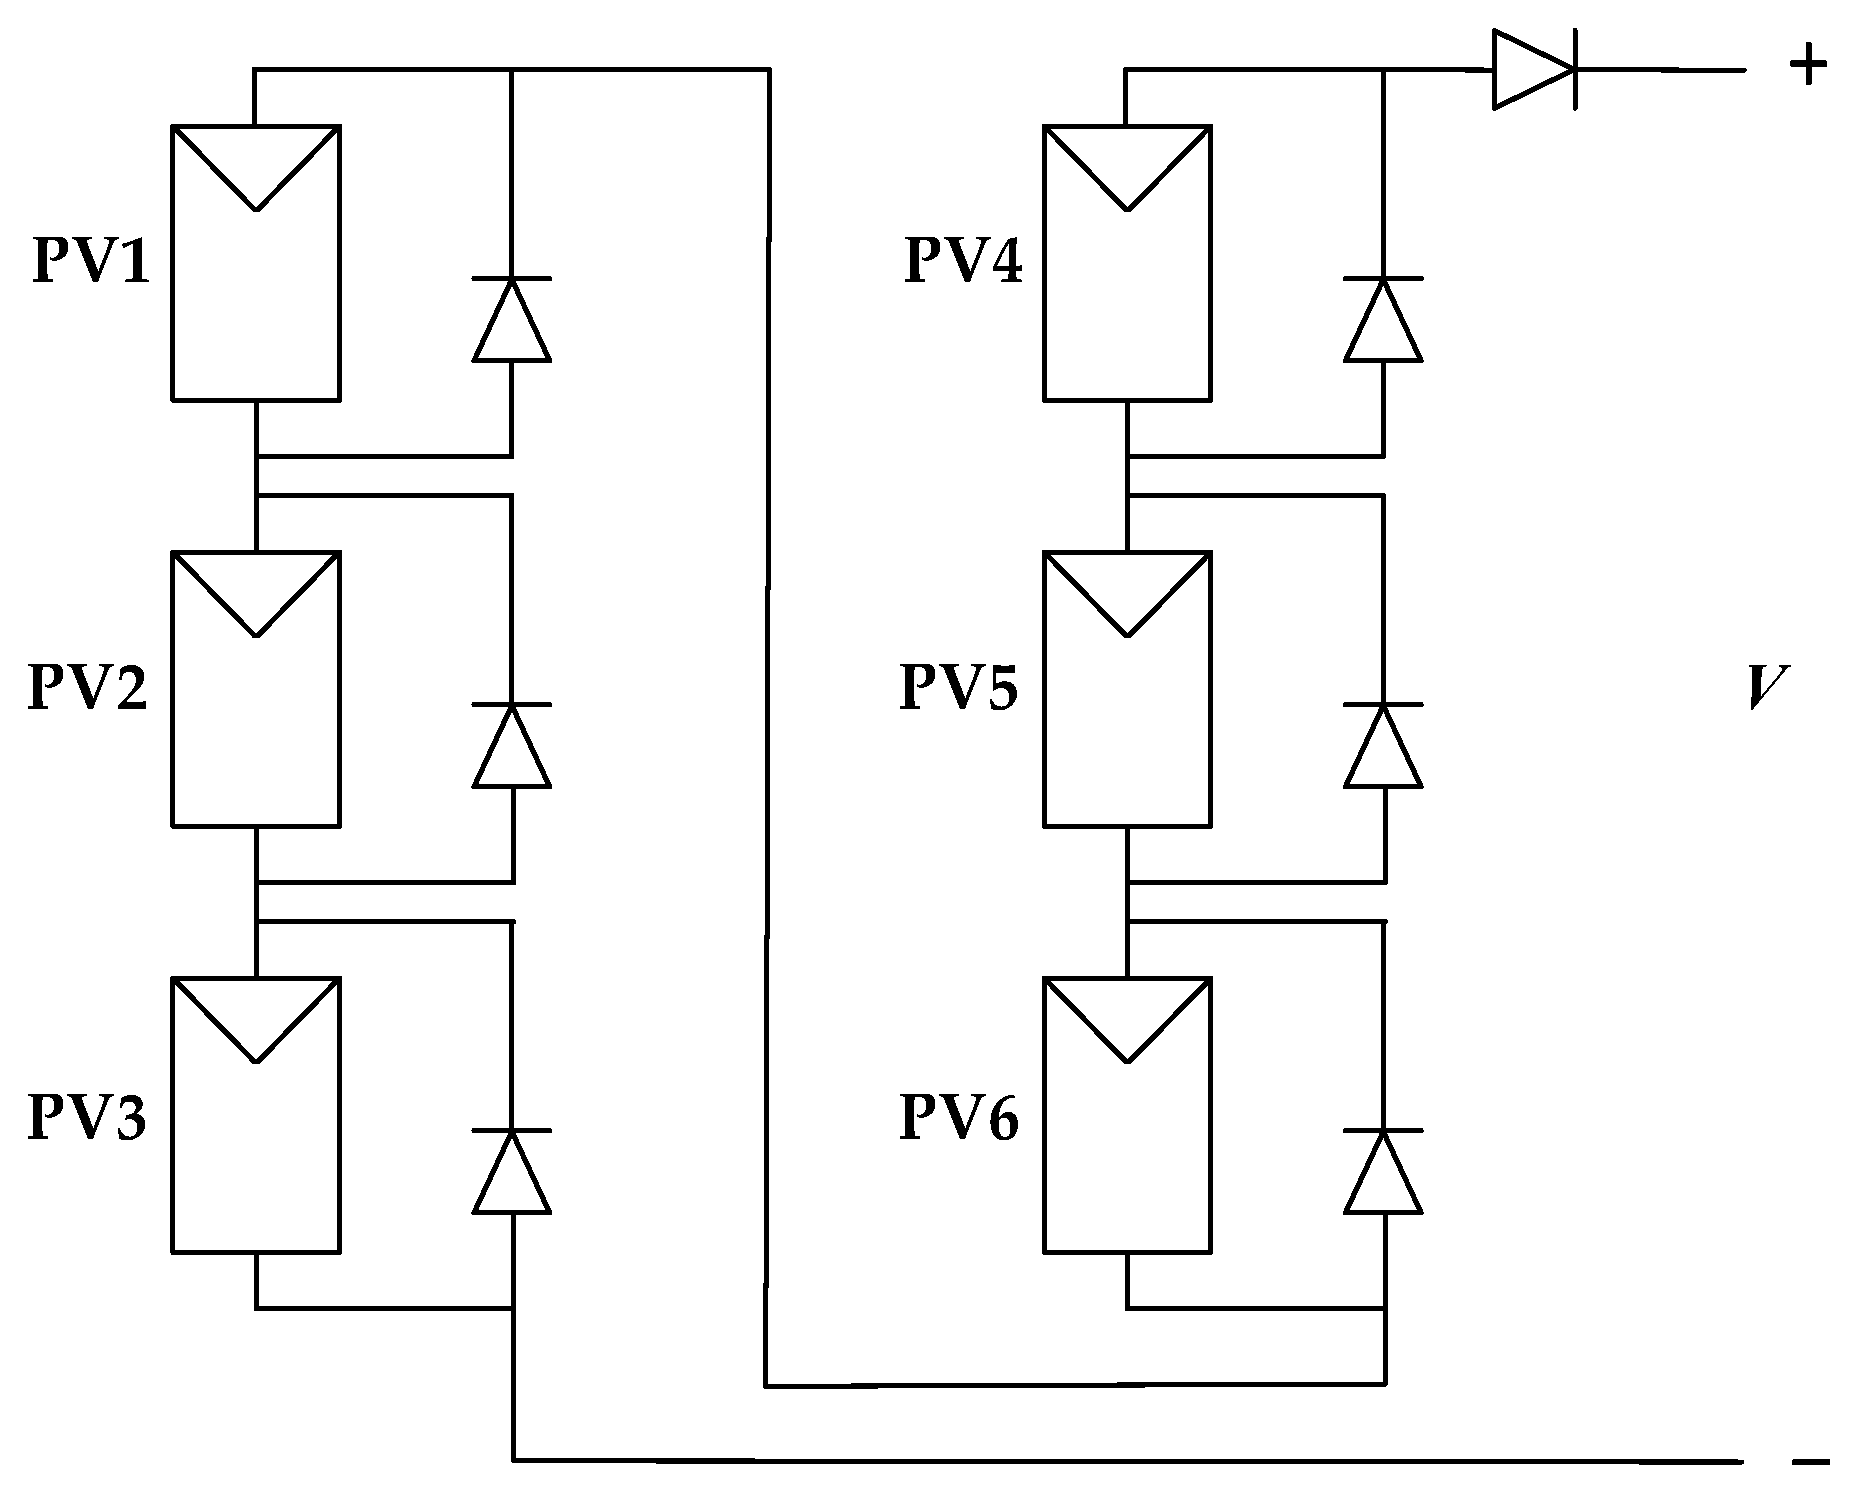
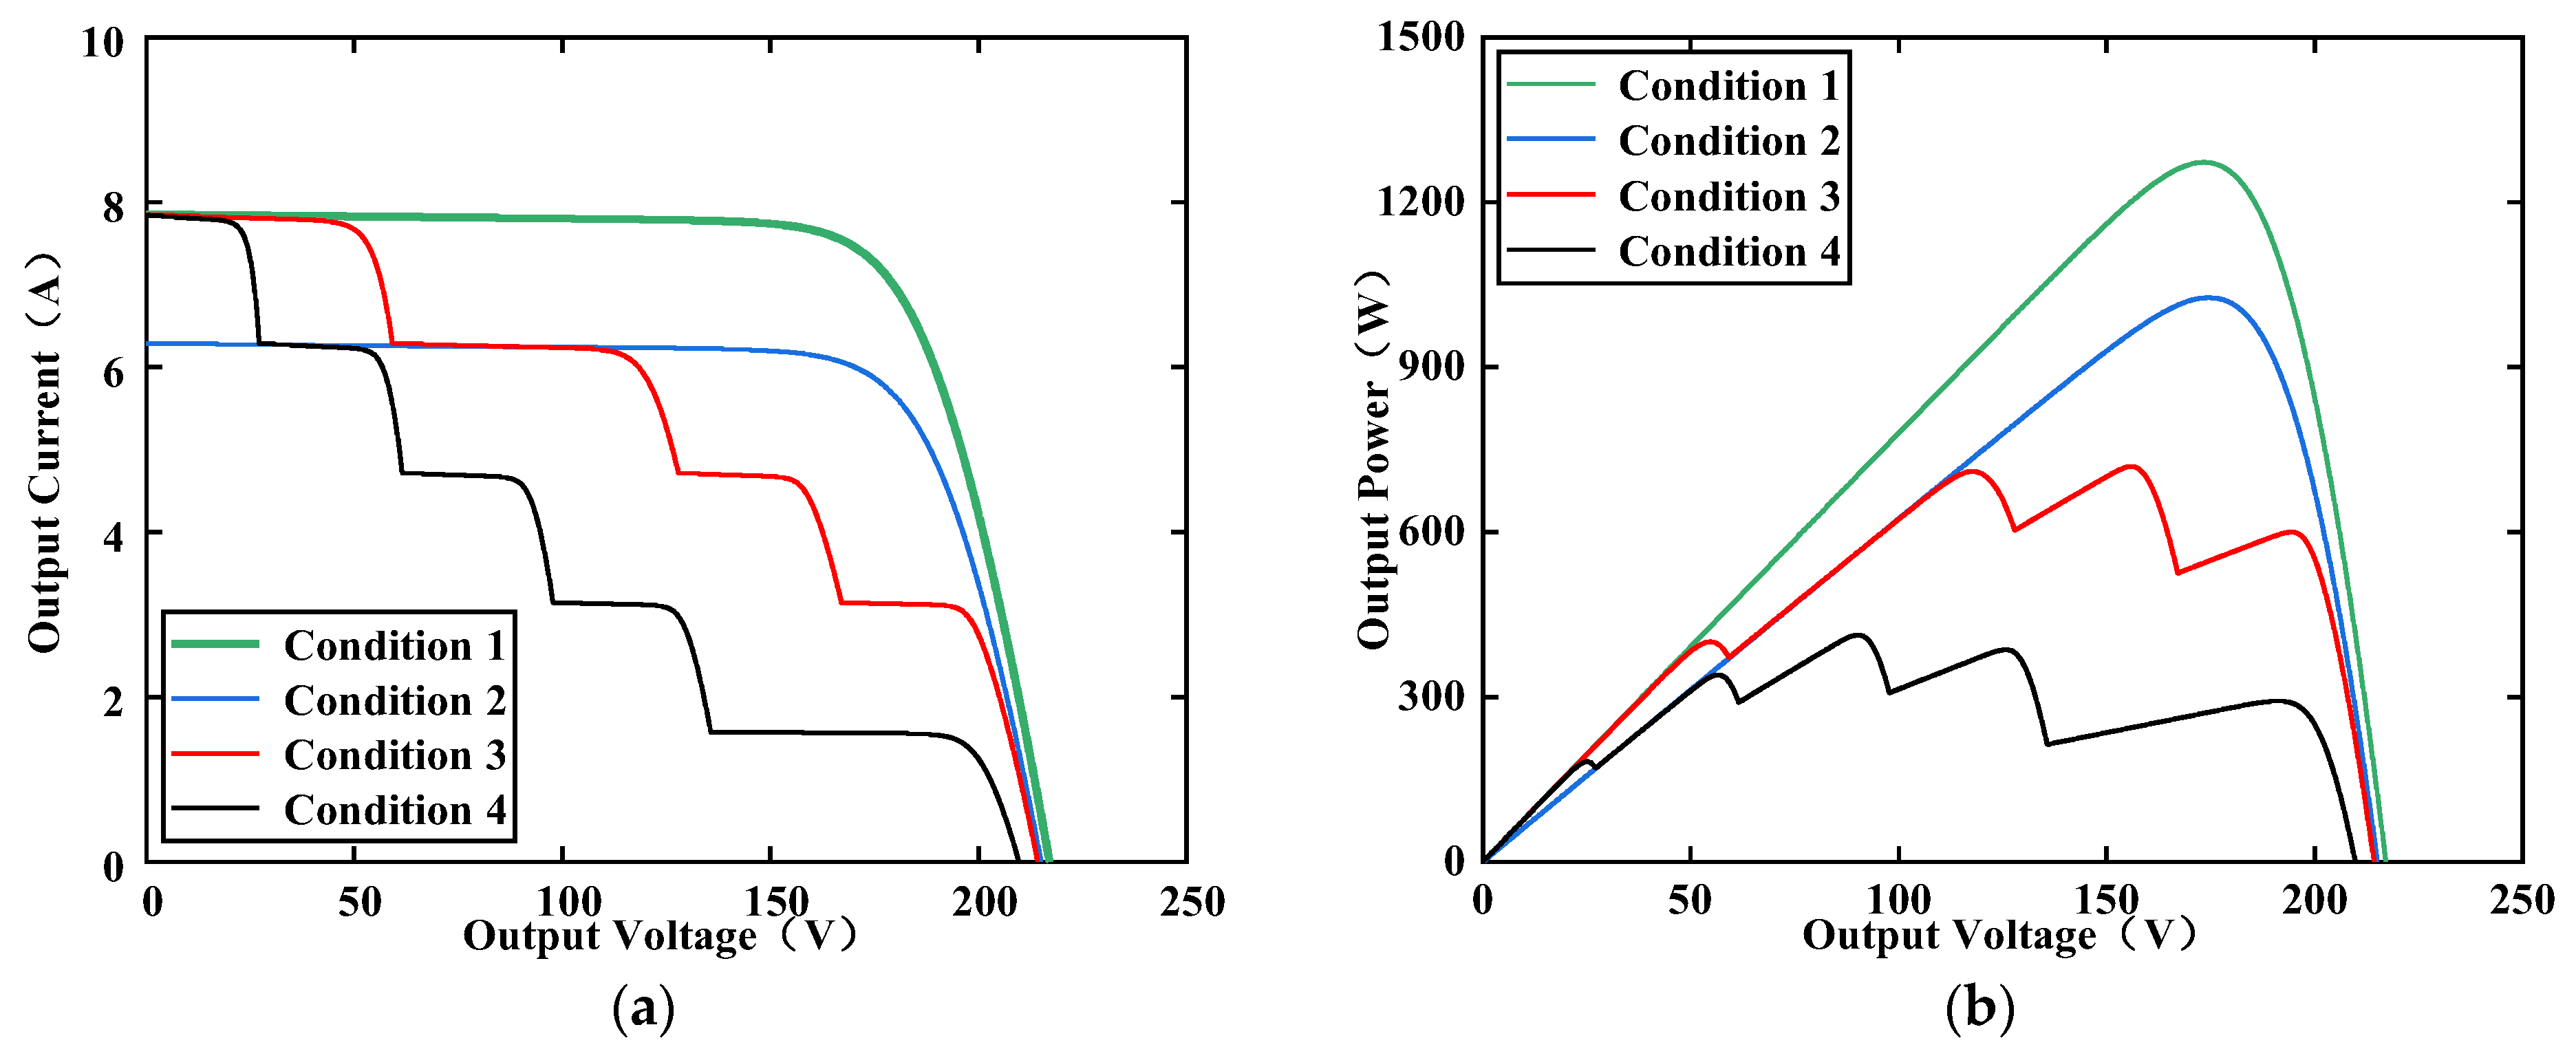
2.2. Multipeak Characterization of 6 × 1 PV Array under Local Shading

The PV module is connected with a bypass diode because the bypass diode can reduce the output power loss under shadow conditions and also reduce the “hotspot effect”. This section analyzes and studies the 6 × 1 PV array under local shadow occlusion (PSC) and standard uniform irradiance conditions, respectively [41], and the PV array is shown in Figure 4.
Under the condition of uniform irradiance, two cases are studied. The irradiance for Condition 1 is set to 1000 W/m2, and the irradiance of Condition 2 is 800 W/m2. P-V and I-V are observed for both cases, as shown in Figure 5. It can be inferred that when the system operates under Condition 1, the theoretical value of the system is 1273 W. Under Condition 2, the system is 1027 W.
Under the local shadow shading condition, two different cases are considered in this paper. Condition 3: The irradiance of the PV module is 1000 W/m2, 1000 W/m2, 800 W/m2, 800 W/m2, 600 W/m2, and 400 W/m2, respectively. Condition 4: The irradiance is 1000 W/m2, 800 W/m2, 600 W/m2, 400 W/m2, 200 W/m2, and 200 W/m2. The P-V and I-V are observed under two different conditions, as shown in Figure 5. When local shadows are blocked, the theoretical value of the system for Condition 3 and Condition 4 are 719.1 W and 412.7 W, respectively.
From Figure 5, it can be seen that under uniform irradiance, the P-V has only one peak, and there are multiple peaks under the cover of local shadows. In this case, conventional MPPT often falls into local optima and cannot accurately track MPPs. Therefore, this paper proposes a hybrid ICWOA-P&O method and applies it to MPPT technology.

3. Improved Chaotic Whale Perturbation and Observation Method for MPPT Control Methods

3.1. P&O Method

The P&O method performs well in tracking under uniform irradiance conditions. It has the characteristics of relatively few parameters and a simple theoretical framework, and is widely used for mixing with other swarm intelligent optimization algorithms, which has also been the research direction of many scholars in recent years [42,43]. The P&O method first calculates the output power by measuring the VPV and IPV of the PV array, and then observes the power changes before and after disturbance by interfering with the output voltage. After continuous disturbance, the VPV of the PV array gradually approaches the MPP until the operation approaches the MPP [44]. The flowchart for the P&O algorithm is shown in Figure 6.

3.2. WOA

The inspiration for the WOA comes from the predation behavior of humpback whales, huge mammals that are over 12 m long and weigh over 20 tons, and are known for their ingenious predation strategy [45]. Recently, the WOA has become a popular research topic for researchers. It has fewer parameters, a simple structure, and high efficiency. The algorithm plays a large role in solving practical application problems. A schematic diagram of humpback whale predation behavior is shown in Figure 7.
(1)
Random prey searches
In this stage, a whale is randomly selected as a search target in the whale population and its location is updated. When |A| > 1, a global search is conducted for the individual. When |A| < 1, a local search is conducted for the individual, as shown in Equations (7) and (8).
D = | C X r t X t |
X t + 1 = X r A D
where A and C are coefficient vectors. A affects the search ability range of whale individuals, t is the current iteration, Xr(t) is the whale position vector randomly selected in the current population, X(t) is the current whale position vector, D is the distance between the current whale individual position and the optimal whale individual position, and X(t + 1) is the updated position vector.
(2)
Surrounding the prey stage
In the WOA, individuals of the whale population interact and move to the position of the whale individual closest to the prey, but the position of the target prey within the search range is uncertain. Since each whale is a search individual, the position of the optimal search individual is the global optimal solution, so other search individuals in the search space are close to the current optimal position. The mathematical model of the stage where the whale surrounds its prey is shown in Equations (9) and (10).
D = C X b t X t
X t + 1 = X b t A D
where Xb(t) is the position vector of the optimal solution in the current search space.
A = 2 α r 1 α
C = 2 α r 2
α = 2 2 t T m a x
where α is a control parameter that linearly decreases from 2 to 0 during the iteration. r1 and r2 are random numbers of [0,1], respectively, and Tmax is the maximum number of iterations.
(3)
Bubble-net feeding phase
The strategy first calculates the distance between the location of the current individual whale in the search space and the known optimal whale position, reflecting the position relationship for both of them. Secondly, the whale approaches the target prey along the spiral path. In the process, the location of the individual whale is constantly updated, and each update will bring the individual whale closer to the optimal solution. This process is indicated by Equations (14) and (15).
D = X b ( t ) X ( t )
X t + 1 = D e b l cos 2 π l + X b t
where D is a vector of distances between the optimal whale individual and the whale individual itself in the current region, b is a coefficient taking the value of 1, and l is an arbitrary number between [−1, 1].
The choice of three stages in the whale algorithm depends on the parameter |A| and the probability factor p. When p ≥ 0.5, it is in the bubble-net feeding phase. When p < 0.5, it is either in the random prey search stage or the surrounding the prey stage. The equation is outlined as follows:
X t + 1 = X r t A D ,     A 1 D e b l cos 2 π l + X b t , A < 1

3.3. ICWOA

Because the WOA is prone to local optima, this paper makes the following improvements to the WOA and proposes an improved chaotic whale algorithm (ICWOA).
(1)
Tent chaotic mapping
Tent mapping is ergodic and stochastic. Tent mapping makes the intelligent optimization algorithm have higher convergence speed and a uniform distribution of population sequence. Many scholars use logistic mapping in chaotic sequences, but its sequence distribution is not uniform [46,47]. Therefore, the paper employs tent mapping. The computational formula of a tent chaotic map is
X m = 2 1 X m k , 0.5 < X m k 1 X m = 2 X m k , 0 X m k 0.5
where Xm (k) is the value of the kth mapping function, and k is the chaos.
(2)
Nonlinear convergence factor
Introducing a nonlinear convergence factor can improve the optimization speed by optimizing the balance between the global and local search during the iteration process of the WOA. Therefore, to further boost the convergence speed, the paper constructs the nonlinear convergence factor as follows:
α 1 = 2 cos π 2 t T max
(3)
Introducing Levy Flight
In the optimization search process, the substantial perturbation of the individual whale’s position enables the algorithm to avoid falling into premature convergence, and the method can effectively leap beyond the local optimal solution and improve the global search capability. Levy flight is fused with the WOA to implement the MPPT control strategy for PV power generation in the case of local shadow occlusion. Utilizing Levy flight, the new position update formula is given as follows:
X t = X t + α 2 L e v y s
where X’(t) is the update position by Levy flight, is the dot product operation, α 2 is the distance update coefficient, and Levy(s) is the random search path.

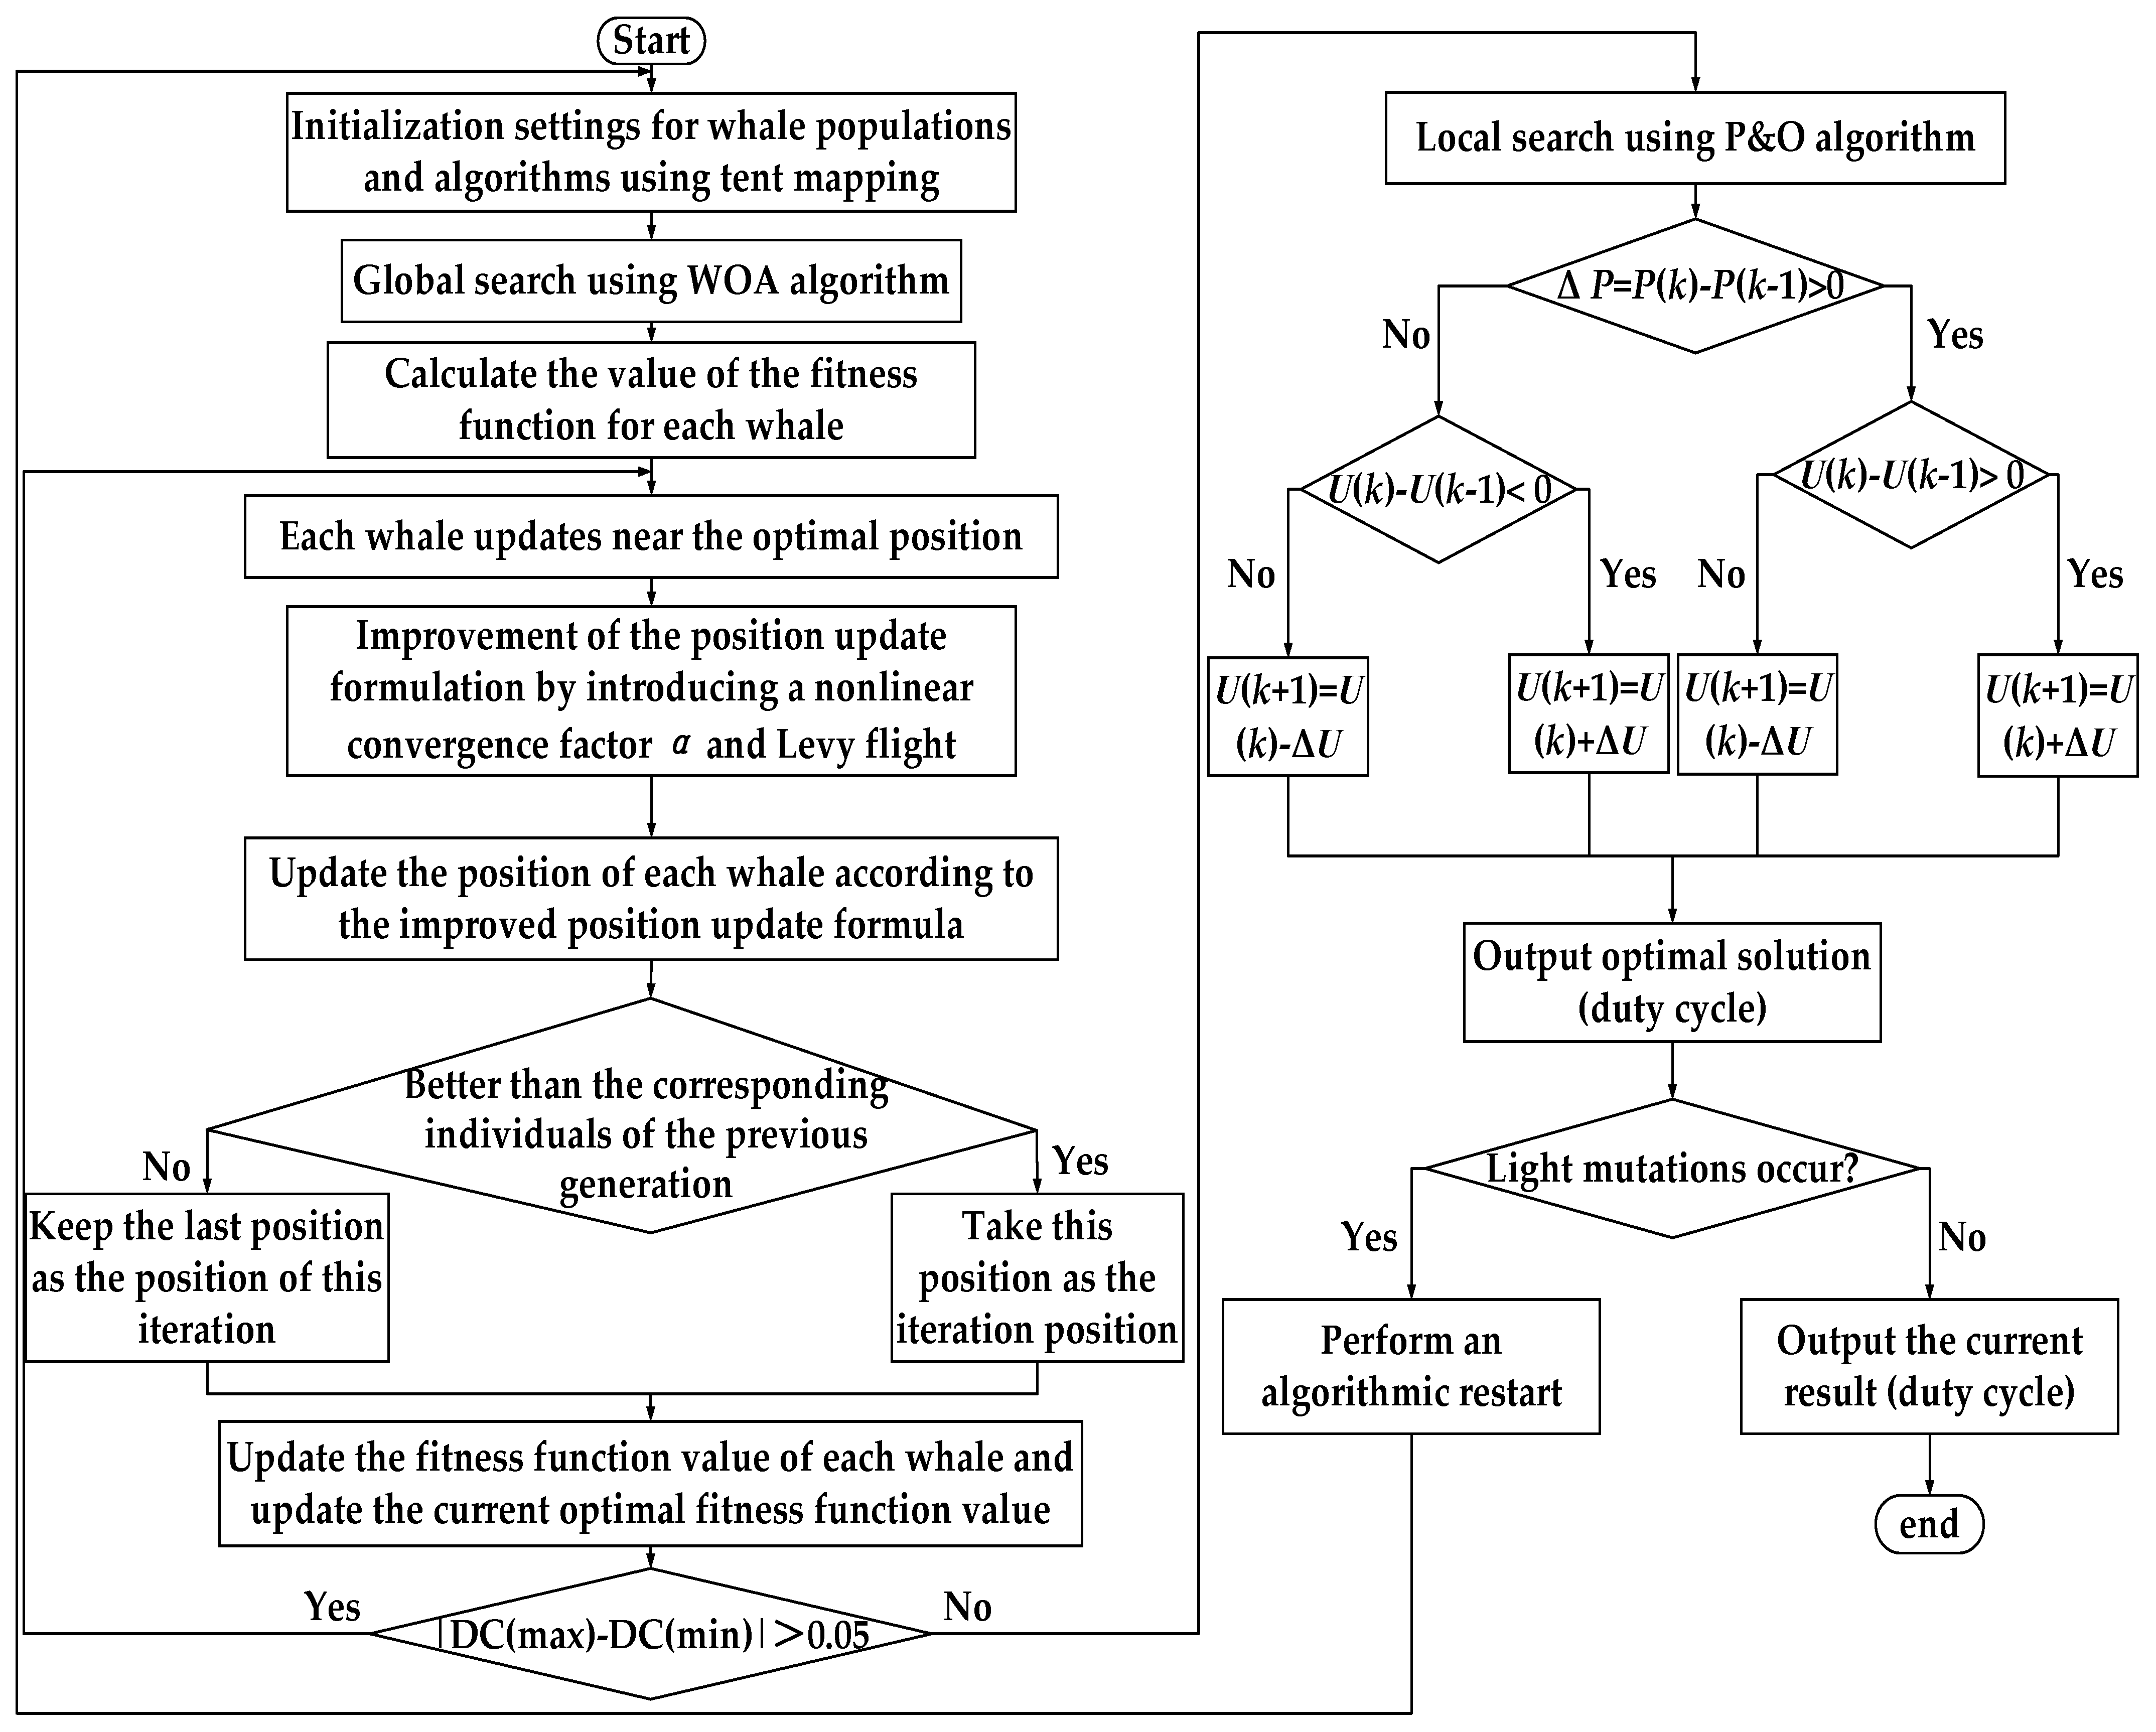
3.4. MPPT Control Method Based on ICWOA-P&O Algorithm

This paper proposes the ICWOA-P&O hybrid algorithm. The algorithm is derived from the standard WOA by incorporating strategies such as tent chaotic mapping, introducing a nonlinear convergence factor α1 and Levy flights, and then combining it with P&O to further improve the algorithm’s optimization speed and avoid power oscillations to reduce the energy loss. The principle of this algorithm is to perform a global search in the vicinity of the GMPP by firstly using the ICWOA in the early stage of the algorithmic control and then using the P&O algorithm to perform a fine local search in the vicinity of the GMPP at the end of the algorithmic control. The overall flowchart of the ICWOA-P&O algorithm is shown in Figure 8. The specific steps for the implementation of the ICWOA-P&O method are as follows:
Step 1: Initialize the population and set the parameters in the algorithm. N individuals with a relatively balanced distribution of whale positions are initialized in the search space using tent chaotic mapping.
Step 2: Collect VPV and IPV, and calculate the PPV for each whale.
Step 3: Update the whale position using the ICWOA, collect the voltage, current, and power at the new position, and compare them with the previous power. If the current power is greater than the previous power, keep the current position as the iterative position, and vice versa, keep the previous position as the iterative position if the previous power is greater than the current power.
Step 4: Update the power value of each whale and update the current optimal power value with the corresponding position. Determine whether the whale is in the predicted global optimal position. If so, move on to Step 5; otherwise, skip to Step 6.
Step 5: Use the P&O algorithm for local search.
Step 6: Check whether the environment status changes. If so, return to Step 1; if not, return to Step 5.

4. Simulation Results and Analysis

In this paper, the MPPT control system mainly includes a PV array, boost circuit, MPPT controller [48], load, etc. The simulation parameters in the control circuit are set as follows: C1 = 20 μF, C2 = 200 μF, and L = 3 × 10⁻³ mH. The corresponding MPPT structure diagram of the photovoltaic system based on the ICWOA-P&O model is shown in Figure 9.
The PV system is mainly composed of five core components: a PV array, a DC-DC converter, an inverter, an MPPT controller, and a load. The MPPT controller is one of the core components of the PV system, which mainly detects the IPV and VPV in real time, and calculates the optimal output control quantity through the MPPT control algorithm. The control quantity is usually the duty cycle of the PWM signal, which is mainly used to drive the MOS tube in the DC-DC converter to turn on and off to achieve boost or buck control. By adjusting the VPV of the DC-DC converter, the MPPT controller adjusts the equivalent resistance of the load to match the impedance of the PV array to the load. This process ensures that the PV array always operates near the MPP. Thus, maximizing the energy output of the PV system is the responsibility of the MPPT controller in the paper.
The ICWOA-P&O method is used to analyze MPPT under different irradiance conditions, and the parameter settings for three operating conditions are shown in Table 2.

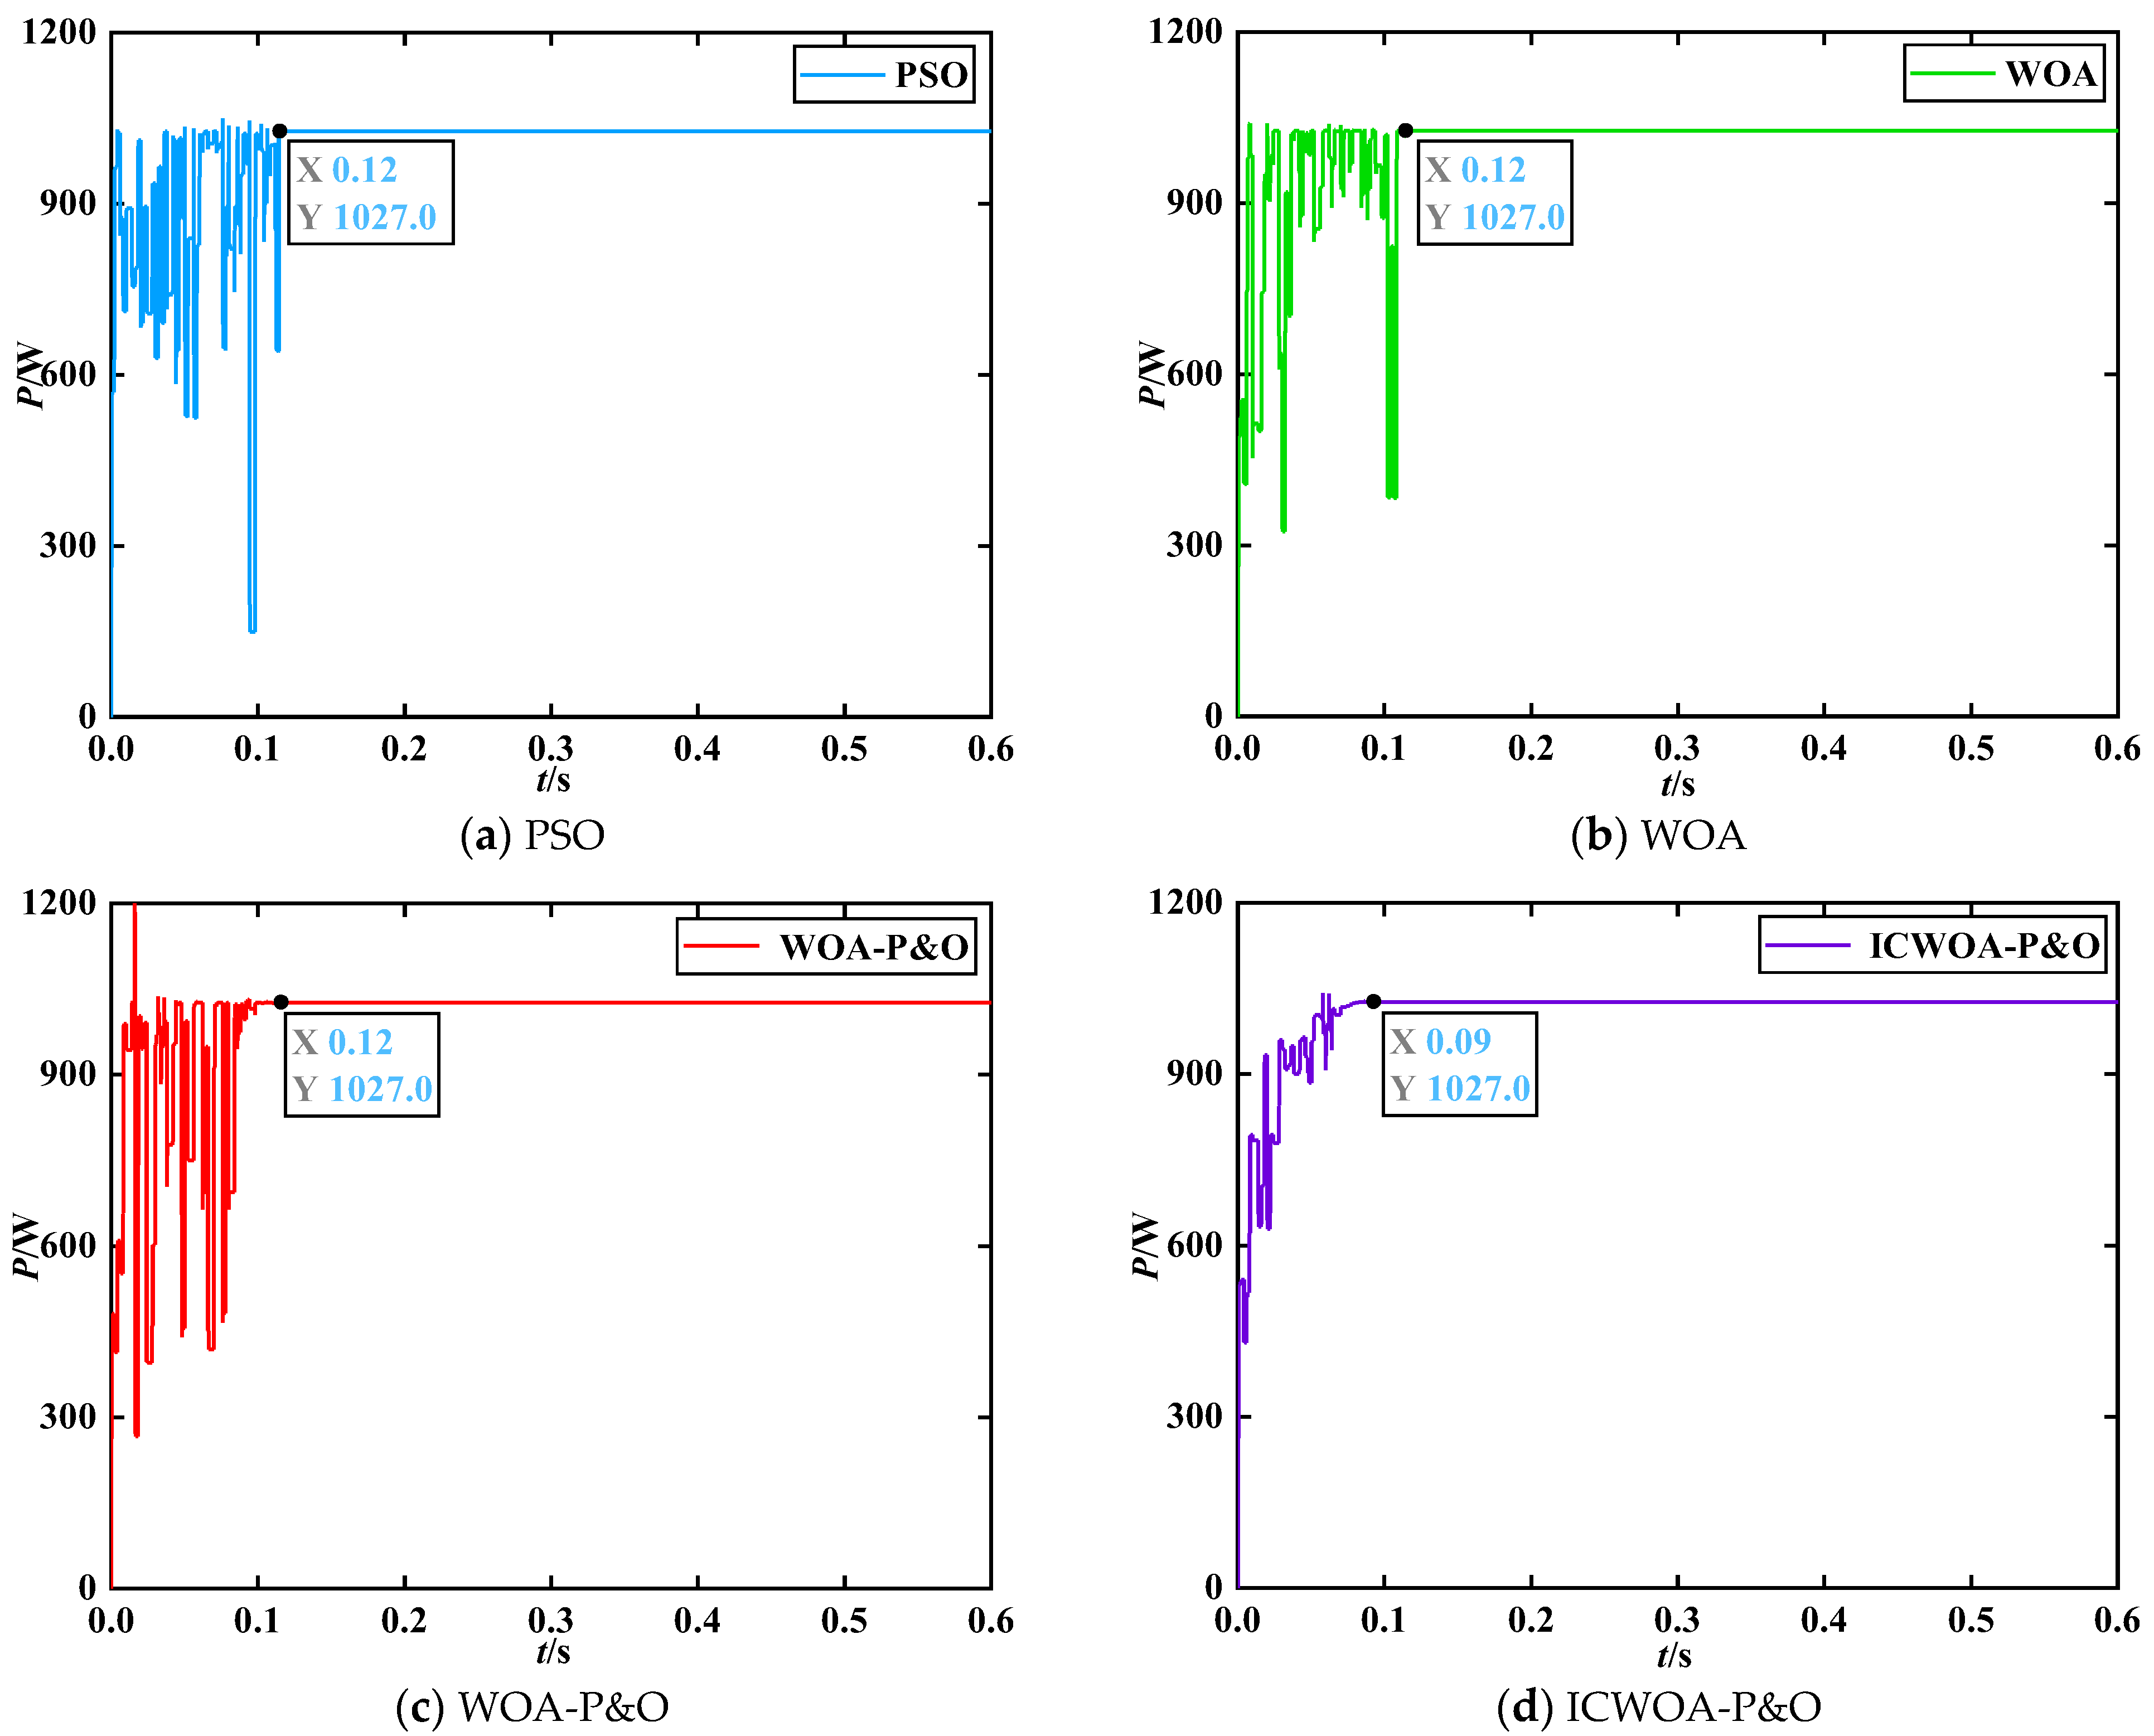
4.1. Simulation Verification and Results Analysis of MPPT Control under Uniform Irradiance

In this paper, six photovoltaic modules are selected, the simulation time is 0.6 s, the temperature is 25 °C, and the irradiance of photovoltaic modules is 800 W/m2. The theoretical value of the system GMPP is 1027 W. The power tracking curves of four algorithms under Condition 2 are obtained through simulation, as shown in Figure 10. The performance comparison of the four algorithms is shown in Table 3.
As shown in Figure 10 and Table 3, all four algorithms can track the GMPP with a value of 1027 W. The tracking time of the WOA, PSO algorithm, and WOA-P&O algorithm is 0.12 s; they take more time and have larger fluctuation and oscillation in the early stage. The tracking time of the ICWOA-P&O algorithm is 0.09 s, which is the shortest. Compared with the previous three algorithms, it significantly shortens the time, improves the convergence speed, and minimizes oscillation fluctuation. Compared with the other three algorithms, the tracking accuracy of the ICWOA-P&O algorithm is further improved.
Relative error (RE) evaluates instantaneous tracking accuracy, reflecting the system’s efficiency in tracking the MPP at a specific moment. The integral of absolute error (IAE) assesses cumulative tracking accuracy, measuring the system’s performance over the entire tracking process. In an MPPT control system, a smaller RE indicates higher precision in tracking the MPP at that particular moment. A smaller IAE signifies that the system performs more accurately throughout the entire tracking process, with less accumulated error and better overall tracking performance. Based on the simulation results, the IAE and RE of the four algorithms are all close to zero, indicating that these algorithms have high tracking accuracy and good tracking performance.

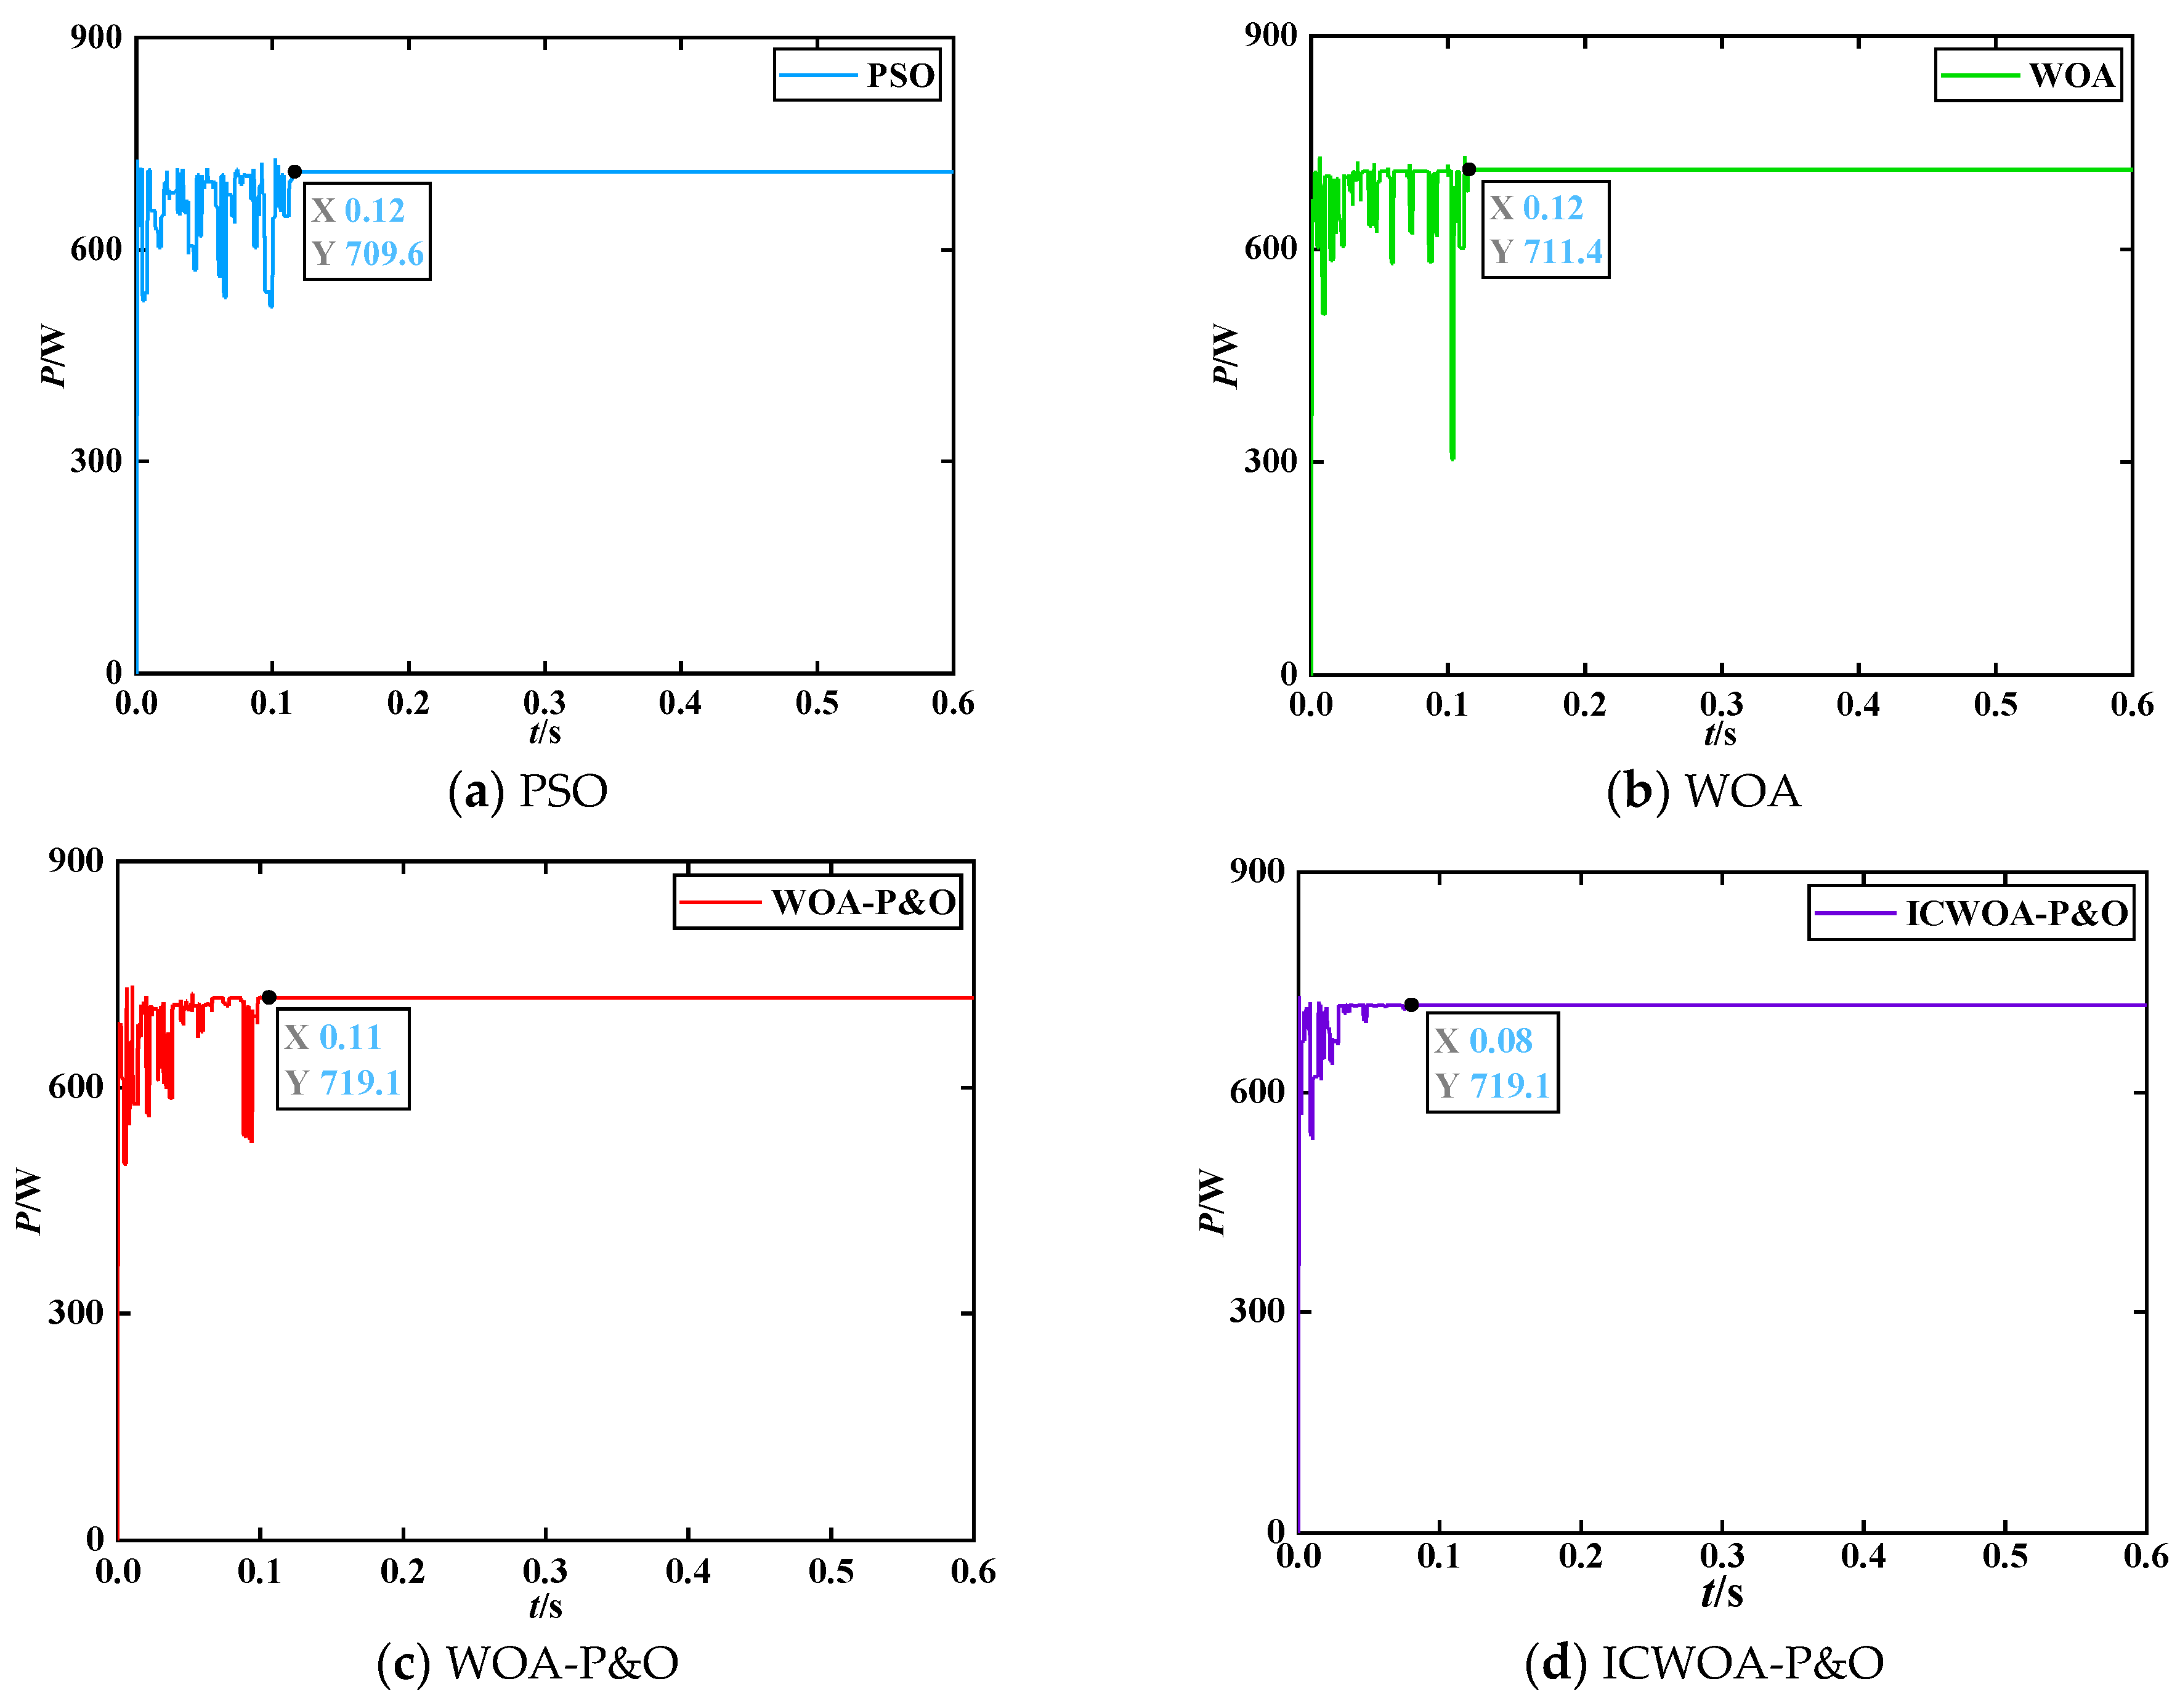
4.2. Simulation Verification and Results Analysis of MPPT Control under Static Local Shading

Under static local shading, the irradiance of each component is not uniform (assuming that the temperature of all PV modules is the same and remains constant during the simulation process), and due to the influence of the parallel bypass diode, the output P-V curve presents the characteristics of multiple peaks. To better simulate the static local shadows of the PV system, the operating results at 25 °C are analyzed. Condition 3: The irradiance of 1000 W/m2, 1000 W/m2, 800 W/m2, 800 W/m2, 600 W/m2, and 400 W/m2 is applied to PV modules #1, #2, #3, #4, #5, and #6, respectively, and the theoretical value of the system is 719.1 W. The power tracking curves of the four algorithms under Condition 3 are obtained through simulation, as shown in Figure 11. The performance comparison of the four algorithms is shown in Table 4.
As shown in Figure 11 and Table 4, both the ICWOA-P&O algorithm and WOA-P&O algorithm can accurately track the theoretical GMPP at 719.1 W, achieving a tracking efficiency of 100.00%. The ICWOA-P&O algorithm has a minimum tracking time of 0.08 s, and the WOA-P&O algorithm is 0.11 s, slightly slower than the ICWOA-P&O algorithm. The GMPP tracked by the PSO algorithm is slightly lower at 709.6 W, with a deviation of 9.5 W from the theoretical tracking power values, and a tracking efficiency of 98.69%. Both the PSO algorithm and WOA take an approximate time of 0.12 s. Compared with the ICWOA-P&O algorithm, the other three algorithms have a longer tracking time, slower convergence, larger power fluctuations, and lower tracking efficiency. The IAE and RE values of the WOA-P&O and ICWOA-P&O algorithms are close to zero, while PSO has the highest values. This indicates that the proposed hybrid algorithm demonstrates excellent tracking accuracy and performance.

4.3. Simulation Verification and Results Analysis of MPPT Control under Dynamic Shading

The irradiance received by the PV array usually changes in practical applications. Under the sudden change in irradiance, four algorithms are compared and analyzed under dynamic working conditions. The irradiance variation conditions experienced are shown in Figure 12.
T is 25 °C. At 0.2 s, the irradiance of six PV modules changes from 650 W/m2 to 1100 W/m2. At 0.4 s, the irradiance changes from 1100 W/m2 to 450 W/m2. The output curves are shown in Figure 13.
When the irradiance is 450 W/m2, the Vpv is 175.0 V, the Ipv is 3.317 A, and the Ppv is 580.6 W at the MPP. When the irradiance is 650 W/m2, the Vpv is 175.1 V, the Ipv is 4.786 A, and the Ppv is 837.7 W at the MPP. When the irradiance is 1100 W/m2, the Vpv is 172.6 V, the Ipv is 8.067 A, and the Ppv is 1393.0 W at the MPP. The tracking curves of each calculation rate under sudden changes in irradiance are shown in Figure 14. The performance comparison is shown in Table 5.
As shown in Figure 14 and Table 5, the ICWOA-P&O model accurately tracks the theoretical MPP with the minimum deviation under a sudden change in irradiance. In the first stage, all four algorithms can accurately track the MPP value of 837.7 W, and the IAE and RE of the four algorithms are all close to zero. The longest tracking time of the PSO algorithm and WOA is 0.12 s and the tracking time of the WOA-P&O algorithm is 0.11 s. The power oscillations of the three algorithms are significant. However, the tracking time of the ICWOA-P&O model is smaller than the other three algorithms, with the shortest tracking time of 0.07 s and smaller power oscillation.
In the second stage, the ICWOA-P&O algorithm and the WOA can track near MPPs with a value of 1392.6 W, and both the IAE and RE values are the smallest among the four algorithms. The deviation of 0.4 W is closest to the MPP, but the tracking time of the ICWOA-P&O algorithm is 0.1 s and the WOA is 0.12 s. Compared with the ICWOA-P&O algorithm, the WOA takes 0.02 s longer and has a larger power oscillation amplitude. The tracking power of the PSO algorithm and WOA-P&O algorithm is 1392.5 W, achieving a tracking efficiency of 99.96%. The PSO algorithm takes 0.12 s and the WOA-P&O algorithm takes 0.11 s. Therefore, the ICWOA-P&O algorithm is the fastest, and the PSO algorithm and WOA are the slowest in terms of tracking speed. Regarding power oscillation, the ICWOA-P&O algorithm is the smallest and superior to the other three algorithms.
In the third stage, the WOA-P&O algorithm takes 0.11 s and has a tracking power value of 578.6 W, which is the largest deviation value of 2.0 W among the four algorithms. The PSO algorithm and the WOA take 0.12 s, with the tracking power values of 579.8 W and 580.4 W. The ICWOA-P&O algorithm can accurately track the power value of 580.6 W within 0.09 s, achieving a tracking efficiency of 100.00%, and the IAE and RE are close to zero. In summary, compared with the other algorithm, the ICWOA-P&O algorithm exhibits faster convergence speed, stronger optimization ability, and more stable maximum power output. The IAE and RE of the ICWOA-P&O algorithm are the smallest in all three stages, demonstrating better tracking performance and accuracy compared to the other three algorithms.

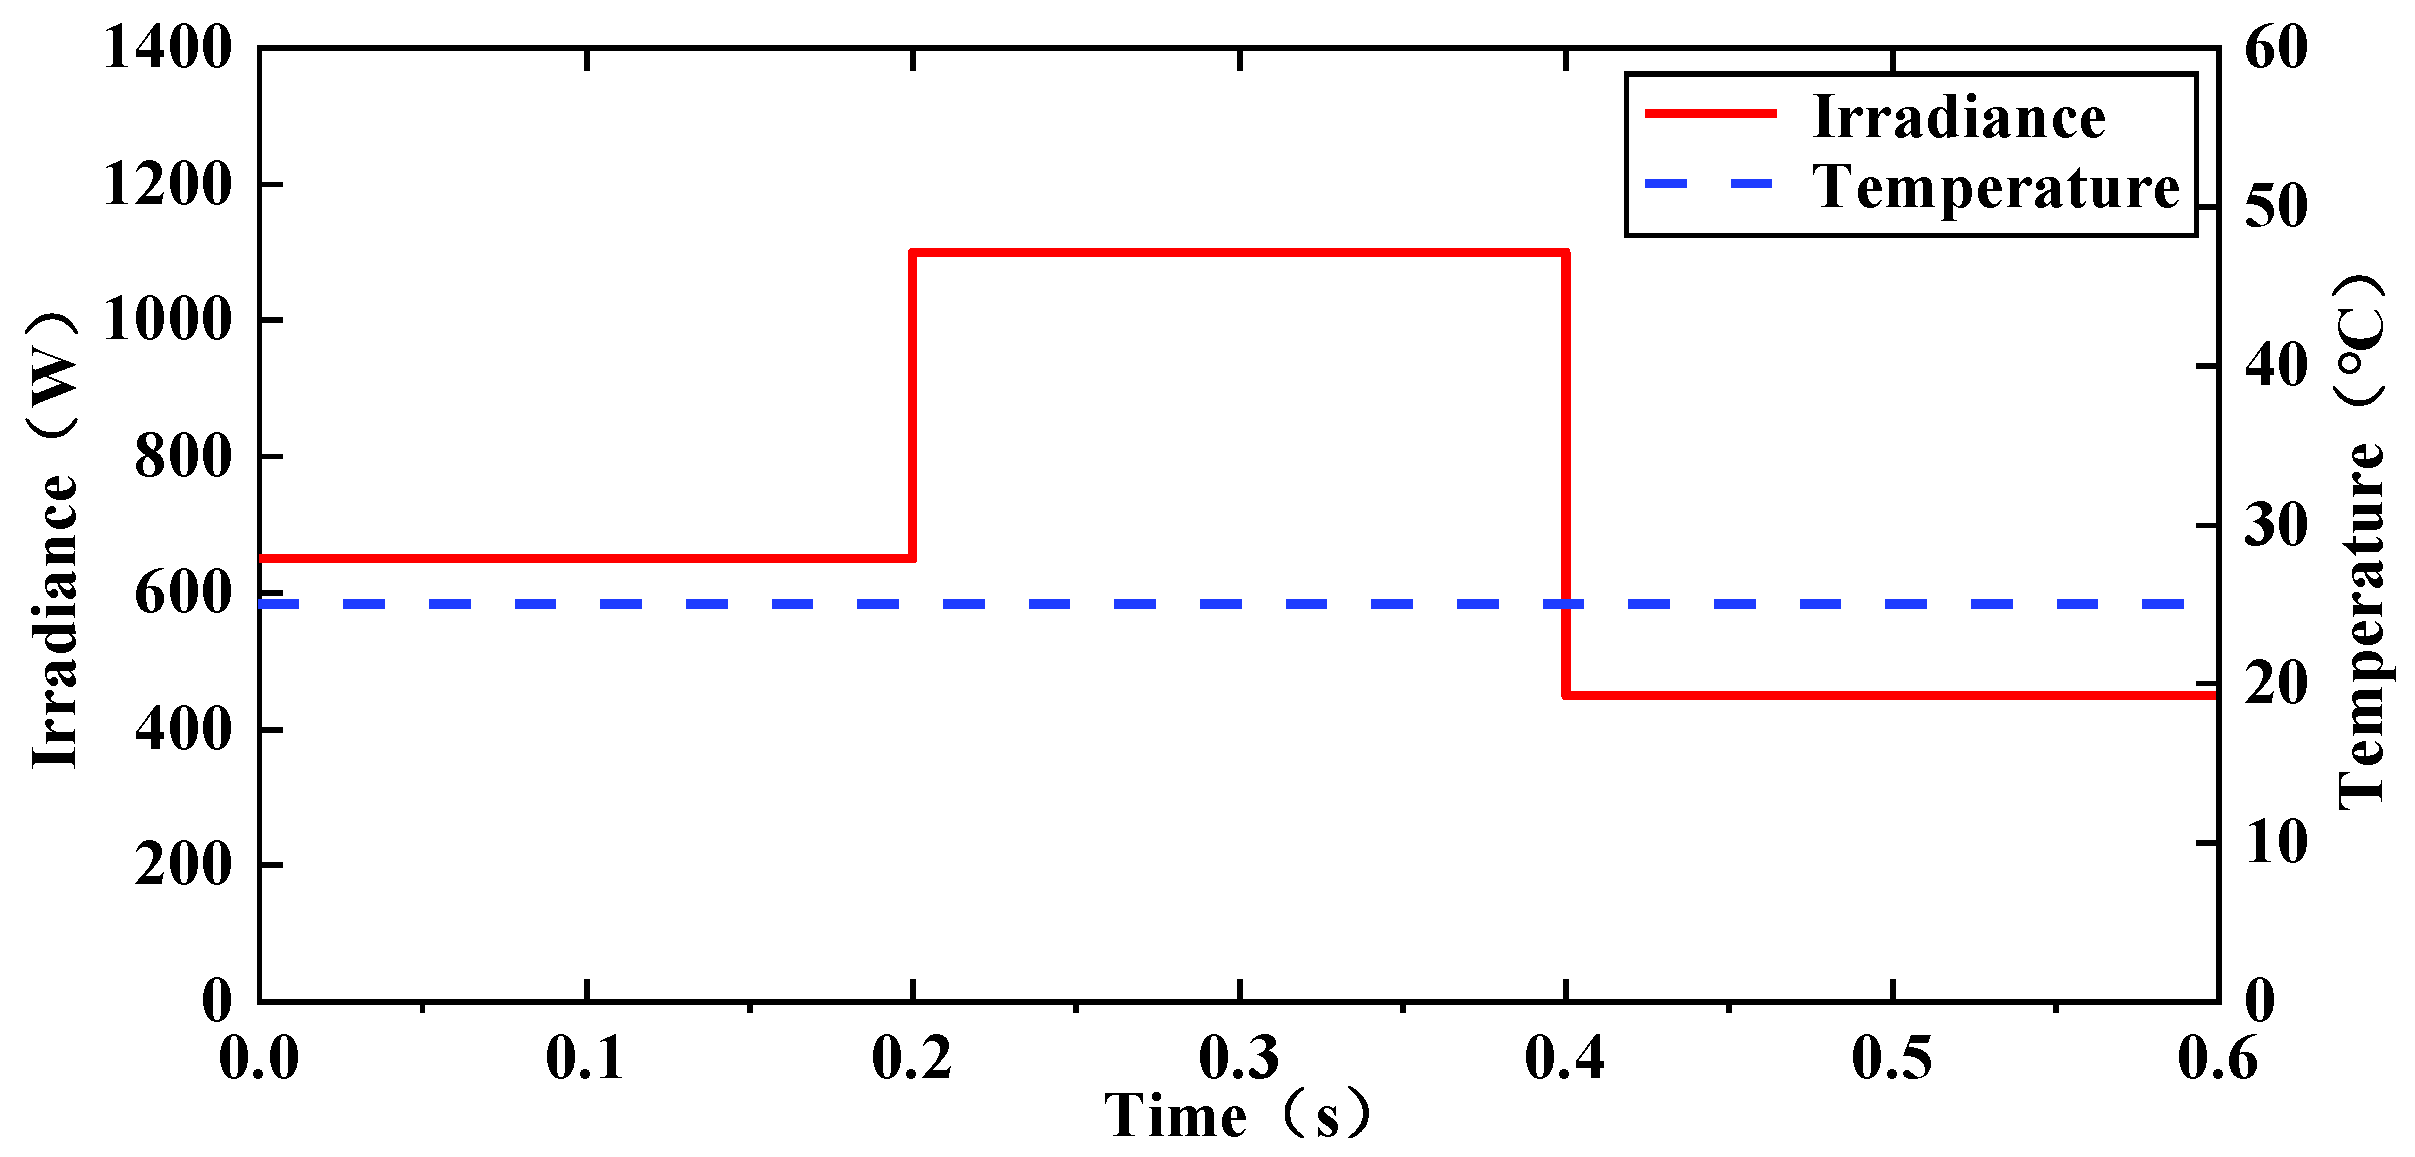
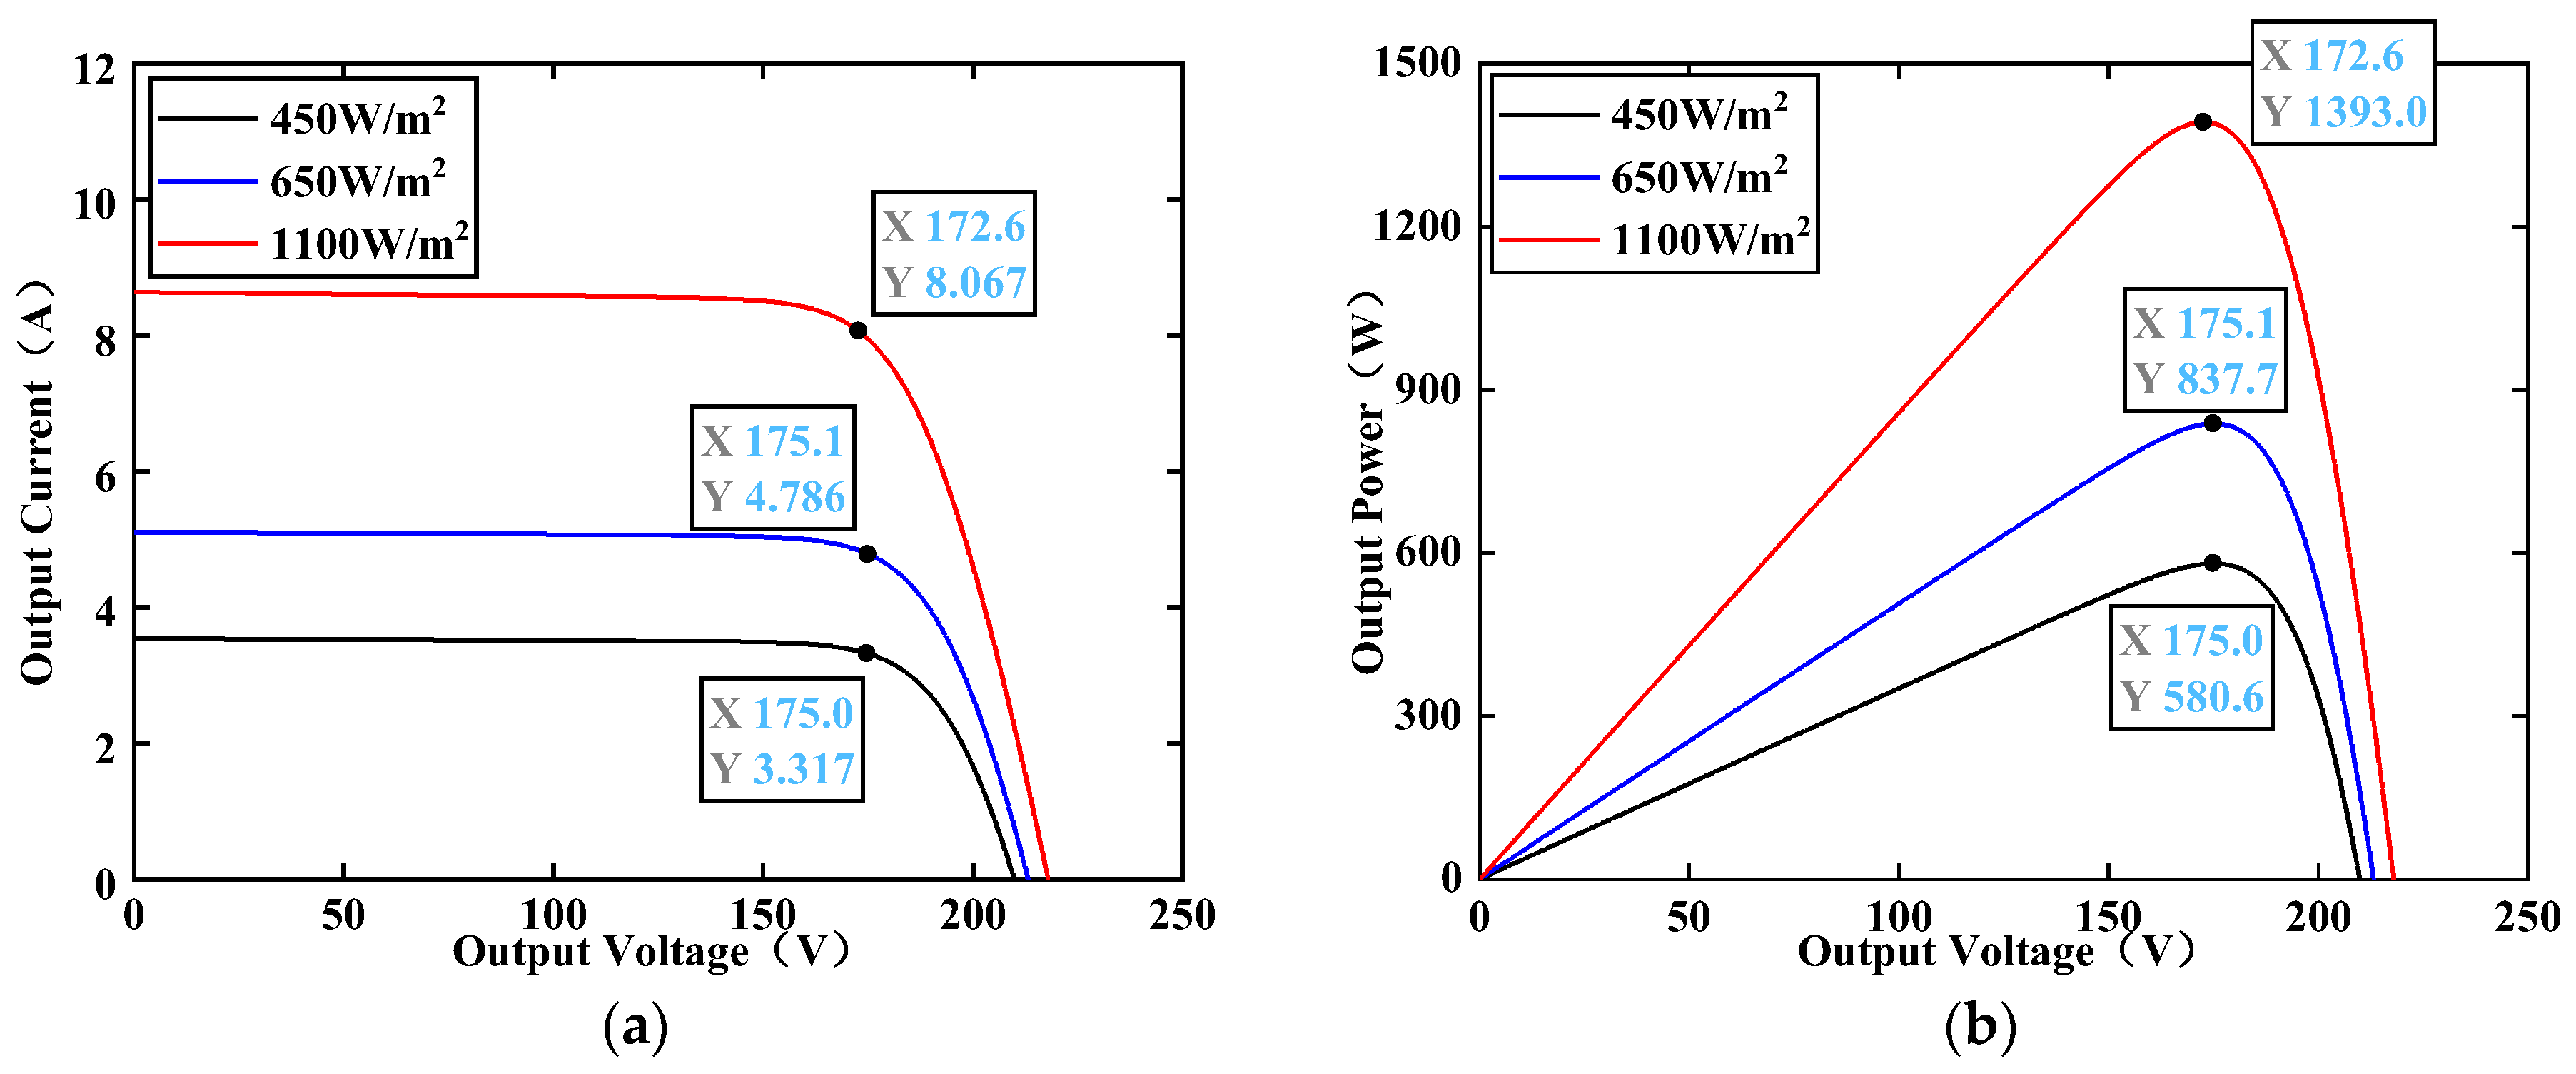
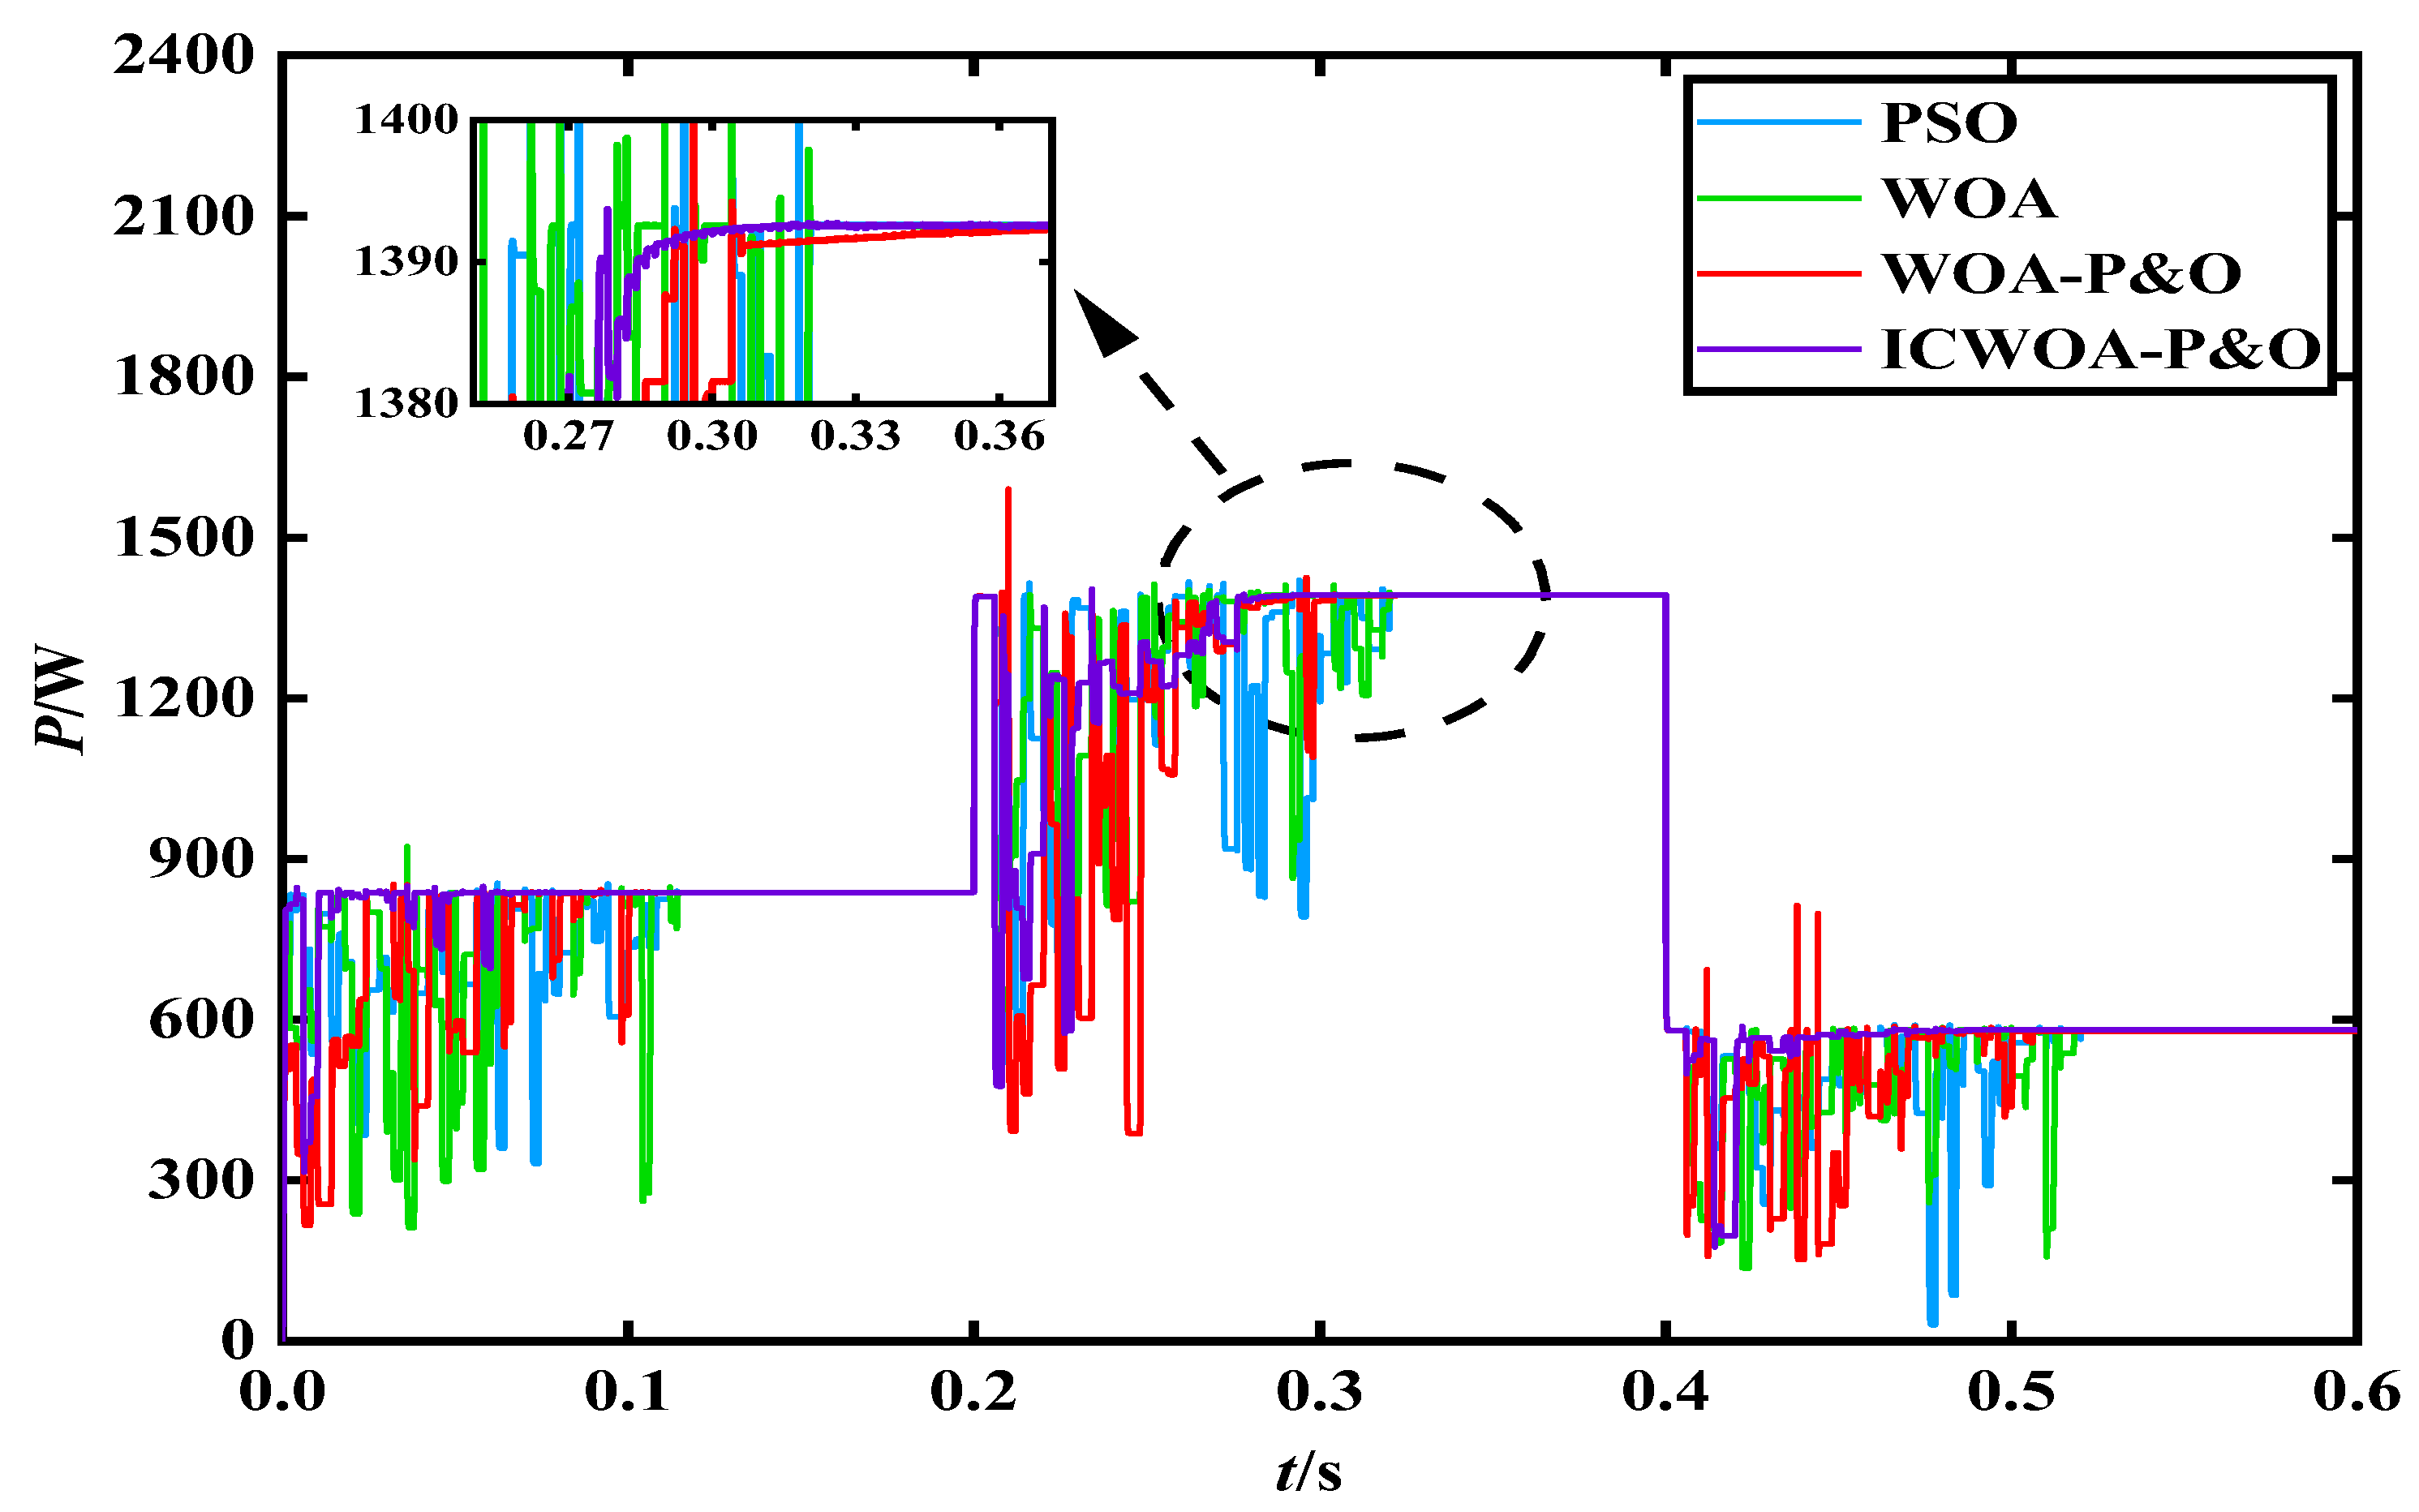
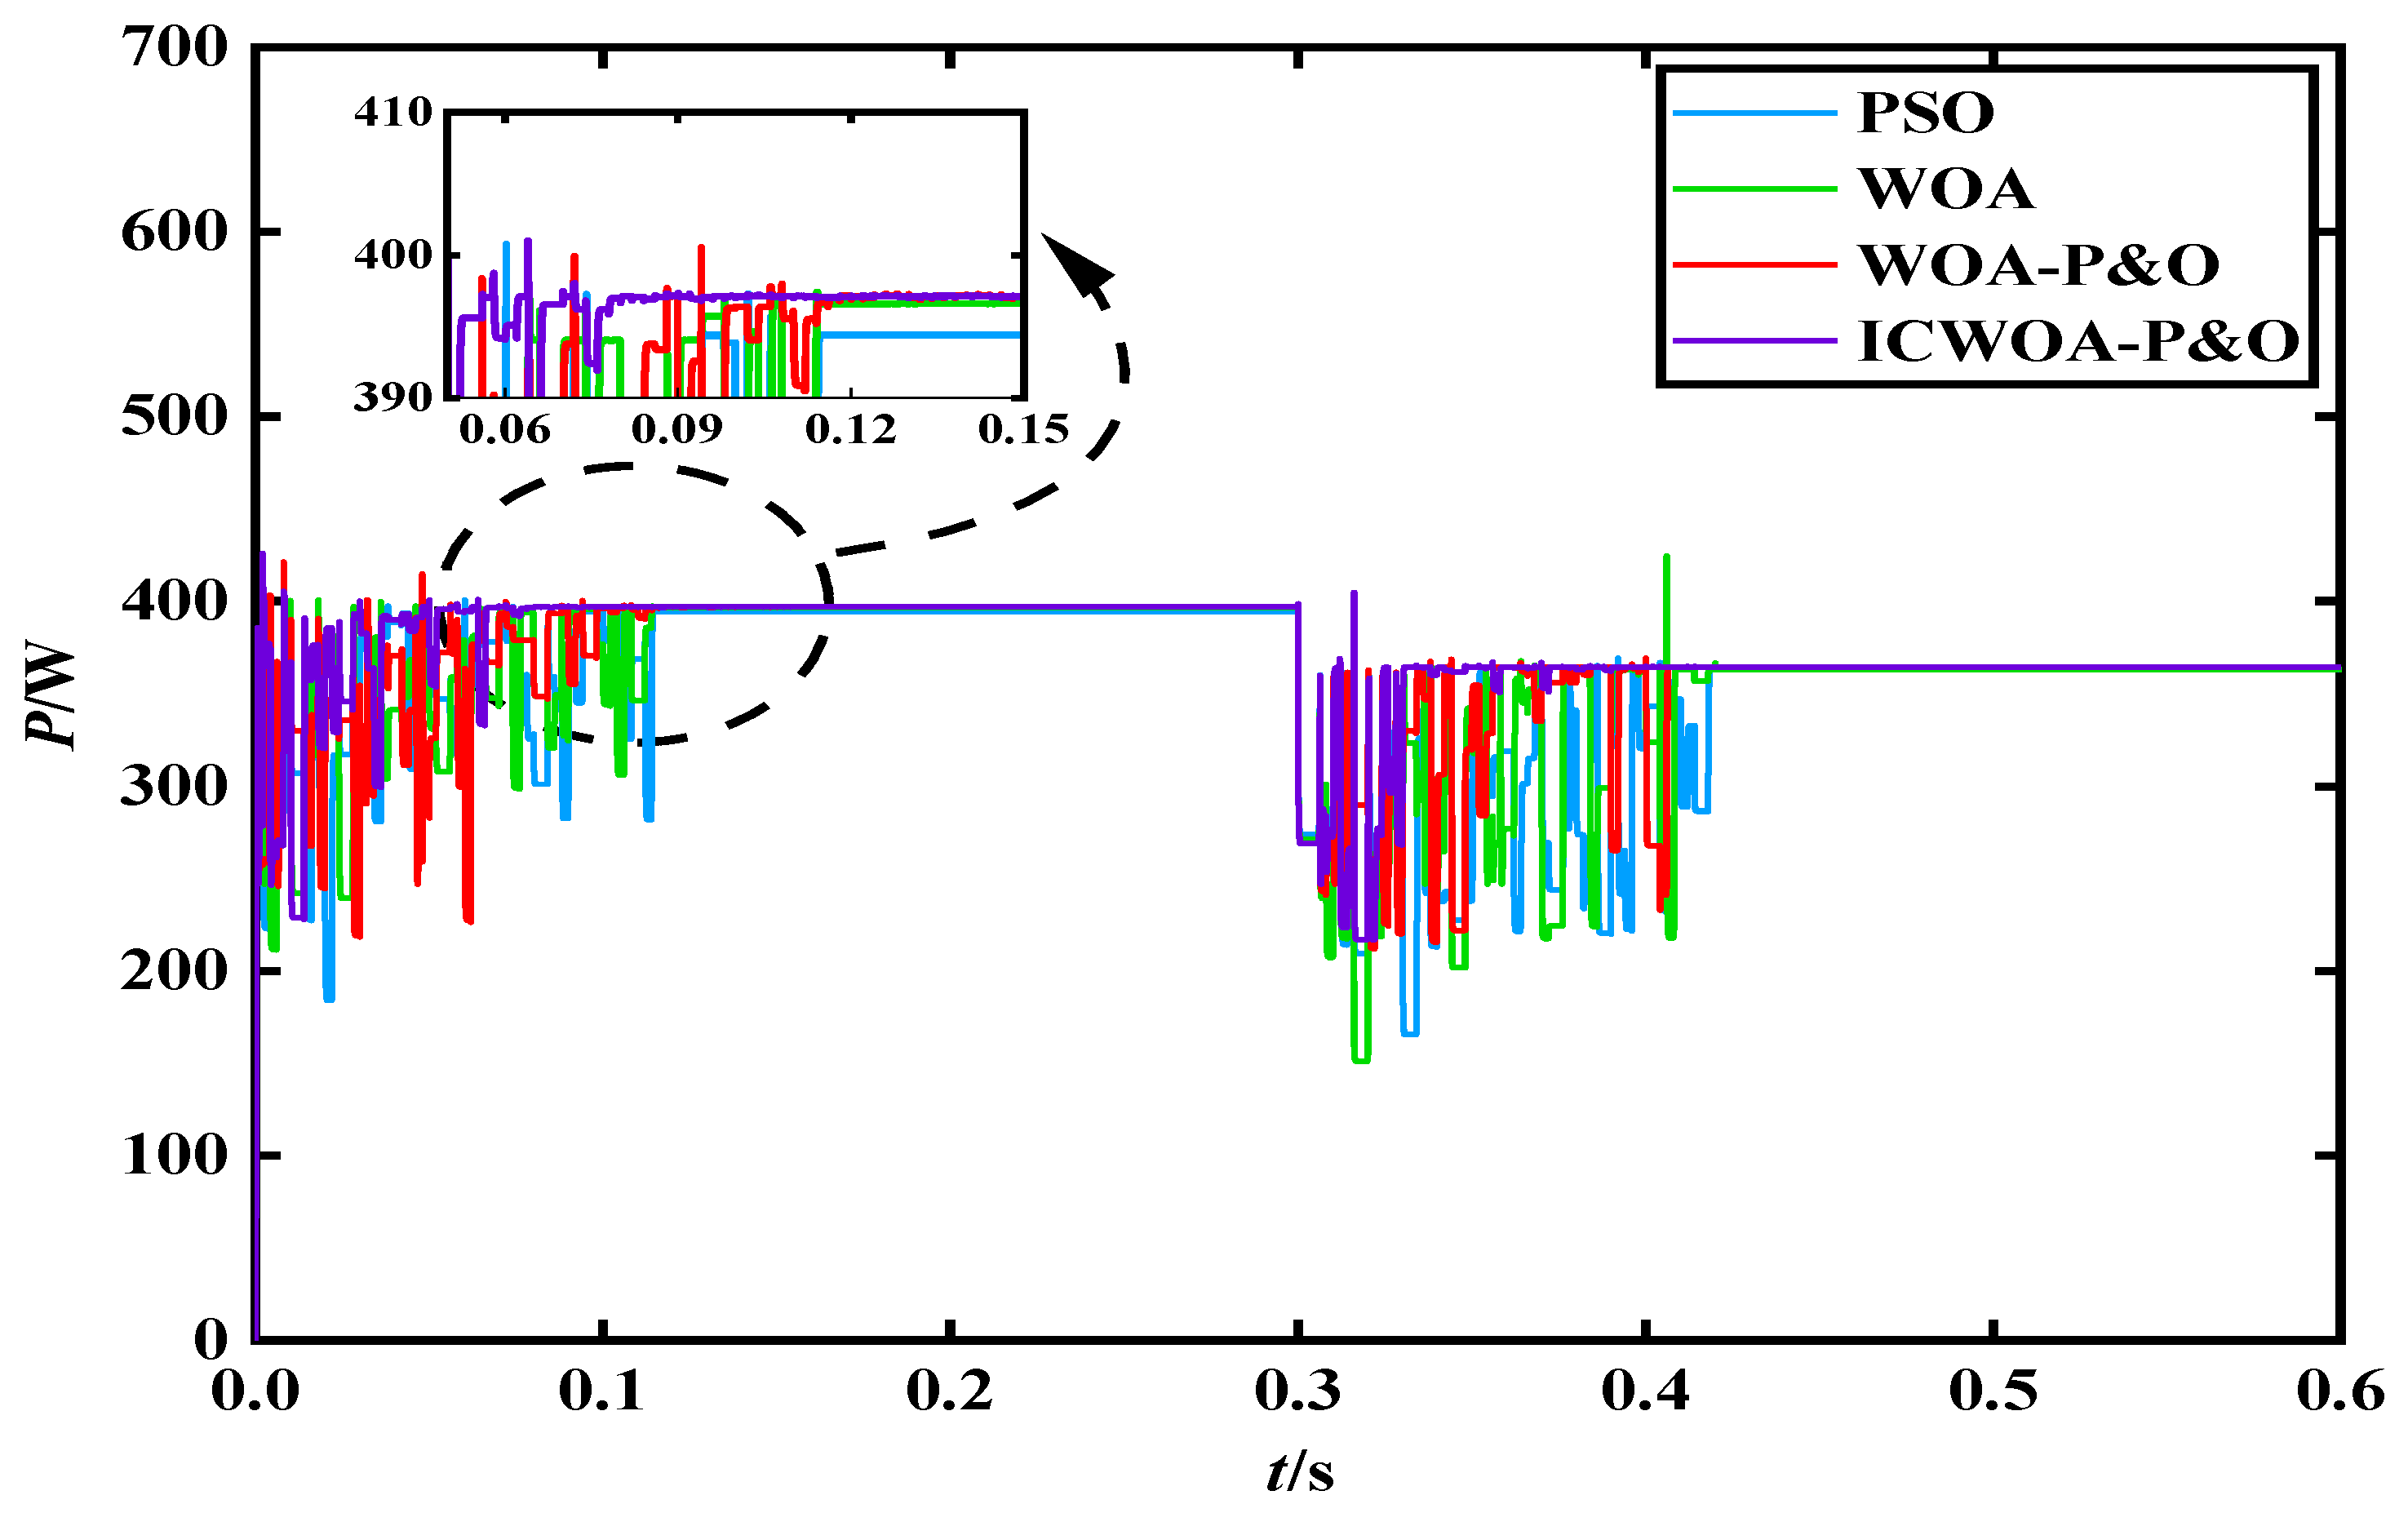
4.4. Simulation Verification and Results of MPPT Control under Sudden Changes in Irradiance and Temperature

To further verify the influence of the external environment on the PPV characteristics of MPP, the temperature T and irradiance S of the PV array are set: when t = 0–0.3 s, T = 35 °C and S is Condition 4; and when t = 0.3 s–0.6 s, T and S change abruptly, with T = 25 °C and S equaling 1000 W/m2, 400 W/m2, 500 W/m2, 200 W/m2, 400 W/m2, or 200 W/m2. The I-V and P-V are shown in Figure 15. As shown in Figure 15, the MPP of the two stages is 379.1 W and 364.6 W.
The tracking curves of each calculation rate are shown in Figure 16. The performance comparison of the four algorithms is shown in Table 6. Both the ICWOA-P&O algorithm and the WOA-P&O algorithm can accurately track GMPPs, but the ICWOA-P&O algorithm has the fastest tracking time, with both phases not exceeding 1 s and smaller power oscillations. The PSO algorithm and the WOA have some deviations from the theoretical value of the system, with a longer tracking time and a larger amplitude near the GMPP.
As shown in Table 6, the IAE and RE values for both the WOA-P&O and ICWOA-P&O algorithms are zero. The results shows that the ICWOA-P&O algorithm has superior tracking performance. The ICWOA-P&O algorithm has improved the WOA and significantly increased the optimization speed.

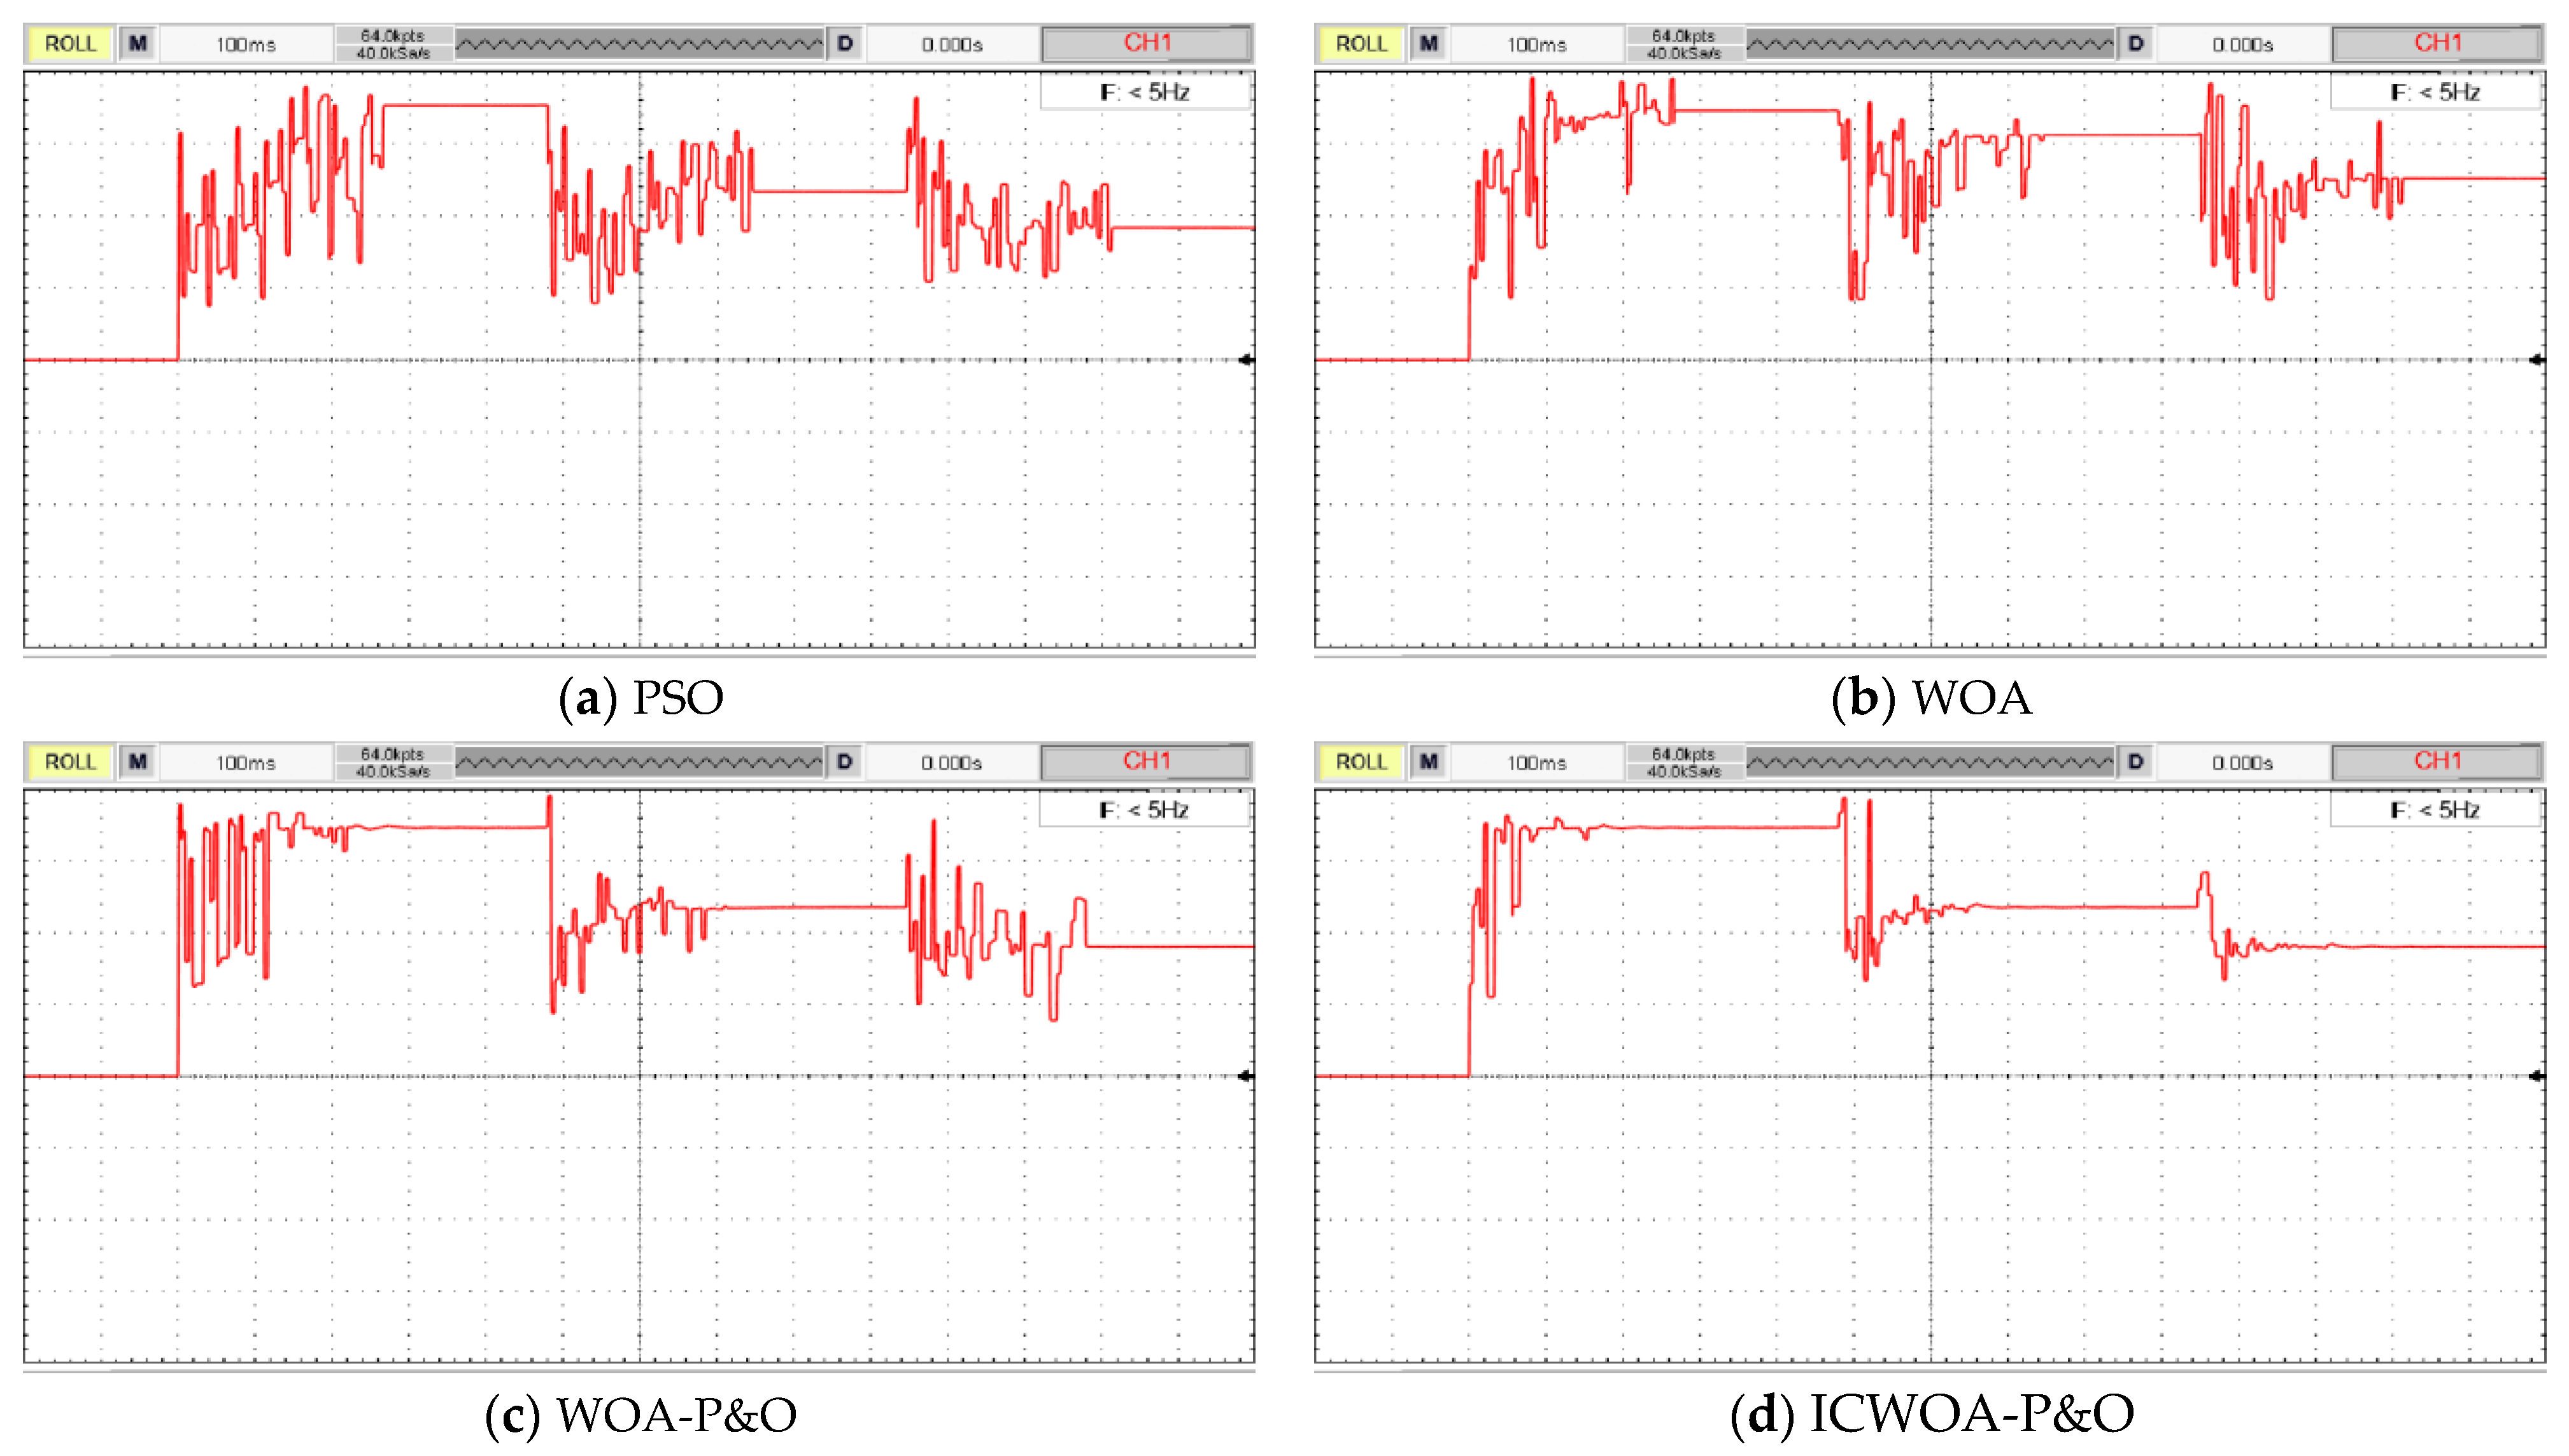
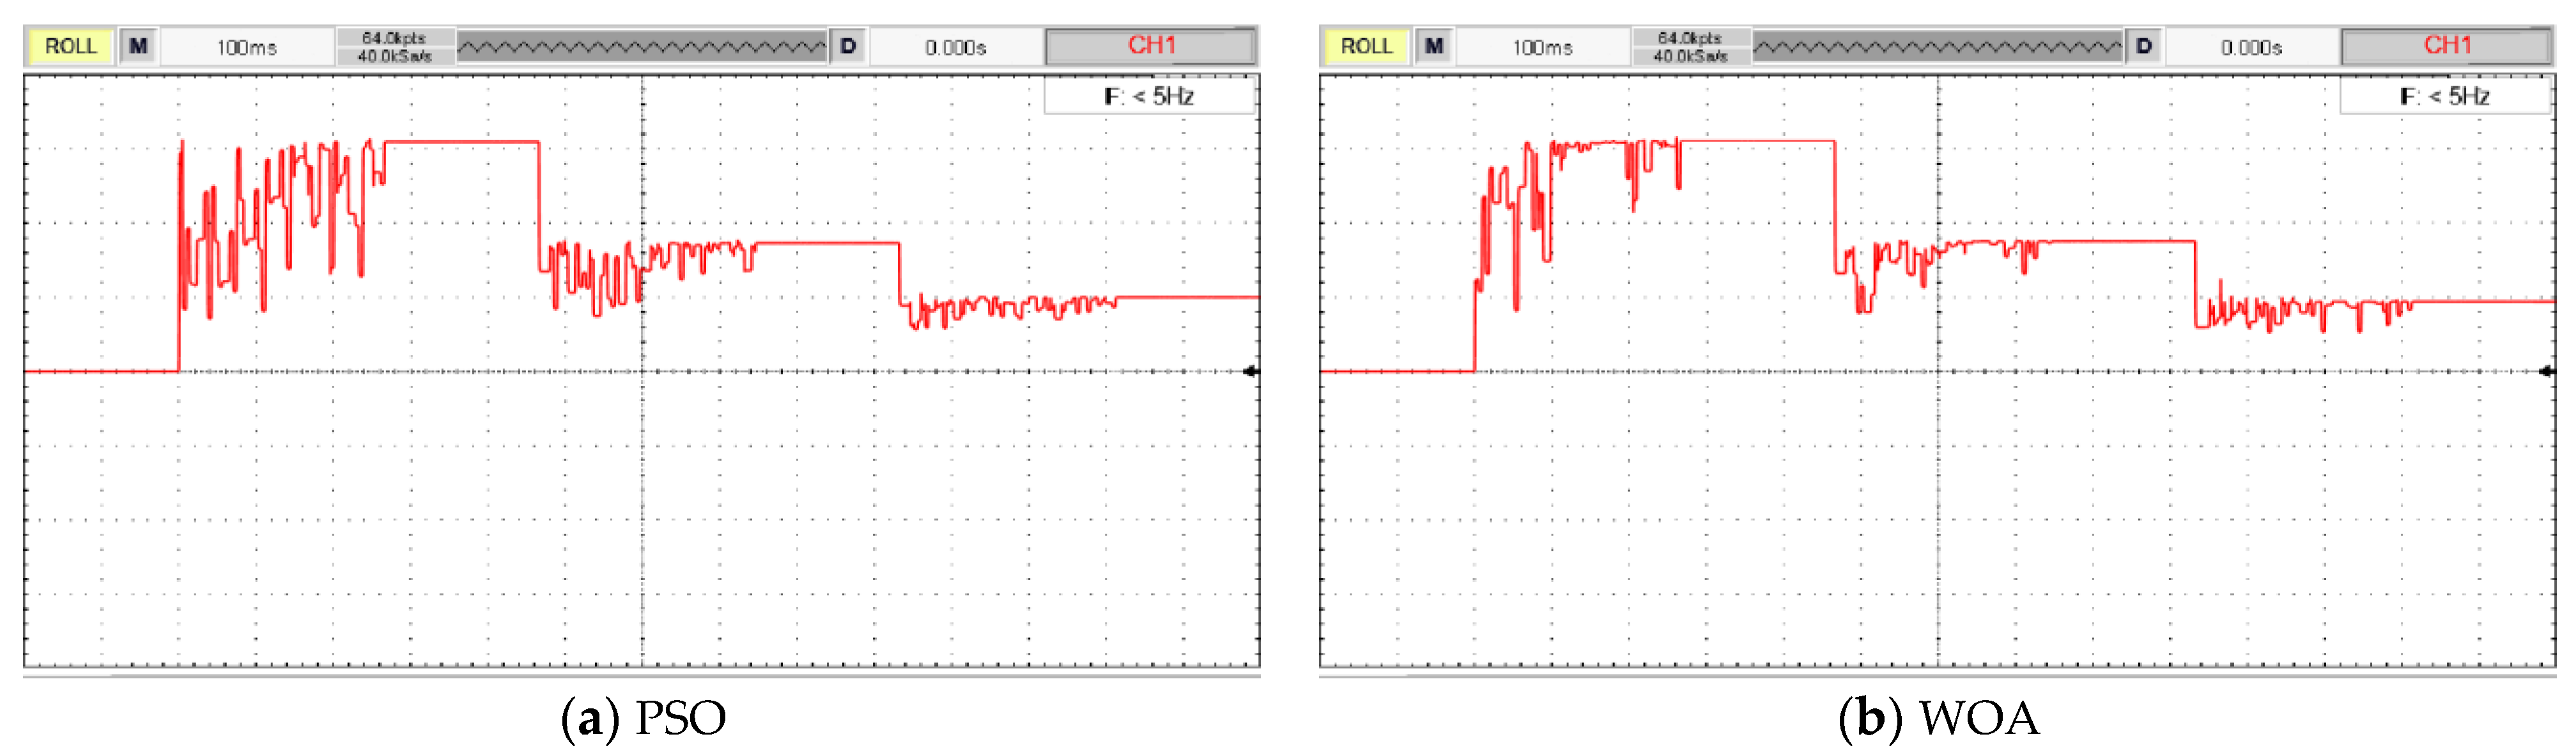
5. Experimental Results

To further verify the validity and reliability of the algorithm as well as its realizability on the basis of simulation, this study embedded the ICWOA-P&O-based control algorithm on the designed MPPT controller hardware, built an actual PV experimental platform based on the ICWOA-P&O control algorithm, and carried out practical experiments.
In conducting MPPT control experiments, a range of equipment and devices are used to simulate the environment of a real photovoltaic system for testing and verifying the performance of the MPPT algorithm. The following list describes the main equipment used for conducting the MPPT control experiments and the role of each device:
  • Photovoltaic Simulator: The PV simulator can set different solar irradiance and temperature conditions to test the adaptability of the MPPT algorithm under various environmental changes.
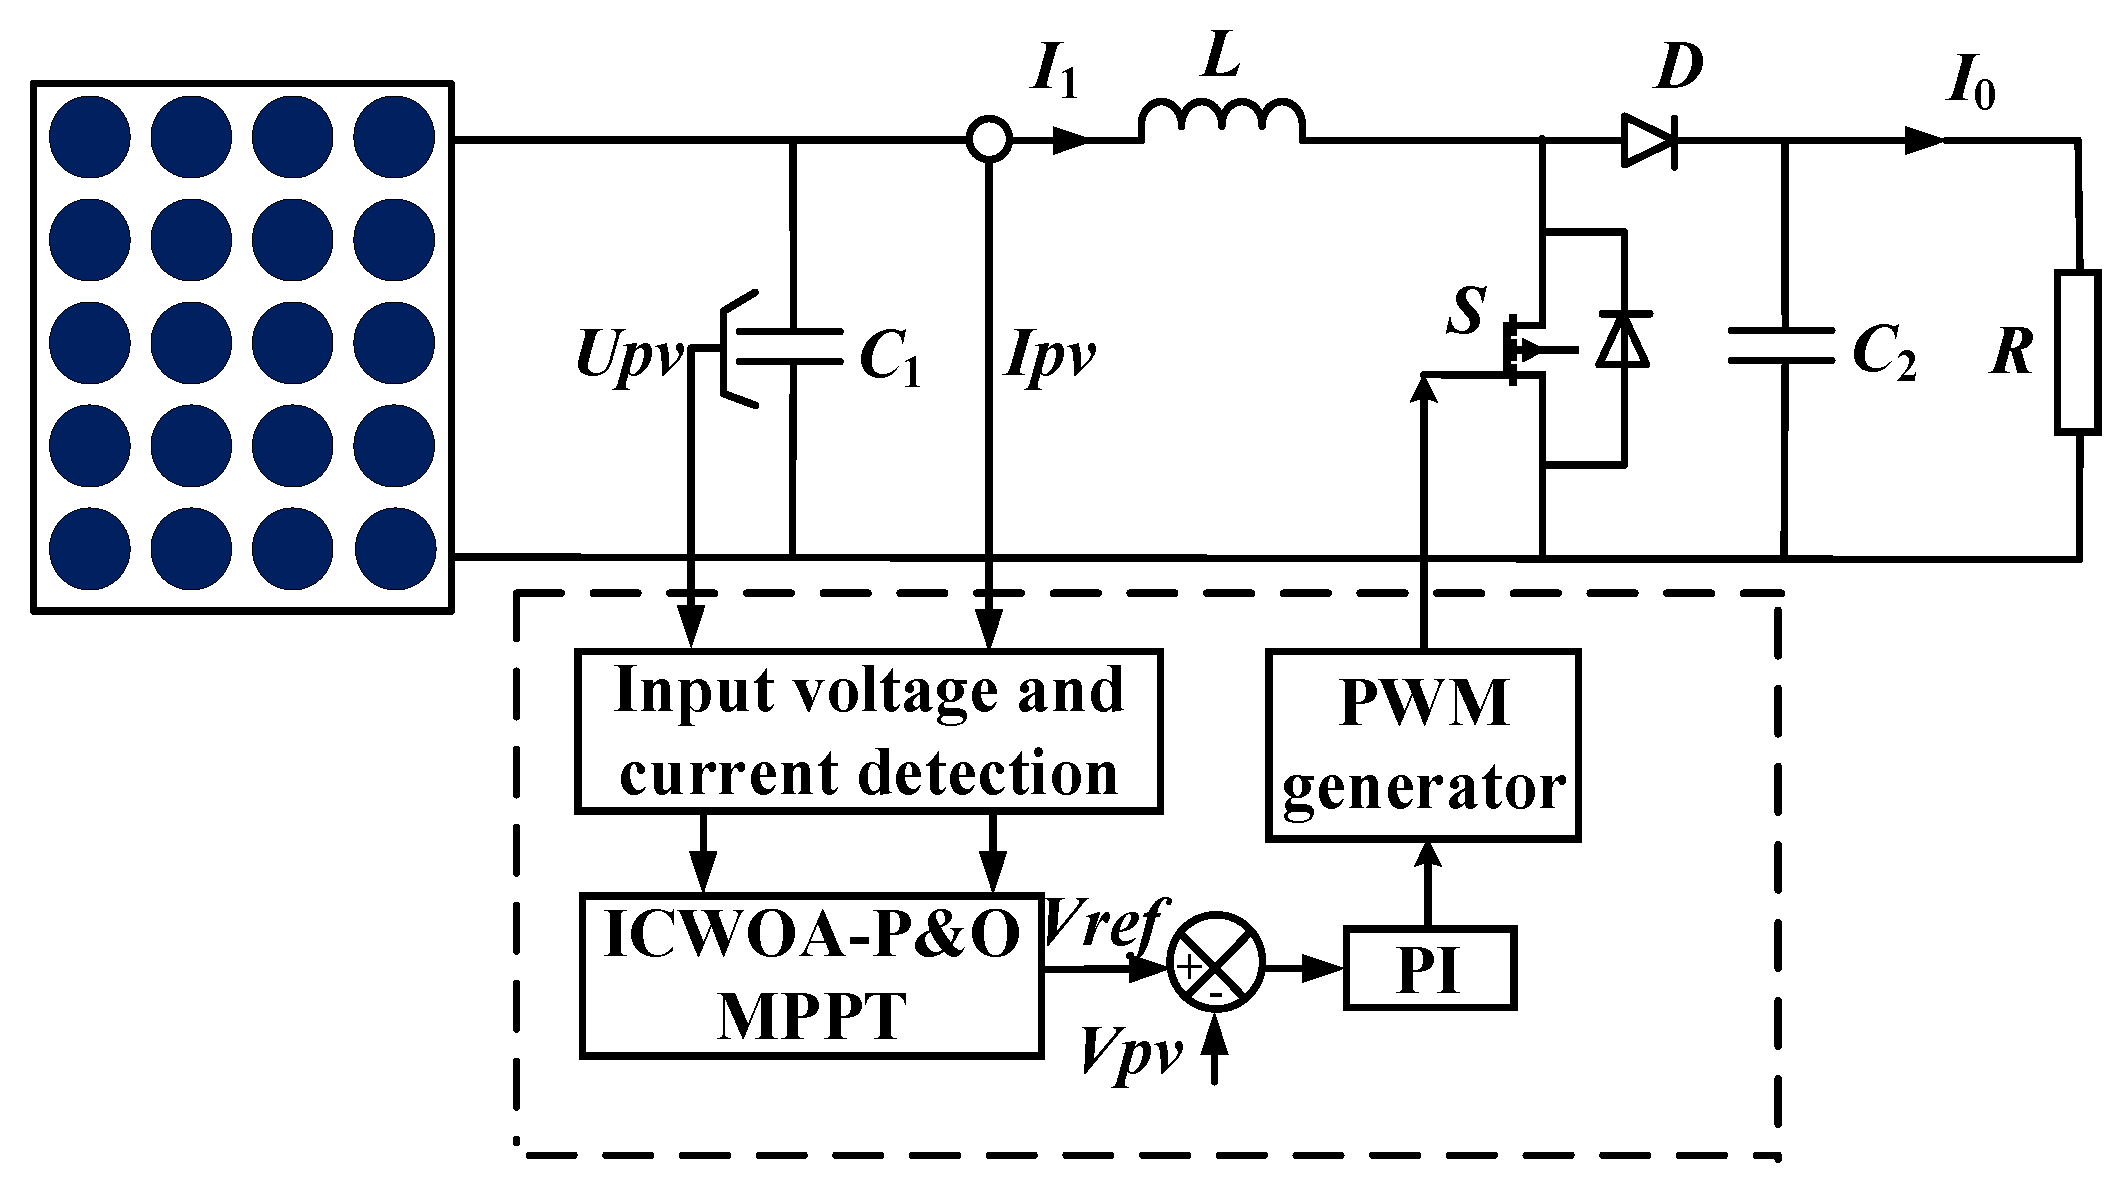
  • Boost Circuit: By varying the duty cycle, the input voltage is controlled to adjust the output current so that the system operates near the MPP.
  • DSP Controller: The DSP controller is the core execution unit of the MPPT control algorithm. It runs the MPPT algorithm and calculates and adjusts the duty cycle of the boost converter in real time to track the MPP.
  • Transducer: The transducer is used to measure the voltage and current at the output of the PV array in real time, which serves as the basis for MPPT control and algorithm performance evaluation.
  • Load: The load simulates the load conditions of the PV system. It is used to observe and analyze the performances and response speeds of the MPPT algorithm under load changes.
  • Scopes: Scopes are used in MPPT control experiments to monitor and visualize changes in electrical signals in real time. Through scopes, the signal’s voltage waveforms, power waveforms, transient response, noise and stability, etc., can be observed, thus fully understanding the dynamic behaviors of the MPPT control process.
The schematic structure for building the experimental simulation system is shown in Figure 17.
PV simulators are used to simulate the output characteristics of real PV panels. By adjusting the parameters, the PV simulator is able to provide outputs with electrical characteristics similar to those of real PV modules under different conditions for laboratory and R&D testing. PV simulators are often programmable, allowing different types and sizes of PV modules to be simulated by entering different parameter settings. This allows the user to customize the test conditions of the PV system according to actual needs. PV simulators can simulate PV output characteristics under different solar irradiation conditions by adjusting irradiance parameters. Temperature affects the performance of a PV module, and a PV simulator can be used to set temperature parameters to simulate electrical characteristics at different temperatures. The output of an actual PV module may change dynamically due to shading, cloud cover, and other environmental factors. By quickly adjusting the output response, the PV simulator can simulate these transient behaviors and provide reliable data support for MPPT algorithm testing and other dynamic analyses. The PV simulator simulates the I-V curves of a PV array under various conditions by accurately controlling the VPV and IPV, so as to test the performance of PV system components in a laboratory environment.
In order to match the previous simulation, the irradiance settings in the experiment are consistent with the simulation settings. The experiment is conducted under dynamic changes in light irradiance from Condition 1 to Condition 3 and then to Condition 4, with a running time of 1.4 s and a change in the operating condition every 0.4 s. The MPP theoretical output voltage and theoretical output power under the three conditions are shown in Table 7.
The output voltage and power tracking curves of the PSO algorithm, WOA, WOA-P&O algorithm, and ICWOA-P&O algorithm are monitored, and the specific results are shown in Figure 18 and Figure 19. The actual tracking results of the four algorithms are shown in Table 8.
From Figure 18 and Figure 19 and Table 8, it can be seen that the ICWOA-P&O algorithm achieves better results in the experimental application of MPPT control than the WOA-P&O algorithm, WOA, and PSO algorithm. According to the comprehensive tracking data, the PSO algorithm, WOA, and WOA-P&O algorithm have longer tracking times than the ICWOA-P&O algorithm. The three algorithms require more than 2 s in all three stages, whereas the ICWOA-P&O algorithm requires less than 2 s. The tracking performance of the ICWOA-P&O algorithm is superior to the other three algorithms. The RE and IAE of the PSO algorithm and WOA are not zero in all three stages, with errors typically exceeding 0.3% and 3 J. In contrast, the relative error of the ICWOA-P&O algorithm in the first and third stages is about 0%, indicating the smallest error. Regarding volatility, experimental simulation results show that the ICWOA-P&O algorithm has lower volatility. The ICWOA-P&O algorithm can significantly improve the tracking speed and greatly enhance the efficiency of the PV power generation system.

6. Conclusions

This paper proposes an MPPT control method in a PV power generation system based on the ICWOA-P&O algorithm. Firstly, the IWOA was used to improve the global search for the GMPP, and the P&O algorithm was used to accurately track the GMPP with a faster convergence speed. Through simulation analysis of changes in the scene environment, the algorithm demonstrated better optimization performance. Therefore, the following conclusions are drawn:
(1)
The ICWOA-P&O algorithm can accurately and quickly track the GMPP under changing environmental conditions, with small power oscillation fluctuation, reducing the power loss in the optimization process, thereby improving the photoelectric conversion rate, reducing the power generation cost, and bringing high economic benefits in practical engineering applications.
(2)
In terms of tracking speed, the ICWOA-P&O algorithm is significantly enhanced, especially in the case of sudden changes in irradiance or temperature and irradiance simultaneously; the convergence time of the ICWOA-P&O algorithm is less than 0.1 s.
(3)
The simulation results under four different conditions demonstrate that the ICWOA-P&O algorithm exhibits excellent performance in fast tracking and significantly reducing oscillations, even under various environmental changes. For instance, the tracking efficiencies of the PSO algorithm and WOA under static partial shading conditions are 98.69% and 98.93%, respectively. In contrast, the proposed hybrid ICWOA-P&O control technique stands out in terms of robustness and steady-state power tracking, with a tracking efficiency close to 100%, showcasing superior performance in trajectory control and tracking.
(4)
To further verify the performance of the proposed ICWOA-P&O algorithm, MPPT controller hardware corresponding to the previous model was designed, and an actual PV MPPT control experimental platform was built; the control algorithm was embedded into the MPPT controller for experimental verification.
Compared with the other three algorithms, the ICWOA-P&O algorithm has a faster tracking speed and smaller power oscillation, which can effectively improve the reliability and safety of power supply.

Author Contributions

Conceptualization, T.L. and Q.Y.; methodology, T.L.; software, S.L.; validation, T.L., S.L. and Q.Y.; formal analysis, Q.Y. and S.L.; investigation, H.Y. and Z.W.; resources, S.L.; data curation, H.Y. and J.T.; writing—original draft preparation, T.L. and S.L.; writing—review and editing, T.L. and Q.Y.; visualization, Z.W. and J.T.; supervision, T.L.; project administration, Q.Y. and S.L.; funding acquisition, Q.Y. All authors have read and agreed to the published version of the manuscript.

Funding

This work was supported by Liaoning Provincial Education Department Project (LJKMZ20221035, LJKZ0683), Liaoning Provincial Science and Technology Department Project (2023-MS-212), and the National Natural Science Foundation of China (No. 32001415).

Data Availability Statement

Data are unavailable due to privacy.

Acknowledgments

The authors sincerely thank the National Natural Science Foundation of China for their financial support. We are also very grateful to the anonymous reviewers for their valuable comments and suggestions for the improvement of this paper.

Conflicts of Interest

The authors declare no conflicts of interest.

References

  1. Hu, F.; Mou, S.; Wei, S.; Qiu, L.; Hu, H.; Zhou, H. Research on the evolution of China’s photovoltaic technology innovation network from the perspective of patents. Energy Strategy Rev. 2024, 51, 101309. [Google Scholar] [CrossRef]
  2. Li, A.; Liu, W.F.; Li, Y.K.; Gao, C.Y. Research on MPPT control of photovoltaic system based on IP&O-ICS algorithm. J. Sol. Energy 2023, 44, 203–209. [Google Scholar]
  3. Wang, L.S.; Jiang, S.J.; Wang, J.; Ding, X.C. Optimal control of photovoltaic MPPT algorithm based on hybrid strategy. J. Sol. Energy 2016, 37, 1396–1402. [Google Scholar]
  4. Zhang, L.; Hurley, W.G.; Wolfle, W.H. A new approach to achieve maximum power point tracking for PV system with a variable inductor. IEEE Trans. Power Electron. 2010, 26, 1031–1037. [Google Scholar] [CrossRef]
  5. Zhang, S.Z.; Chu, B.Q.; Yuan, X.F.; Guo, L. Research on photovoltaic array model analysis and maximum power point tracking. Autom. Instrum. 2019, 114–116. [Google Scholar] [CrossRef]
  6. Jia, L.Z.; Chen, K.; Li, G.J.; Feng, L.; Jiang, X.C. Research on MPPT algorithm for photovoltaic arrays under local shadowing conditions. J. Sol. Energy 2014, 35, 1614–1621. [Google Scholar]
  7. Wu, D.S.; Wang, L.D.; Liu, T.; Meng, X.F. Neural network-based multi-peak MPPT for photovoltaic arrays. Electr. Meas. Instrum. 2019, 56, 69–74. [Google Scholar]
  8. Fu, W.L.; Meng, J.X.; Zhang, Y.N.; Xu, P. Improved GWO-based PV multi-peak MPPT control under complex shading. J. Sol. Energy 2023, 44, 435–442. [Google Scholar]
  9. Eltamaly, A.M.; Farh, H.M.H. Dynamic global maximum power point tracking of the PV systems under variant partial shading using hybrid GWO-FLC. Sol. Energy 2019, 177, 306–316. [Google Scholar] [CrossRef]
  10. Cai, X.Q.; Chen, X.F. Application of improved disturbance observation method in MPPT of photovoltaic power generation. Electron. Test. 2019, 406, 59–60. [Google Scholar]
  11. Su, Y.G.; Wang, D.C.; Wang, Y.; Jiang, F. Simulation of MPPT control strategy based on improved variable step size conductance increment method. Autom. Technol. Appl. 2019, 38, 11–15. [Google Scholar]
  12. Laxman, B.; Annamraju, A.; Srikanth, N.V. A grey wolf optimized fuzzy logic based MPPT for shaded solar photovoltaic systems in microgrids. Int. J. Hydrogen Energy 2021, 46, 10653–10665. [Google Scholar] [CrossRef]
  13. Nassef, A.M.; Houssein, E.H.; Helmy, B.E.; Rezk, H. Modified honey badger algorithm based global MPPT for triple-junction solar photovoltaic system under partial shading condition and global optimization. Energy 2022, 254, 124363. [Google Scholar] [CrossRef]
  14. Wu, Z.Q.; Cao, B.L.; Hou, L.C.; Hu, X.Y.; Ma, B.Y. Maximum power point tracking of photovoltaic system based on improved multivariate universe optimisation algorithm. J. Electron. Inf. 2021, 43, 3735–3742. [Google Scholar]
  15. Zafar, M.H.; Khan, N.M.; Mirza, A.F.; Mansoor, M.; Akhtar, N.; Qadir, M.U.; Khan, N.A.; Moosavi, S.K.R. A novel meta-heuristic optimization algorithm based MPPT control technique for PV systems under complex partial shading condition. Sustain. Energy Technol. Assess. 2021, 47, 101367. [Google Scholar]
  16. Bermejo, J.F.; Fernández, J.F.G.; Polo, F.O.; Márquez, A.C. A review of the use of artificial neural network models for energy and reliability prediction. A study of the solar PV, hydraulic and wind energy sources. Appl. Sci. 2019, 9, 1844. [Google Scholar] [CrossRef]
  17. Sun, H.; Qiu, C.; Lu, L.; Gao, X.; Chen, J.; Yang, H. Wind turbine power modelling and optimization using artificial neural network with wind field experimental data. Appl. Energy 2020, 280, 115880. [Google Scholar] [CrossRef]
  18. Chiñas-Palacios, C.; Vargas-Salgado, C.; Aguila-Leon, J.; Hurtado-Pérez, E. A cascade hybrid PSO feed-forward neural network model of a biomass gasification plant for covering the energy demand in an AC microgrid. Energy Convers. Manag. 2021, 232, 113896. [Google Scholar] [CrossRef]
  19. Farayola, A.M.; Hasan, A.N.; Ali, A. Efficient photovoltaic MPPT system using coarse Gaussian support vector machine and artificial neural network techniques. Int. J. Innov. Comput. Inf. Control (IJICIC) 2018, 14, 323–329. [Google Scholar]
  20. Ali, M.N. Improved design of artificial neural network for MPPT of grid-connected PV systems. In Proceedings of the 2018 Twentieth International Middle East Power Systems Conference (MEPCON), Cairo, Egypt, 18–20 December 2018; IEEE: Piscataway, NJ, USA, 2018; pp. 97–102. [Google Scholar]
  21. Soufi, Y.; Bechouat, M.; Kahla, S. Fuzzy-PSO controller design for maximum power point tracking in photovoltaic system. Int. J. Hydrogen Energy 2017, 42, 8680–8688. [Google Scholar] [CrossRef]
  22. Subiyanto, S.; Mohamed, A.; Hannan, M.A. Intelligent maximum power point tracking for PV system using Hopfield neural network optimized fuzzy logic controller. Energy Build. 2012, 51, 29–38. [Google Scholar] [CrossRef]
  23. Shi, J.Y.; Ling, L.T.; Xue, F.; Qin, Z.J.; Liu, W.A.; Yang, T. Application of territorial particle swarm algorithm for photovoltaic maximum power tracking. J. Sol. Energy 2019, 40, 2554–2560. [Google Scholar]
  24. Nie, X.H.; Wang, W. Chaotic improved cat swarm algorithm and its application in photovoltaic MPPT. Chin. J. Electr. Eng. 2016, 36, 6103–6110. [Google Scholar]
  25. Mohanty, S.; Subudhi, B.; Ray, P.K. A grey wolf-assisted perturb & observe MPPT algorithm for a PV system. IEEE Trans. Energy Convers. 2016, 32, 340–347. [Google Scholar]
  26. Mathi, D.K.; Ramulu, C. A hybrid global maximum power point tracking method based on butterfly particle swarm optimization and perturb and observe algorithms for a photovoltaic system under partially shaded conditions. Int. Trans. Electr. Energy Syst. 2020, 30, e12543. [Google Scholar] [CrossRef]
  27. Lasheen, M.; Abdel-Salam, M. Maximum power point tracking using Hill Climbing and ANFIS techniques for PV applications: A review and a novel hybrid approach. Energy Convers. Manag. 2018, 171, 1002–1019. [Google Scholar] [CrossRef]
  28. Bhukya, L.; Nandiraju, S. A novel photovoltaic maximum power point tracking technique based on grasshopper optimized fuzzy logic approach. Int. J. Hydrogen Energy 2020, 45, 9416–9427. [Google Scholar] [CrossRef]
  29. Huang, Y.P.; Huang, M.Y.; Ye, C.E. A fusion firefly algorithm with simplified propagation for photovoltaic MPPT under partial shading conditions. IEEE Trans. Sustain. Energy 2020, 11, 2641–2652. [Google Scholar] [CrossRef]
  30. Hassan, A.; Bass, O.; Masoum, M.A.S. An improved genetic algorithm based fractional open circuit voltage MPPT for solar PV systems. Energy Rep. 2023, 9, 1535–1548. [Google Scholar] [CrossRef]
  31. Li, J.Y.; Zhang, W.B.; Zhao, X.Z.; Liu, B.; Zheng, Y.F. Improved whale algorithm to optimise support vector regression for photovoltaic maximum power point tracking. J. Electrotechnol. 2021, 36, 1771–1781. [Google Scholar]
  32. Chen, B.; Wang, J.J.; Zhao, M.Y.; Zhao, F.Z. Research on MPPT control of photovoltaic power generation system based on improved whale optimisation algorithm. J. Power Syst. Autom. 2023, 35, 19–26. [Google Scholar]
  33. Tao, H.; Ghahremani, M.; Ahmed, F.W.; Jing, W.; Nazir, M.S.; Ohshima, K. A novel MPPT controller in PV systems with hybrid whale optimization-PS algorithm based ANFIS under different conditions. Control Eng. Pract. 2021, 112, 104809. [Google Scholar] [CrossRef]
  34. Chen, Y.X.; Vepa, R.; Shaheed, M.H. Enhanced and speedy energy extraction from a scaled-up pressure retarded osmosis process with a whale optimization based maximum power point tracking. Energy 2018, 153, 618–627. [Google Scholar] [CrossRef]
  35. Sun, R.X.; Shang, Y.H.; Han, S. Research on MPPT of photovoltaic array based on improved whale algorithm. Inf. Technol. Netw. Secur. 2021, 40, 31–36. [Google Scholar]
  36. Ebrahim, M.A.; Osama, A.; Kotb, K.M.; Bendary, F. Whale inspired algorithm based MPPT controllers for grid-connected solar photovoltaic system. Energy Procedia 2019, 162, 77–86. [Google Scholar] [CrossRef]
  37. Mao, Q.H.; Yang, L.; Wang, Y.L. A grey wolf algorithm incorporating improved Tent chaos and simulated annealing. Pract. Underst. Math. 2021, 51, 147–161. [Google Scholar]
  38. Ma, X.N.; Li, X.H. Reproducible whale algorithm based on Tent chaotic mapping. Comput. Simul. 2022, 39, 363–368. [Google Scholar]
  39. You, H.Y. Research on MPPT Control Strategy Based on Composite Algorithm. Master’s Thesis, Shenyang Engineering College, Shenyang, China, 2023. [Google Scholar]
  40. Tang, G.Q. Research on Control Strategy of Hybrid Energy Storage System for Photovoltaic Microgrid. Master’s Thesis, Anhui University of Technology, Ma’anshan, China, 2019. [Google Scholar]
  41. Gong, L.; Hou, G.; Huang, C. A two-stage MPPT controller for PV system based on the improved artificial bee colony and simultaneous heat transfer search algorithm. ISA Trans. 2023, 132, 428–443. [Google Scholar] [CrossRef]
  42. Yi, L.; Xie, Y.L.; Zeng, F.Y.; Li, J.Q.; Huang, H.; Chen, J. Neural network-based MPPT control with improved disturbance observation method. J. Sol. Energy 2022, 43, 198–203. [Google Scholar]
  43. Zhang, J.; Li, L.G. Research on photovoltaic MPPT control based on improved disturbance observation method. Electromech. Inf. 2023, 11–14. [Google Scholar] [CrossRef]
  44. Bhattacharyya, S.; Kumar P, D.S.; Samanta, S.; Mishra, S. Steady output and fast tracking MPPT (SOFT-MPPT) for P&O and InC algorithms. IEEE Trans. Sustain. Energy 2021, 12, 293–302. [Google Scholar]
  45. Wang, L.Z.; Liu, G.Y. Tracking control of photovoltaic MPPT based on simplified ant colony algorithm. Power Technol. 2020, 44, 1152–1155. [Google Scholar]
  46. Wen, Q.; Shi, X.P.; Zhang, L.F.; Li, L. APSO-LSTM natural gas demand forecasting model based on improved Tent mapping. Oil Gas Storage Transp. 2023, 42, 702–712. [Google Scholar]
  47. Zhang, Z.M.; Wang, W.B.; Peng, H.Y.; Zhou, Z.X. Photovoltaic maximum power point tracking based on improved firefly algorithm. J. Beihua Univ. (Nat. Sci. Ed.) 2021, 22, 405–409. [Google Scholar]
  48. Shirkhani, M.; Tavoosi, J.; Danyali, S.; Sarvenoee, A.K.; Abdali, A.; Mohammadzadeh, A.; Zhang, C. A review on microgrid decentralized energy/voltage control structures and methods. Energy Rep. 2023, 10, 368–380. [Google Scholar] [CrossRef]
Figure 1. Photovoltaic power generation system structure diagram.
Electronics 13 03880 g001
Figure 2. PV cell equivalent circuit diagram.
Electronics 13 03880 g002
Figure 3. Output characteristic curves at different irradiances. (a) I-V; (b) P-V.
Electronics 13 03880 g003
Figure 4. Schematic diagram of 6 × 1 photovoltaic array.
Electronics 13 03880 g004
Figure 5. Output characteristic curves of PV array at different irradiances. (a) I-V; (b) P-V.
Electronics 13 03880 g005
Figure 6. Flowchart of the P&O algorithm.
Electronics 13 03880 g006
Figure 7. Predation in the form of “bubble nets”.
Electronics 13 03880 g007
Figure 8. Overall flowchart of the ICWOA-P&O algorithm.
Electronics 13 03880 g008
Figure 9. Structure of MPPT for PV system based on the ICWOA-P&O model.
Electronics 13 03880 g009
Figure 10. Power tracking curves of each algorithm under uniform irradiance.
Electronics 13 03880 g010
Figure 11. Condition 3: Power tracking curves of each algorithm under static shading.
Electronics 13 03880 g011
Figure 12. Photovoltaic array environmental change conditions.
Electronics 13 03880 g012
Figure 13. Output curves under three irradiance conditions. (a) I-V; (b) P-V.
Electronics 13 03880 g013
Figure 14. Power tracking curves of various algorithms under sudden changes in irradiance.
Electronics 13 03880 g014
Figure 15. Output curves for sudden changes in both temperature and irradiance. (a) I-V; (b) P-V.
Electronics 13 03880 g015
Figure 16. Power tracking curves of each algorithm under sudden changes in both temperature and irradiance.
Electronics 13 03880 g016
Figure 17. Experimental platform.
Electronics 13 03880 g017
Figure 18. Output voltage tracking curve experimental results.
Electronics 13 03880 g018
Figure 19. Output power tracking curve experimental results.
Electronics 13 03880 g019aElectronics 13 03880 g019b
Table 1. Setting value of each parameter of the photovoltaic cell.
ParameterSpecific Value
Temperature under STC conditions: Tref25 °C
Irradiance under STC conditions: Sref1000 W/m2
Correction factor a0.0025/°C
Correction factor b0.5
Open-circuit voltage: Uoc36.3 V
Short-circuit current: Isc7.84 A
The voltage of MPP: Um29 V
The current of MPP: Im7.35 A
Table 2. Parameter setting for 3 operating conditions.
Condition#1#2#3#4#5#6
STSTSTSTSTST
Condition 2800258002580025800258002580025
Condition 310002510002580025800256002540025
Condition 41000258002560025400252002520025
Table 3. Algorithm performance comparison under uniform irradiance.
ConditionStatisticsUnitsPSOWOAWOA-P&OICWOA-P&O
Uniform irradianceTheoretical valueW1027102710271027
Tracking times0.120.120.120.09
Tracking valueW1027102710271027
Tracking accuracy%100100100100
RE%0000
IAEJ0000
Oscillation state/bigbigbigsmall
Table 4. Algorithm performance comparison under static local shading.
ConditionStatisticsUnitsPSOWOAWOA-P&OICWOA-P&O
Static local shading (Condition 3)Theoretical valueW719.1719.1719.1719.1
Tracking times0.120.120.110.08
Tracking valueW709.6711.4719.1719.1
Tracking accuracy%98.6998.93100100
RE%1.321.0700
IAEJ5.74.6200
Oscillation state/bigbigsmallsmall
Table 5. Algorithm performance comparison under dynamic shading.
ConditionStatisticsUnitsPSOWOAWOA-P&OICWOA-P&O
Sudden changes in irradianceTheoretical valueW837.7/1393
/580.6
837.7/1393
/580.6
837.7/1393
/580.6
837.7/1393
/580.6
Tracking times0.12/0.12/0.120.12/0.12/0.120.11/0.11/0.110.07/0.1/0.09
Tracking valueW837.7/1392.5
/579.8
837.7/1392.6
/580.4
837.7/1392.5
/578.6
837.7/1392.6
/580.6
Tracking accuracy%100/99.96
/99.86
100/99.97
/99.97
100/99.96
/99.66
100/99.97
/100
RE%0/0.04/0.140/0.03/0.030/0.04/0.340/0.03/0
IAEJ0/0.3/0.480/0.24/0.120/0.3/1.20/0.24/0
Oscillation state/Bigbigbigsmall
Table 6. Algorithm performance comparison under sudden changes in irradiance and temperature.
ConditionStatisticsUnitsPSOWOAWOA-P&OICWOA-P&O
Sudden changes in both temperature and irradianceTheoretical valueW397.1/364.6397.1/364.6397.1/364.6397.1/364.6
Tracking times0.12/0.120.12/0.120.12/0.110.08/0.09
Tracking valueW394.5/363.2396.6/363.2397.1/364.6397.1/364.6
Tracking accuracy%99.35/99.6299.87/99.62100/100100/100
RE%0.65/0.380.13/0.380/00/0
IAEJ1.56/0.840.3/0.840/00/0
Oscillation state/bigbigbigsmall
Table 7. Theoretical output voltage and theoretical output power values under 3 conditions.
ConditionVoltagePower
Condition 1173.3 V1273 W
Condition 3155.8 V719.1 W
Condition 490.17 V412.7 W
Table 8. Actual tracking results.
ConditionPSOWOAWOA-P&OICWOA-P&O
Condition 1Tracking voltage value (V)173.9174.1173.3173.3
Tracking power value (W)1269127212721273
Tracking time (s)0.270.270.230.17
IAE (J)5.61.41.40
RE (%)0.310.080.080
Condition 3Tracking voltage value (V)116.6155.5117.7117.7
Tracking power value (W)709.1716.5709.9709.9
Tracking time (s)0.290.280.230.15
IAE (J)143.6412.8812.88
RE (%)1.390.361.281.28
Condition 4Tracking voltage value (V)91.57125.790.2390.16
Tracking power value (W)409.9386.2412.7412.7
Tracking time (s)0.30.290.250.10
IAE (J)3.9237.100
RE (%)0.686.4200
Disclaimer/Publisher’s Note: The statements, opinions and data contained in all publications are solely those of the individual author(s) and contributor(s) and not of MDPI and/or the editor(s). MDPI and/or the editor(s) disclaim responsibility for any injury to people or property resulting from any ideas, methods, instructions or products referred to in the content.

