Article

Photovoltaic Maximum Power Point Tracking Technology Based on Improved Perturbation Observation Method and Backstepping Algorithm

School of Electrical Engineering, Liaoning University of Technology, Jinzhou 121001, China
*
Author to whom correspondence should be addressed.
Electronics 2024, 13(19), 3960; https://doi.org/10.3390/electronics13193960
Submission received: 31 August 2024 / Revised: 28 September 2024 / Accepted: 7 October 2024 / Published: 8 October 2024

Abstract

:
Photovoltaic power generation systems mainly use the maximum power tracking (MPPT) controller to adjust the voltage and current of the solar cells in the photovoltaic array, so that the photovoltaic array runs at the maximum power point (MPP) to achieve the purpose of maximum power output. At present, photovoltaic power stations mainly adopt the traditional method to track the maximum power point, but this fixed step method easily causes output power oscillation of the photovoltaic array when tracking the maximum power point, and it easily falls into the local extreme point under partial shadow conditions. In order to solve these problems, this paper proposes an improved perturbation observation method and backstepping method (IP&O-backstepping) to replace the traditional method applied to the MPPT controller to optimize the operating state of the solar cell, thereby improving the output power point of the photovoltaic array and increasing the output power of the photovoltaic array. The algorithm first uses the improved perturbation and observation (IP&O) method to search the maximum power point of the photovoltaic array and output the reference voltage. Secondly, the reference voltage is input into the backstepping algorithm for voltage tracking. Finally, the algorithm tracks the reference voltage and makes the photovoltaic array operate at the maximum power point. The simulation is carried out by using MATLAB/Simulink. The IP&O-backstepping algorithm is compared with the intelligent algorithm and the traditional method, and the results show that compared to the above algorithm, the IP&O-backstepping algorithm can not only track the maximum power point of the photovoltaic array, but also has a faster tracking speed, and the output power has almost no oscillation when the photovoltaic array runs at the maximum power point.

1. Introduction

In the context of continued social development and the depletion of energy re-sources, many countries have turned their attention to clean energy as a replacement for fossil fuels. Clean energy can be divided into two main categories: renewable energy and nuclear energy [1]. As a low-carbon energy source, nuclear energy occupies a certain proportion of the global energy supply. However, the development of nuclear energy faces challenges such as safety concerns and nuclear waste disposal, so its current scope of application is limited. Renewable energy is a green, low-carbon and environmentally friendly energy source, which serves as an important carrier for achieving the green transformation of social and economic development and the greenization of the energy structure. It plays an important role in addressing climate change and achieving the ‘dual carbon’ goals. Renewable energy mainly includes solar, wind, hydro, geothermal and biomass energy, among which solar energy has become one of the most widely welcomed renewable energy sources due to its strong availability and ease of installation [2]. Solar energy has a wide range of applications, which can be used to ensure industrial operation, agricultural production, residential electricity and many other requirements [3,4]. In recent years, with the further decline in the cost of solar panels, the cost of photovoltaic power generation has been reduced to a certain extent [5]. If the efficiency of photovoltaic power generation can be further improved, this will further facilitate its widespread adoption.
The power–voltage (P-V) output characteristic curve of a photovoltaic array exhibits nonlinear characteristics, with a maximum power point, and it is significantly influenced by environmental factors such as solar irradiance and temperature. The photovoltaic power generation system mainly uses the MPPT controller to adjust the voltage and current of the solar cells in the photovoltaic array, so that the photovoltaic array runs at the maximum power point to achieve the purpose of maximum power tracking. Therefore, it is very important to improve the control algorithm of the MPPT controller [6,7].
At present, the main methods used in the MPPT controller are traditional methods, such as the perturb and observe (P&O) method [8], the Incremental Conductance (INC) method [9] and the Constant Voltage (CVM) method [10]. These algorithms are widely used in the control strategies of conventional photovoltaic power stations, with the following main advantages: fast tracking speed and simple algorithm implementation. At the same time, due to the fixed step size of the traditional MPPT, the photovoltaic array is prone to power oscillation at the MPP [11]. However, a major drawback is that when the photovoltaic array receives uneven sunlight (partial shadow), the algorithm can easily fall into local extrema, and then it will lead to power loss. Nevertheless, it cannot be denied that traditional MPPT is still an effective method to achieve the maximum output power of the photovoltaic power generation system under non-uniform illumination conditions.
To further enhance the tracking efficiency of photovoltaic power generation systems under partial shading, many scholars have proposed various MPPT algorithms [12]. Since the MPPT of photovoltaic power generation systems is essentially a problem of finding the optimal input signal of the controller in these systems, and it is consistent with the solution of the optimal path by intelligent optimization algorithms, so many scholars have proposed solving the maximum power tracking problem of photovoltaic power generation systems under local shading by using intelligent optimization algorithms. The reasons why intelligent algorithms are widely used can be roughly summarized as follows: simplicity, strong search capability and no need for complex formula derivations [13]. Compared to traditional MPPT, intelligent optimization algorithms generally have stronger capabilities to avoid falling into local optima and to achieve a balance between tracking speed and accuracy under partial-shading conditions.
Intelligent optimization algorithms include Particle Swarm Optimization (PSO), grey wolf optimization (GWO), the cuckoo search (CS) algorithm, etc.
The PSO algorithm is an intelligent optimization algorithm based on group behavior, and it finds the optimal solution by simulating the predation behavior of birds or fish, the interaction of individuals in the group and information sharing. The PSO algorithm has the advantages of simple calculation, low memory demand for hardware and relatively easy programming. It has broad application prospects in MPPT systems [14]. However, the PSO algorithm also has some problems, such as the trade-off between accuracy and speed [15]. Reference [16] designed an adaptive control strategy to improve the speed of the PSO algorithm for the maximum power tracking of photovoltaic arrays. Compared with the traditional PSO algorithm, it has a faster tracking speed and higher tracking accuracy.
Reference [17] proposed an intelligent optimization algorithm based on gray wolf hunting behavior. In [18], the GWO algorithm is applied to MPPT, and the position of the head wolf is used as the duty cycle of the inverter for tracking, and a good power tracking effect is obtained. In [19], the extended grey wolf optimizer (EGWO) is applied to MPPT. The EGWO algorithm has stronger adaptability than the GWO algorithm and is especially suitable for photovoltaic MPPT problems that require fast convergence. In [20], the convergence factor of the GWO algorithm is improved, and an IGWO algorithm is proposed and applied to photovoltaic MPPT. Compared with the classical GWO algorithm, the IGWO algorithm has a higher tracking accuracy under local shadows.
In [21], a new meta-heuristic algorithm, called the CS algorithm, is proposed to solve optimization problems. In [22], the CS algorithm is applied to MPPT to obtain a good power tracking effect. Reference [23] proposed a new photovoltaic maximum power control algorithm based on an improved CS algorithm. By adjusting the iterative step size in the CS algorithm and changing the probability of finding the bird’s nest, the tracking speed and accuracy of photovoltaic MPPT are improved. In [24], a photovoltaic MPPT based on an improved cuckoo algorithm is proposed. This algorithm improves the cuckoo’s position update control strategy and replaces the worst cuckoo in each generation with the best cuckoo, so that the MPPT time and power oscillation are reduced.
With the advancement of technology, many scholars have further combined intelligent optimization algorithms with traditional MPPT to simultaneously allow intelligent optimization algorithms to jump out of local extremum points and improve the speed of traditional MPPT. For example, the PSO-P&O-PI [25] and PSO algorithms are combined with the P&O algorithm (PSO-P&O) [26], the GWO algorithm is combined with P&O algorithm (GWO-P&O) [27], the GWO algorithm is combined with the CS algorithm (GWO-CS) [28], the CS algorithm is combined with the INC algorithm (CS-INC) [29], and so on. Reference [30] gives a flow chart of most of the above algorithms. Although intelligent control algorithms have the advantage of escaping local extremum points, the calculation results are random and, compared to traditional MPPT algorithms, the tracking speed is slower, so they are not widely used.
Therefore, an IP&O-backstepping-based photovoltaic MPPT algorithm is proposed in this paper based on the P&O algorithm in traditional MPPT algorithms. The following are the innovative points of the algorithm:
(1)
The algorithm introduces the concept of a boundary point, initially moving the operating point to the intersection of the I-U curve and the load line. Then, it can continue tracking with the P&O algorithm, which gives the algorithm the ability to escape local extrema, compared to traditional MPPT methods.
(2)
The backstepping algorithm is introduced to overcome the drawbacks of the P&O method where the step is fixed and the power fluctuates significantly after reaching the maximum power point.
(3)
The algorithm uses a large-step P&O method for initial tracking, which has a speed advantage.
This paper implements the IP&O-backstepping algorithm on the MATLAB/Simulink 2022a platform, and the performance of the algorithm is compared with the P&O algorithm, the PSO algorithm, the GWO algorithm, the CS algorithm, the GWO-P&O algorithm, (the salp swarm algorithm, the SSA algorithm) and the CS-INC algorithms in terms of speed and accuracy in tracking the maximum power under different lighting conditions.
The structure of this paper is as follows: Section 2 discusses the output characteristics of photovoltaic arrays under partial shading and models the photovoltaic power generation system. Section 3 introduces the principles of the proposed IP&O-backstepping algorithm. Section 4 validates the algorithm through simulations and conducts comparative experiments, followed by result analysis. The conclusions of this study are presented in Section 5.

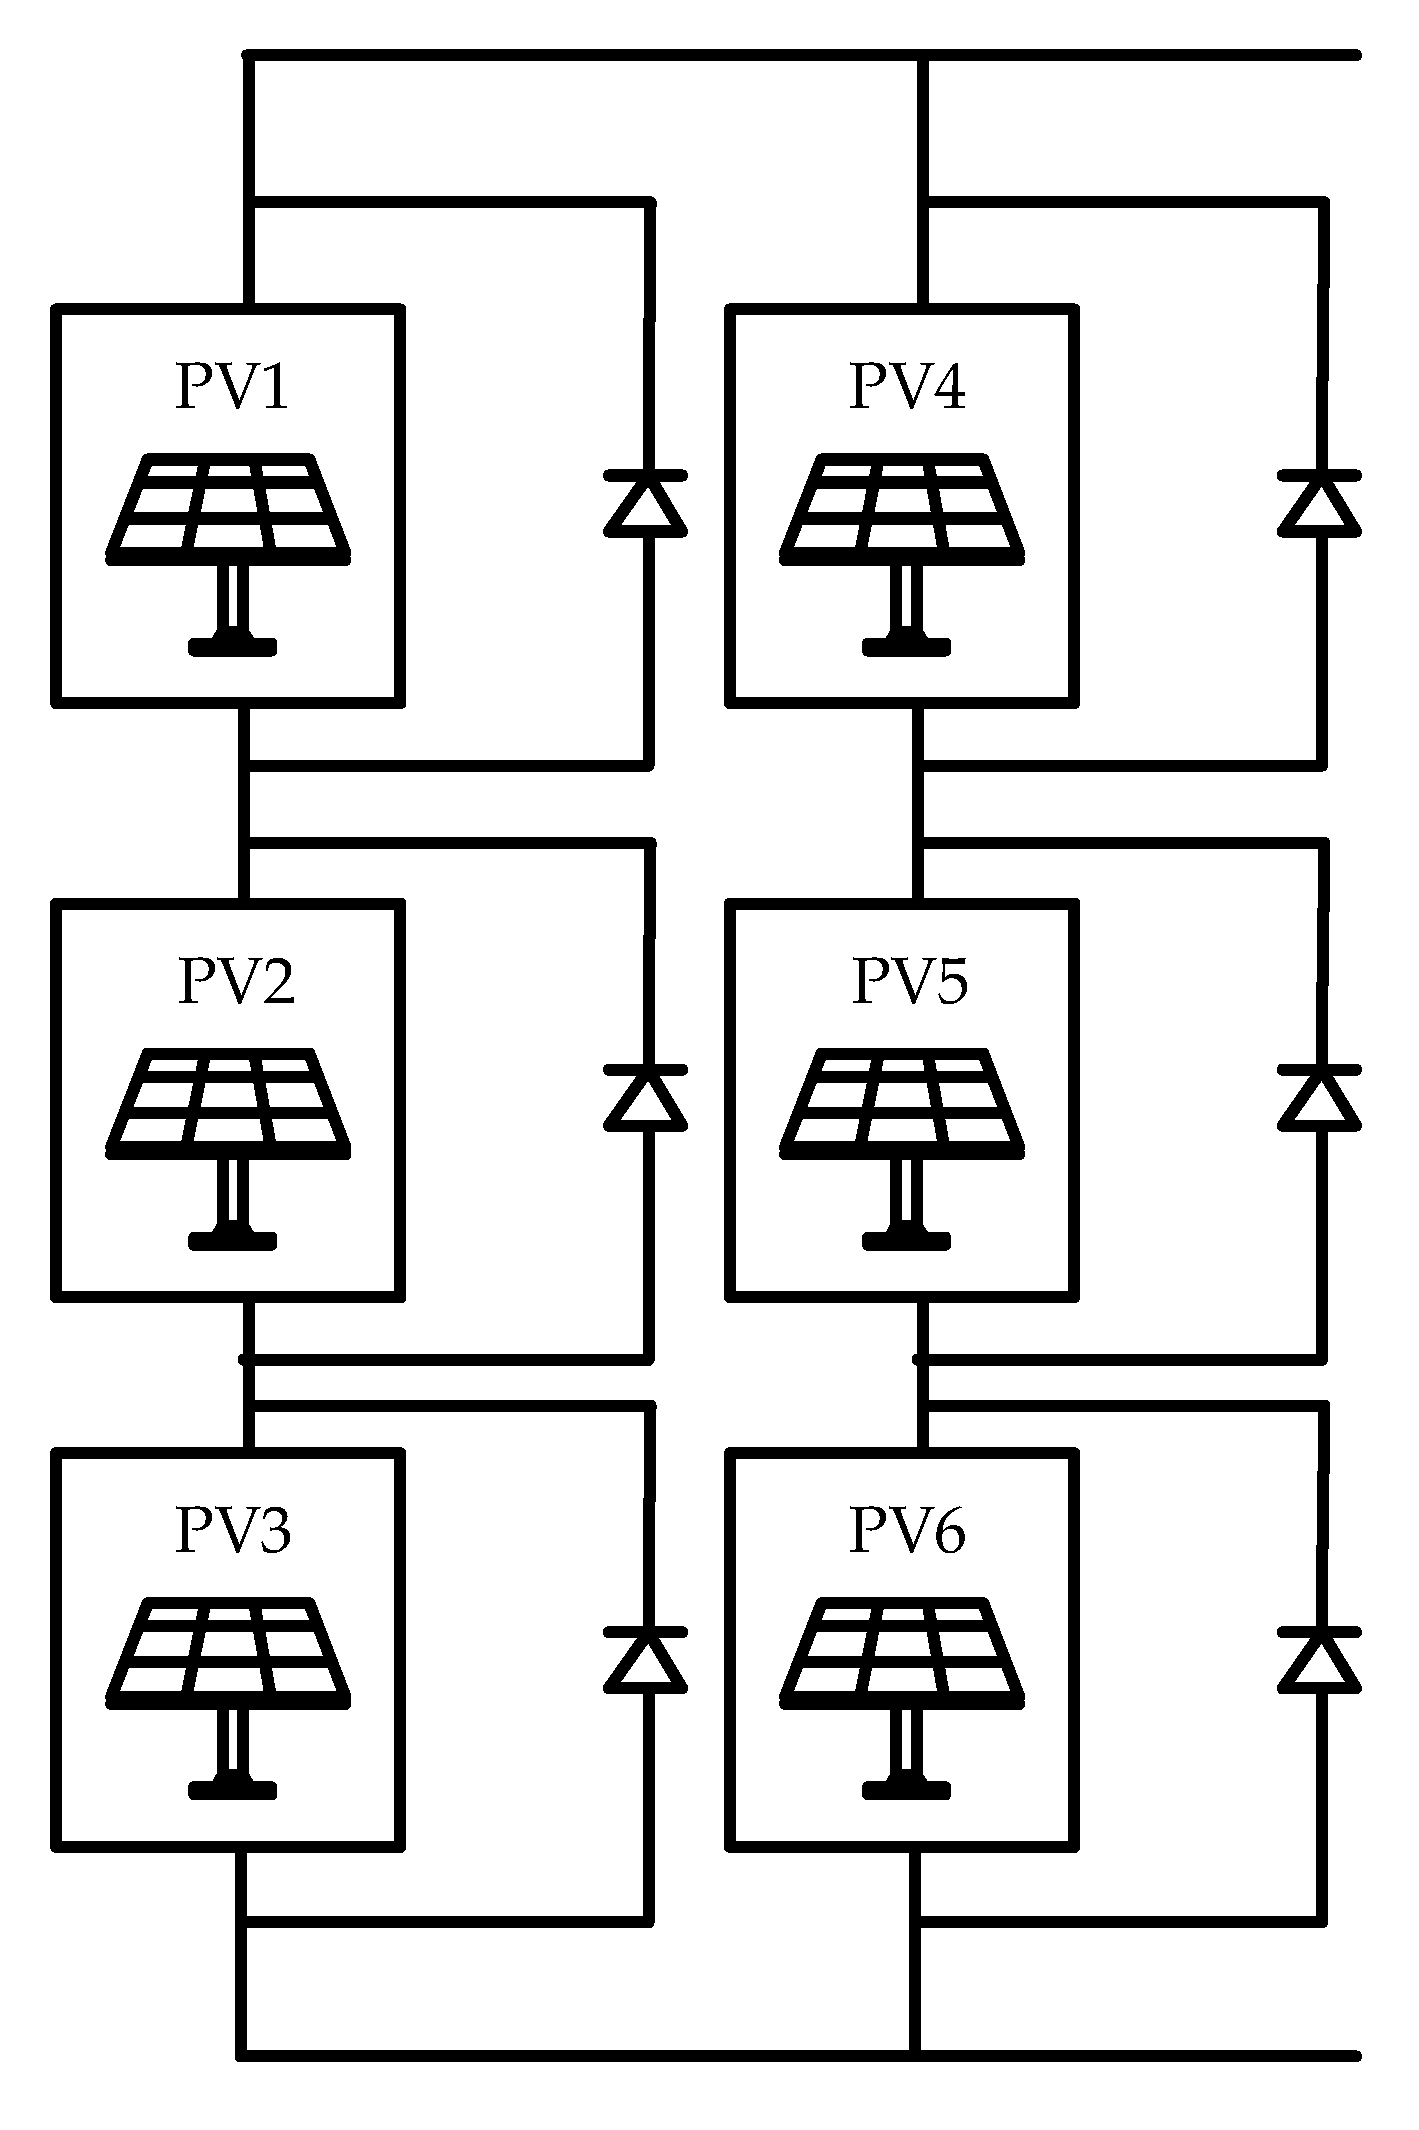
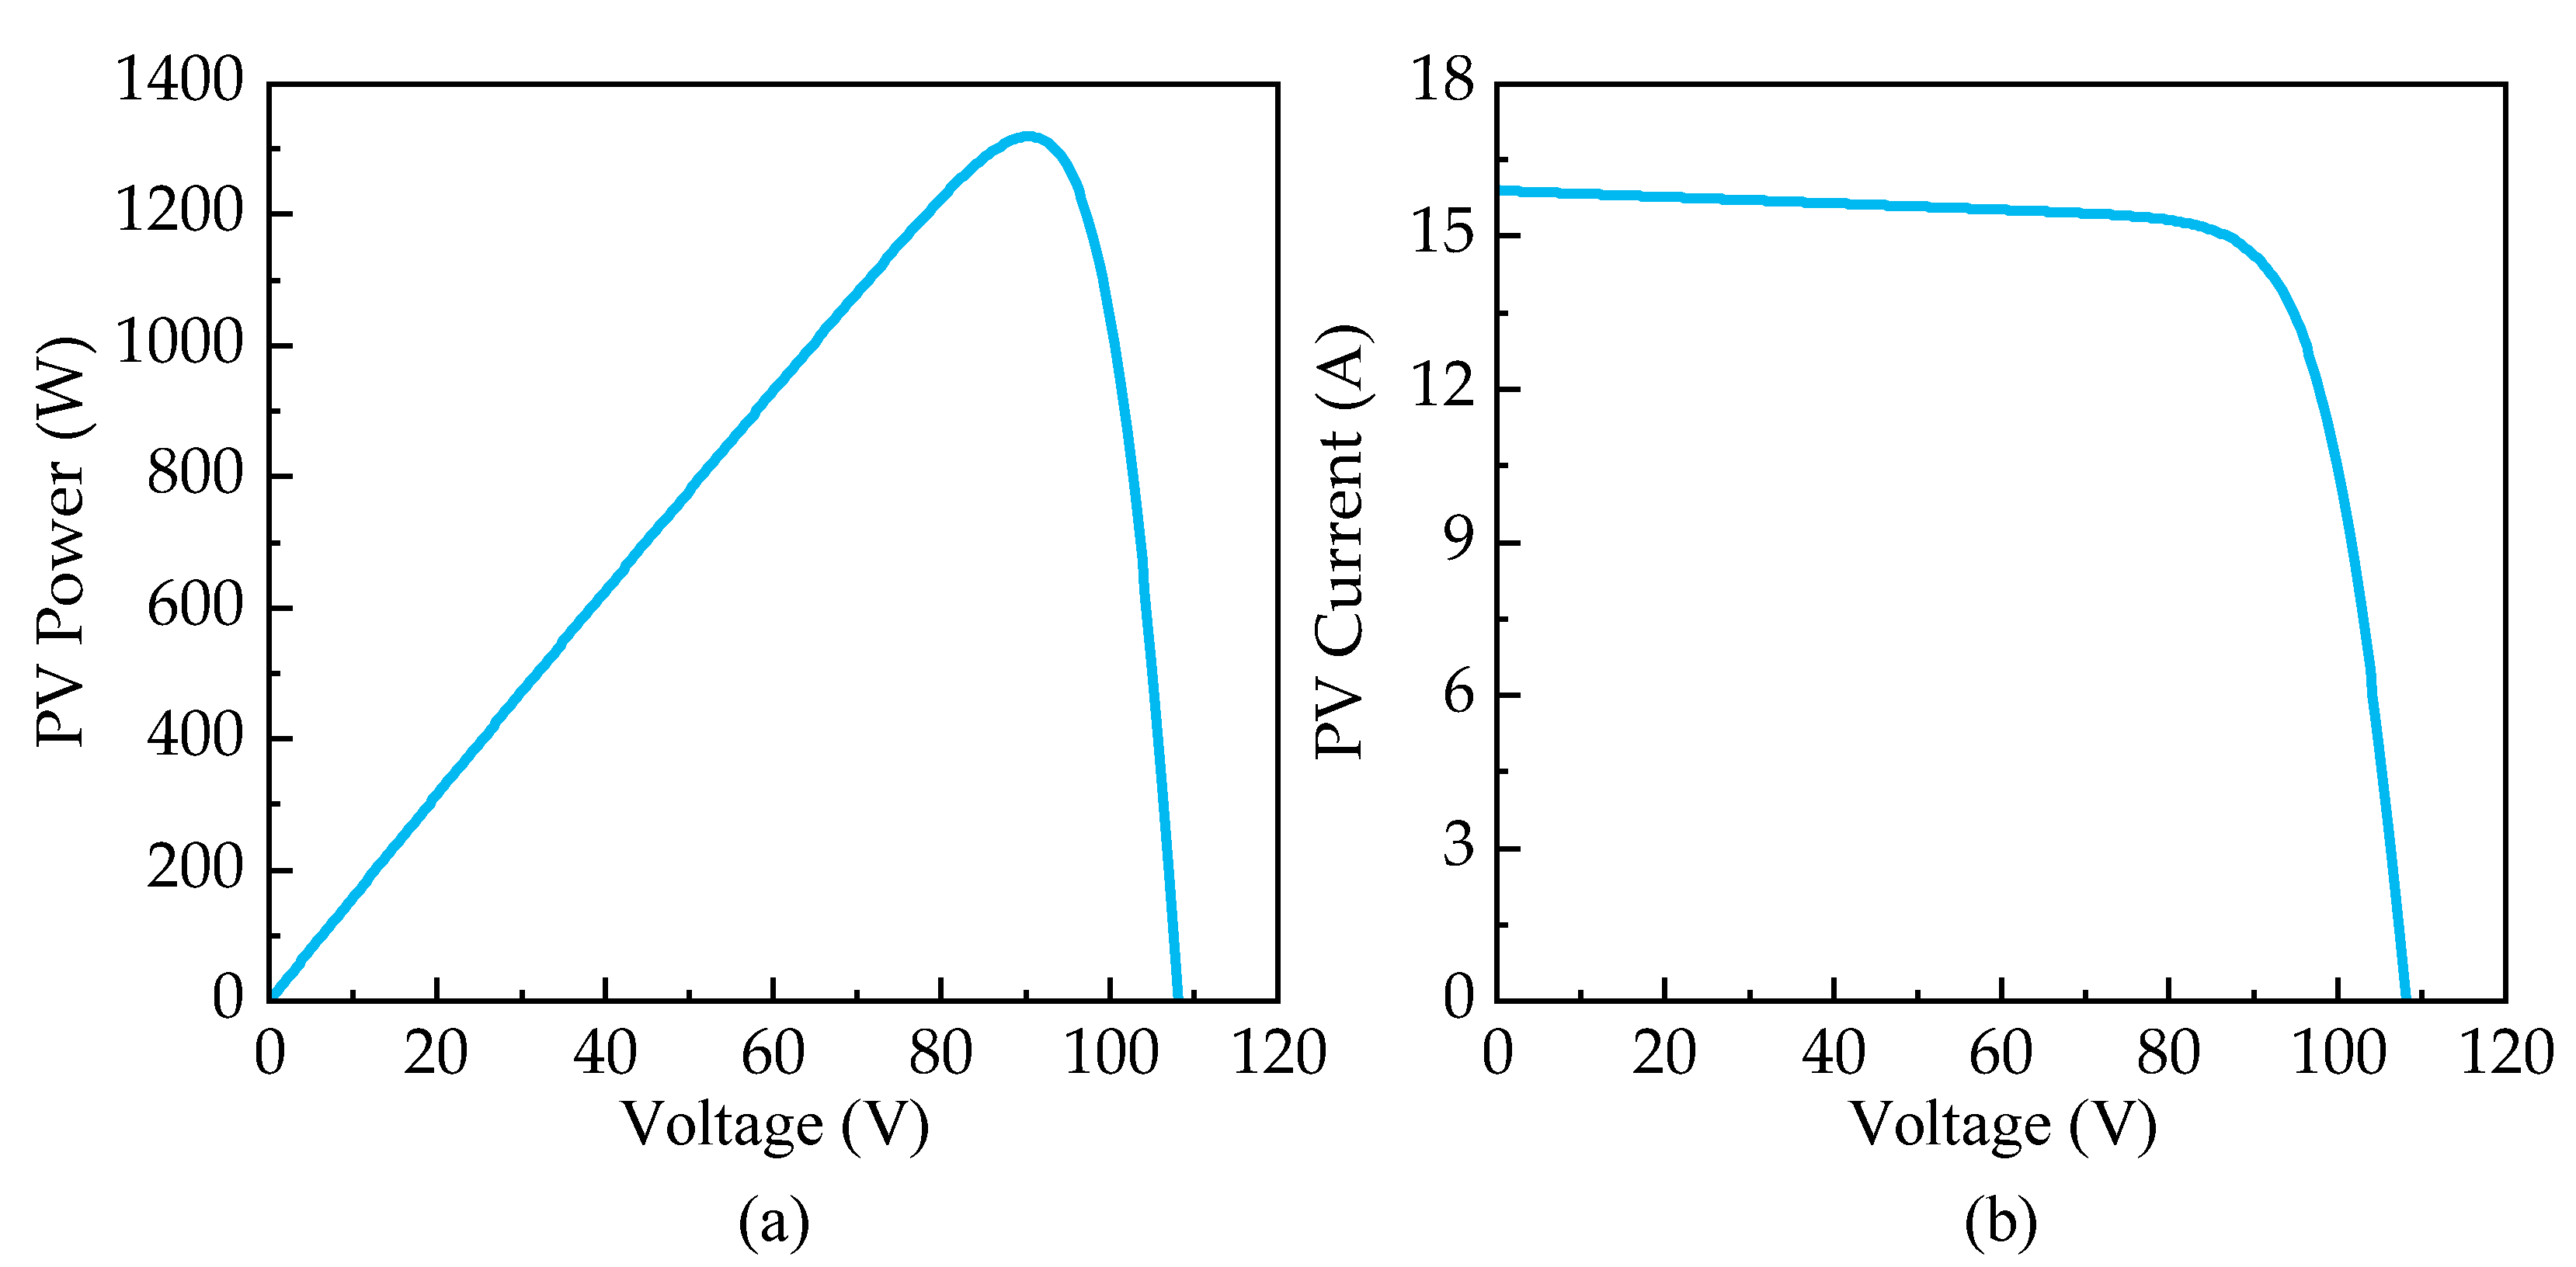
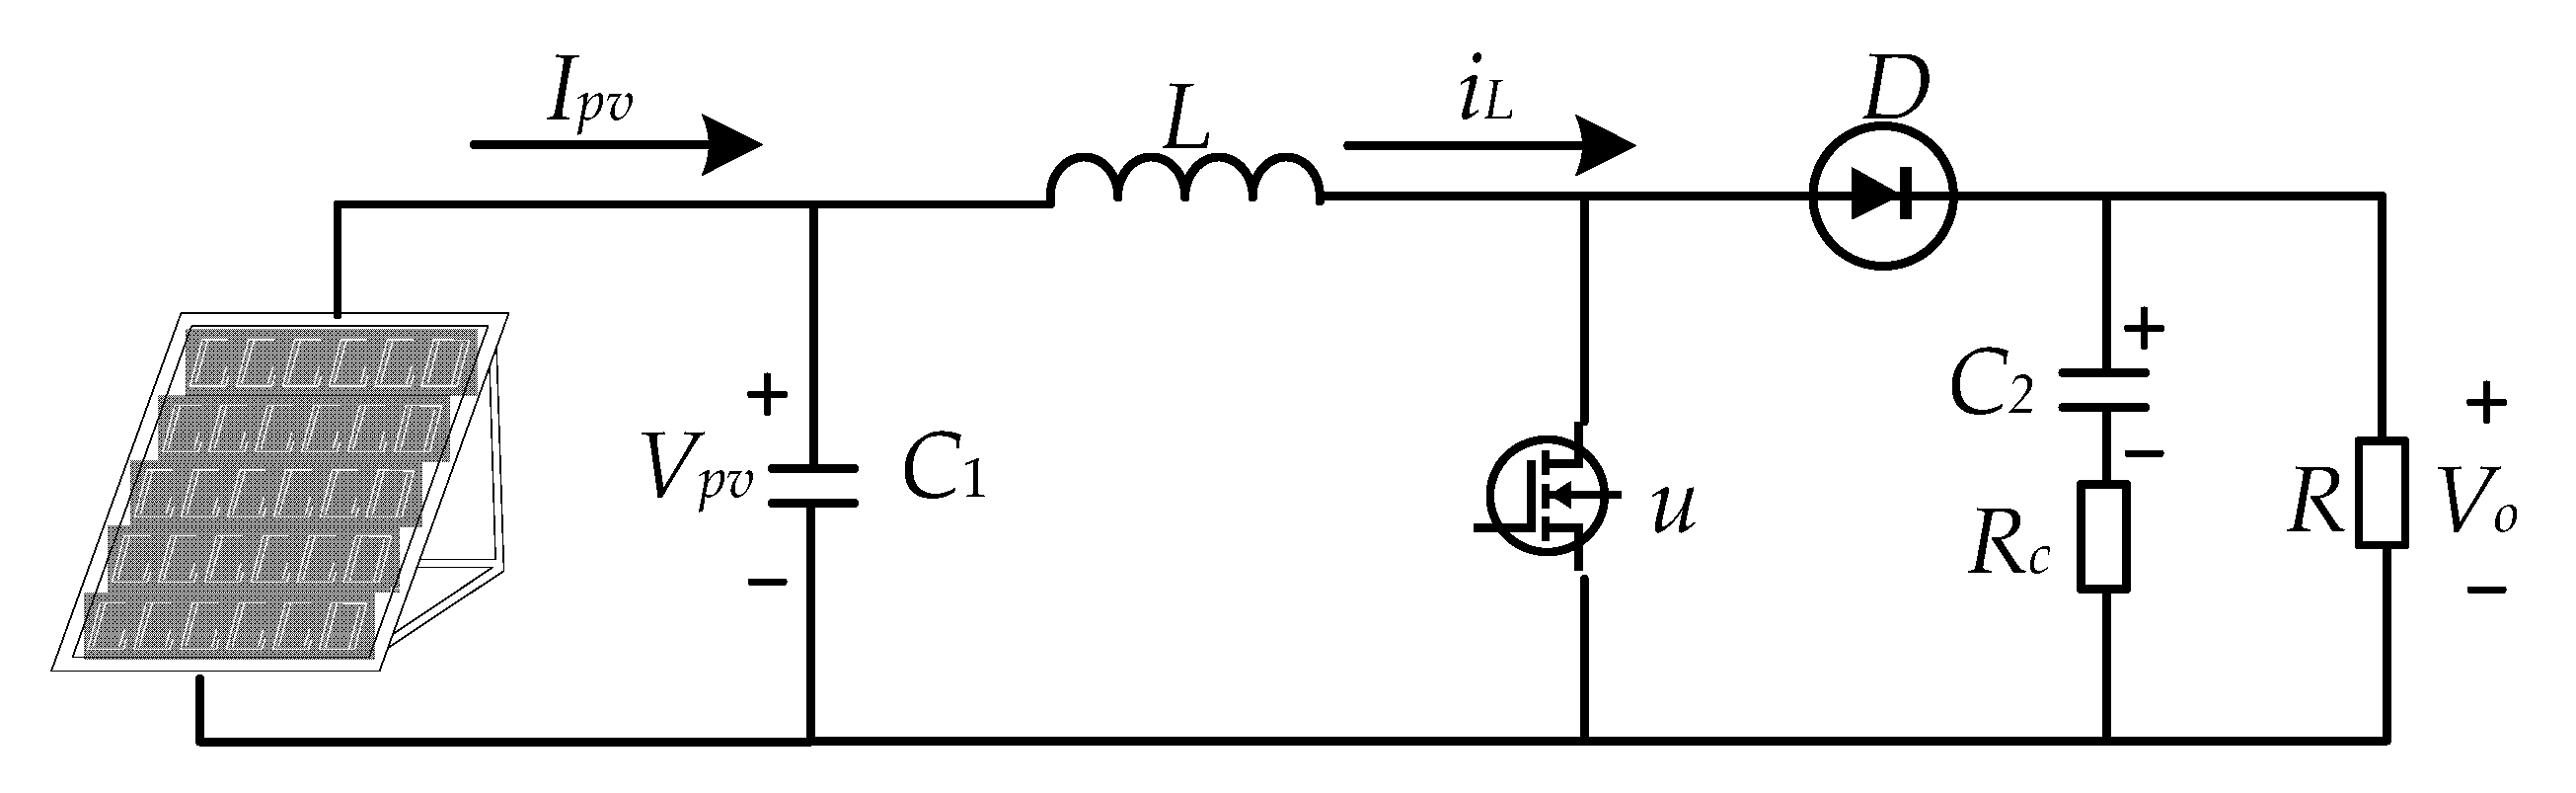
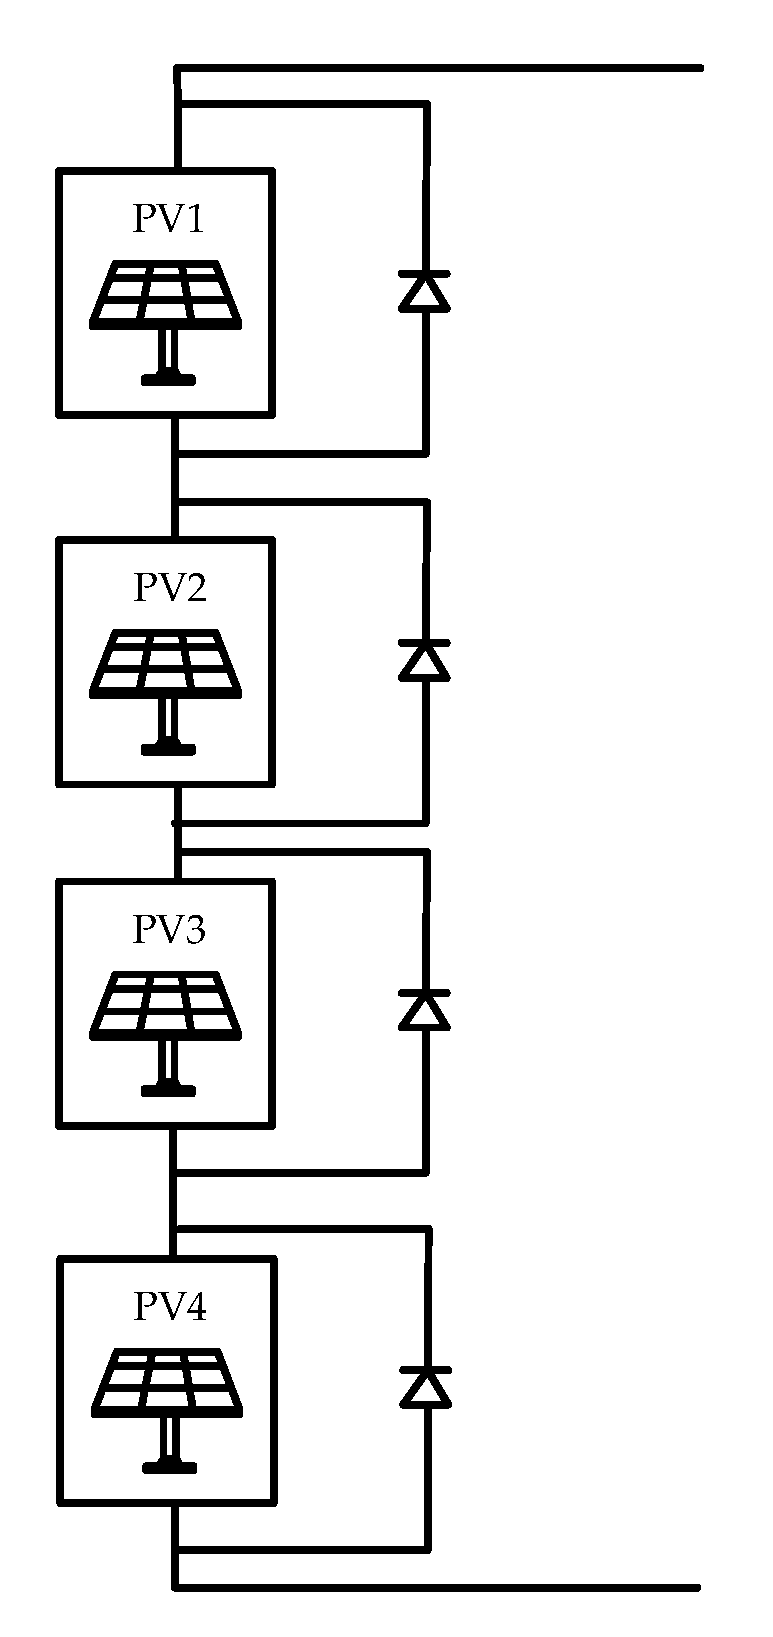
2. Modeling of Photovoltaic Power Generation Systems and Analysis of Photovoltaic Array Output Characteristics

This article uses a single-diode model to establish the photovoltaic cell model, with the topology of the photovoltaic cell illustrated in Figure 1. The main parameters of this model are as follows: the photogenerated current from an ideal DC source Iph, the series resistance Rs, the parallel resistance Rsh and an equivalent diode whose ideal factor is A.
This document aims at providing a mathematical model of photovoltaic cells based on their theoretical analysis for subsequent research objectives.
An ideal DC source generates photocurrent Iph, a portion of the photogenerated current flows into the equivalent diode, forming a current Id, a portion of the photocurrent flows into the parallel resistor Rsh and a portion of the photogenerated current flows through the series resistance Rs to the load circuit.
Each current is represented as follows:
Photogenerated current Iph:
I p h = G [ I p h r + k i ( T c T r ) ] 1000
where Ki is the temperature coefficient, Tc is the battery temperature, Tr is the reference temperature, G is the light intensity and Iphr is the short circuit current at the reference temperature.
The current flowing through the diode Id:
I d = I s [ e B 1 ] B = q ( V + I R s ) A K T C
where q is the electric charge of the electron and the unit is C, A is the ideal factor of the diode, Rs is the series resistance, K is the Boltzmann constant, Is is the reverse saturation current, V is the terminal voltage of the photovoltaic cell and I is the output current of the photovoltaic cell.
The shunt leakage current Ish flowing through Ish:
I sh = V + I R s R s h
The output current of photovoltaic cells I:
I = I p h I d I s h
Based on the theoretical analysis of photovoltaic cells, this paper establishes a mathematical model of photovoltaic cells and uses the model for subsequent research.
The solar cell uses the A10Green Technology A10J-M60-230 model in MATLAB/simulink. Table 1 shows the specific parameters of the above solar cells.
The output characteristics of the PV array are studied using the structure shown in Figure 2.
Under uniform illumination and constant temperature conditions, the output characteristic curve of the photovoltaic cell exhibits specific features. The P-V characteristic curve of the photovoltaic cell shows a single peak. The I-V characteristic curve displays a single knee shape. Figure 3 displays the P-V and I-V curves under uniform illumination conditions.
Under partial shading, the output characteristics of each photovoltaic cell vary. The working current of the shaded photovoltaic cells decreases, reducing their output power. The output power of the unshaded photovoltaic cells remains unchanged. The output characteristic curve of the photovoltaic array contains multiple peak points.
Figure 4 displays the P-V and I-V curves under two different partial shadow conditions. In Figure 4, GMPP is the global maximum power point. LMPP is the local maximum power point.
The output circuit of the photovoltaic power generation system mainly includes the following components: the photovoltaic array, the BOOST circuit and the load, as shown in Figure 5. The component parameters are listed in Table 2. The specific parameters of the circuit are shown in Table 1. The mathematical model of the circuit is given in Equation (5) [31].
d V p v d t = 1 C 1 ( I p v I L ) d I L d t = f 1 ( x ) + g 1 ( x ) μ d V c 2 d t = f 2 ( x ) + g 2 ( x ) μ
where μ represents the duty cycle of the inverter, the functions f1, f2, g1 and g2 are as shown in Equations (6)–(9):
f 1 ( x ) = U p v V D L R c I L L ( 1 + R c R ) + U c 2 L ( R c R + R c 1 )
f 2 ( x ) = 1 C 2 ( 1 + R c R ) I L + R c C 2 ( R + R c ) U c 2
g 1 ( x ) = V D L R c L ( 1 + R c R ) I L U c 2 L ( R c R + R c 1 )  
g 2 ( x ) = 1 C 2 ( 1 + R c R ) I L

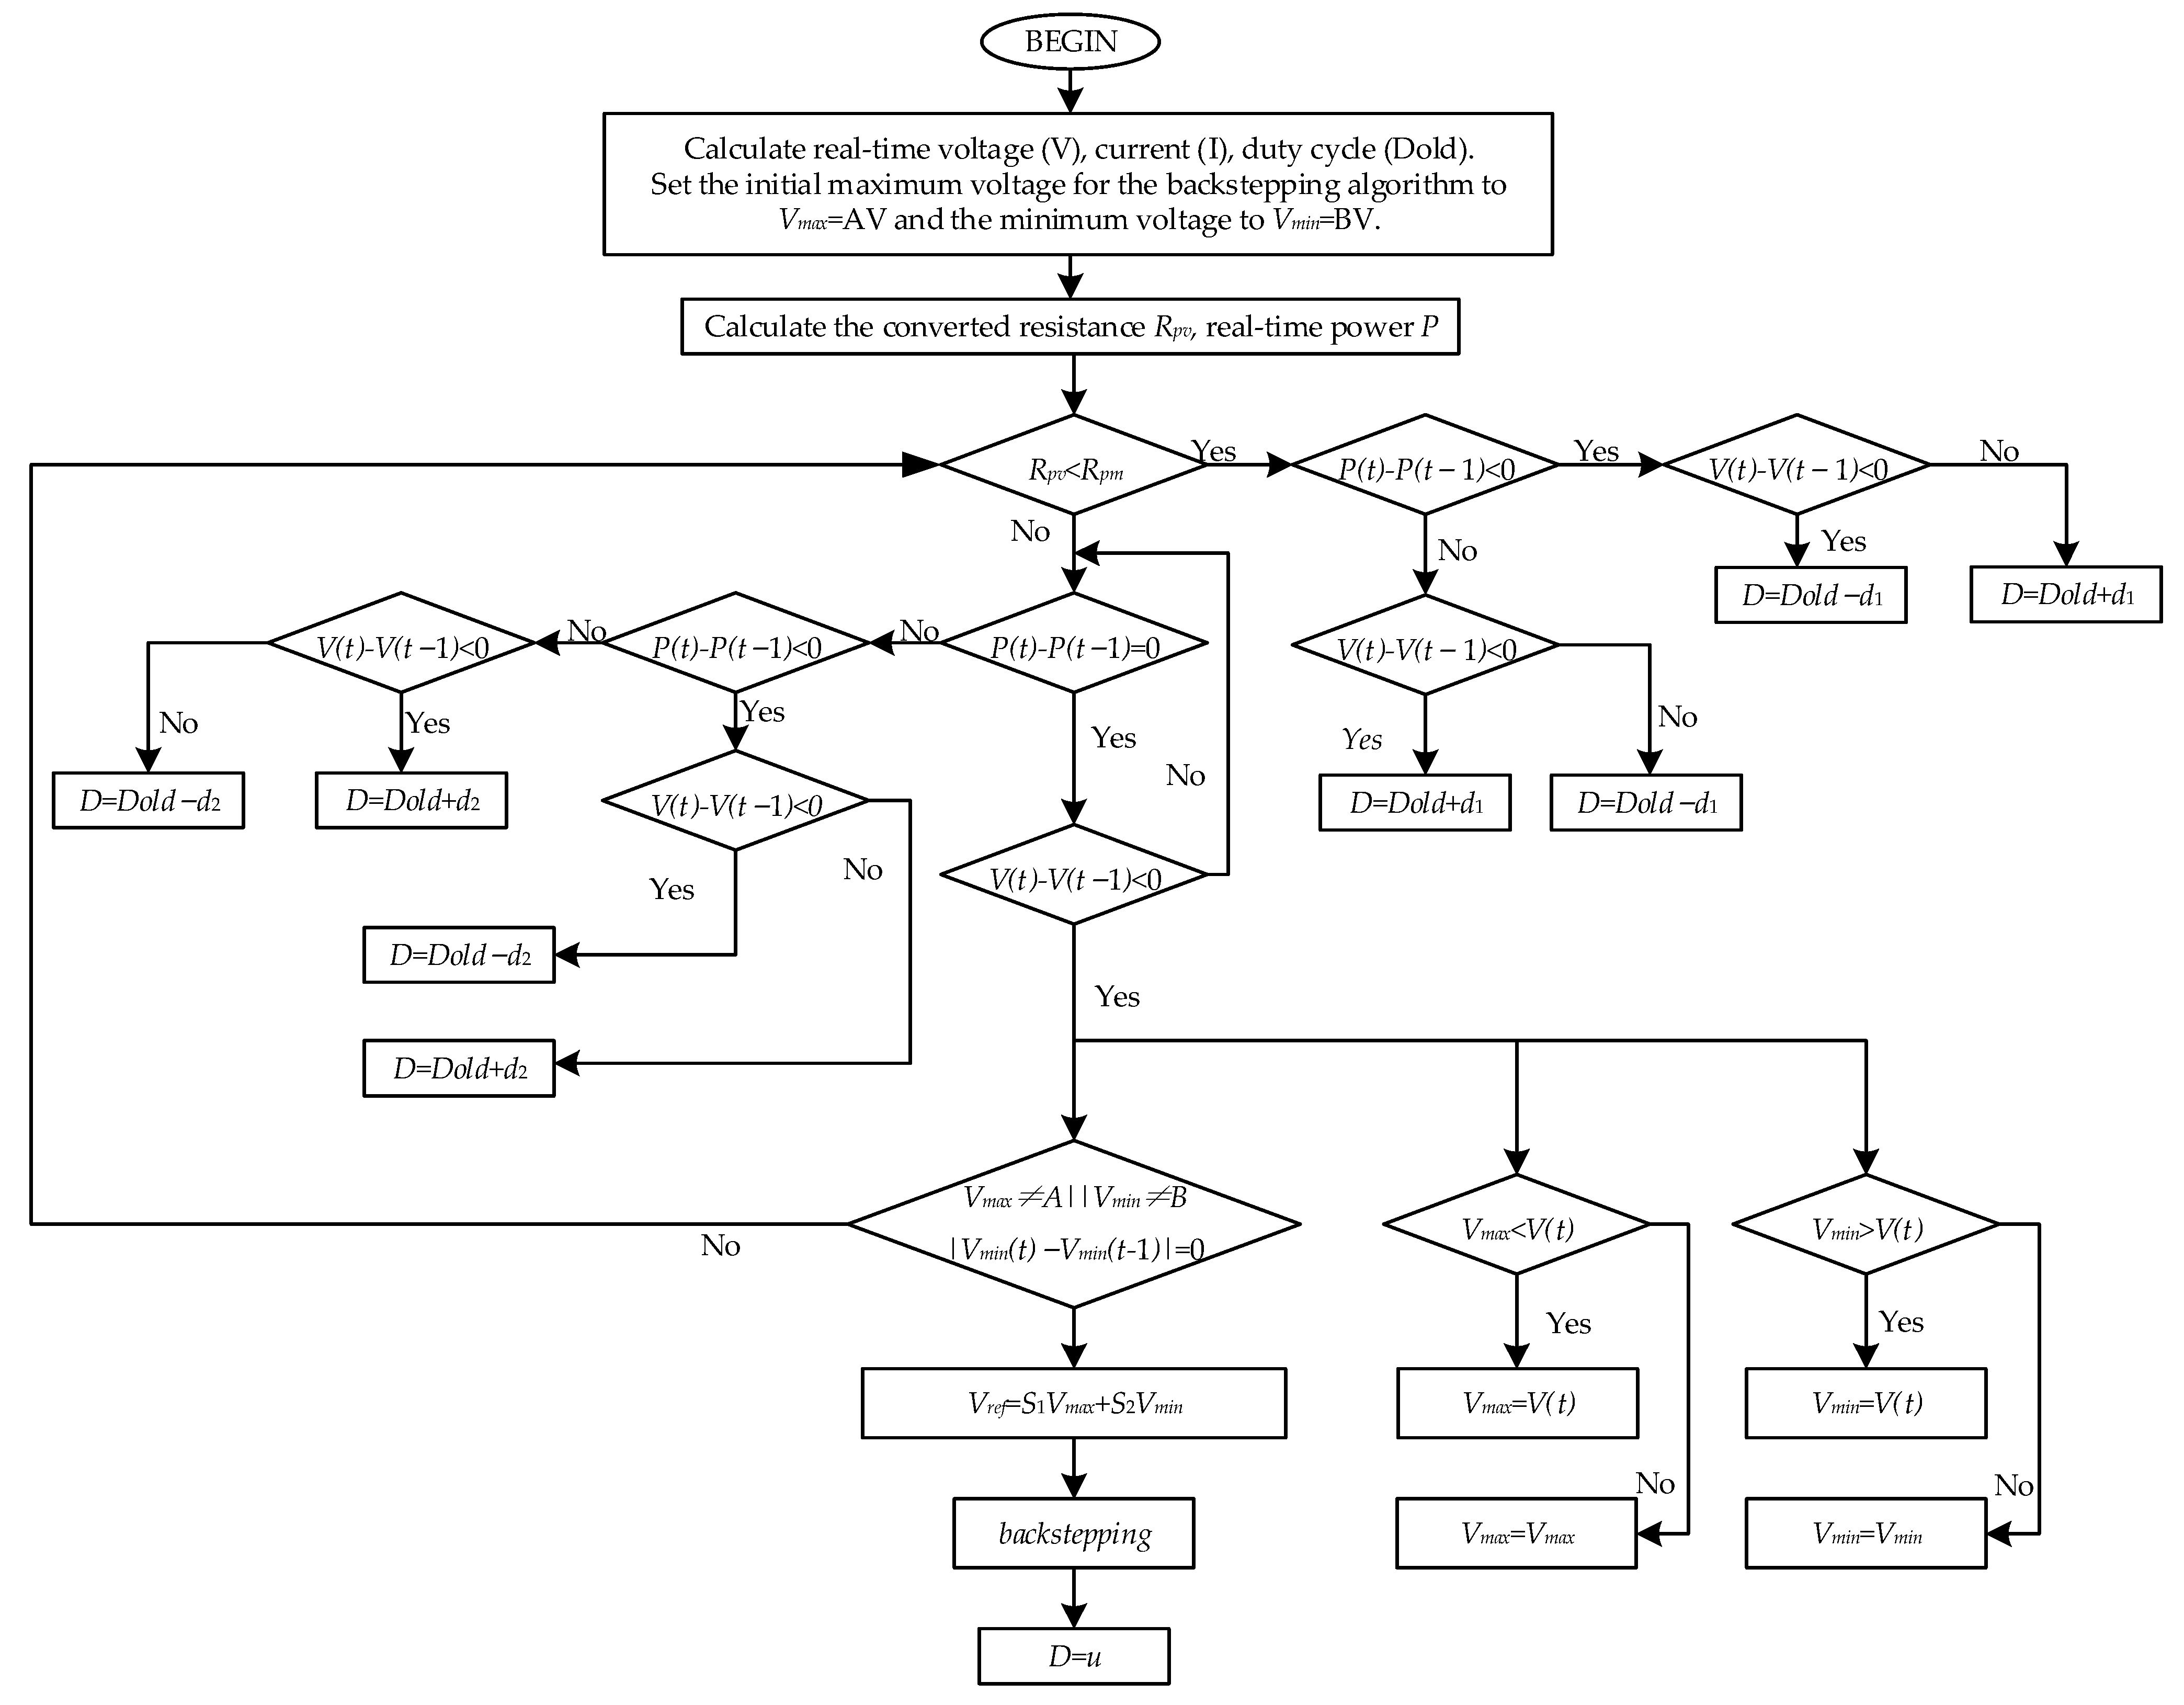
3. Design of IP&O-Backstepping

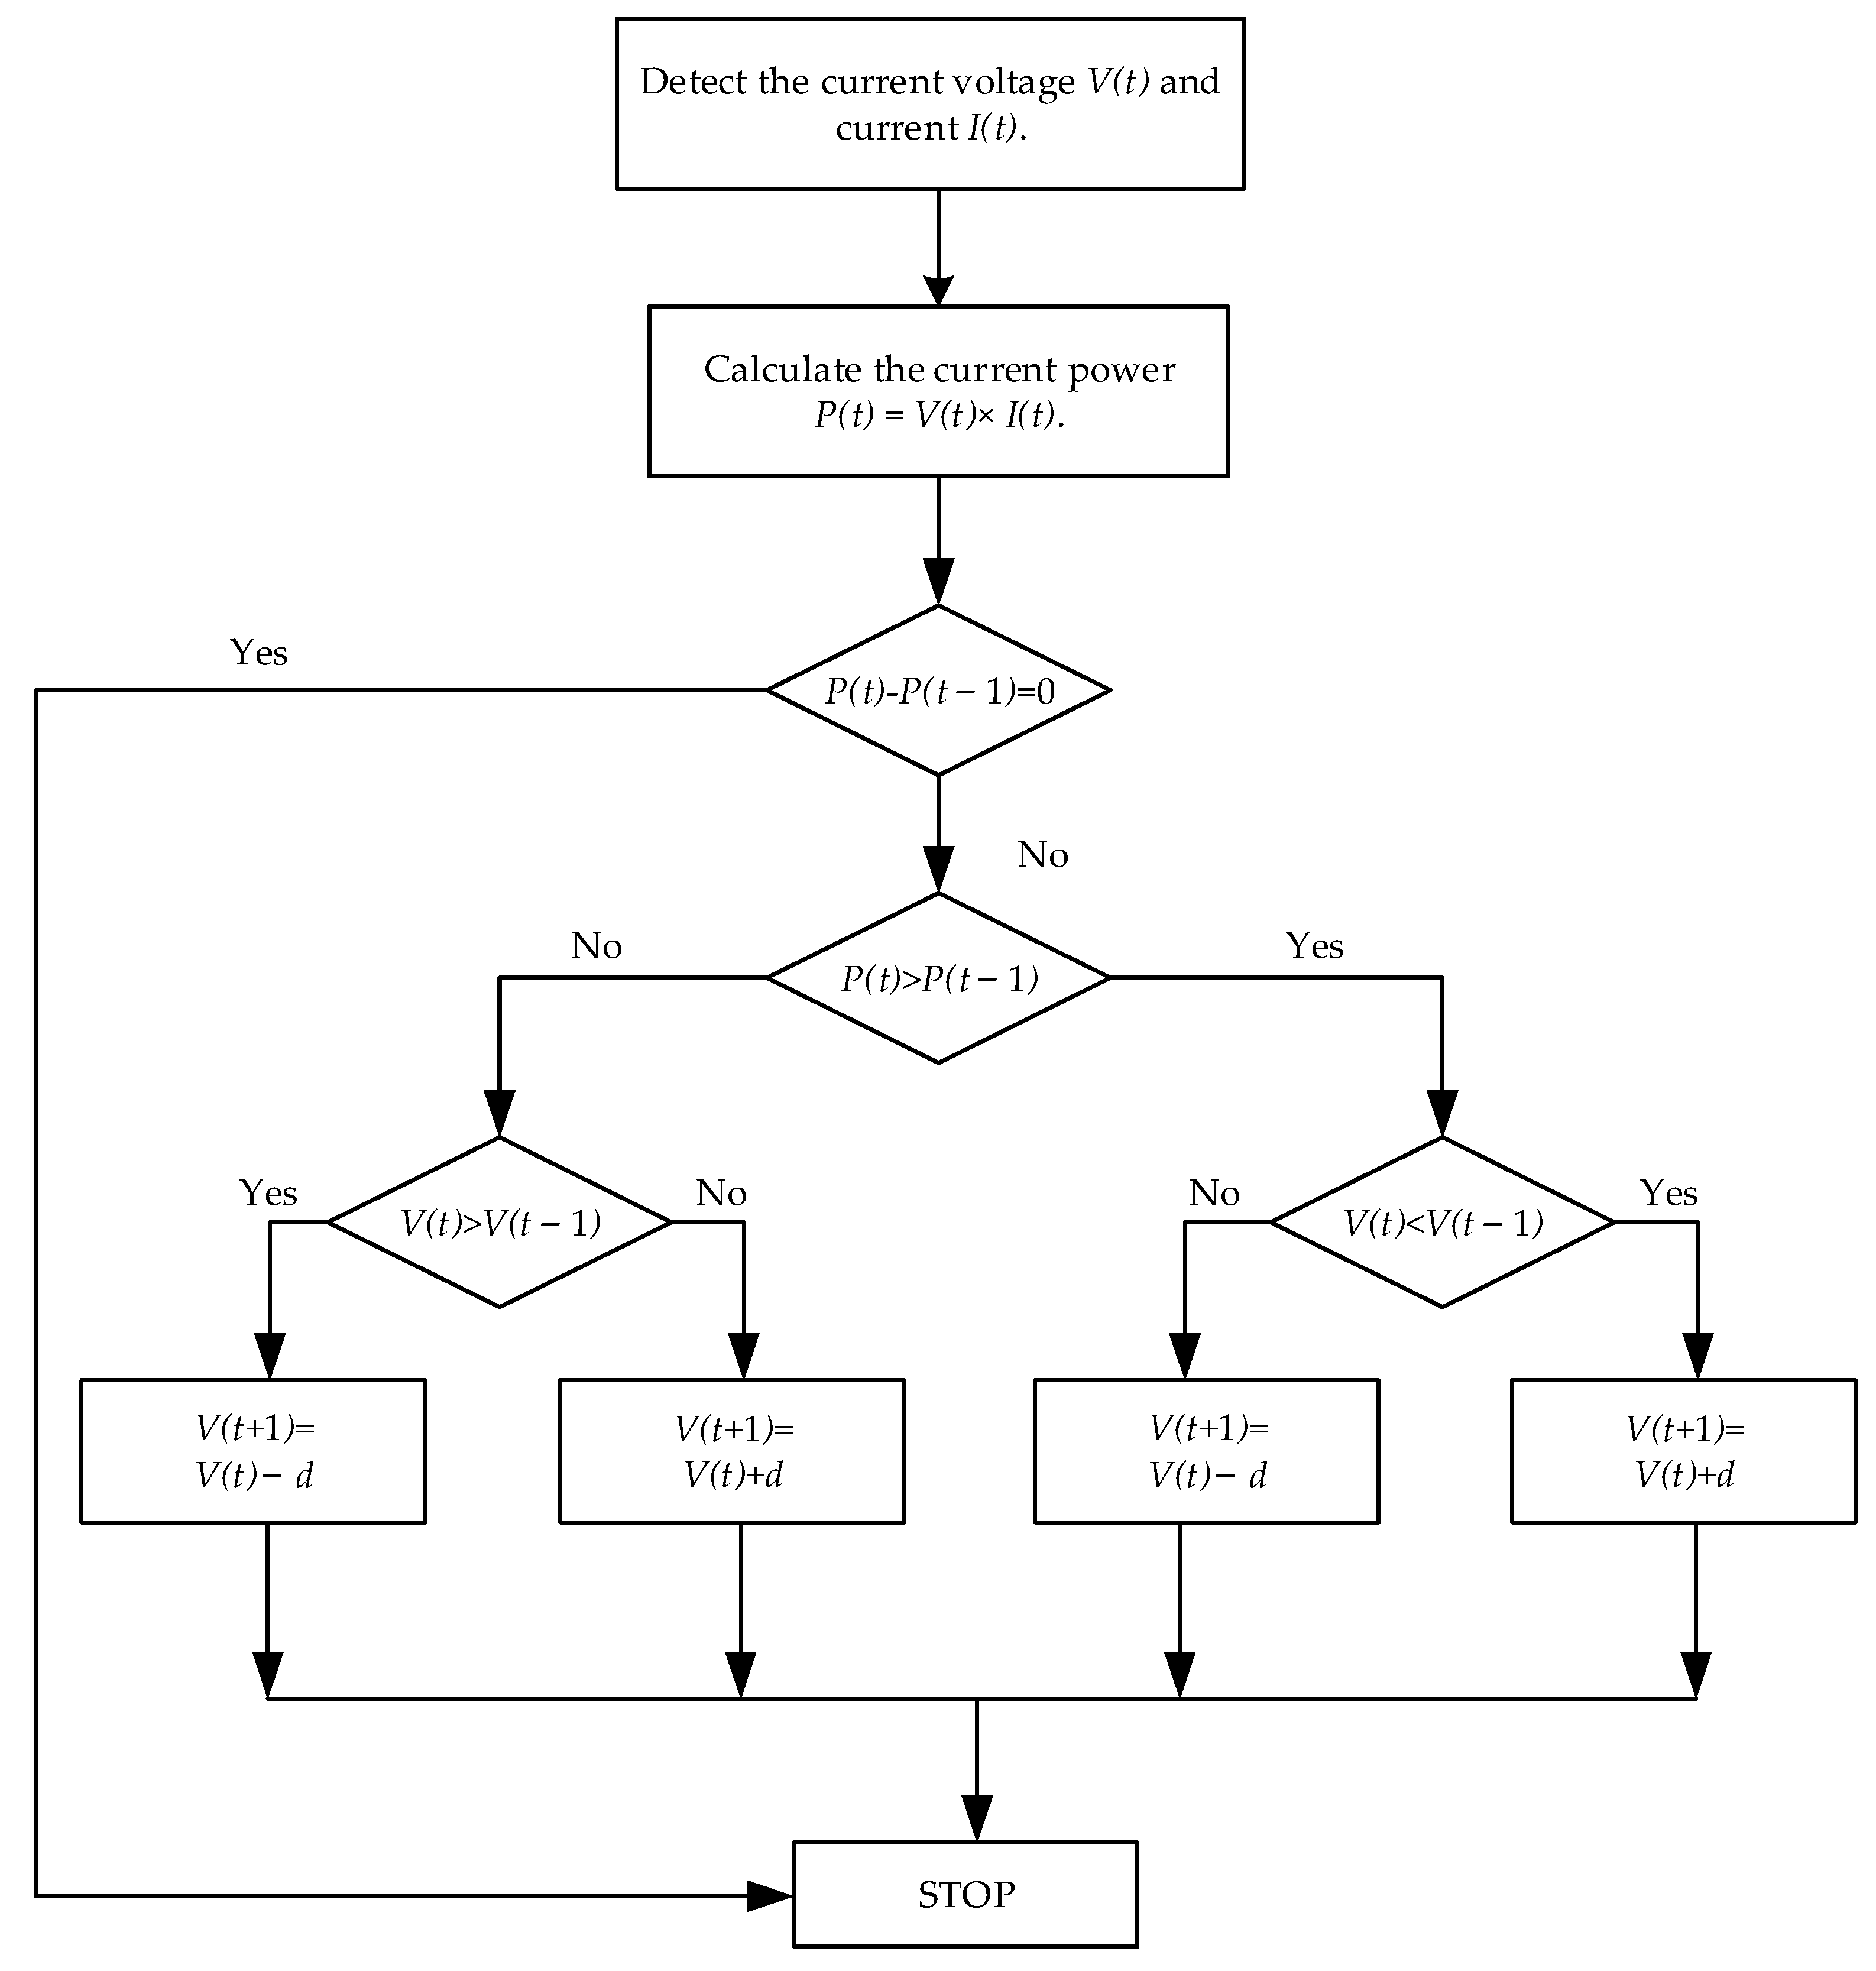
3.1. Introduction to Perturbation Observation Method

Reference [32] gives the logic of using the perturbation and observation method. The perturbation observation method increases or decreases the output power of the photovoltaic array by varying the output voltage or current, ultimately reaching the maximum power point. The usual change in voltage or current value is referred to as a disturbance variable, and the magnitude of the disturbance variable is called the step size.
The specific tracking process is shown in Figure 6, where V(t), I(t) and P(t) are the voltage, current and power of the photovoltaic cell detected at the current moment. V(t−1), I(t−1) and P(t−1) are the voltage, current and power of the photovoltaic cell detected at the previous moment. Reference [33] pointed out that this periodic iterative process will cause the perturbation and observation method to oscillate around the MPP, rather than being stable at the exact MPP. Therefore, we need to improve the traditional perturbation and observation method.

3.2. The Design Process of IP&O-Backstepping

Reference [34] pointed out that it is feasible to narrow the search range of the search algorithm by defining the target operating point of the initial photovoltaic array output characteristic curve and then track the maximum power point of the photovoltaic array. Therefore, this paper divides the overall algorithm into three steps:
Step 1: If the real-time resistance value is lower than the equivalent resistance value ( R p v R p m ), use the large-step P&O algorithm to track the output power of the photovoltaic array. The calculation of the equivalent resistance [35] and the real-time converted resistance is shown in Equation (10):
R p m = V o c V m · V p v max I p v max R p v = V p v / I p v
where Rpm is the equivalent resistance, Vpvmax and Ipvmax are the voltage and current values measured at the maximum power point of the PV array, Rpv is the real-time converted resistance and Vpv and Ipv are the real-time voltage and current.
Step 2: When the real-time converted resistance value exceeds the equivalent resistance value (Rpv > Rpm), use the medium step-size P&O algorithm to track the output power of the photovoltaic array.
Step 3: After the P&O algorithm runs at the maximum power point, the IP&O algorithm detects the peak voltage and trough voltage of the IP&O algorithm in the first oscillation cycle and records the conversion coefficient S1 of the peak voltage (Vmax) and the conversion coefficient S2 of the trough voltage (Vmin). The output reference voltage (Vref) is defined as the sum of the peak voltage of S1 times and the trough voltage of S2 times, and the sum of S1 and S2 is 1.
Finally, it provides the reference voltage Vref. When the minimum output voltage is detected, switch the P&O algorithm to the backstepping algorithm. Use the backstepping algorithm to track the reference voltage Vref, thereby following the maximum output power. The backstepping algorithm is as follows:
Make the output voltage of the photovoltaic array (Vpv) track the reference voltage, with the control error expressed as follows:
e 1 = V p v V r e f
The derivative of Expression (11) is obtained:
e 1 = V p v V r e f
Define the first Lyapunov function as follows:
V 1 = 1 2 e 1 2
The derivative of Expression (13) is obtained:
V 1 = e 1 e 1
Substituting Equation (12) into Equation (14) gives the following:
V 1 = e 1 ( V r e f V p v )
Command V 1 < 0 , V r e f V p v = k 1 e 1 and k 1 > 0 are design constants, obtaining the following:
1 C 1 ( I p v I L ) U r e f = k 1 e 1
Let ILd be the actual tracking value of IL and substitute ILd into (16) to obtain the following:
I L d = I p v C 1 k 1 e 1
Let e2 be the tracking error between ILd and IL; then, the following can be obtained:
e 2 = I L d I L
The derivative of Expression (18) is obtained:
e 2 = I L d I L = I p v C 1 k 1 e 1 f 1 ( x ) g 1 ( x ) μ
The second Lyapunov function is defined as follows:
V 2 = V 1 + 1 2 e 2 2 = k 1 e 1 2 + e 2 e 2
Command V 2 < 0 , e 2 = k 2 e 2 and k 2 > 0 are design constants, obtaining the following:
I p v C 1 k 1 e 1 f 1 ( x ) g 1 ( x ) μ = k 2 e 2
Solving for μ yields the following:
μ = I p v C 1 k 1 e 1 f 1 ( x ) + k 2 e 2 g 1 ( x )
The overall process of the IP&O-backstepping algorithm is shown in Figure 7.

4. Simulation Setup and Results

4.1. Simulation Setting

MATLAB/Simulink is used to build the photovoltaic array, and the modeling of the photovoltaic array is shown in Figure 8.
The photovoltaic array consists of four identical photovoltaic arrays connected in series. Each photovoltaic array is made up of 2 × 4 solar cells. The solar cell parameters are shown in Table 1. The circuit parameters are set as shown in Table 2.
Algorithm parameter setting instructions: Considering that the P&O algorithm needs a large step size to quickly track the maximum power point in the early stage and needs to reduce the step size to avoid excessive oscillation in the later stage, the two step size parameters are set to d1 = 0.05 and d2 = 0.005. The maximum reference voltage should be set to 0, and the minimum reference voltage should be set to exceed the maximum operating voltage of the photovoltaic cell. In this way, when these two voltages change while the voltage fluctuation remains unchanged, we can determine the first oscillation period and record the peak voltage and trough voltage. The voltage setting value is A = 0, B = 300. Through our many rounds of experiments, it was found that when the solar irradiance is higher, the peak voltage is closer to the trough voltage, so the S1 is closer to the S2. When the solar irradiance is small, the peak voltage is quite different from the trough voltage, and the ideal reference voltage is closer to the peak voltage in most cases. In actual operation, the photovoltaic array should work in the place where the solar irradiance is large, so S1 and S2 should be closer. The conversion coefficient is set as follows: S1 = 0.52, S2 = 0.48.
The photovoltaic array is set with three static operating conditions and one dynamic condition to validate the superiority of the algorithm. The settings for the three conditions are shown in Table 3. The P-V curves of the photovoltaic array under these three conditions are illustrated in Figure 9.
To optimize the algorithms, the modern intelligent control algorithms, traditional MPPT algorithms, intelligent optimization algorithms and algorithms combined with traditional MPPT with intelligent optimization are adopted. Modern intelligent control algorithms include the PSO algorithm, the GWO algorithm and the CS algorithm.
Traditional MPPT algorithms include the P&O algorithm and the INC algorithm. The combination of intelligent optimization algorithms with traditional MPPT includes GWO-P&O and CS-INC.
From Figure 9, in case 1, the photovoltaic array receives uniform illumination and has only one maximum power point, which is also the global maximum power point and the maximum power of 7035.83 W. In case 2 and case 3, because the photovoltaic array is subjected to uneven illumination, the P-V curve exhibits one or more local extremum points.
In case 2, the maximum output power is 6544.13 W and the local maximum power is 3471.21 W. In case 3, the maximum output power is 4590.75 W and the local maximum power values are 3912.11 W, 2874.26 W and 1512.76 W.

4.2. Simulation Result

Firstly, some terms are explained. When the output power of the photovoltaic array under this algorithm is almost equal to the ideal maximum output power, it is defined as the algorithm tracks the maximum power point of the photovoltaic array under this condition. The tracking accuracy of the algorithm is the ratio of the output power of the photovoltaic array to the ideal maximum power under this algorithm. The greater the output power, the higher the tracking accuracy. The tracking speed of the algorithm is measured by the length of time when the output power of the photovoltaic array reaches a steady state under this algorithm. The longer the time, the slower the tracking speed.
Secondly, under static shadow conditions, three different scenarios were used to compare the IP&O-backstepping algorithm proposed in this paper with other algorithms. The scenarios are shown in Table 3, and the simulation results are presented in Figure 10, Figure 11, Figure 12 and Figure 13. The tracking results obtained are shown in Table 4.
From Table 4 and Figure 10, Figure 11 and Figure 12, we can draw the following conclusion:
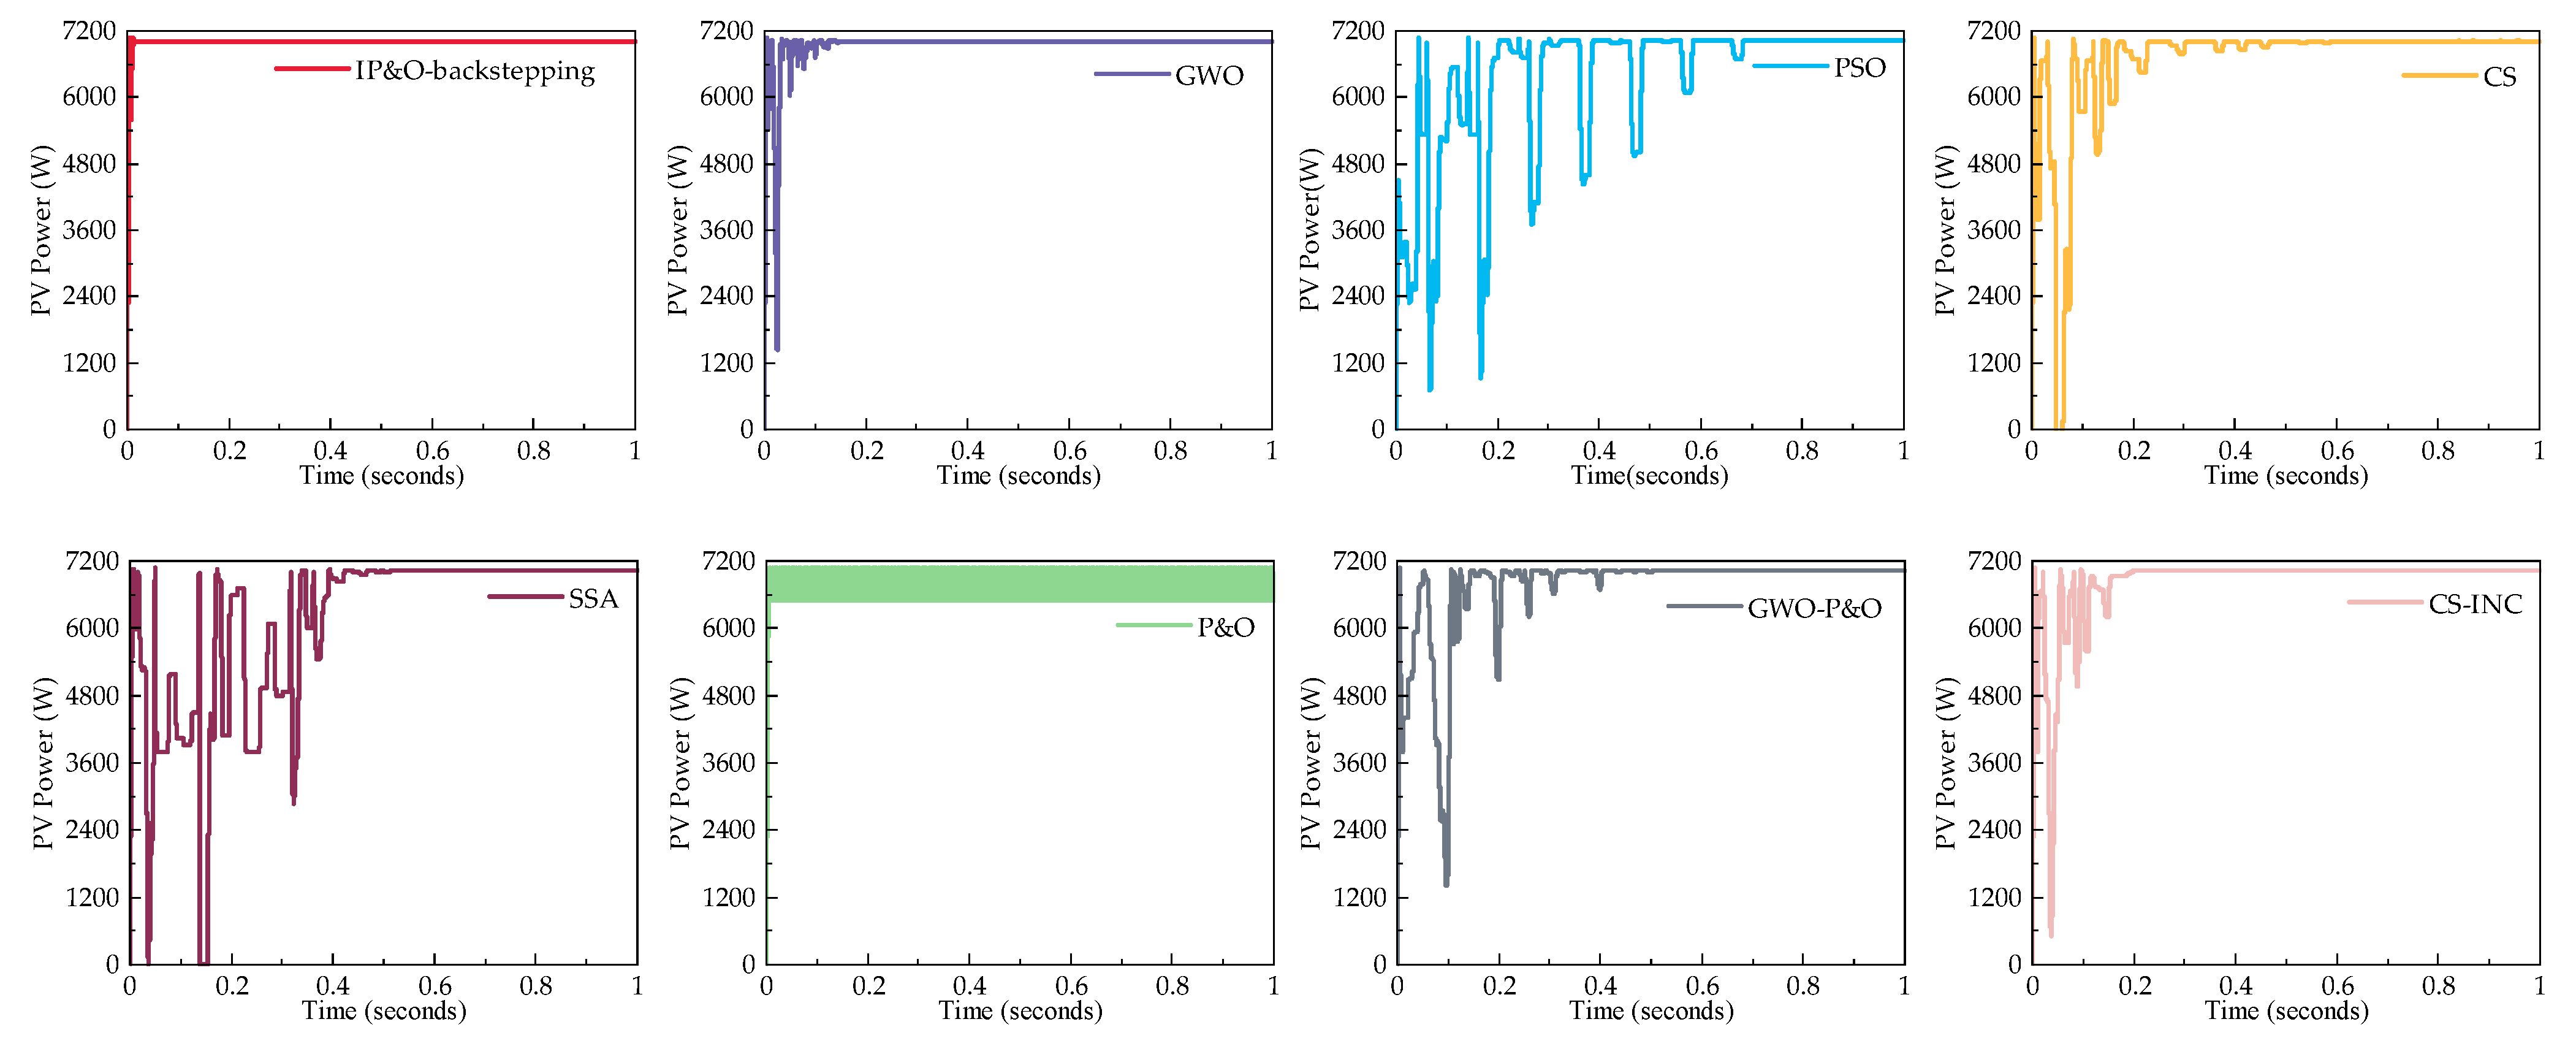
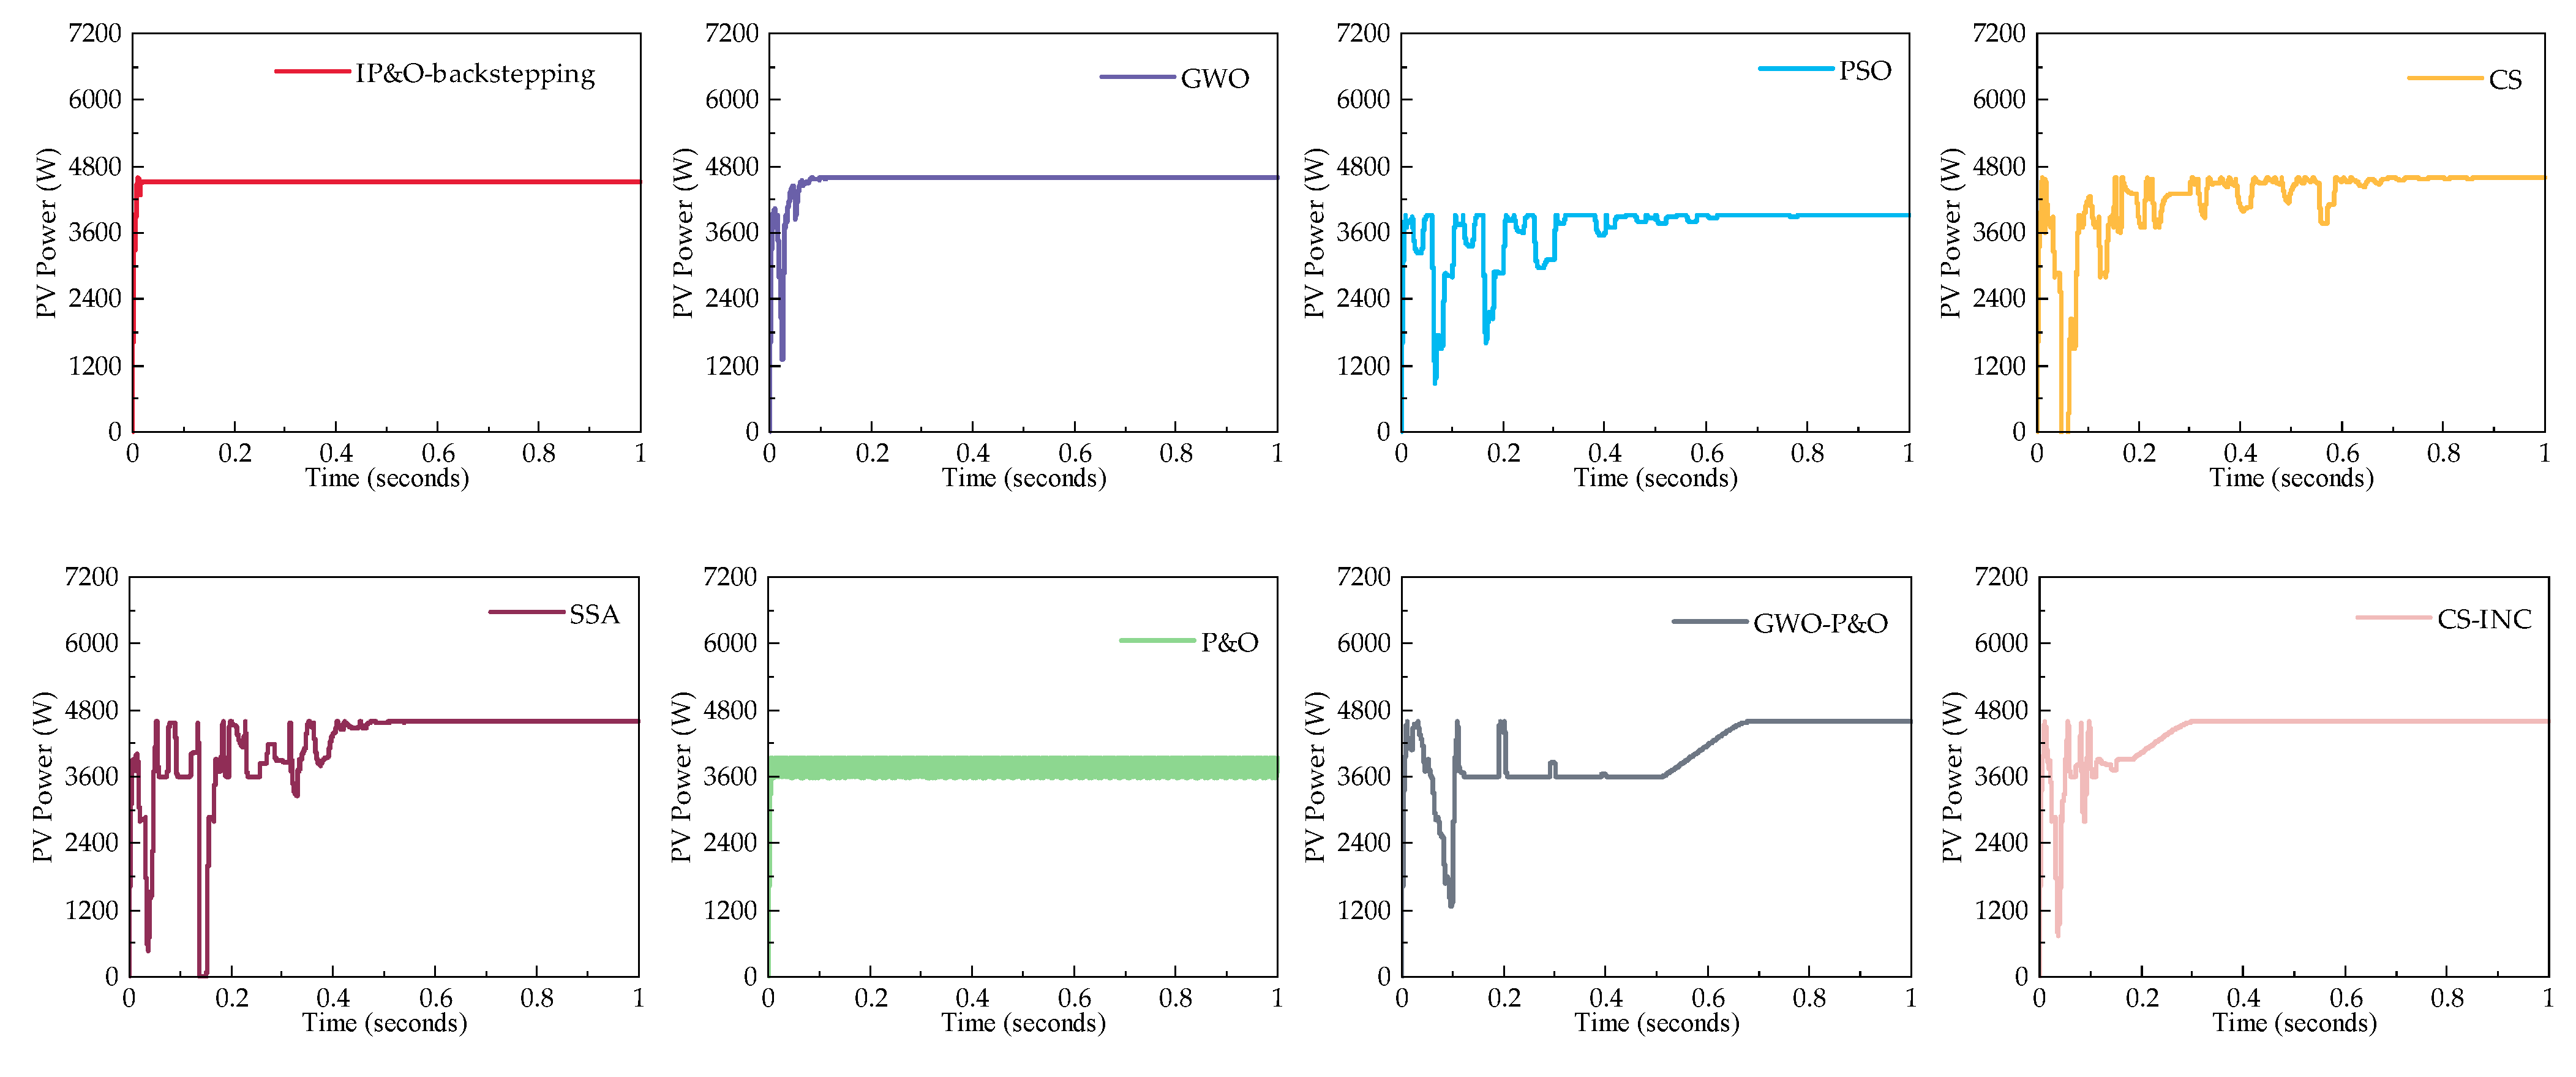
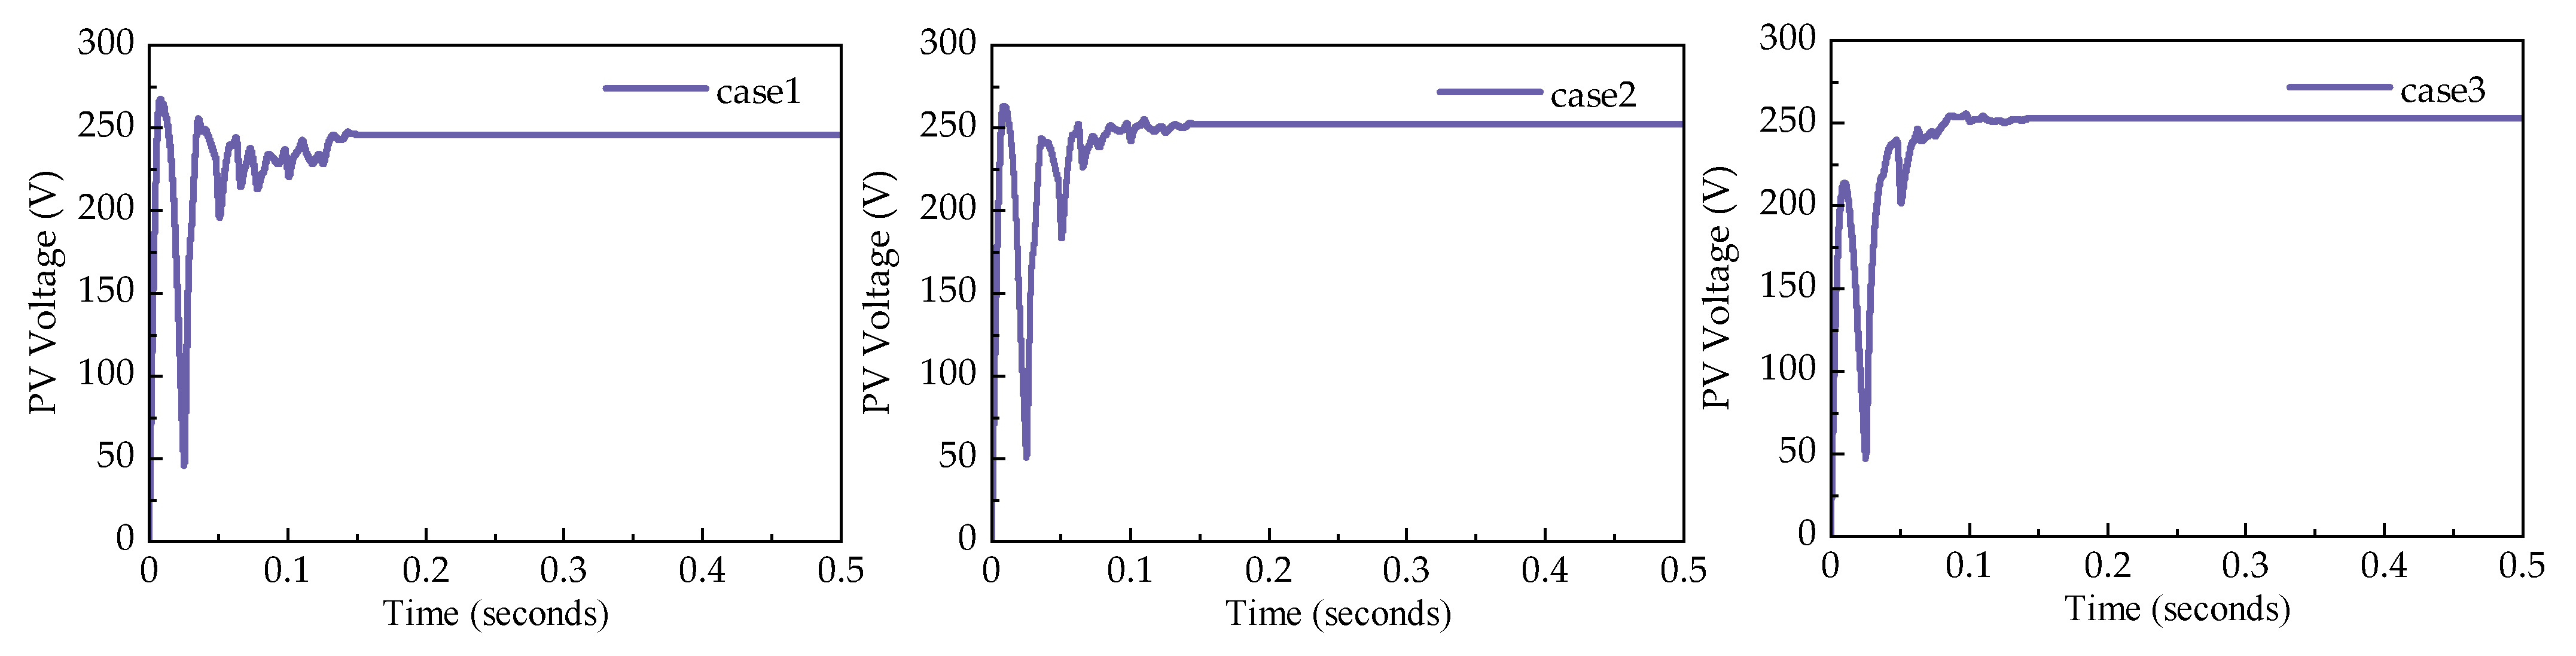
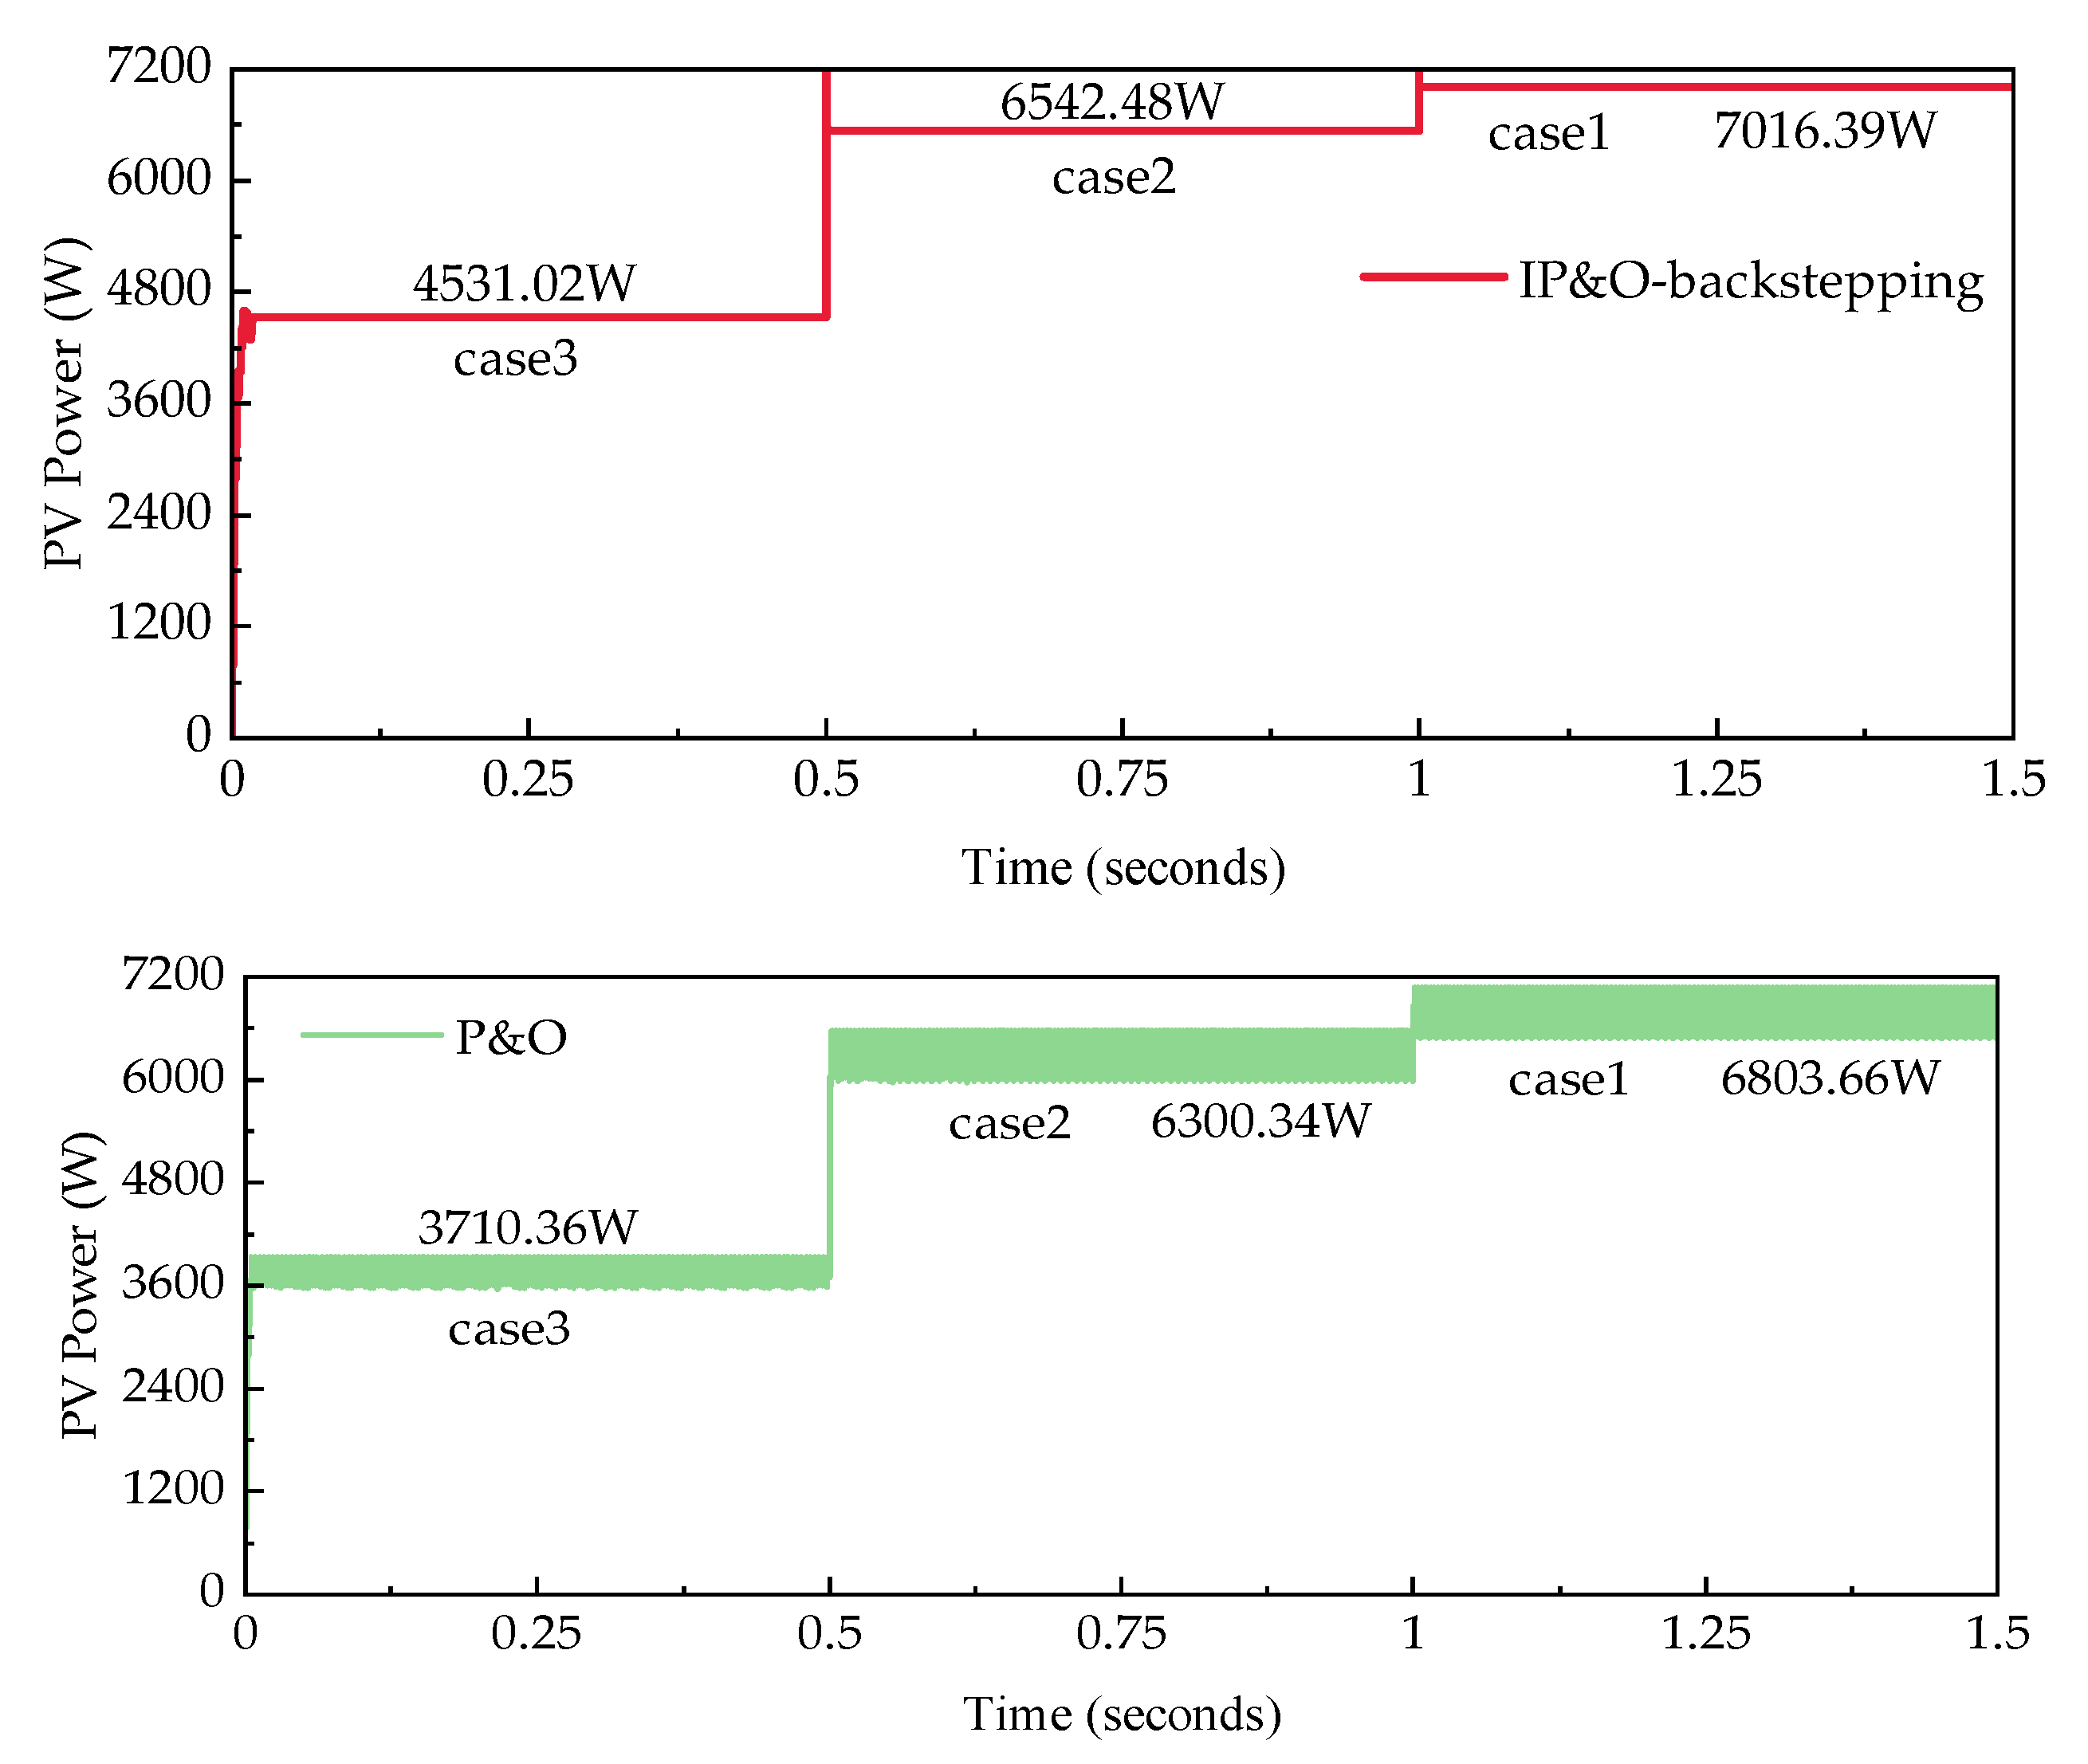
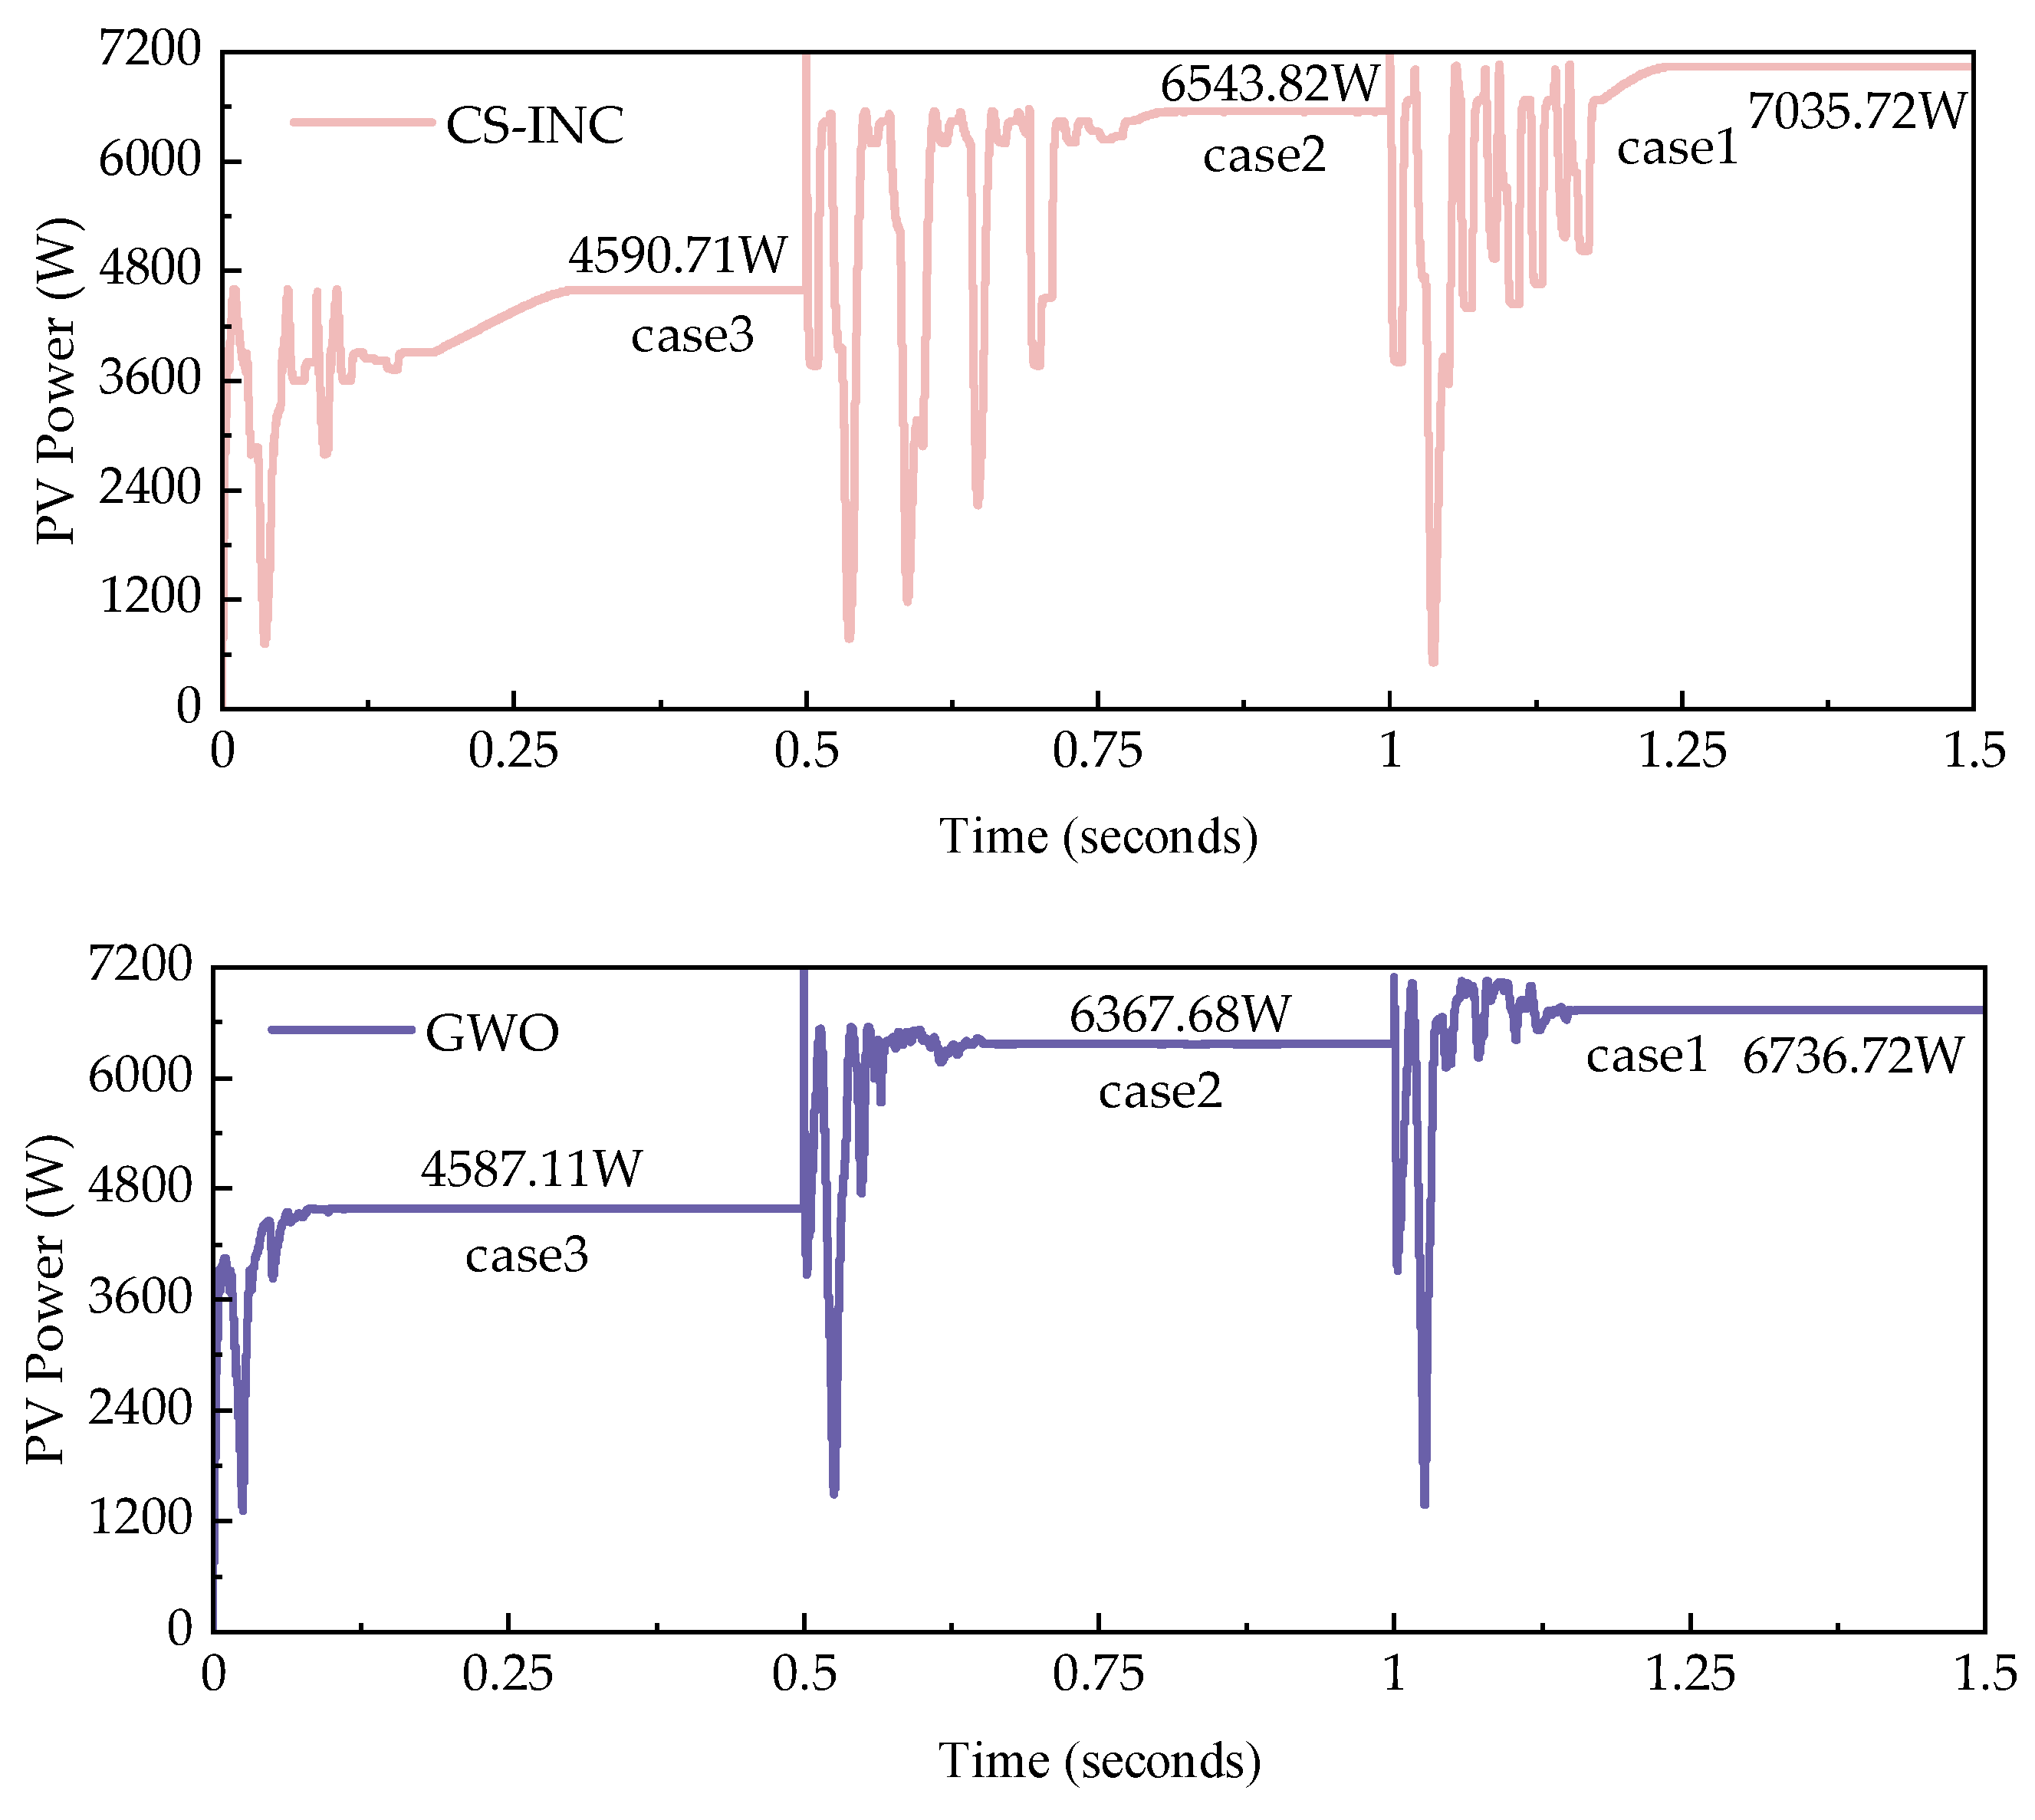
  • Under case 1, all eight algorithms successfully track the maximum power point. The tracking time of the P&O algorithm is as short as 0.005 s, but the step size of the algorithm is too large, leading to excessive power oscillation and instability in the algorithm. The IP&O-backstepping algorithm proposed in this article has a very short tracking time of only 0.013 s, and the algorithm maintains stable power with no oscillations after tracking to the maximum power point. Among the remaining six algorithms, the GWO-P&O algorithm has the highest tracking accuracy at 99.998%. The CS-INC algorithm performs well overall, but the tracking time is also 0.205 s. The CS algorithm, SSA algorithm and PSO algorithm also have good tracking accuracy, but their tracking times all exceed 0.5 s. The tracking time of the GWO algorithm is relatively short compared to other intelligent optimization algorithms, and the algorithm tracking time is 0.151 s.
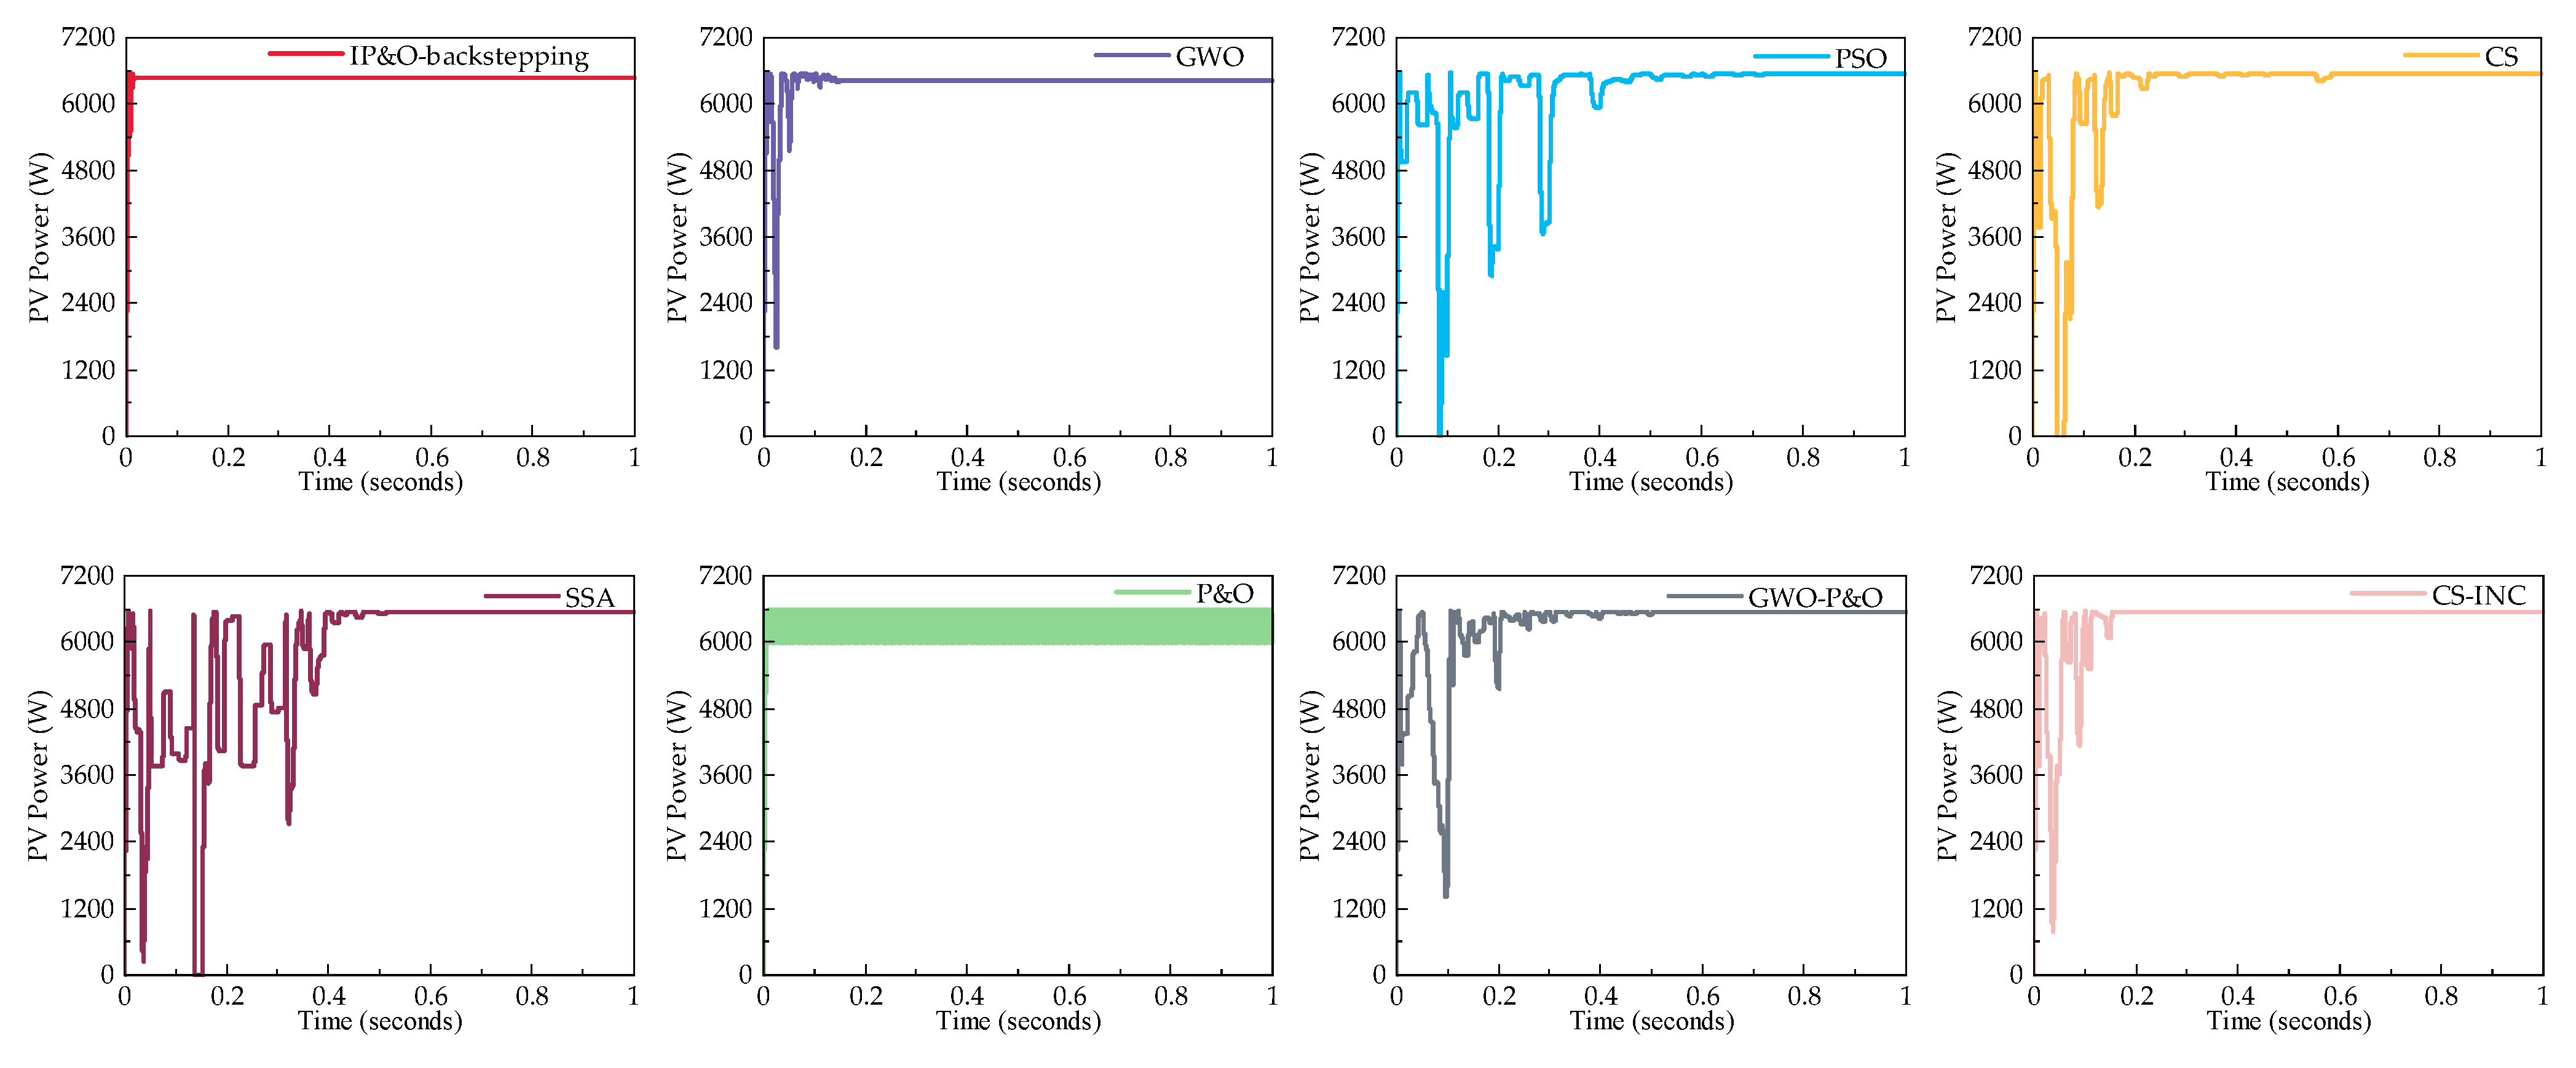
  • Under case 2, all eight algorithms successfully track the maximum power point. Respectively, the shortest tracking times for both the P&O algorithm and the IP&O-backstepping method proposed in this paper are 0.006 s and 0.015 s. The P&O algorithm exhibits oscillations while the method proposed in this paper remains stable. Among the other six algorithms, the GWO algorithm has the shortest tracking time at 0.151 s. The tracking times for the PSO, SSA, CS and GWO-P&O algorithms are all over 0.5 s, but their tracking accuracy exceeds 99%. The overall performance of the CS-INC algorithm is quite good, and its tracking accuracy is 99.944% while its tracking time is 0.154 s.
  • Under case 3, six algorithms track the maximum power point. The P&O algorithm and the PSO algorithm fall into local extremum points. The IP&O-backstepping algorithm proposed in this paper has the shortest time among the six other algorithms for tracking the maximum power point. The tracking time of the GWO algorithm is 0.113 s, making it the fastest among other intelligent optimization algorithms. The tracking times for the CS-INC algorithm, GWO-P&O algorithm, SSA algorithm and CS algorithm are all over 0.5 s.
In summary, the IP&O-backstepping algorithm proposed in this paper can track the maximum power point under three different conditions. Since the reference voltage provided by the P&O algorithm to the backstepping algorithm may not be equal to the ideal reference voltage, the output power may be slightly reduced. However, the output power accuracy of the IP&O-backstepping algorithm proposed in this paper differs by no more than 1.4% compared to other intelligent optimization algorithms or combined algorithms under the same conditions.
Additionally, this algorithm boasts an absolute speed advantage and tracking accuracy of over 98.5% each time. Compared to the P&O algorithm, which is known for its speed advantage, the IP&O-backstepping algorithm is stable after tracking the maximum power point, and the algorithm is without power oscillation issues. Additionally, because the IP&O algorithm is used, the IP&O-backstepping algorithm more easily escapes local extrema compared to the traditional P&O algorithm.
Under three cases, the output voltage of the IP&O-backstepping algorithm proposed in this paper is shown in Figure 13, the output voltage of the P&O algorithm is shown in Figure 14, the output voltage of the CS-INC algorithm is shown in Figure 15 and the output voltage of the GWO algorithm is shown in Figure 16.
From Figure 13 and Figure 14, it can be observed that the IP&O-backstepping algorithm proposed in this paper stabilizes the voltage after tracking the maximum power point. In contrast, the voltage oscillates significantly with the P&O algorithm.
From Figure 15, it can be seen that the CS-INC algorithm begins with a preliminary search executed by the CS algorithm, followed by a subsequent search completed by the INC algorithm. Due to the fixed step size of the INC algorithm, the output voltage experiences slight oscillations.
From Figure 16, the GWO algorithm automatically yields the duty cycle at the maximum power point after reaching the iteration cycle. The algorithm’s tracking speed is relatively fast, but the results have a certain degree of randomness.
The algorithm presented in this paper is compared with the commonly used P&O algorithm for photovoltaic power stations, the well-performing CS-INC algorithm and the fast-tracking GWO algorithm under dynamic shading conditions. The sequence of dynamic shading transitions is case 3–case 2–case 1. The simulation results are shown in Figure 17. The tracking time of each algorithm is shown in Table 5.
From Figure 17 and Table 5, we can draw the following conclusions. Under dynamic shading, the IP&O-backstepping algorithm has advantages over the P&O algorithm, such as the ability to escape local extremum points, higher tracking accuracy and minimal power oscillation once it reaches the maximum power point. Compared to the intelligent optimization algorithms like CS-INC and GWO, the IP&O-backstepping algorithm has an absolute speed advantage while ensuring tracking accuracy.

5. Conclusions

This paper proposes an IP&O-backstepping algorithm which is divided into three steps. Step one of using the algorithm involves using a large-step P&O algorithm to move the photovoltaic array’s output power point to the intersection of the I-U curve and the load line. In step two, the algorithm employs a medium-step P&O algorithm to move the photovoltaic array’s output power point to the maximum power point. In step three, once the designed switching conditions are met, the IP&O algorithm provides the reference voltage to the backstepping algorithm, completing the tracking of the maximum power point and stabilizing the output power of the photovoltaic array.
The simulation results indicate that the IP&O-backstepping algorithm has the following advantages compared to the GWO, PSO, CS, SSA, GWO-P&O and CS-INC algorithms.
  • The speed advantage of traditional MPPT algorithms.
  • The ability of intelligent optimization algorithms to avoid getting stuck in local extremum points.
  • Minimal power oscillation after the algorithm tracks the maximum power point.
In future research, the IP&O-backstepping algorithm proposed in this paper leaves much to be improved. The main improvement direction will focus on the calculation of the reference voltage values provided by the IP&O algorithm. Additionally, tests will be conducted under more complex environmental conditions to further validate its effectiveness.

Author Contributions

Y.W. Methodology, Writing—Original Draft, Software, Validation, Formal analysis; L.S. Resources. All authors have read and agreed to the published version of the manuscript.

Funding

This research was supported by the 2024 Fundamental Research Funding of the Educational Department of Liaoning Province (LJZZ212410154028).

Data Availability Statement

The data are contained within the article.

Conflicts of Interest

The authors declare no conflicts of interest.

References

  1. Fan, G.; Duan, B.; Zhang, Y.; Yang, Y.; Ji, X.; Li, X. Secondary concentrator design of an updated space solar power satellite with a spherical concentrator. Sol. Energy 2021, 214, 400–408. [Google Scholar] [CrossRef]
  2. Hussaian Basha, C.; Palati, M.; Dhanamjayulu, C.; Muyeen, S.M.; Venkatareddy, P. A novel on design and implementation of hybrid MPPT controllers for solar PV systems under various partial shading conditions. Sci. Rep. 2024, 14, 1609. [Google Scholar] [CrossRef] [PubMed]
  3. Libra, M.; Kozelka, M.; Šafránková, J.; Belza, R.; Poulek, V.; Beránek, V.; Sedláček, J.; Zholobov, M.; Šubrt, T.; Severová, L.J.I.A. Agrivoltaics: Dual usage of agricultural land for sustainable development. Int. Agrophys 2024, 38, 121–126. [Google Scholar] [CrossRef]
  4. Hernandez Velasco, M. Enabling year-round cultivation in the nordics-agrivoltaics and adaptive LED lighting control of daily light integral. Agriculture 2021, 11, 1255. [Google Scholar] [CrossRef]
  5. Kahani, R.; Jamil, M.; Iqbal, M.T. An improved perturb and observed maximum power point tracking algorithm for photovoltaic power systems. J. Mod. Power Syst. Clean Energy 2022, 11, 1165–1175. [Google Scholar] [CrossRef]
  6. Srikanth, M.; Yadlapati, K. MPPT Techniques Exploration under Uniform and Non-Uniform Solar Irradiance Condition–A Survey. In E3S Web of Conferences; EDP Sciences: Evry, France, 2024; Volume 472. [Google Scholar]
  7. Tajuddin, M.F.N.; Arif, M.S.; Ayob, S.M.; Salam, Z. Perturbative methods for maximum power point tracking (MPPT) of photovoltaic (PV) systems: A review. Int. J. Energy Res. 2015, 39, 1153–1178. [Google Scholar] [CrossRef]
  8. Celik, B.; Karatepe, E.; Gokmen, N.; Silvestre, S. A virtual reality study of surrounding obstacles on BIPV systems for estimation of long-term performance of partially shaded PV arrays. Renew. Energy 2013, 60, 402–414. [Google Scholar] [CrossRef]
  9. Ramli, M.A.; Twaha, S.; Ishaque, K.; Al-Turki, Y.A. A review on maximum power point tracking for photovoltaic systems with and without shading conditions. Renew. Sustain. Energy Rev. 2017, 67, 144–159. [Google Scholar] [CrossRef]
  10. Elgendy, M.A.; Zahawi, B.; Atkinson, D.J. Operating characteristics of the P&O algorithm at high perturbation frequencies for standalone PV systems. IEEE Trans. Energy Convers. 2014, 30, 189–198. [Google Scholar]
  11. Yilmaz, M. Comparative Analysis of Hybrid Maximum Power Point Tracking Algorithms Using Voltage Scanning and Perturb and Observe Methods for Photovoltaic Systems under Partial Shading Conditions. Sustainability 2024, 16, 4199. [Google Scholar] [CrossRef]
  12. Chellakhi, A.; El Beid, S.; Abouelmahjoub, Y.; Mchaouar, Y. Optimization of power extracting from photovoltaic systems based on a novel adaptable step INC MPPT approach. IFAC-PapersOnLine 2022, 55, 508–513. [Google Scholar] [CrossRef]
  13. Vijayakumari, A. A non-iterative MPPT of PV array with online measured short circuit and open circuit quantities. J. King Saud Univ.-Eng. Sci. 2021, 33, 176–185. [Google Scholar] [CrossRef]
  14. Yu, G.R.; Chang, Y.D.; Lee, W.S. Maximum Power Point Tracking of Photovoltaic Generation System Using Improved Quantum-Behavior Particle Swarm Optimization. Biomimetics 2024, 9, 223. [Google Scholar] [CrossRef]
  15. Liu, F.; Gao, J.; Liu, H. A fault diagnosis solution of rolling bearing based on MEEMD and QPSO-LSSVM. IEEE Access 2020, 8, 101476–101488. [Google Scholar] [CrossRef]
  16. Anbarasi, M.P.; Kanthalakshmi, S. Power maximization in standalone photovoltaic system: An adaptive PSO approach. Soft Comput. 2023, 27, 8223–8232. [Google Scholar] [CrossRef]
  17. Mirjalili, S.; Mirjalili, S.M.; Lewis, A. Grey wolf optimizer. Adv. Eng. Softw. 2014, 69, 46–61. [Google Scholar] [CrossRef]
  18. Mohanty, S.; Subudhi, B.; Ray, P.K. A new MPPT design using grey wolf optimization technique for photovoltaic system under partial shading conditions. IEEE Trans. Sustain. Energy 2015, 7, 181–188. [Google Scholar] [CrossRef]
  19. Silaa, M.Y.; Barambones, O.; Bencherif, A.; Rahmani, A. A New MPPT-Based Extended Grey Wolf Optimizer for Stand-Alone PV System: A Performance Evaluation versus Four Smart MPPT Techniques in Diverse Scenarios. Inventions 2023, 8, 142. [Google Scholar] [CrossRef]
  20. Gundogdu, H.; Demirci, A.; Tercan, S.M.; Cali, U. A novel improved grey wolf algorithm based global maximum power point tracker method considering partial shading. IEEE Access 2024, 12, 6148–6159. [Google Scholar] [CrossRef]
  21. Yang, X.S.; Deb, S. Cuckoo search via Lévy flights. In Proceedings of the 2009 World Congress on Nature & Biologically Inspired Computing (NaBIC), Coimbatore, India, 9–11 December 2009. [Google Scholar]
  22. Ahmed, J.; Salam, Z. A Maximum Power Point Tracking (MPPT) for PV system using Cuckoo Search with partial shading capability. Appl. Energy 2014, 119, 118–130. [Google Scholar] [CrossRef]
  23. Liu, X.; Zou, H. Photovoltaic MPPT based on improved Cuckoo algorithm. J. Phys. Conf. Ser. 2024, 2814, 012001. [Google Scholar] [CrossRef]
  24. Eltamaly, A.M. An improved cuckoo search algorithm for maximum power point tracking of photovoltaic systems under partial shading conditions. Energies 2021, 14, 953. [Google Scholar] [CrossRef]
  25. Zaghba, L.; Borni, A.; Khennane, M.; Fezzani, A.; Bouchakour, A. An efficient, intelligent PSO-P&O-PI MPPT mechanism for Photovoltaic Systems under variable climatic conditions. J. Renew. Energ. 2024, 27, 15–33. [Google Scholar]
  26. Figueiredo, S.; e Silva, R.N.A.L. Hybrid MPPT technique PSO-P&O applied to photovoltaic systems under uniform and partial shading conditions. IEEE Lat. Am. Trans. 2021, 19, 1610–1617. [Google Scholar]
  27. Chtita, S.; Motahhir, S.; El Hammoumi, A.; Chouder, A.; Benyoucef, A.S.; El Ghzizal, A.; Derouich, A.; Abouhawwash, M.; Askar, S.S. A novel hybrid GWO–PSO-based maximum power point tracking for photovoltaic systems operating under partial shading conditions. Sci. Rep. 2022, 12, 10637. [Google Scholar] [CrossRef]
  28. Chauhan, U.; Chhabra, H.; Rani, A.; Kumar, B.; Singh, V. Efficient MPPT controller for solar PV system using GWO-CS optimized fuzzy logic control and conventional incremental conductance technique. Iran. J. Sci. Technol. Trans. Electr. Eng. 2023, 47, 463–472. [Google Scholar] [CrossRef]
  29. Zhang, J.; Ren, G.; Xue, Y.; Xia, D.; Wang, J.; Hu, Z. Improvement of maximum power point tracking in photovoltaic arrays in different environments using hybrid algorithms. Optoelectron. Lett. 2024, 20, 28–34. [Google Scholar] [CrossRef]
  30. Kumar, M.; Panda, K.P.; Rosas-Caro, J.C.; Valderrabano-Gonzalez, A.; Panda, G. Comprehensive review of conventional and emerging maximum power point tracking algorithms for uniformly and partially shaded solar photovoltaic systems. IEEE Access 2023, 11, 31778–31812. [Google Scholar] [CrossRef]
  31. Chiu, C.-S.; Ouyang, Y.-L.; Ku, C.-Y. Terminal sliding mode control for maximum power point tracking of photovoltaic power generation systems. Sol. Energy 2012, 86, 2986–2995. [Google Scholar] [CrossRef]
  32. De Oliveira, F.M.; Brandt, M.H.M.; Salvadori, F.; Izquierdo, J.E.E.; Cavallari, M.R.; Ando Junior, O.H. Development of an MPPT-Based Genetic Algorithm for Photovoltaic Systems versus Classical MPPT Techniques in Scenarios with Partial Shading. Inventions 2024, 9, 64. [Google Scholar] [CrossRef]
  33. Jalil, M.F.; Khatoon, S.; Nasiruddin, I.; Bansal, R.C. Review of PV array modelling, configuration and MPPT techniques. Int. J. Model. Simul. 2022, 42, 533–550. [Google Scholar] [CrossRef]
  34. Kobayashi, K.; Takano, I.; Sawada, Y. A study on a two stage maximum power point tracking control of a photovoltaic system under partially shaded insolation conditions. In Proceedings of the 2003 IEEE Power Engineering Society General Meeting, (IEEE Cat. No. 03CH37491), Toronto, ON, Canada, 13–17 July 2003; Volume 4, pp. 2612–2617. [Google Scholar]
  35. Onat, N. Recent developments in maximum power point tracking technologies for photovoltaic systems. Int. J. Photoenergy 2010, 2010, 245316. [Google Scholar] [CrossRef]
Figure 1. Structure topology of PV cells.
Electronics 13 03960 g001
Figure 2. Arrangement of PV array.
Electronics 13 03960 g002
Figure 3. Output characteristic curve under uniform illumination: (a) P-V curve and (b) I-V curve.
Electronics 13 03960 g003
Figure 4. Output characteristic curve under partial shadow: (a) P-V curve and (b) I-V curve.
Electronics 13 03960 g004
Figure 5. Topological structure of PV power generation system.
Electronics 13 03960 g005
Figure 6. Flow chart of disturbance observation method.
Electronics 13 03960 g006
Figure 7. The flow chart of IP&O-backstepping algorithm.
Electronics 13 03960 g007
Figure 8. Simulation modeling of PV array.
Electronics 13 03960 g008
Figure 9. P-V curves of PV array under three working conditions.
Electronics 13 03960 g009
Figure 10. Tracking results of eight algorithms under case 1.
Electronics 13 03960 g010
Figure 11. Tracking results of eight algorithms under case 2.
Electronics 13 03960 g011
Figure 12. Tracking results of eight algorithms under case 3.
Electronics 13 03960 g012
Figure 13. Output voltage of the IP&O-backstepping algorithm.
Electronics 13 03960 g013
Figure 14. Output voltage of the P&O algorithm.
Electronics 13 03960 g014
Figure 15. Output voltage of the CS-INC algorithm.
Electronics 13 03960 g015
Figure 16. Output voltage of the GWO algorithm.
Electronics 13 03960 g016
Figure 17. Simulation results of four algorithms under dynamic shadows.
Electronics 13 03960 g017aElectronics 13 03960 g017b
Table 1. Parameters of PV cells.
Name of Physical QuantitySymbolNumerical ValueUnit
photovoltaic cell output currentI A
photovoltaic cell output voltageV V
light intensityG W/m2
ambient temperatureTc298.15K
diode saturation currentIs 2.9273 × 10 10 A
diode ideal factorA0.98119
parallel resistanceRsh106.1817Ω
series resistanceRs0.18964Ω
photogenerated currentIph7.9642A
open circuit voltageVoc36.06V
short circuit currentIsc7.95A
maximum power point voltageVm30.12V
maximum power point currentIm7.3A
maximum powerP219.876W
Table 2. Parameters of each component in the PV power generation system topology.
SymbolNumerical ValueUnit
Cin550uF
L8mH
Cout12uF
CR0.1Ω
R20Ω
Table 3. The setting of three working conditions.
CasesIrradiance (W/m2)Power at
GMPP (W)
PV1PV2PV3PV4
110001000100010007035.83
2100090010009006544.13
36009007008004590.75
Table 4. Tracking results of six algorithms in different shadow modes.
PatternAlgorithmsTrack
Power (W)
Track
Time (s)
Track
Accuracy (%)
Case 1IP&O-backstepping7005.670.01399.571
GWO7002.880.15199.532
PSO7034.660.68899.983
CS7004.750.47199.249
SSA7032.330.47299.950
P&O6799.730.00596.644
GWO-P&O7035.710.50599.998
CS-INC7031.040.20599.932
Case 2IP&O-backstepping6475.440.01598.950
GWO6420.620.15198.113
PSO6541.390.72699.958
CS6540.050.59099.938
SSA6541.390.51699.958
P&O6279.450.00695.955
GWO-P&O6541.590.50499.961
CS-INC6540.440.15499.944
Case 3IP&O-backstepping4530.390.01898.685
GWO4590.120.11399.986
PSO3909.250.62585.155
CS4590.050.81599.985
SSA4590.670.51999.998
P&O3752.480.00681.740
GWO-P&O4588.390.67999.949
CS-INC4590.470.30399.994
Table 5. Tracking results of four algorithms in dynamic modes.
PatternAlgorithmsTrack Time (s)
Case 3IP&O-backstepping0.013
P&O0.007
CS-INC0.302
GWO0.096
Case 2IP&O-backstepping0.004
P&O0.002
CS-INC0.303
GWO0.151
Case 1IP&O-backstepping0.006
P&O0.006
CS-INC0.232
GWO0.163
Disclaimer/Publisher’s Note: The statements, opinions and data contained in all publications are solely those of the individual author(s) and contributor(s) and not of MDPI and/or the editor(s). MDPI and/or the editor(s) disclaim responsibility for any injury to people or property resulting from any ideas, methods, instructions or products referred to in the content.

