Article

Analysis of Handwriting for Recognition of Parkinson’s Disease: Current State and New Study

by
Kamila Białek
1,
Anna Potulska-Chromik
2,
Jacek Jakubowski
1,*,
Monika Nojszewska
2 and
Anna Kostera-Pruszczyk
2
1
Faculty of Electronics, Military University of Technology, 00-908 Warsaw, Poland
2
Department of Neurology, Medical University of Warsaw, 02-097 Warsaw, Poland
*
Author to whom correspondence should be addressed.
Electronics 2024, 13(19), 3962; https://doi.org/10.3390/electronics13193962 (registering DOI)
Submission received: 29 August 2024 / Revised: 1 October 2024 / Accepted: 7 October 2024 / Published: 9 October 2024
(This article belongs to the Collection Image and Video Analysis and Understanding)

Abstract

:
One of the symptoms of Parkinson’s disease (PD) is abnormal handwriting caused by motor dysfunction. The development of tablet technology opens up opportunities for an effective analysis of the writing process of people suffering from Parkinson’s disease, aimed at supporting medical diagnosis using machine learning methods. Several approaches have been used and presented in the literature that discuss the analysis and understanding of images created during the writing of single words or sentences. In this study, we propose an analysis based on a sequence of sentences, which allows us to assess the evolution of writing over time. The study material consisted of handwriting image samples acquired in a group of 24 patients with PD and 24 healthy controls. The parameterization of the handwriting image samples was carried out using domain knowledge. Using the exhaustive search method, we selected the relevant features for the SVM algorithm performing binary classification. The results obtained were assessed using quality measures, including overall accuracy, which was 91.67%. The results were compared with competitive works on the same subject and seem to be better (a higher level of accuracy with a much smaller number of features than those presented by others).

1. Introduction

Parkinson’s disease (PD) is a progressive neurodegenerative disorder characterized by decreased motor function. Currently, it is the second most common neurodegenerative disease after Alzheimer’s disease [1]. It is estimated that approximately 0.3% of the entire population suffers from it, and in the population over 60 years of age, its prevalence is approximately 1%, increasing to as much as 3% among people over 80 years of age [2]. The projected number of people with Parkinson’s disease in western Europe will reach more than 9 million by 2030 [3]. Although this disease mainly affects the elderly and its incidence increases with age, there are cases before age 50 [4]. The contemporary diagnosis of Parkinson’s disease is based on a direct clinical picture and medical history that should meet diagnostic criteria. The main symptoms of this disease are tremor, slow movement (bradykinesia), stiffness of the limbs and instability of body posture [5,6]. The appearance of any of these symptoms can obviously affect the quality of handwriting, which is a complex process that requires cognitive, perceptual and motor skills [7]. Therefore, writing problems and changes in writing may be one of the first noticeable symptoms of Parkinson’s disease and may form the basis for the clinical diagnosis of this disease at an early stage when the severity of classic symptoms is small [8].
The PD diagnostic criteria for writing are formulated in Part II of the Unified Parkinson’s Disease Rating Scale (UPDRS) adopted in 1987 [9]. This scale is a common medical standard for diagnosing and assessing the severity of Parkinson’s disease symptoms, and Part II allows for a quantitative assessment of the selected motor aspects of experience of daily living (M-EDL), including writing. According to this scale, a clinician tries to find out if other people have difficulty reading the patient’s handwriting and assesses the clarity of the handwriting using a five-point gradation. Higher values correspond to greater problems when reading text handwritten by the patient. The lowest value is 0, which corresponds to no problems (normal), and the highest is 4, which corresponds to the case when most or all words cannot be read (severe). Intermediate conditions of PD symptoms are slight, mild and moderate. The evaluation performed is subjective in nature and requires extensive experience of the physician performing the medical examination. Therefore, there is clinical justification for the introduction of objectivity in the evaluation of handwriting for diagnostic purposes and its archiving to track the progression of the disease. The recent development of graphic tablet technology that allows for the objective acquisition of handwriting images has led many research teams to start searching for new handwriting markers that could be used in this matter, especially at an early stage of the disease. A brief overview of the approaches presented in the literature is provided in Section 2.
The purpose of this paper is to investigate the possibility of developing an automated recognition model that performs the task of the binary classification of patients with PD vs. healthy controls (HCs), is fed with handwriting images acquired in a novel way and uses feature engineering and machine learning. We do not discuss the issues of the automatic generation of features based on entire images, which is the domain of convolutional neural networks (CNNs). CNN models are very fashionable nowadays, but it must be remembered that these are large models that usually require a very large amount of data in training. In our approach, we tried to select a limited number of features using domain knowledge about Parkinson’s disease and applied the method of machine learning used in competitive works in order to emphasize the main novelty of this work. And the novelty, in contrast to other papers devoted to handwriting analysis to detect new markers of PD, is the use of a sequence of sentences written by patients, which allows for a quantitative assessment of the evolution of handwriting over time.

2. Related Works

2.1. Features of Handwriting

One of the most characteristic changes noticeable in the handwriting of people with PD symptoms is micrographia, that is, the phenomenon of gradually reducing the size of handwriting during writing [10,11,12]. In the first studies devoted to the analysis of the handwriting of people suffering from Parkinson’s disease, the main focus was on the occurrence of this phenomenon. On the basis of a handwritten trace on paper, the font size was simply measured using a ruler [10,12]. However, this method allowed one to determine only static features and was very time-consuming. Only the appearance of electronic recording devices, such as graphic tablets or electronic pens, opened up new possibilities for a more advanced analysis of handwriting, taking into account the kinematics and dynamics of its creation [13,14]. Modern devices of this type record not only the trajectory of movement with the appropriate sampling frequency but also the value of the pressure at a given moment of time and the angle of inclination of the pen to the surface of the tablet. The possibility of using graphic tablets to collect handwriting image samples initiated a new era in handwriting research.
There have been many publications on the determination of an increasing number of handwriting features to indicate the occurrence of Parkinson’s disease. They began by determining the font size based not only on the basis of the heights previously determined [15,16,17,18,19,20,21] or the length of the subsequent strokes of the pen [22,23,24,25,26] but also on the length of the trajectory of these strokes [26,27,28]. In addition to the analysis of static features, the analysis of time features was also carried out. The overall writing time was often calculated [15,16,17,18,19,22,23,24,25,27,28,29,30,31,32], and there were several articles that distinguished the time the pen touched the surface of the tablet and the time the pen was above the tablet [5] and even the ratio of these two features [33,34]. Individual dynamic features such as speed [17,21,24,31], acceleration [16,18,19] and jerk [27], defined as a measure of the change in acceleration over time, were also taken into account. Some works included more than one of these features [25,26,28,30,32,33,34,35,36]. Pressure analysis was also performed in some studies [24,26,31]. There were also other interesting handwriting features based on entropy, signal energy and signal distribution into empirical modes [34]. However, medical studies indicate that micrography occurs only in a certain number of patients suffering from Parkinson’s disease [10,12], and the severity of the remaining symptoms depends on the stage of the disease, the type of feedback [17,22,23], the level of difficulty of the task to perform [18,19], the simultaneous performance of other activities [21,27] and the medications taken [28,29]. Therefore, the occurrence of only one or even several symptoms in handwriting at the same time did not allow for a reliable classification of patients. Only the determination of a very large number of handwriting features and the use of an appropriate discriminatory algorithm allowed us to find a subset of features suitable for correct discrimination between PD and healthy subjects at an accuracy level above 80% [32,33,34,35,36].

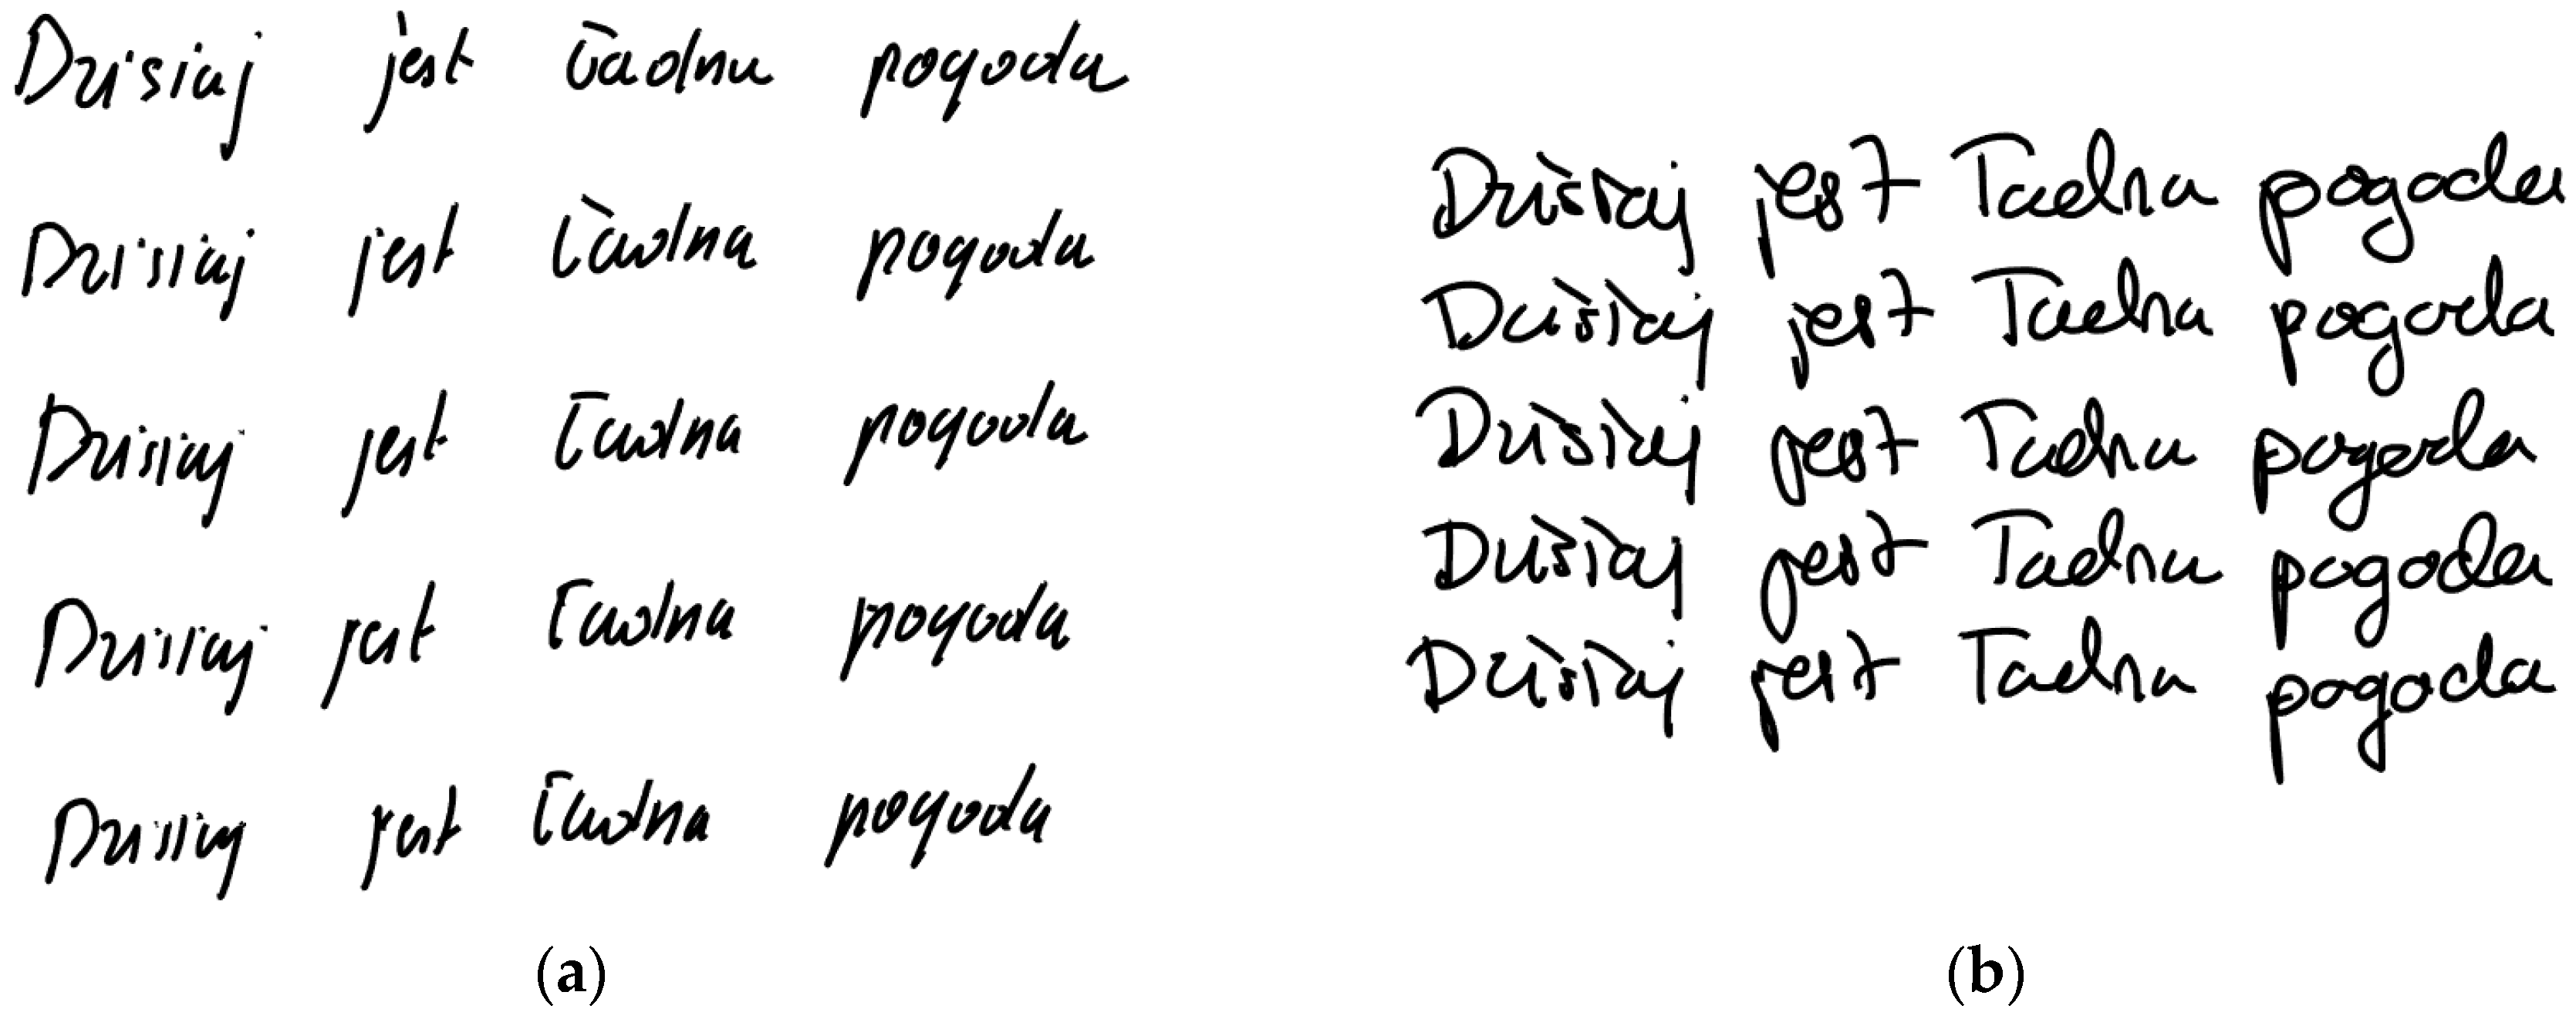
2.2. Handwriting Samples

Due to the ease of defining a single stroke while writing and a relatively simple processing algorithm at the same time, most studies on the analysis of the handwriting of people with Parkinson’s disease chose a sequence of single letters “l” or “e” connected to each other, forming loops just like “lllll” [17,18,19,22,23]. Some of them used single words that contained the letters “l”, “e” or “h”. A good example of such a word is “hello” [20]. Unfortunately, not every language contains words consisting of several of the above letters at the same time. Therefore, patients were often asked to write pseudo-words created for this study, such as “ellehell” [17], “eluhule” and “eludule” [15]. This approach may introduce some discomfort and further distract the examined person, which may affect the result of the handwriting analysis. A better and more natural solution is to ask patients to write a complete sentence in their native language. This practice has been adopted in some works [15,16,18,27,28], but in most of them, its possibilities were not fully exploited due to the fact that only some of the words or letters in the written sentences were taken for further analysis. Only in a few studies [32,33,34,35] were the output features calculated on the basis of the whole sentence, some only involving font size [20,21]. Research based on a whole sentence had the advantage that it allowed for an analysis of not only the final handwriting visible on a piece of paper but also the moments when the pen was raised above the surface of the tablet, between successive strokes [32,33,34,35]. An evaluation of these movements may indicate additional diagnostic characteristics of Parkinson’s disease [33]. The measurable effect of many of the works carried out was the development of databases of handwriting samples. So, the authors of the work [33,34,35], while conducting research on changes in the handwriting of people with Parkinson’s disease, created and published a database for external use containing handwriting samples of 37 healthy controls and 38 patients with PD [27]. This database, called PaHaW, contains handwriting samples acquired during eight tasks, including drawing a spiral, writing individual letters, syllables, words and an entire sentence in the Czech language [37]. Many later authors used this ready-made database to recognize PD patients by testing various classification algorithms [36,38] or neural networks [38,39].

2.3. Condition of Patients

The authors of the abovementioned works analyzed handwriting samples collected under the conditions of clinical trials and with the help of medical personnel. Each time, a group of healthy people was examined as a control group (healthy control—HC) and a group of people with Parkinson’s disease (PD group). Some authors distinguished subgroups according to the age of the patients [16,22,23,27] or disease stage [32]. In studies aimed at checking the possibility of the early diagnosis of Parkinson’s disease based on handwriting [31,32,33,34,35], the examined patients underwent pharmacological treatment to minimize easily visible symptoms. They were in the so-called ‘on’ phase when the symptoms were well controlled (usually at the peak of L-dopa/dopamine activity). The literature also presents the results of studies performed on patients in the “off” phase, that is, in the phase when PD symptoms are poorly controlled, usually due to the end of dopamine activity. In most cases, they involved attempts to determine the handwriting characteristics of people with visible symptoms of Parkinson’s disease [25,26,30]. Some studies tried to influence the intensity of symptoms during data acquisition by using auxiliary markers indicating the target font size [17,23] or by using voice commands that reminded the user of the need to control it [17]. Research in the “off” phase was also used to assess additional factors that stimulated the writing process, including simultaneous counting [22] or the blindfolding of the subject.

2.4. Algorithms

Initially, studies on handwriting in people with Parkinson’s disease, consisting of an attempt to parameterize handwriting samples, were based on statistical analysis. Most often, on the basis of the data obtained, an analysis of variance (ANOVA) was carried out, with the aim of showing differences between the means of multivariate vectors describing the handwriting samples of patients from the PD group and healthy people [17,22,24,25,29]. In later studies, where the number of features determined was very large, feature selection algorithms began to be used in the search of the most significant ones for classification [32,33,34,36,38]. Then, classification was carried out using various methods based on machine learning, such as the following: SVM [32,33,34,35,38], K-NN [35,36], AdaBoost with a decision tree estimator [35,36], a Naive Bayes classifier [36] or random forest [36]. The most recent works demonstrated the use of convolutional neural networks (CNNs) for the analysis of handwriting samples [38,39,40,41]. In the latter case, due to the small number of inputs, transfer learning methods were usually used, consisting of the use of pre-trained networks and applying them to solve a new problem. One of the most commonly used methods in classifying patients based on handwriting samples was AlexNet [38,39], pre-trained using ImageNet and the MNIST database repository [39].

3. Proposed Approach

In this study, handwriting samples containing whole sentences taken from people with Parkinson’s disease in the “on” phase and healthy people were analyzed. Patients were asked to write five complete sentences with logical content, one below the other. Due to this procedure, it was possible to determine the features that characterize entire sentences, not just individual strokes of the pen. During the analysis of handwriting samples, instead of calculating the values determined by other authors of works on similar topics, the focus was on determining such features that result from domain knowledge about the symptoms of Parkinson’s disease. An example is a change in capitalization, which may indicate the occurrence of micrography. The initial characteristics that were used to perform the classification process are statistical measures collected from five sentences. This is an alternative approach to the one used so far, because it does not focus directly on the features of the handwriting but aims to indicate the existence of differences between them in subsequent sentences. This is important because the characteristic symptoms of Parkinson’s disease can be visible in handwriting only after a long time of writing and repeating the same sequence of characters several times. The proposed approach is detailed in Section 4.2.

4. Material and Methods

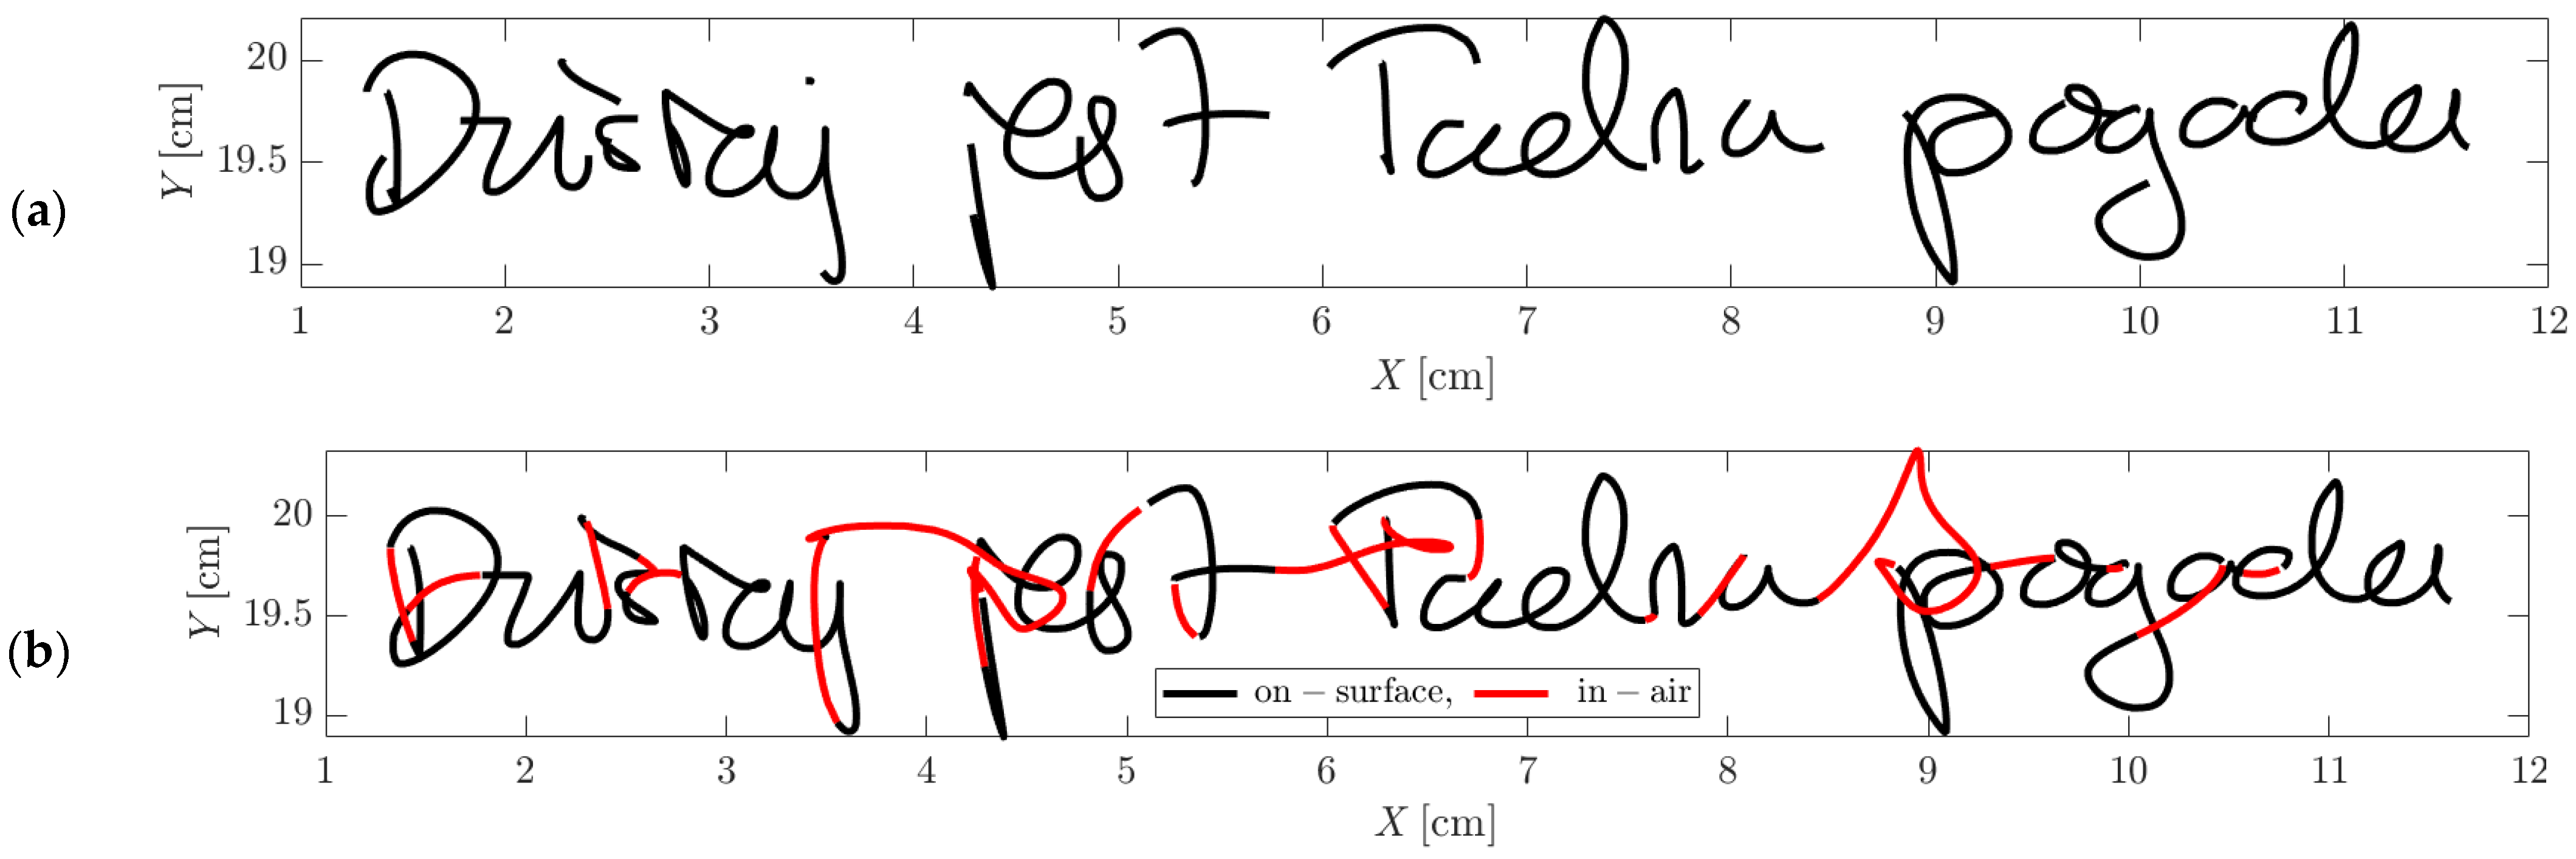
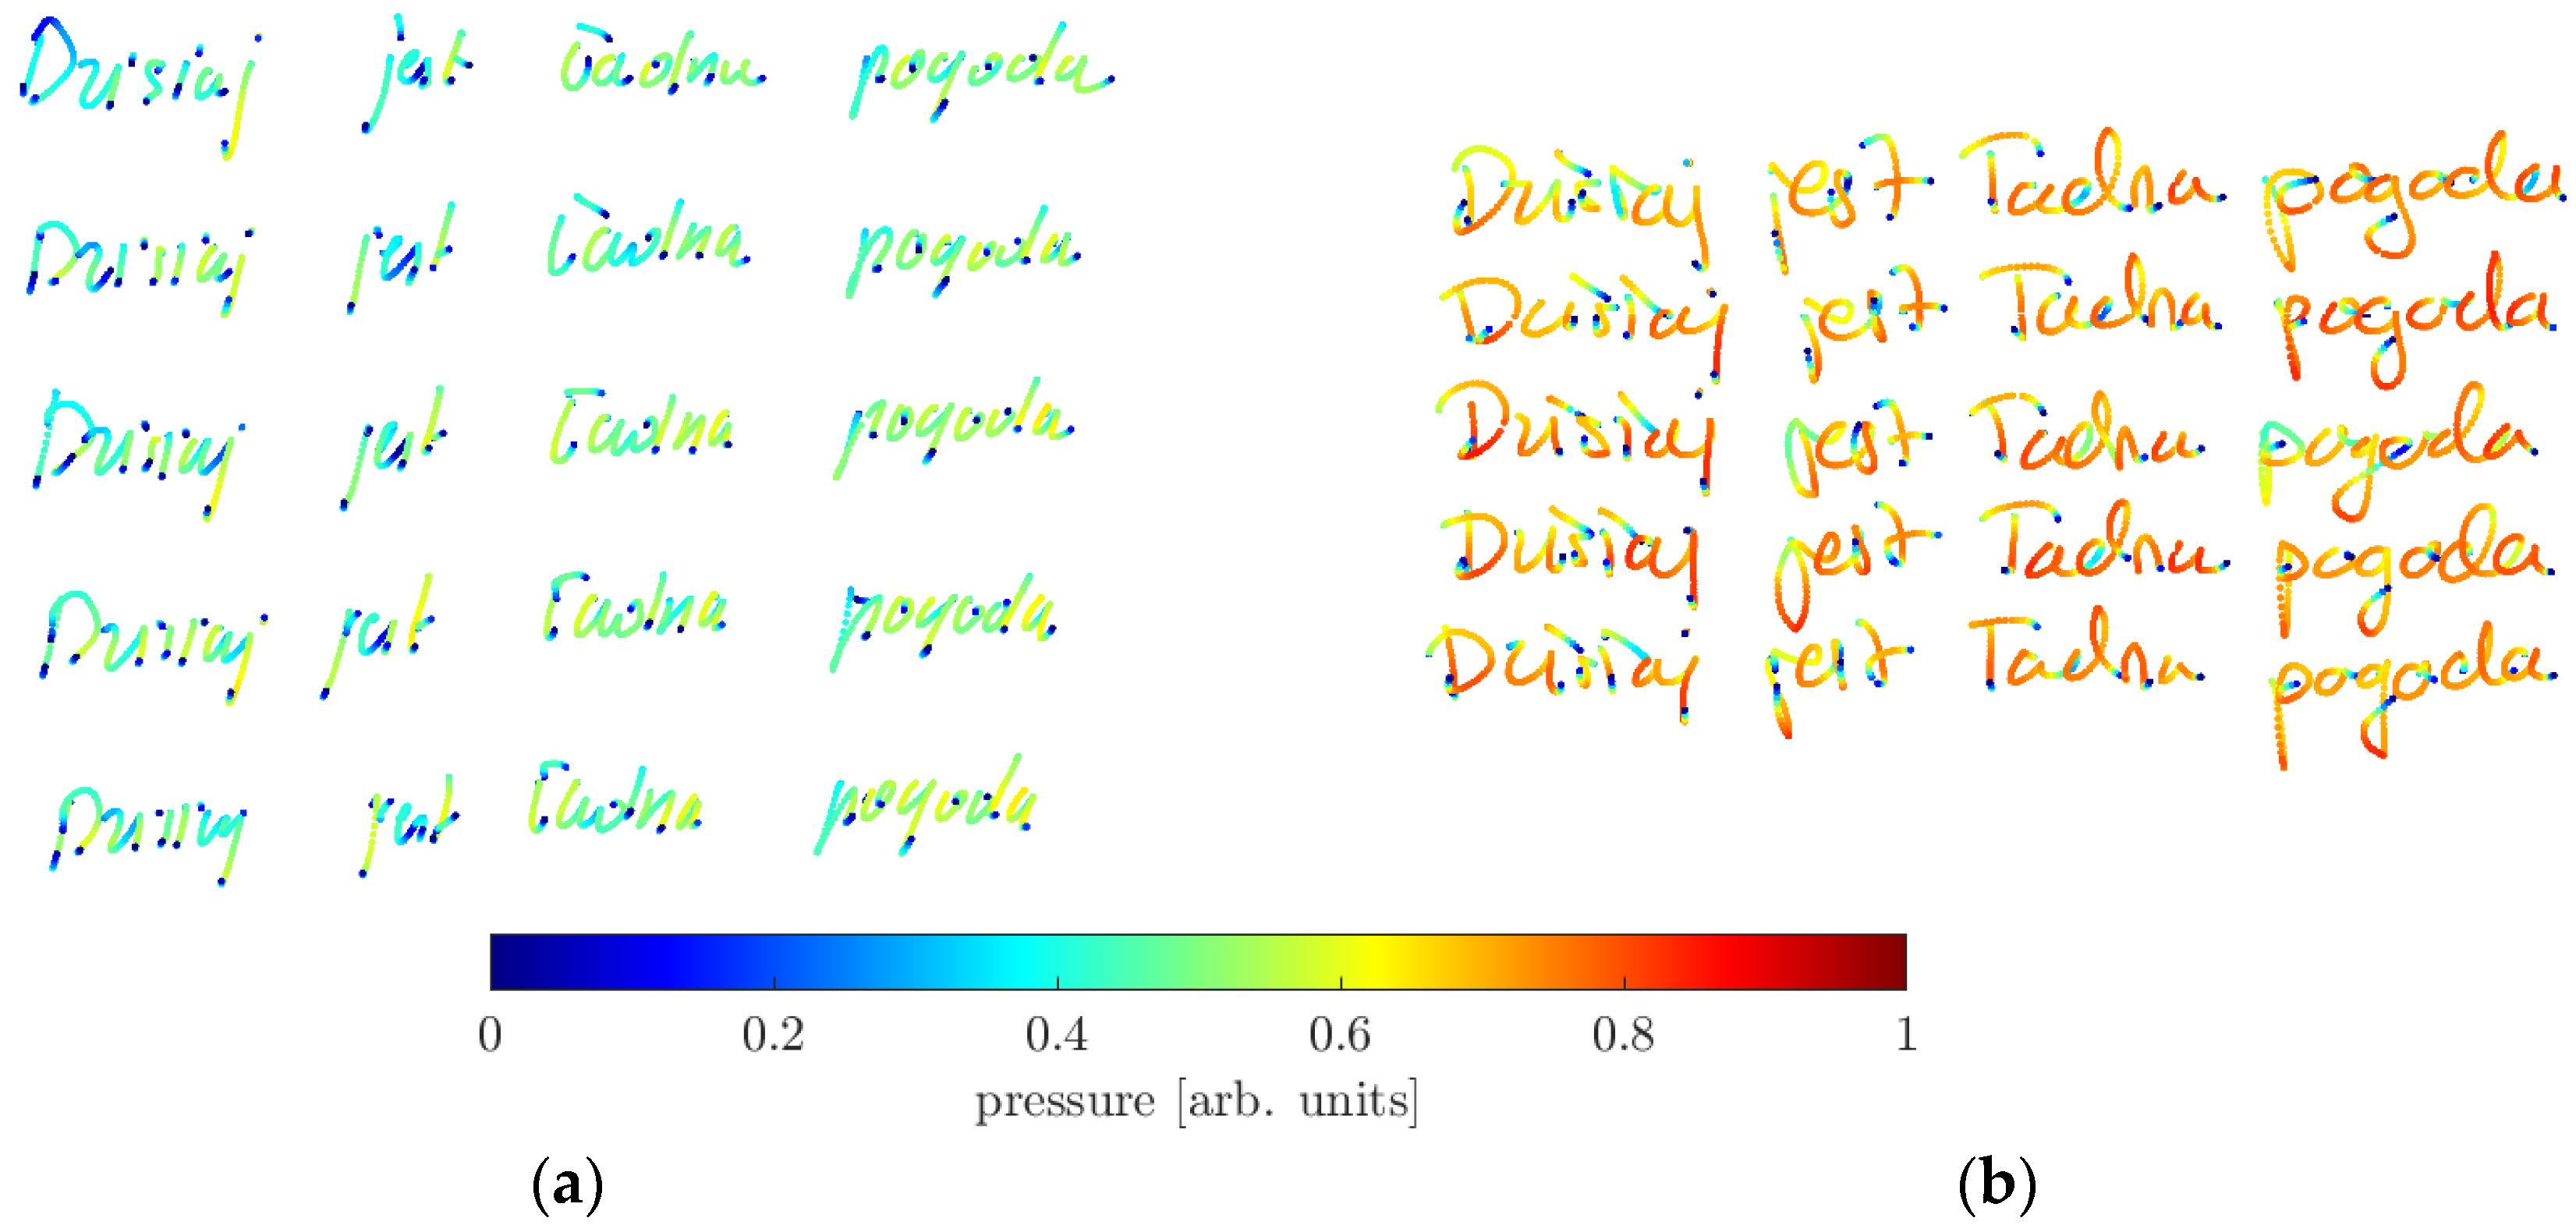
4.1. Acquisition of Handwriting Sample Images

Data for analysis were obtained as part of clinical trials conducted by a medical team in the Department of Neurology in Warsaw, Poland, after obtaining the consent of the Bioethics Committee. A total of 48 people participated in the studies. Among the subjects, there were 24 people belonging to the HC group (5 women and 19 men) and 24 with Parkinson’s disease—PD group (16 women and 8 men). In the PD group, there were people at various stages of the disease, suffering for a few to several years with symptoms occurring unilaterally (11 people) or bilaterally (13 people). All PD patients were included in the research group based on their positive response to dopaminergic treatment. Importantly, patients were pharmacologically prepared for testing in such a way that their condition corresponded to the lower range of the UPDRS used in diagnosis. In the lower range, the severity of symptoms is low, which is why standard diagnostic methods are characterized by low sensitivity. All subjects were right-handed. The basic characteristics of both groups are presented in Table 1.
During this study, patients were asked to write the sentence ‘Dzisiaj jest ładna pogoda’, which means ‘The weather is nice today’. To be able to notice changes resulting from the presence of the disease during spontaneous writing (without thinking), all sentences were written without interruption one after the other within the same acquisition. Examples of the recorded handwriting samples are shown in Figure 1.
The Intuos Pro Paper Edition PTH-860 graphics tablet manufactured by the Japanese company WACOM headquartered in Kazo, Saitama, Japan, was used to acquire the data pool. The tablet, together with proprietary software, is one of the elements of the workstation for recording multimodal data for the objective evaluation of Parkinson’s disease [42]. The tablet allows you to create a digital image on its surface using a touch pen. The tablet has the dimensions of 430.4 × 287 × 8 mm, including an active area of 311 × 216 mm and weighs 1300 g. With the help of a special clip, it is possible to attach a sheet of paper in A4 format to its surface. The pen used for writing is a WACOM Pro Pen 2 (also produced by the same Japanese company WACOM) with a length of 157 mm and a diameter of 15 mm. Its dimensions and weight (15 g) make it look like a classic pen, which makes it very convenient to use when operating the tablet. The tablet captures data such as pen pressure on the surface and its tilt from the vertical, taking into account the coordinates of locations and sampling moments taking place at a frequency of 200 Hz.

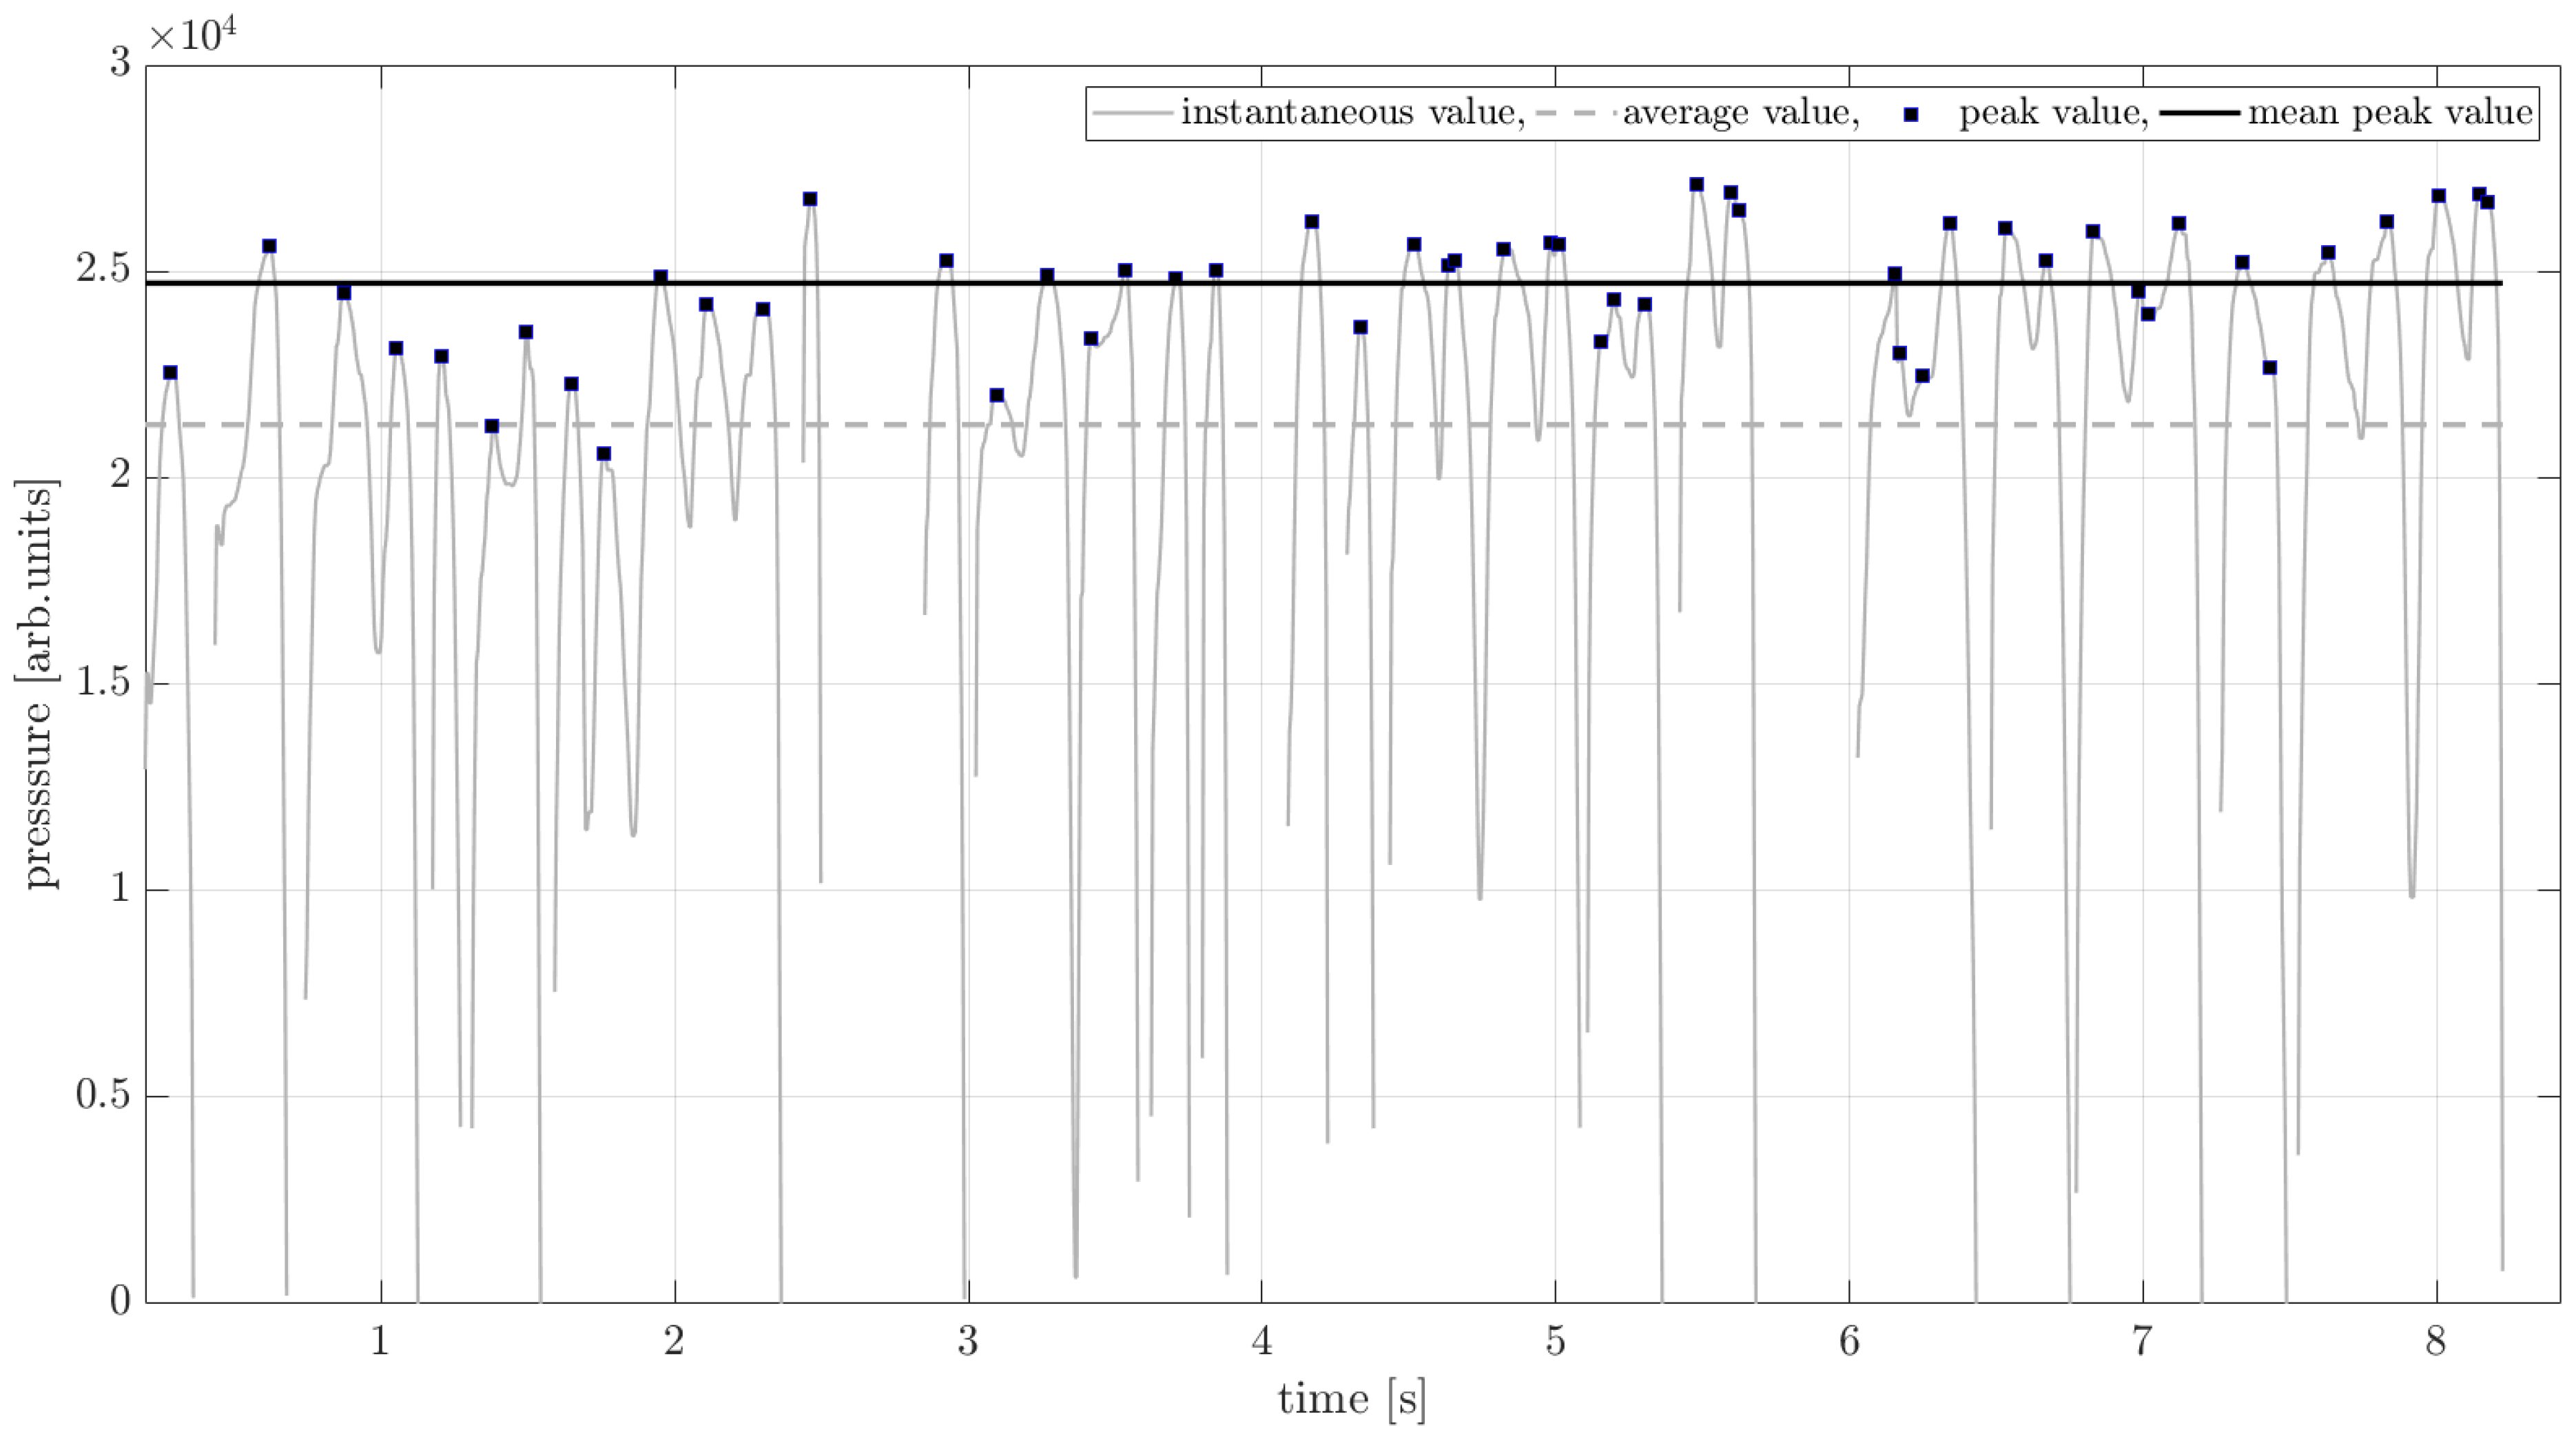
4.2. Handwriting Features

Based on the collected handwriting image samples, a number of features were determined for each sentence that may indicate the occurrence of Parkinson’s disease. We presented a preliminary proposal on the methodology for determining such features in [43]. The focus was on features that may highlight the existence of specific symptoms of the disease. In this paper, we extended the methodology presented in [43], and the features determined can actually be divided into 4 groups: features related to time, related to velocity, related to pressure and related to the geometry of handwriting. Table 2 summarizes all the calculated characteristics along with the possible symptoms of Parkinson’s disease that can be indicated by the values of these features.
The prolonged writing time may not only be an indicator of the occurrence of movement slowness. It may also be a result of the need to think more about the next letter, word or spatial arrangement of them [25,30]. This need may indicate cognitive deterioration. When determining time features, not only was the movement performed during writing and leaving a trace on paper taken into account but also the movement in the air made between the recording of individual letters. Thus, it was assumed that the total time to write an entire sentence can be influenced by two components. The first is the time of drawing marks, determined by the moments when the pen touches the surface of the tablet, leaving a trace on the paper, visible in Figure 2a. This figure contains an image of the first sentence presented in Figure 1b and was drawn by a healthy person. Time may become a feature that indicates the occurrence of movement slowness. The second component is the duration of the pauses between words, which is related to the time it takes to plan the next move. Figure 2b shows the notation of the same sentence taking into account the movement made in air.
The average values of the time features mentioned above, calculated for 5 sentences along with standard deviations, are shown for both classes in Table 3. In general, the average values of the time features listed in Table 3 for PD patients are longer than those of HC subjects, but the degree of overlap between the value intervals is so significant that it does not allow for discrimination between the two classes based solely on time features. The objective determination of the differences between the images created by PD patients and healthy controls requires the use of additional characteristic features that can be deduced from the clinical picture of the disease.
And so, symptoms such as resting tremor or stiffness of the limb can translate into the force that the affected person applies to the pen when writing [25]. Figure 3 shows acquisitions taking into account the pressure force exerted when writing is conducted by an ill person or a healthy person.
Both the intensity of pressure changes and the average value of pressure during the entire process of writing are important. In addition, in order to compensate for the influence of the handwriting samples that were recorded during the detachment of the pen from the paper, the average of only the local maxima of the pressure was determined. The physical interpretation of the pressure features is shown in Figure 4.
Parkinson’s disease often causes problems with the coordination of movements, which can translate into changes in the appearance of handwriting, which can be quantitatively assessed using features related to the geometry of handwriting. These changes may manifest themselves as a progressive or stable decrease in the amplitude of the strokes of writing, indicating the aforementioned micrography. Micrography can be quantitatively described by determining features such as sentence length or the sum of fields of boxes containing single strokes and comparing their values for individual sentences. Figure 5a,b show the interpretation of these two features, respectively, in the example of the same sentence, the image of which is shown in Figure 2.
A common phenomenon is also a disorder of kinesthesia, that is, the sense of the orientation, position and movement of body parts. This disorder can affect the appearance of handwriting, which requires coordinated movements of the forearm, wrist and fingers [24]. The appearance of handwriting may also be affected by hypometria that occurs in people with Parkinson’s disease, i.e., the inability to correctly assess distance by underestimating it [30].

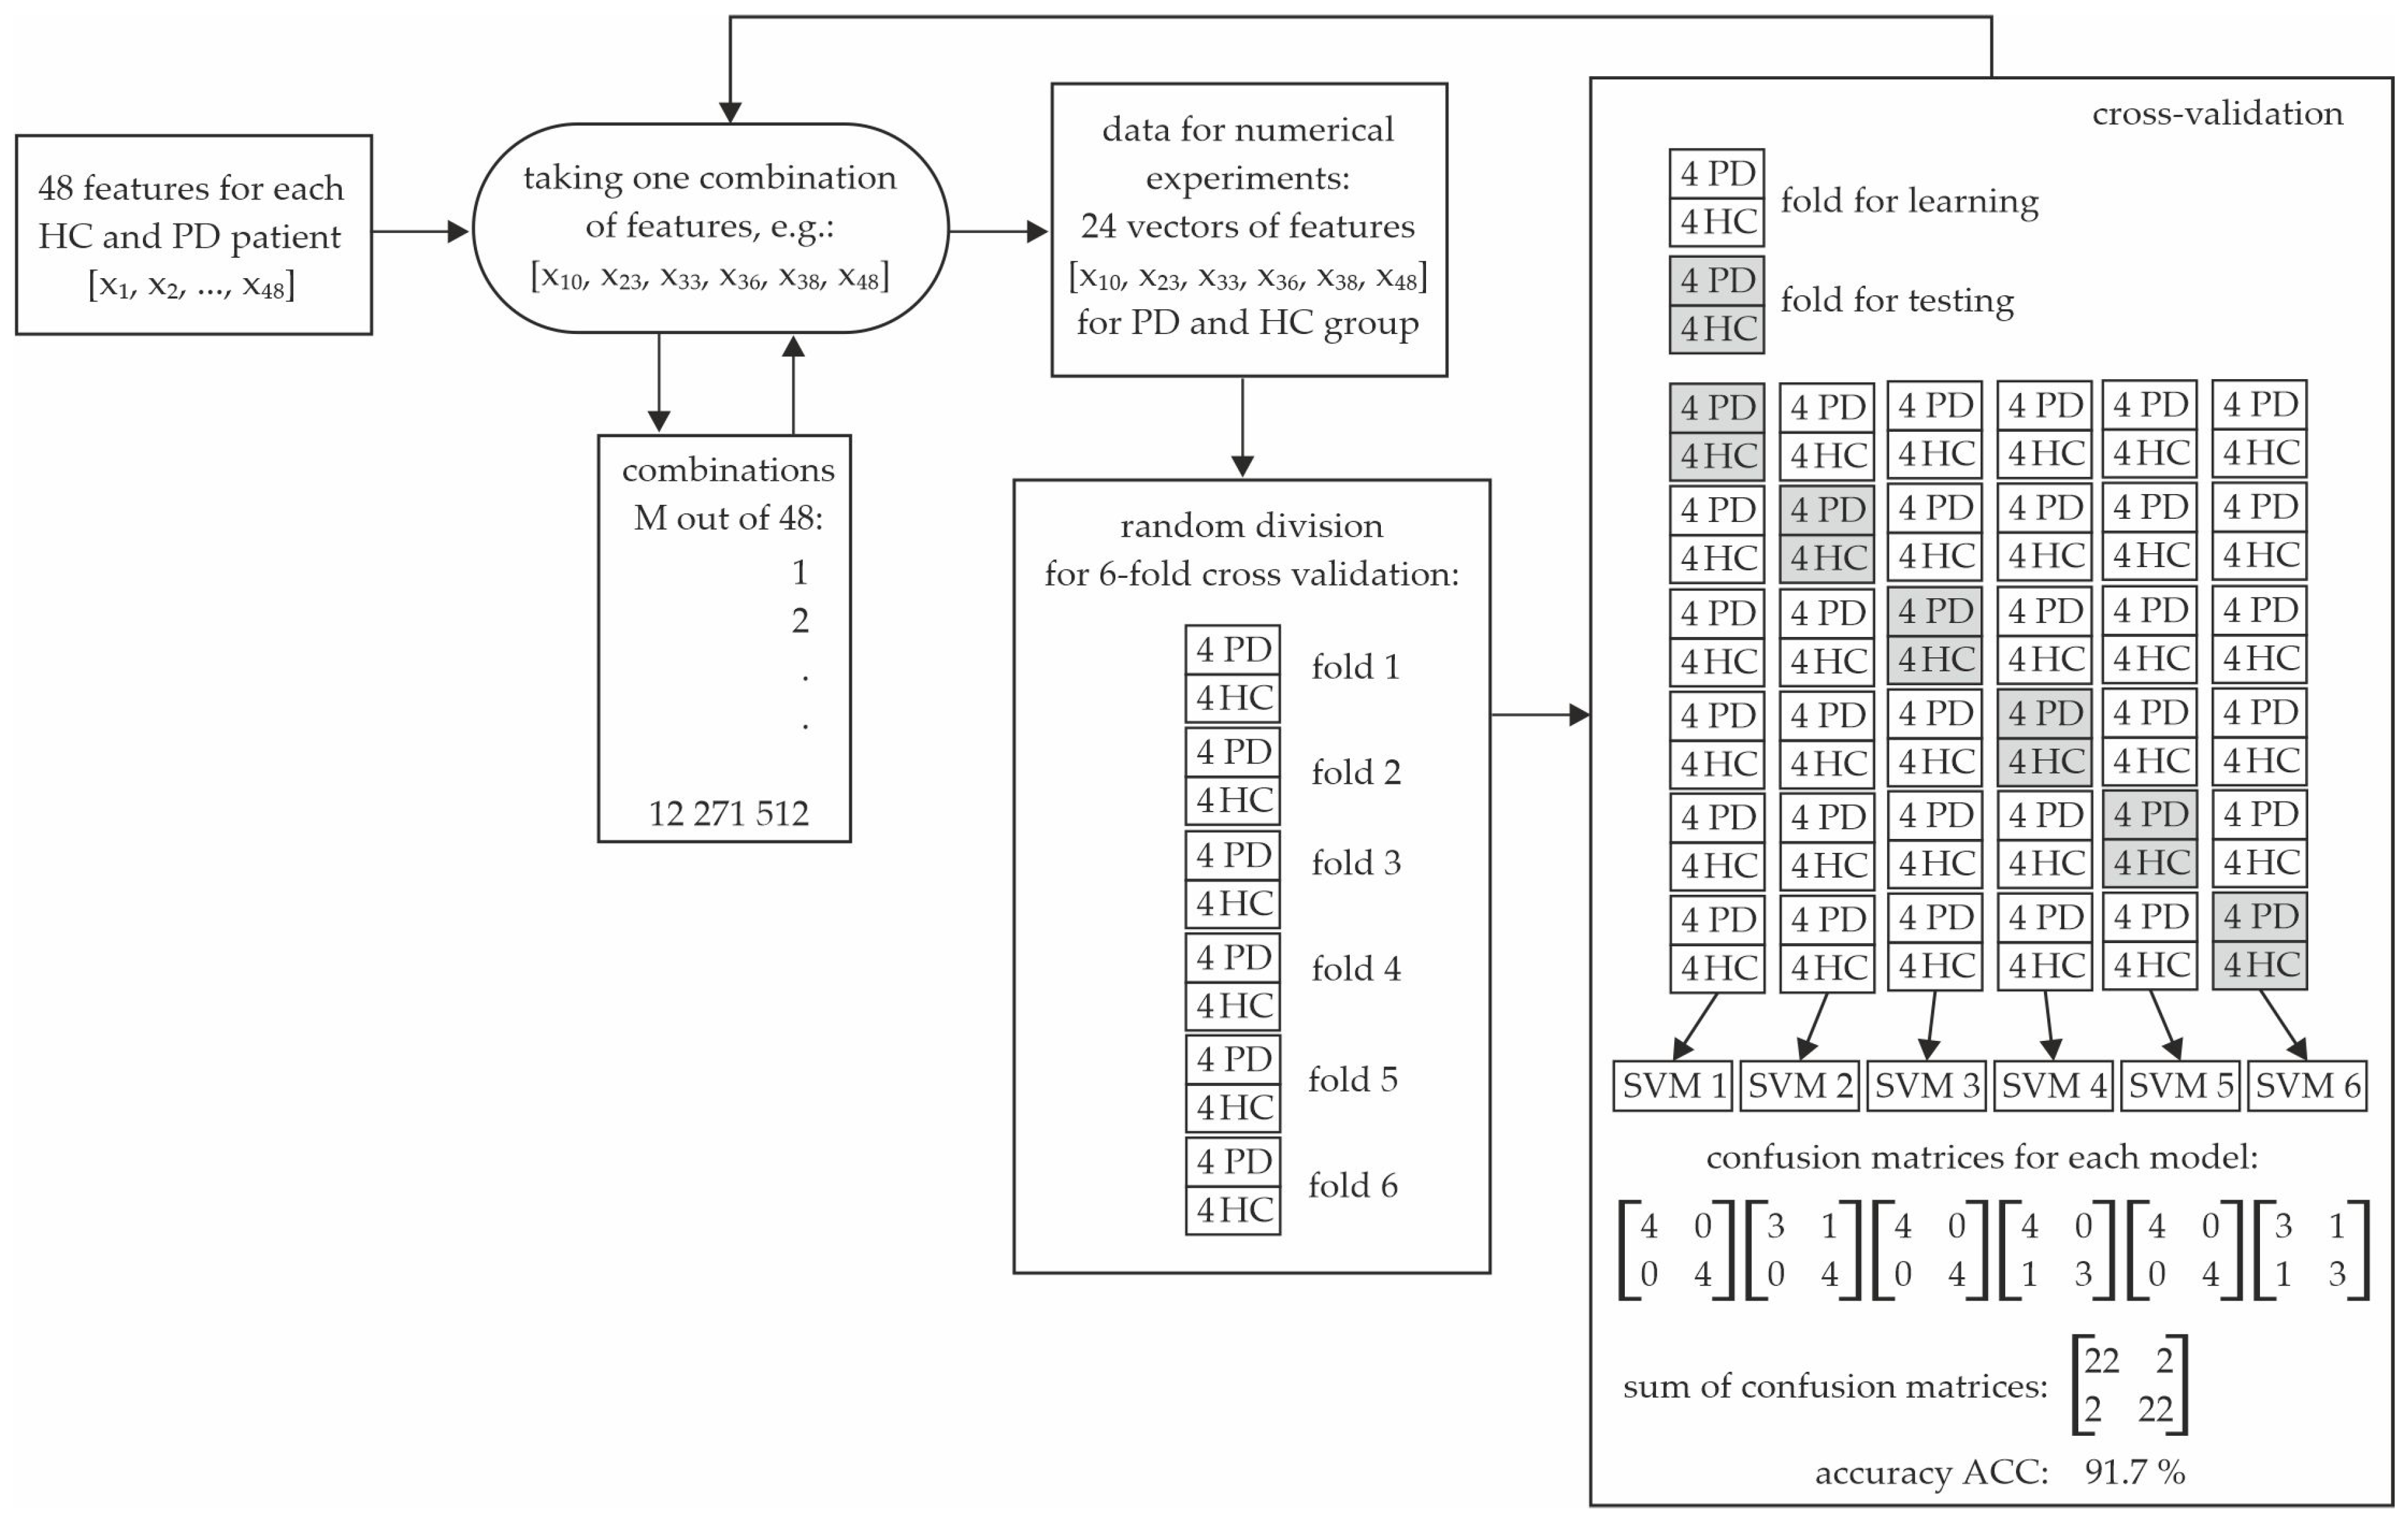
5. Generation of Diagnostic Features

A total of 12 features were calculated using a single sentence, as depicted in Table 2. They were the primary diagnostic features. Due to the fact that the characteristic symptoms of Parkinson’s disease may not be visible during the first or second single sentence and may only manifest themselves after a long time writing, the focus was on determining secondary diagnostic features obtained as a result of additional preprocessing, including measures calculated on the basis of these 12 designated features. Due to this, it was possible to find differences that occur from sentence to sentence. There were four measures used: mean value, standard deviation, coefficient of variation (standard deviation related to the mean value) and trend (directional coefficient of the approximating linear function of values of a given feature, calculated using the method of least squares). In this way, based on the 12 primary features, 48 secondary features were created that may contain diagnostic information. Due to the fact that the obtained data represent different quantities, significantly different in scale, a normalization process was carried out to unify the numerical ranges of the resulting features. The min-max data normalization process was used, which transforms each value by subtracting its minimum and dividing by its range. The result was a new feature with a minimum of zero and a maximum of one. The pool of obtained features is very rich, and with a relatively small number of samples, it can lead to overfitting and problems with obtaining good generalization. In other words, the question arises as to which features form the optimal vector from the point of view of the highest recognition accuracy. There are many techniques for feature selection that are designed to discover the synergy occurring in them. In this work, we used the exhaustive search method. This is the simplest method, which consists of searching through all possible combinations of features and choosing the one that, with a selected classifier, will create a model characterized by the highest accuracy. The method guarantees optimality, but its computational complexity increases dramatically with the length of the vector of features taken from the original pool. For example, in the case of length 6, the number of all possible combinations out of 48 is over 1.2 × 10⁷. However, this method, especially in combination with some of its optimizations, is presented in the literature and is used in biomedical and engineering research [44,45]. In this work, this method was only a tool to present the disease diagnostic process on the basis of a sequence of sentences, and none of its optimizations were studied.

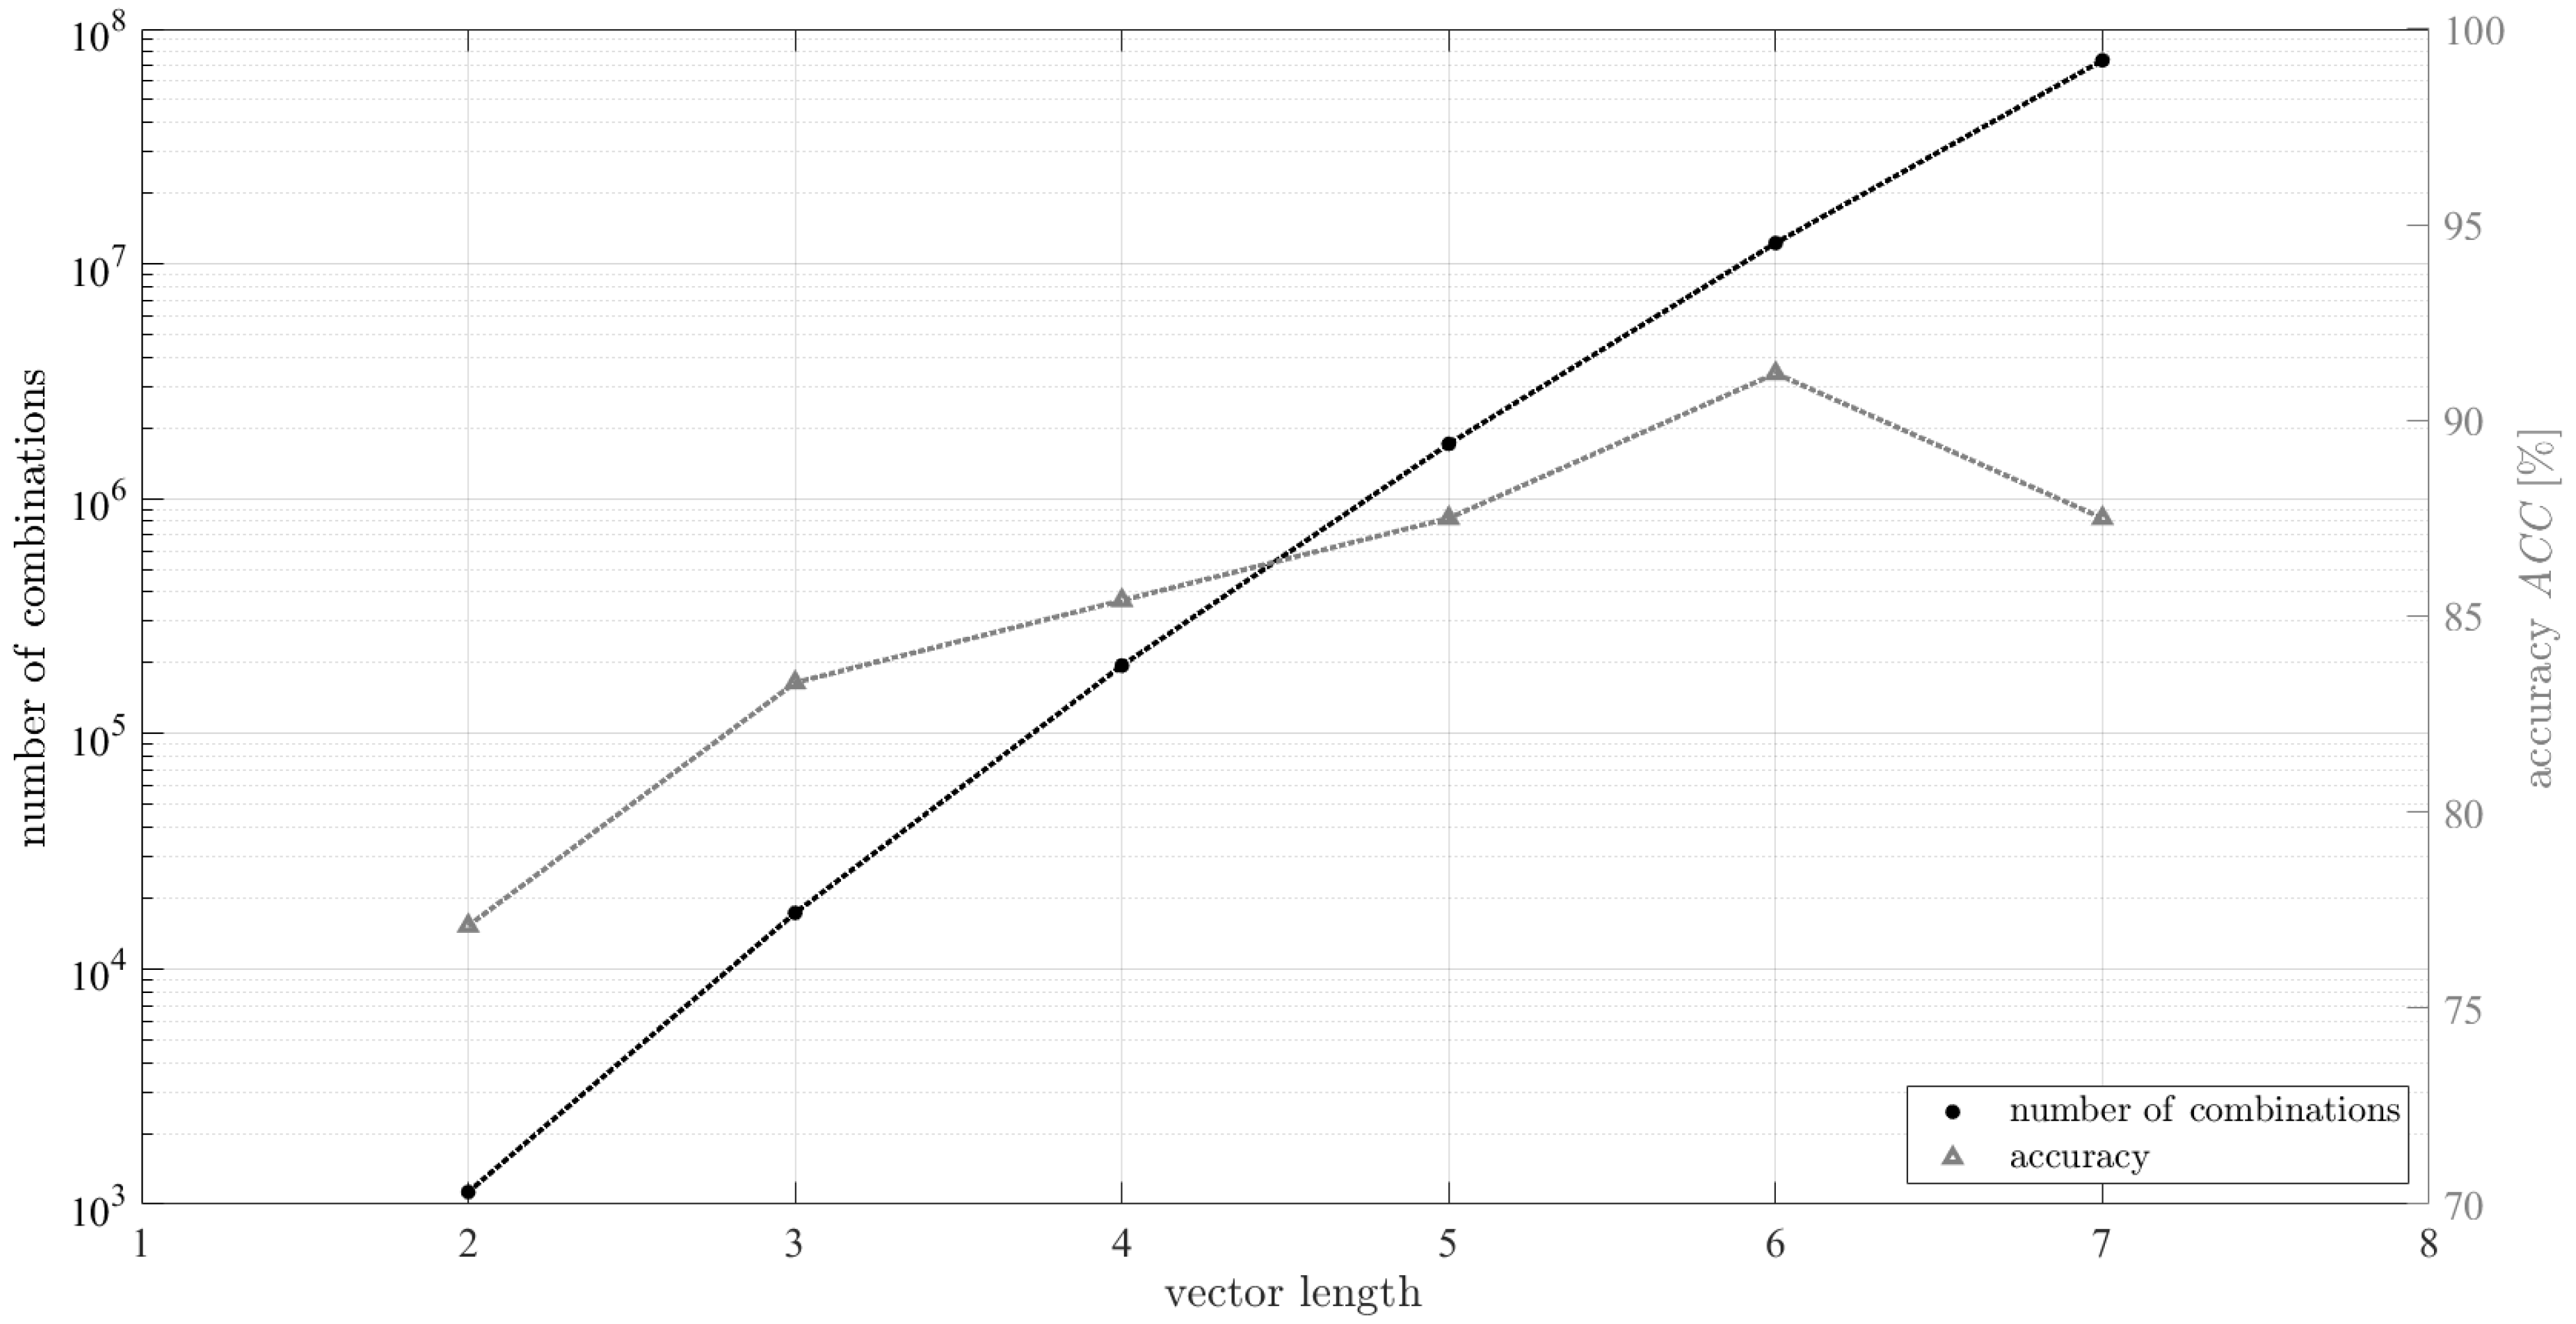
6. A Quantitative Assessment of the Recognition Process
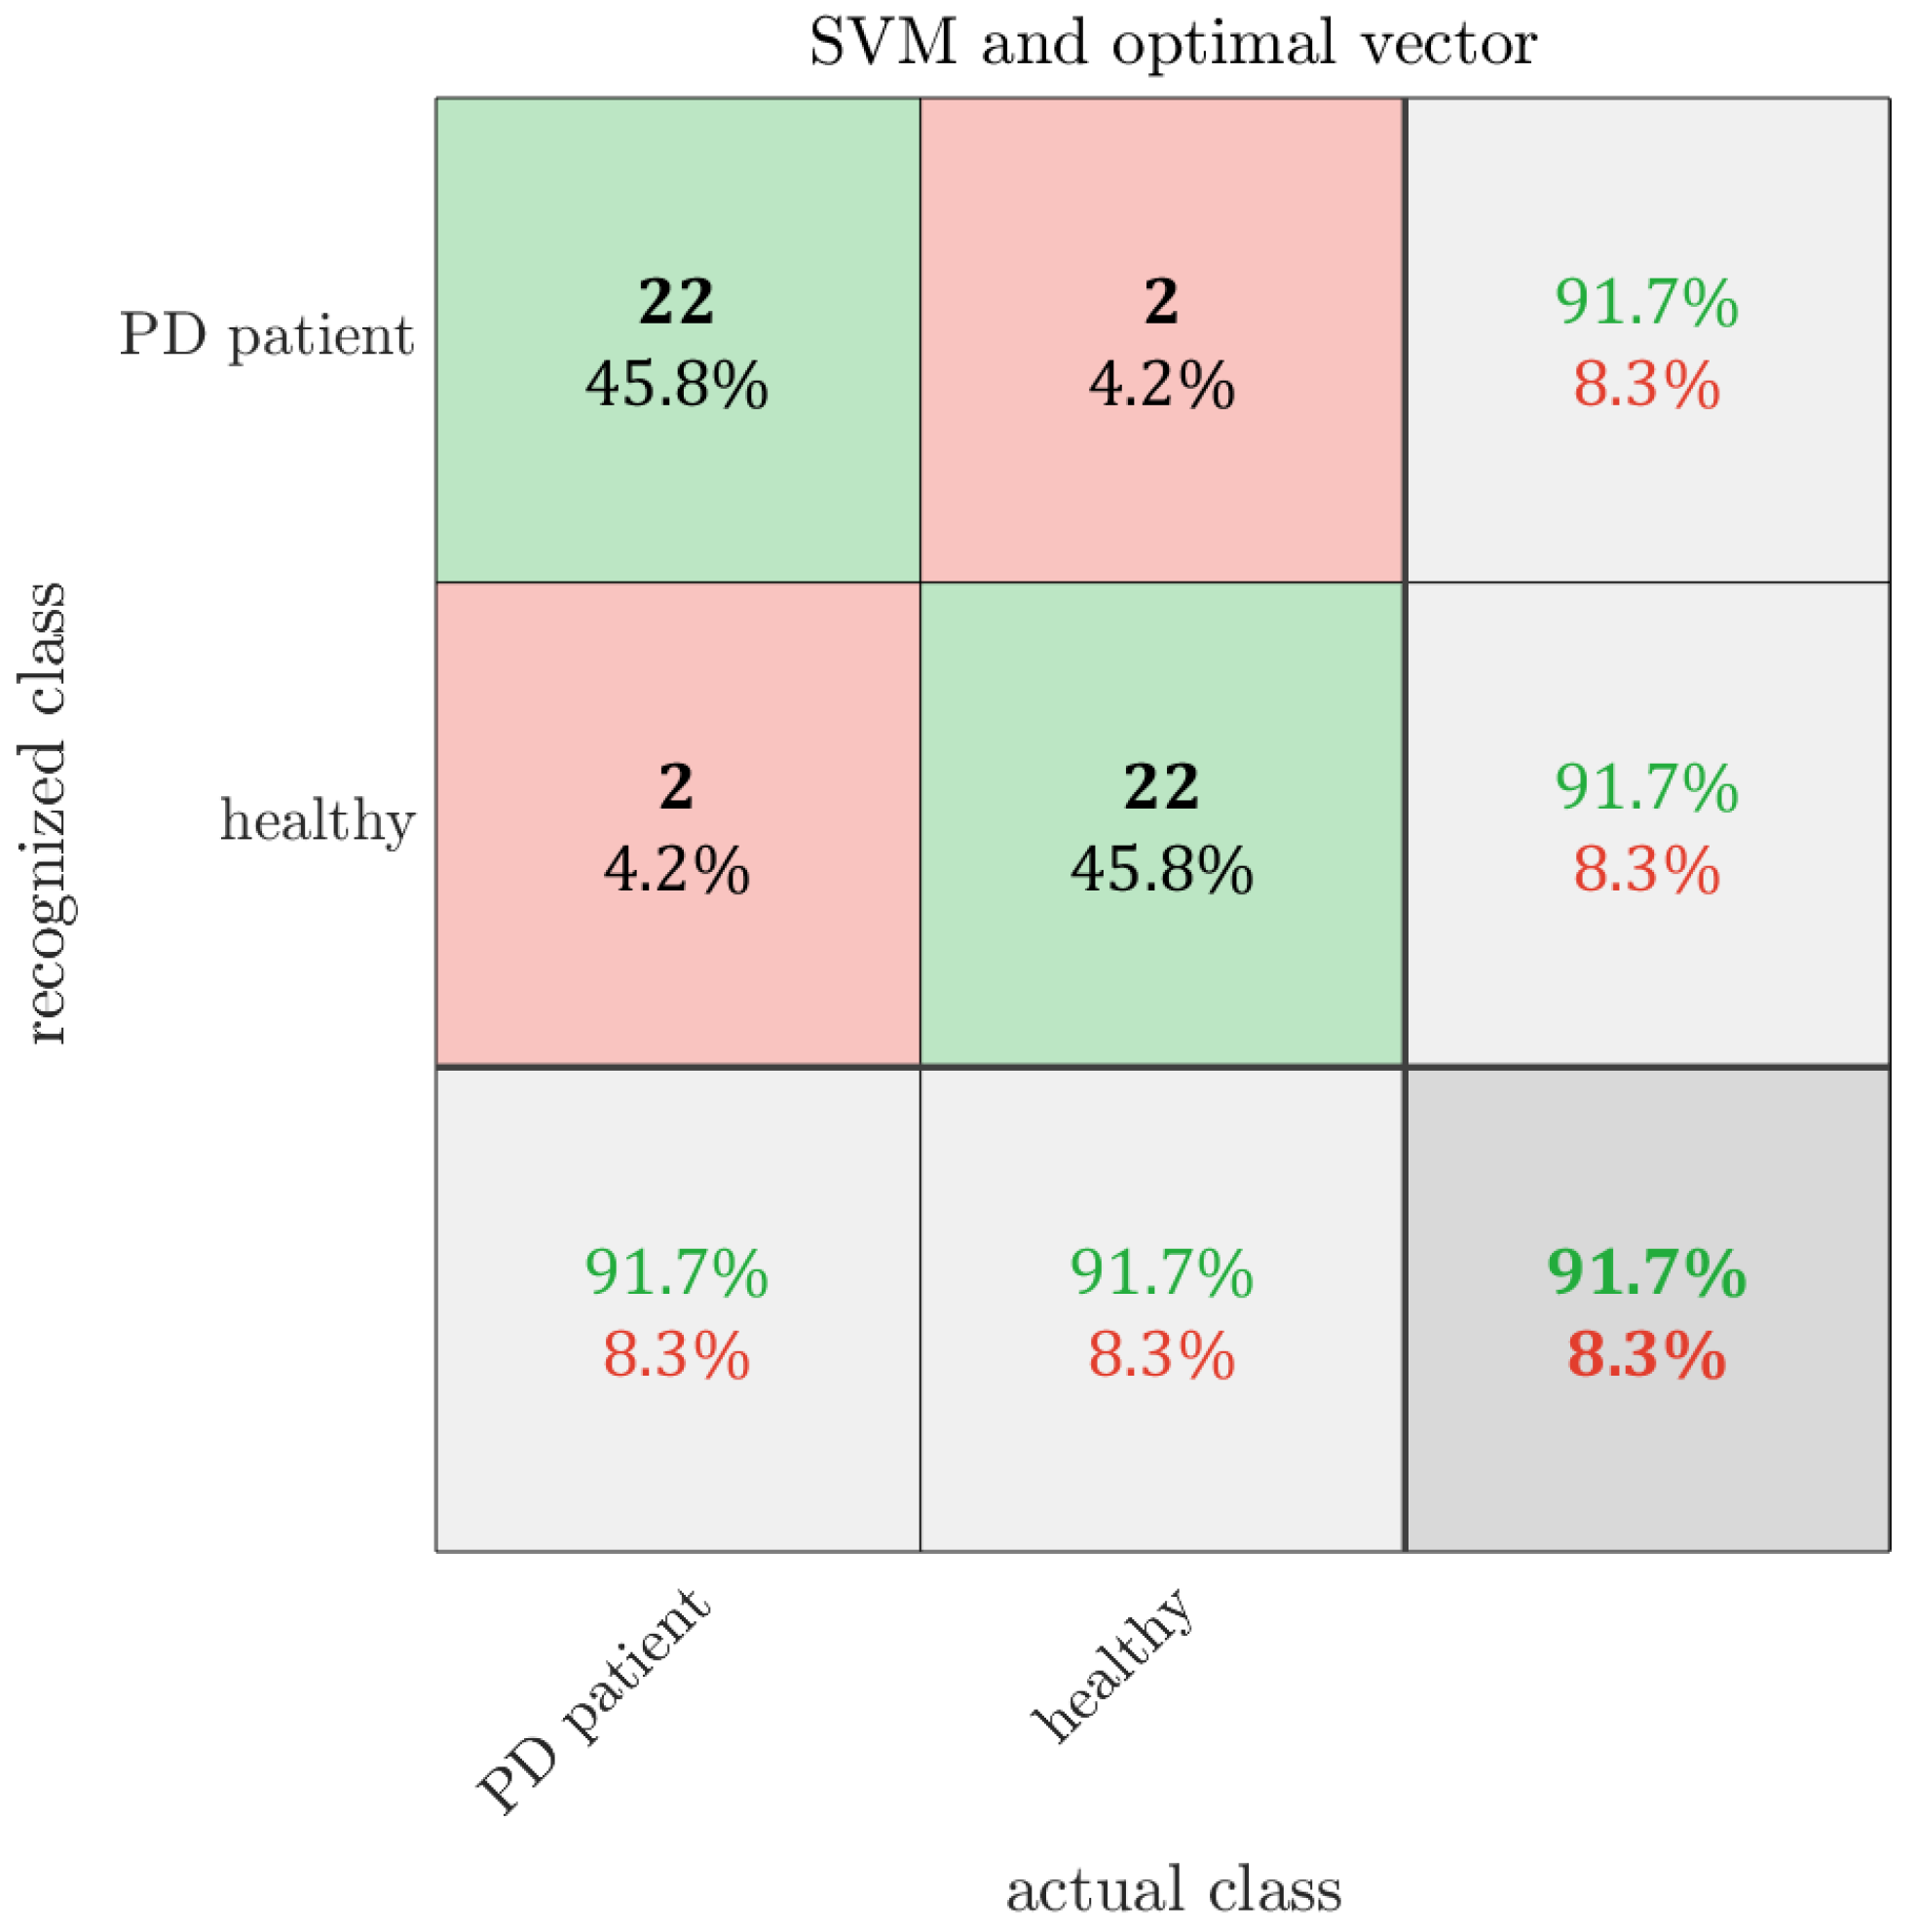
The classification process was carried out using the SVM (Support Vector Machine) algorithm with Gaussian kernel function. We decided to use only one method and this method of machine learning for two reasons. First, as pointed out above, the exhaustive search method is very time-consuming. The implementation time of the method for the case of vector length 6 and one ML algorithm is more than 2 weeks of continuous computer operation. With a length of 7, it is more than 2 months. Second, this method and this type of kernel were most often used in comparable works by other authors who dealt with the diagnosis of the disease based on the features of handwriting samples [32,33,34,35,38]. This makes it possible to compare only the presented processing method, i.e., the method based on a an image composed of sequence of sentences, with these studies. Due to the use of the SVM algorithm in the exhaustive search process, its parameters were not tuned. The fitcsvm function available in the Matlab environment with the Gaussian kernel was used without a built-in cross-validation option (software release R2018a). Other parameters were set as default.
To reliably assess the process of classifying patients with PD and healthy people, a commonly used cross-validation method was used, which allows the classification process to be conducted without the risk of obtaining overly optimistic and unreliable assessments. This method involves randomly dividing the entire dataset into N subsets of equal size and then using a single set as validation data and the remaining subsets as training data. The process is repeated N times so that within each repetition, the validation and training sets are separate. The classification results obtained using the validation subsets are then averaged. In this paper, six-fold cross-validation was used, which means that a single subset of cross-validation contained a total of eight vectors corresponding to four individuals from each class. Commonly used metrics were used to evaluate the classification process: accuracy, sensitivity and specificity. Accuracy ACC, sensitivity Se and specificity Sp are defined as follows:
A C C = T P + T N T P + T N + F P + F N · 100 % .
S e = T P T P + F N · 100 % .
S p = T N T N + F P · 100 % .
where TP (true positive) and FP (False Positive) represent the number of correctly classified people with Parkinson’s disease and the number of actually healthy people diagnosed with the disease, respectively. Similarly, TN (true negative) and FN (false negative) represent, respectively, the total number of correctly classified healthy people and Parkinson’s patients misclassified as healthy. The above quantitative recognition assessment was carried out using vectors with increasing length in such a way that for the determined length M, vectors composed of all possible combinations of features taken from the list of 48 secondary features were evaluated with respect to the overall accuracy described in (1). Figure 6 presents a comprehensive scheme of the data processing adopted to perform the quantitative assessment of recognition.
Based on a single vector taken from all possible combinations for a fixed M, input data were created for the cross-validation process. These are 24 M-element vectors for each of the PD and HC groups, that is, a total of 48 vectors. In one repetition of the 6-fold cross-validation, 40 vectors were involved in the SVM training process and 8 were used for testing. Based on the results of the testing, a confusion matrix was determined for each repetition. After all repetitions were completed, the accuracy of the classification was determined based on the sum of these six confusion matrices. Then, the process was repeated, i.e., for the next vector from the combination, the same operations were carried out to determine the corresponding accuracy. After calculating all combinations of features corresponding to the determined M, it was possible to indicate a combination that is characterized by the highest accuracy. It should be emphasized that in each repetition of cross-validation, each fold of the testing data was normalized with the minimum and maximum values that were specified in the fold of the training data.

7. Results

The tests were carried out for M in the range of 2 to 7, because for the latter, the accuracy deteriorated, probably due to overfitting. The number of combinations for increasing the length M of the feature vector is depicted in Figure 7 together with the accuracy corresponding to the best vector of that length. As can be seen, the optimal length of the feature vector turned out to be 6.
The numerical data presented in Figure 6 correspond to the vector composed of six features x 10 , x 23 , x 33 , x 36 , x 38 , x 48 that provided the best recognition accuracy. We obtained confusion matrices in each repetition of the cross-validation together with the final confusion matrix corresponding to the best accuracy, which was over 90%. The set of these particular features is composed of the following: x 10 —standard deviation of the on-surface time in the sequence; x 23 —trend in the average pressure from sentence to sentence; x 33 —standard deviation of pen stroke numbers in the sequence; x 36 —averaged tilt angle of the pen in the sequence; x 38 —coefficient of variation of the tilt angle of the pen in the sequence; and x 48 —trend in the letter length from sentence to sentence.
However, it should be ensured that the observed positive response of the vector of the six selected features to the patient’s health condition is not due to his or her age. Older people can have trouble writing whether they are healthy or not. Interesting results on handwriting changes are presented in [46]. The authors reported that handwriting generally progressively declines with human aging. However, at the same time, they observed a deterioration in writing skills in a group of younger adults aged 18 to 32 years. One of the authors’ ideas was to assign younger adults to the so-called ‘millennial generation’, which grew up in the Internet era. Instead of traditional writing, these people prefer to type. To find out the possible effect of age on the results, we performed a two-way MANOVA test, in which the dependent variable was multivariate data that included six optimal characteristics selected on the basis of the exhaustive search, and the independent variables were the patient’s health status in the context of Parkinson’s disease and age, factors State and Age in Table 4 presenting the results of the two-way MANOVA test. For age, we used three levels of categorizing variables assigned to the subgroups proposed in [46]—younger adults (18 to 35 years), middle-aged adults (36 to 55 years) and older adults (56 years and older). The studies were carried out using different test statistics, but their results are similar.
The final conclusions in the MANOVA test are made on the basis of the last column of this table containing p-values. The small p-value of 0.05 for the State term in the table indicates that enough evidence exists to conclude that mean vectors of 6-dimensional data are statistically different across the factor values of State. However, the large p-value of 0.85 for the Age term indicates that there is not enough evidence to reject the hypothesis that the mean vectors of 6-dimensional data are not statistically different across the values for Age. In other words, the patient’s health condition affects the values of the selected features, and at the same time, there is no evidence that they are affected by the age of patients.
The confusion matrix presenting the recognition results based on the six features is depicted in Figure 8. For this case, the following values of other quality measures of the classifier were obtained: sensitivity 91.67% and specificity 91.67%. Because the true negative and true positive are the same and the number of persons in the groups (PD and HC) are also the same, the values in the last column and in the last row are equal. The last column represents the percentages of all the cases recognized to belong to the class ill or healthy that are correctly (green) and incorrectly (red) classified. The metrics in the last row show the number of cases that belong (green) and do not belong (red) to each class related to the total number of persons that are correctly and incorrectly classified to that class.

8. Discussion

Due to the specificity of this study, assuming that the acquired samples came from patients in the ON phase, the results obtained can be compared with the results presented in [32,33,34,35,36] with a similar methodology. In works [32,33], features were also determined on the basis of whole sentences, while in works [34,35,36], samples of other types of writing (single letters, words, spiral drawings) were additionally analyzed. In these works, as in the presented one, after the determination of features, a selection among them was carried out to distinguish those with the best discriminatory capacity, which was used at a later stage in the classification process.
Here, the SVM algorithm was applied for this process, the use of which also gave other authors the best results. However, in this work, the methodology for determining features is different. The focus here is on handwriting disorders that can manifest or progress during prolonged writing. Therefore, as appropriate diagnostic features, combined measures of five sentences written one below the other, calculated for all primary features describing handwriting, were used.
Table 5 shows a comparison of the accuracy, sensitivity and specificity values obtained in this paper and by other authors. The accuracy of the diagnosis reported here was obtained at a significantly higher level than that in [32,33,34,35,36], with a much smaller number of features.
In further research, we are planning to extend the above research to include the use of today’s intensively developing neural networks and deep learning techniques, the use of which may increase the accuracy of the recognition of Parkinson’s disease based on handwriting.

9. Conclusions

This study presents the possibilities of using handwriting as an indicator of the occurrence of disorders resulting from the presence of Parkinson’s disease. The results obtained are comparable to the results of others in studies with similar methodology but with a much smaller number of features.
This work is a continuation of our previous analysis of experimental data, which we obtained as part of a project on multimodal data acquisition for the objective assessment of Parkinson’s disease during tests performed according to the UPDRS recommendation. As part of a series of publications devoted to voice samples [47], face images acquired in the visible light and infrared range [48] and video recordings containing the results of the rapid finger tapping test [49], we present an analysis of data obtained from the same patients whose handwriting samples are the subject of the research presented in this paper.
The classification accuracy that was presented in this paper is similar to the results of our previous works. The accuracies obtained (96% for voice samples, 94% for facial images and 81% for finger tapping) appear to be promising for medical research, as they show the possibility of certain objectivity. The results of the ‘gold standard’, which is considered a set of tests assessing the patient’s condition according to the UPDRS, depend on the experience of the physicians who perform them and therefore can be treated as subjective. However, one should be aware of certain limitations of the presented results. One of them is the small number of people participating in this experiment, although it is similar to the number of people participating in the research presented by others in the literature. Although the formal assessment of a patient’s condition using the UPDRS does not take into account the patient’s age and gender, perhaps such groups should be taken into account in the analysis of data obtained from objective acquisitions. A larger sample would be needed to carry out such an analysis. In addition, in our studies, we only show the possibility of binary classification, while in clinical practice, information about the severity of the disease is also important. All this means that the results presented herein are more likely to convince the medical community of a certain possibility of using technical devices and analyzing the data obtained than they are to be used as a basis for the implementation of ready-made solutions in clinical practice. In this regard, more cooperation is needed with the medical community.

Author Contributions

Conceptualization, A.P.-C. and K.B.; methodology, K.B., A.P.-C. and J.J.; software, K.B. and J.J.; validation, A.K.-P.; formal analysis, K.B. and J.J.; investigation, K.B.; resources, A.P.-C. and M.N.; data curation, K.B.; writing—original draft preparation, K.B. and J.J.; writing—review and editing, J.J., A.P.-C., M.N. and A.K.-P.; visualization, K.B. and J.J.; supervision, A.K.-P., A.P.-C. and J.J.; project administration, J.J. and A.P.-C.; funding acquisition, J.J., A.P.-C. and A.K.-P. All authors have read and agreed to the published version of the manuscript.

Funding

This research was funded by the Polish Ministry of National Defense for the implementation of basic research within the research grant No. GBMON/13-996/2018/WAT “Basic research in the field of sensor technology using innovative data processing methods”.

Institutional Review Board Statement

This study was conducted according to the guidelines of the Declaration of Helsinki and approved by the Ethics Committee of Medical University of Warsaw (protocol code KB/106/2019 approved on 10 June 2019).

Informed Consent Statement

Informed consent was obtained from all subjects involved in this study.

Data Availability Statement

The datasets presented in this article are not readily available due to restrictions imposed by the Ethics Committee of Medical University of Warsaw (protocol code KB/106/2019 approved on 10 June 2019).

Conflicts of Interest

The authors declare no conflicts of interest. The funders had no role in the design of the study; in the collection, analyses, or interpretation of data; in the writing of the manuscript; or in the decision to publish the results.

References

  1. Pang, M.; Peng, R.; Wang, Y.; Zhu, Y.; Wang, P.; Moussian, B.; Su, Y.; Liu, X.; Ming, D. Molecular understanding of the translational models and the therapeutic potential natural products of Parkinson’s disease. Biomed. Pharmacother. 2022, 155, 113718. [Google Scholar] [CrossRef] [PubMed]
  2. Kouli, A.; Torsney, K.M.; Kuan, W. Parkinson’s Disease: Etiology, Neuropathology, and Pathogenesis; Codon Publications eBooks: Brisbane, Australia, 2018; pp. 3–26. [Google Scholar] [CrossRef]
  3. Dorsey, E.R.; Constantinescu, R.; Thompson, J.P.; Biglan, K.M.; Holloway, R.G.; Kieburtz, K.; Marshall, F.J.; Ravina, B.M.; Schifitto, G.; Siderowf, A.; et al. Projected number of people with Parkinson disease in the most populous nations, 2005 through 2030. Neurology 2007, 68, 384–386. [Google Scholar] [CrossRef] [PubMed]
  4. Statistics. Parkinson’s Foundation. Available online: https://www.parkinson.org/understanding-parkinsons/statistics (accessed on 17 August 2024).
  5. Jankovic, J. Parkinson’s disease: Clinical features and diagnosis. J. Neurol. Neurosurg. Psychiatry 2008, 79, 368–376. [Google Scholar] [CrossRef] [PubMed]
  6. Massano, J.; Bhatia, K.P. Clinical approach to parkinson’s disease: Features, diagnosis, and principles of management. Cold Spring Harb. Perspect. Med. 2012, 2, a008870. [Google Scholar] [CrossRef] [PubMed]
  7. Van Galen, G.P. Handwriting: Issues for a psychomotor theory. Hum. Mov. Sci. 1991, 10, 165–1911. [Google Scholar] [CrossRef]
  8. Becker, G.; Müller, A.; Braune, S.; Büttner, T.; Benecke, R.; Greulich, W.; Klein, W.; Mark, G.; Rieke, J.; Thümler, R. Early diagnosis of parkinson’s disease. J. Neurol. 2002, 249, iii40–iii48. [Google Scholar] [CrossRef]
  9. The Unified Parkinson’s Disease Rating Scale (UPDRS): Status and recommendations. Mov. Disord. 2003, 18, 738–750. [CrossRef]
  10. McLennan, J.; Nakano, K.; Tyler, H.; Schwab, R. Micrographia in parkinson’s disease. J. Neurol. Sci. 1972, 15, 141–152. [Google Scholar] [CrossRef]
  11. Margolin, D.I.; Wing, A.M. Agraphia and Micrographia: Clinical manifestations of motor programming and performance disorders. Acta Psychol. 1983, 54, 263–283. [Google Scholar] [CrossRef]
  12. Shukla, A.W.; Ounpraseuth, S.; Okun, M.S.; Gray, V.; Schwankhaus, J.; Metzer, W.S. Micrographia and related deficits in parkinson’s disease: A cross-sectional study. BMJ Open 2012, 2, e000628. [Google Scholar] [CrossRef]
  13. Mergl, R.; Tigges, P.; Schröter, A.; Möller, H.-J.; Hegerl, U. Digitized analysis of handwriting and drawing movements in healthy subjects: Methods, results and perspectives. J. Neurosci. Methods 1999, 90, 157–169. [Google Scholar] [CrossRef] [PubMed]
  14. Thomas, M.; Lenka, A.; Pal, P.K. Handwriting analysis in parkinson’s disease: Current status and future directions. Mov. Disord. Clin. Pract. 2017, 4, 806–818. [Google Scholar] [CrossRef] [PubMed]
  15. Teulings, H.-L.; Stelmach, G.E. Force amplitude and force duration in Parkinsonian handwriting. In Tutorials in Motor Neuroscience; Springer: Dordrecht, The Netherlands, 1991; pp. 149–160. [Google Scholar] [CrossRef]
  16. Teulings, H.-L.; Stelmach, G.E. Signal-to-noise ratio of handwriting size, force, and time: Cues to early markers of parkinson’s disease? Sensorimotor Impair. Elder. 1993, 75, 311–327. [Google Scholar] [CrossRef]
  17. Oliveira, R.M.; Gurd, J.M.; Nixon, P.; Marshall, J.C.; Passingham, R.E. Micrographia in parkinson’s disease: The effect of providing external cues. J. Neurol. Neurosurg. Psychiatry 1997, 63, 429–433. [Google Scholar] [CrossRef]
  18. Van Gemmert, A.W.; Teulings, H.L.; Stelmach, G.E. Parkinsonian Patients Reduce Their Stroke Size with Increased Processing Demands. Brain Cogn. 2001, 47, 504–512. [Google Scholar] [CrossRef]
  19. Van Gemmert, A.W.; Adler, C.H.; Stelmach, G.E. Parkinson’s disease patients undershoot target size in handwriting and similar tasks. J. Neurol. Neurosurg. Psychiatry 2003, 74, 1502–1508. [Google Scholar] [CrossRef]
  20. Caligiuri, M.P.; Teulings, H.-L.; Filoteo, J.V.; Song, D.; Lohr, J.B. Quantitative measurement of handwriting in the assessment of drug-induced parkinsonism. Hum. Mov. Sci. 2006, 25, 510–522. [Google Scholar] [CrossRef]
  21. Broeder, S.; Nackaerts, E.; Nieuwboer, A.; Smits-Engelsman, B.; Swinnen, S.; Heremans, E. The effects of dual tasking on handwriting in patients with Parkinson’s disease. Neuroscience 2014, 263, 193–202. [Google Scholar] [CrossRef]
  22. Teulings, H.-L.; Contreras-Vidal, J.L.; E Stelmach, G.; Adler, C.H. Adaptation of handwriting size under distorted visual feedback in patients with Parkinson’s disease and elderly and young controls. J. Neurol. Neurosurg. Psychiatry 2002, 72, 315–324. [Google Scholar] [CrossRef]
  23. Contreras-Vidal, J.L.; Teulings, H.-L.; E Stelmach, G.; Adler, C.H. Adaptation to changes in vertical display gain during handwriting in Parkinson’s disease patients, elderly and young controls. Park. Relat. Disord. 2002, 9, 77–84. [Google Scholar] [CrossRef]
  24. Ponsen, M.M.; Daffertshofer, A.; Wolters, E.C.; Beek, P.J.; Berendse, H.W. Impairment of complex upper limb motor function in de novo Parkinson’s disease. Park. Relat. Disord. 2008, 14, 199–204. [Google Scholar] [CrossRef]
  25. Smits, E.J.; Tolonen, A.J.; Cluitmans, L.; van Gils, M.; Conway, B.A.; Zietsma, R.C.; Leenders, K.L.; Maurits, N.M. Standardized handwriting to assess bradykinesia, micrographia and tremor in Parkinson’s disease. PLoS ONE 2014, 9, e97614. [Google Scholar] [CrossRef] [PubMed]
  26. Zham, P.; Raghav, S.; Kempster, P.; Arjunan, S.P.; Wong, K.; Nagao, K.J.; Kumar, D.K. A kinematic study of progressive micrographia in Parkinson’s disease. Front. Neurol. 2019, 10, 403. [Google Scholar] [CrossRef] [PubMed]
  27. van Gemmert, A.W.; Teulings, H.-L.; Stelmach, G.E. The influence of mental and motor load on handwriting movements in Parkinsonian patients. Acta Psychol. 1998, 100, 161–175. [Google Scholar] [CrossRef]
  28. Tucha, O.; Mecklinger, L.; Thome, J.; Reiter, A.; Alders, G.L.; Sartor, H.; Naumann, M.; Lange, K.W. Kinematic analysis of dopaminergic effects on skilled handwriting movements in Parkinson’s disease. J. Neural Transm. 2005, 113, 609–623. [Google Scholar] [CrossRef]
  29. Poluha, P.; Teulings, H.-L.; Brookshire, R. Handwriting and speech changes across the levodopa cycle in Parkinson’s disease. Acta Psychol. 1998, 100, 71–84. [Google Scholar] [CrossRef] [PubMed]
  30. Broderick, M.P.; Van Gemmert, A.W.A.; Shill, H.A.; Stelmach, G.E. Hypometria and bradykinesia during drawing movements in individuals with Parkinson’s disease. Exp. Brain Res. 2009, 197, 223–233. [Google Scholar] [CrossRef]
  31. Rosenblum, S.; Samuel, M.; Zlotnik, S.; Erikh, I.; Schlesinger, I. Handwriting as an objective tool for Parkinson’s disease diagnosis. J. Neurol. 2013, 260, 2357–2361. [Google Scholar] [CrossRef]
  32. Jerkovic, V.M.; Kojic, V.; Miskovic, N.D.; Djukic, T.; Kostic, V.S.; Popovic, M.B. Analysis of on-surface and in-air movement in handwriting of subjects with Parkinson’s disease and atypical parkinsonism. Biomed. Eng. Biomed. Tech. 2018, 64, 187–194. [Google Scholar] [CrossRef]
  33. Drotár, P.; Mekyska, J.; Rektorová, I.; Masarová, L.; Smékal, Z.; Faundez-Zanuy, M. Analysis of in-air movement in handwriting: A novel marker for Parkinson’s disease. Comput. Methods Programs Biomed. 2014, 117, 405–411. [Google Scholar] [CrossRef]
  34. Drotar, P.; Mekyska, J.; Rektorova, I.; Masarova, L.; Smekal, Z.; Faundez-Zanuy, M. Decision support Framework for Parkinson’s Disease based on novel handwriting markers. IEEE Trans. Neural Syst. Rehabilit. Eng. 2015, 23, 508–516. [Google Scholar] [CrossRef] [PubMed]
  35. Drotár, P.; Mekyska, J.; Rektorová, I.; Masarová, L.; Smékal, Z.; Faundez-Zanuy, M. Evaluation of handwriting kinematics and pressure for differential diagnosis of Parkinson’s disease. Artif. Intell. Med. 2016, 67, 39–46. [Google Scholar] [CrossRef] [PubMed]
  36. Impedovo, D.; Pirlo, G.; Vessio, G. Dynamic handwriting analysis for supporting earlier Parkinson’s disease diagnosis. Information 2018, 9, 247. [Google Scholar] [CrossRef]
  37. Mucha, J.; Mekyska, J.; Galaz, Z.; Faundez-Zanuy, M.; Lopez-De-Ipina, K.; Zvoncak, V.; Kiska, T.; Smekal, Z.; Brabenec, L.; Rektorova, I. Identification and monitoring of Parkinson’s Disease dysgraphia based on Fractional-Order derivatives of online handwriting. Appl. Sci. 2018, 8, 2566. [Google Scholar] [CrossRef]
  38. Moetesum, M.; Siddiqi, I.; Vincent, N.; Cloppet, F. Assessing visual attributes of handwriting for prediction of neurological disorders—A case study on Parkinson’s disease. Pattern Recognit. Lett. 2018, 121, 19–27. [Google Scholar] [CrossRef]
  39. Naseer, A.; Rani, M.; Naz, S.; Razzak, M.I.; Imran, M.; Xu, G. Refining Parkinson’s neurological disorder identification through deep transfer learning. Neural Comput. Appl. 2019, 32, 839–854. [Google Scholar] [CrossRef]
  40. Arnab, S.R.; Uddin, M.R.; Jawad, A. Enhancing Parkinson’s disease detection through handwriting analysis: A deep learning approach with segmentation and transfer learning. In Proceedings of the 26th International Conference on Computer and Information Technology (ICCIT), Cox’s Bazar, Bangladesh, 13–15 December 2023. [Google Scholar] [CrossRef]
  41. Naz, S.; Kamran, I.; Gul, S.; Hadi, F.; Khalifa, F. Multi-Model fusion of CNNs for identification of Parkinson’s disease using handwritten samples. IEEE Access 2023, 11, 135600–135608. [Google Scholar] [CrossRef]
  42. Chmielińska, J.; Białek, K.; Potulska-Chromik, A.; Jakubowski, J.; Majda-Zdancewicz, E.; Nojszewska, M.; Kostera-Pruszczyk, A.; Dobrowolski, A. Multimodal data acquisition set for objective assessment of Parkinson’s disease. Radioelectron. Syst. Conf. 2019, 11442, 115–124. [Google Scholar] [CrossRef]
  43. Białek, K.; Jakubowski, J.; Białek, R. Parametrization of handwriting for the assessment of neurodegenerative disorders on the example of Parkinson’s disease. Prz. Elektrotechniczny 2024, 1, 277–279. [Google Scholar] [CrossRef]
  44. Nersisyan, S.; Novosad, V.; Galatenko, A.; Sokolov, A.; Bokov, G.; Konovalov, A.; Alekseev, D.; Tonevitsky, A. ExhauFS: Exhaustive search-based feature selection for classification and survival regression. PeerJ 2022, 10, e13200. [Google Scholar] [CrossRef]
  45. De La Torre Bucio, J.; Paz, A.R.; Rios, J.A.M. Exhaustive search applied to time series forecasting methods using parallel processing. In Proceedings of the 2022 IEEE International Autumn Meeting on Power, Electronics and Computing (ROPEC), Ixtapa, Mexico, 9–11 November 2022. [Google Scholar] [CrossRef]
  46. Asci, F.; Scardapane, S.; Zampogna, A.; D’onofrio, V.; Testa, L.; Patera, M.; Falletti, M.; Marsili, L.; Suppa, A. Handwriting Declines with Human aging: A Machine Learning study. Front. Aging Neurosci. 2022, 14, 889930. [Google Scholar] [CrossRef] [PubMed]
  47. Majda-Zdancewicz, E.; Potulska-Chromik, A.; Jakubowski, J.; Nojszewska, M.; Kostera-Pruszczyk, A. Deep learning vs feature engineering in the assessment of voice signals for diagnosis in Parkinson’s disease. Bull. Pol. Acad. Sci. Tech. Sci. 2021, 69, 137347. [Google Scholar] [CrossRef]
  48. Jakubowski, J.; Potulska-Chromik, A.; Białek, K.; Nojszewska, M.; Kostera-Pruszczyk, A. A study on the possible diagnosis of Parkinson’s disease on the basis of facial image analysis. Electronics 2021, 10, 2832. [Google Scholar] [CrossRef]
  49. Jakubowski, J.; Potulska-Chromik, A.; Chmielińska, J.; Nojszewska, M.; Kostera-Pruszczyk, A. Application of imaging techniques to objectify the Finger Tapping test used in the diagnosis of Parkinson’s disease. Bull. Pol. Acad. Sci. Tech. Sci. 2023, 71, 144886. [Google Scholar] [CrossRef]
Figure 1. Examples of handwriting sample images obtained during the examination. (a) An image made by an ill person. (b) An image made by a healthy person.
Electronics 13 03962 g001
Figure 2. Example sentences drawn by a healthy subject. (a) A set of samples acquired when the pen was touching the surface. (b) All samples taken into account and those acquired in air.
Electronics 13 03962 g002
Figure 3. Examples of handwriting sample images taking into account the value of pressure. (a) An image made by an ill person. (b) An image made by a healthy person.
Electronics 13 03962 g003
Figure 4. Graph of pressure waveform with pressure features marked.
Electronics 13 03962 g004
Figure 5. Quantification of micrography. (a) Finding the length of a sentence (the blue line is a linear approximation of the acquired points). (b) Finding fields of boxes containing single strokes (each red frame represents a single stroke).
Electronics 13 03962 g005
Figure 6. The data processing scheme adopted in order to assess the recognition process.
Electronics 13 03962 g006
Figure 7. Numerical complexity and recognition accuracy as a function of the number of features selected as a result of the exhaustive searching (SVM algorithm used).
Electronics 13 03962 g007
Figure 8. Confusion matrix showing results of Parkinson’s disease diagnosis based on selected handwriting features.
Electronics 13 03962 g008
Table 1. The basic characteristics of the research group (PD) and the control group (HC).
VolunteersMaleFemaleTotalAge Range
PD8162428–84
HC1952425–74
Table 2. List of handwriting features.
Group of FeaturesSymptoms of PDMeasured FeatureDescription
Time featuresBradykinesia
(1)
in-air time
(1)
time spent in the air while writing
(2)
on-surface time
(2)
time spent on the surface of the tablet while writing
(3)
total time
(3)
total writing time (in-air time + on-surface time)
Velocity featuresBradykinesia
(4)
speed
(4)
the length of the trajectory of the writing divided by the duration of writing
Pressure featuresRest tremor
Limb stiffness
(5)
mean pressure
(5)
the average pressure used while writing
(6)
mean peak pressure
(6)
the average of the maxima of the pressure function
(7)
peak pressure trend
(7)
the directional factor of the approximating maxima linear function of the pressure function
(8)
writing pulse
(8)
the number of pen strokes
Handwriting geometry featuresMicrographia
Hypometria
Kinesthesia
(9)
tilt angle
(9)
sentence slope angle
(10)
sentence length
(10)
distance from the beginning to the end of a sentence taking into account the slope
(11)
letter area
(11)
the sum of fields of individual strokes
(12)
letter length
(12)
the sum of the lengths of pen strokes
Table 3. The average values of time features and their standard deviations calculated on the basis of 5 sentences forming the image at the time of data acquisition.
ClassIn-Air Time [s]On-Surface Time [s]Total [s]
PD4.1 ± 2.010.3 ± 3.314.5 ± 4.8
HC3.7 ± 1.57.9 ± 1.611.5 ± 2.8
Table 4. Results of two-way MANOVA.
SourceDfTest StatisticValueFp-Value
State
(PD or healthy)
1Pillai0.262.330.05
Wilks0.742.330.05
Hotteling0.362.330.05
Roy0.362.330.05
Age
(younger adults 18–35 years
or middle-aged adults 36–55 years or older adults 56 years and older) [46]
2Pillai0.160.580.85
Wilks0.840.580.85
Hotteling0.180.590.84
Roy0.161.090.39
Table 5. Comparison of results obtained in other works on similar topics.
ReferenceACC [%]Sensitivity [%]Specificity [%]Number of FeaturesAdditional Information
[33] Drotár, P. et al., 201485.6185.9585.2650Single sentence, PaHaW database
[34] Drotár, P. et al., 201488.1--1627 different handwriting tasks, PaHaW
[35] Drotár, P. et al., 201681.380,987.4208 different handwriting tasks, PaHaW
[36] Impedovo, D. et al., 201874.7668.9777.78unknown8 different handwriting tasks, PaHaW
[32] Jerkovic, V. M. et al., 201986.05--20Single sentence
this paper91.6791.6791.676Same 5 sentences
Disclaimer/Publisher’s Note: The statements, opinions and data contained in all publications are solely those of the individual author(s) and contributor(s) and not of MDPI and/or the editor(s). MDPI and/or the editor(s) disclaim responsibility for any injury to people or property resulting from any ideas, methods, instructions or products referred to in the content.

