Article

AnomalySeg: Deep Learning-Based Fast Anomaly Segmentation Approach for Surface Defect Detection

1
School of Electronic Engineering, Nanjing Xiaozhuang University, Nanjing 211171, China
2
School of Electronic Engineering, Jiangsu Ocean University, Lianyungang 222005, China
*
Author to whom correspondence should be addressed.
Electronics 2024, 13(2), 284; https://doi.org/10.3390/electronics13020284
Submission received: 15 November 2023 / Revised: 1 January 2024 / Accepted: 5 January 2024 / Published: 8 January 2024

Abstract

:
Product quality inspection is a crucial element of industrial manufacturing, yet flaws such as blemishes and stains frequently emerge after the product is completed. Most research has utilized detection models and avoided segmenting networks due to the unequal distribution of faulty information. To overcome this challenge, this work presents a rapid segmentation-based technique for surface defect detection. The proposed model is based on a modified U-Net, which introduces a hybrid residual module (SAFM), combining an improved spatial attention mechanism and a feedforward neural network in place of the remaining downsampling layers, except for the first layer of downsampling in the encoder, and applies this residual module to the decoder structure. Dilated convolutions are also incorporated in the decoder to obtain more spatial information about the feature defects and to reduce the gradient vanishing problem of the model. An improved hybrid loss function with Dice and focal loss is introduced to alleviate the small defect segmentation problem. Comparative experiments were conducted on different segmentation-based inspection methods, revealing that the Dice coefficient (DSC) evaluated by the proposed approach is better than previous generic segmentation benchmarks on KolektorSDD, KolektorSDD2, and RSDD datasets, with fewer parameters and FLOPs. Additionally, the detection network displays higher precision in recognizing the characteristics of minor flaws. This paper proposes a practical and effective technique for anomaly segmentation in surface defect identification, delivering considerable improvements over previous methods.

1. Introduction

Surface defect detection has always been essential for quality control and condition assessment. Effective quality inspection of industrial products can greatly decrease the defective rate of these products. As the traditional inspection approach, manual visual inspection is accomplished through subjective discrimination, and the accuracy of defect detection depends on the rich experience that inspectors learn from extensive training. Therefore, manual inspection is generally considered inefficient and laborious and lacks consistency and reliability. As technology evolves, detection methods now include eddy current detection [1], leakage detection [2], capacitance detection [3], ultrasonic detection [4], etc. These methods vary in terms of the size and types of detectable defects, quality of detection, and accuracy limitations. In particular, in industrial environments, complex working conditions can introduce significant interference to traditional defect detection factors. The acquisition of industrial defect samples and the unknown irregularity of these defects can have certain impacts. Therefore, for traditional defect detection methods, accurately identifying workpiece defects, reducing interference from external factors, and acquiring defect datasets can be great challenges. In attempt to address these problems, numerous research efforts have been conducted on the rapid and accurate location of surface defects in automated production.
Machine vision is a technology that deals with imaging-based inspection and analysis. For decades, this technique has been widely adopted in many industrial applications, e.g., metallic surface defect detection [5,6,7], steel defect detection [8,9,10], quality control in manufacturing [11,12,13], health monitoring of concrete structures [14,15,16,17,18], and condition assessment of product components [19,20,21,22], among others. According to the employed technology routes, the methods used above can be concluded into two categories [5]: image processing-based and machine learning-based.
The image processing-based method converts the detected image to the non-spatial domain, and identifies the defects by comparing the discriminative attributes obtained from the defective textures and defect-free ones. Common image processing-based methods include wavelet transform [19], Fourier transform [23], template match [24], rank decomposition [25], and so on. Machine learning-based methods generally consist of two phases: feature extraction and pattern classification. In the feature extraction phase, the feature vector is obtained from the input image via feature descriptors that are manually designed by experts. These descriptors encode and represent the image information. Shallow neural networks are the primary architecture in the pattern classification phase. The feature vector is then forward propagated through the pre-trained network to produce the probability of the category, which is utilized to determine whether the input image contains defect areas and categories. These handcrafted features include the local binary pattern (LBP) feature [15], a gray-level co-occurrence matrix (GLCM) [26], and other grayscale statistical features [9,16,24,27]. Although these two inspection methods, following different technical routes, have achieved successful results, they both have limitations. Firstly, the image processing-based method requires a significant amount of computing resources in most conditions and may encounter computational bottlenecks on small terminal devices. Moreover, the manually designed features are not sufficiently robust and discriminative enough to deal with complex on-site environments.
Given the development of defect detection technology, techniques based on deep convolutional neural networks have gradually alleviated the above problems and demonstrated excellent performance in different vision tasks [28].Through end-to-end learning, deep neural network-based methods can automatically extract features, avoiding the difficulty of manually designing features. Inspired by these successful detection architectures, research on surface defect detection using deep neural networks has emerged. According to the type of neural network used in the defect detection task, the inspection methods can be categorized into three classes: classification-based, detection-based, and segmentation-based. The classification-based approach requires a combination of the upper sliding window method to classify and locate defects. The detection-based method needs to locate and frame the defects, while simultaneously identifying their categories [12,17,18,21,29,30,31,32,33,34,35]. Segmentation-based methods need to produce a pixel-wise probability map to determine the shape of defects, thereby measuring the actual area of anomalies. Ho et al. [36] designed an object-oriented defect detection method to address the defect problem in complex contexts, employing a deep residual neural network (DRNN) that performs both feature extraction and classification operations. The addition of cascade layers increases the system’s filtering depth. This network significantly improves the detection accuracy of the convolutional algorithm. Yang et al. [37] proposed a new defect detection network (NDDnet) for solving problems such as inadequate feature processing, and used an attention fusion block instead of the initial skip connection, which made the segmentation network emphasize the defect region well and improve detection accuracy. In [34], an optimized MobileNet-SSD was applied to the defect detection of the sealing surface, suggesting better performance in accuracy and speed than lightweight network methods and traditional machine learning methods. Although these detection-based methods demonstrate better results in surface defect detection, they require larger volumes of labeled datasets than traditional machine learning methods. Surface defect datasets are often imbalanced, where anomalous data are severely under-sampled due to their low occurrence frequency [14].
Instead of requiring massive amounts of labeled data like in the above three detection methods, among the segmentation-based methods, the reconstruction-based methods [33] can develop and train anomaly detection models simply by entering a large number of normal, defect-free samples into the model. This technique is trained to reconstruct an image similar to the input image and identify defects by comparing reconstructed textures that are extremely different from the normal data.Tao et al. [38] devised a novel cascaded network with autoencoders to segment metal surface defects and a compact CNN for classifying their specific classes, which are experimentally demonstrated to have strong robustness and high accuracy in metallic defect detection. Mei et al. [39] proposed an unsupervised learning model that only needs defect-free samples to implement defect detection. A convolutional denoising autoencoder network is adopted to reconstruct image patches at different Gaussian pyramid levels, where detection results are synthesized. Li et al. [40] proposed an anomaly detection method based on double attention and consistency loss to solve the surface defect detection problems, effectively enabling the network to separate defective images from defect-free images through channel attention and pixel attention, and achieving good performance in comparison with other detection methods. These aforementioned approaches only desire normal data in the training process. Nevertheless, these reconstruction models make it difficult to make a trade-off between network depth and generalization ability. Thus, focusing on these problems of anomaly detection on surface defects, we propose a fast anomaly segmentation model to deal with the above challenges; moreover, our proposed defect detection model was built on an improved U-Net architecture that introduces a hybrid residual module, combining a spatial attention mechanism and feed-forward neural networks, outperforming existing general-purpose segmentation methods.
The remainder of this paper is organized as follows. The adopted methods of the proposed work are delineated in Section 2, including dataset preparation, network architecture, and loss function. More explicit parameter settings and other optimization operations are then introduced in Section 3. Furthermore, an assessment is carried out to validate the performance of the proposed anomaly detection approach in Section 4. A comparison is also made between the proposed approach and other excellent methods. Finally, our work is summarized in Section 5 with a discussion of the limitations of the proposed methodology and directions for future improvement.

2. Materials and Methods

2.1. Dataset Preparation

All images in this experiment were taken from the KolektorSDD, KolektorSDD2, and RSDD datasets with labels containing only anomalies. Unlabeled data represent defect-free samples and do not distinguish between defect types. The Kolektor dataset was constructed from images of defective production items provided and annotated by the Kolektor Group d. o. o. [20,41], and taken in a real controlled industrial environment.
For the KolektorSDD image set, there are 50 defective images and 350 defect-free images. The declared resolution of each surface image is 1408 × 512 pixels, but it was verified that its height is actually between 1240 and 1270 pixels. For the KolektorSDD2 image set, there are 356 images with visible defects and 2979 images without defects, each with a resolution of 230 × 630 pixels. Therefore, before being fed into the network, these surface images were scaled to a fixed size and implemented by the bilinear interpolation algorithms. Most of the defects in these two types of images are scratches, spots, notches, etc. Examples of such images are depicted in Figure 1.
The rail surface defect detection (RSDD) dataset is a standard dataset for rail inspection. The RSDD dataset includes two types: the Type-I RSDD dataset, with 67 challenging images captured from fast rail, and the Type-II RSDD dataset, with 128 challenging images captured from transport rail. Surface defect images in the Type-I RSDD dataset have a fixed width of 160 pixels but vary in height between 1000 and 1282 pixels. In contrast, surface defect images in the Type-II RSDD dataset have a fixed resolution of 1250 × 55 pixels. For convenience in calculations, surface images from the Type-I RSDD dataset are scaled to a fixed size, similar to those in the Kolektor dataset. Examples of such images are exhibited in Figure 2. Meanwhile, in order to train our proposed model, we cropped the original images and performed the image enhancement process. This resulted in 67 defective images and 201 defect-free images for the RSDD Type-I dataset, and 128 defective images and 384 defect-free images for the RSDD Type-II dataset.
Based on the presentation of the three types of datasets mentioned above, we found that the indicated defects in them range in size from centimeters to millimeters. The centimeter-sized defects include cracks, grooves, etc., while the millimeter-sized defects include fine scratches, dots, etc. Thus, we divided the dataset into a train set, validation set, and test set in a ratio of 7:2:1 for model training, parameter optimization, and model evaluation, respectively. After dividing the dataset, the KolektorSDD dataset was split into 280 training samples, 80 validation samples, and 40 test samples. The KolektorSDD2 dataset was divided into 2330 training samples, 666 validation samples, and 338 test samples. The RSDD Type-I dataset comprises a total of 536 samples (364 training, 120 validation, and 52 test samples), and the RSDD Type-II dataset comprises a total of 1024 samples (712 training, 208 validation, and 104 test samples).

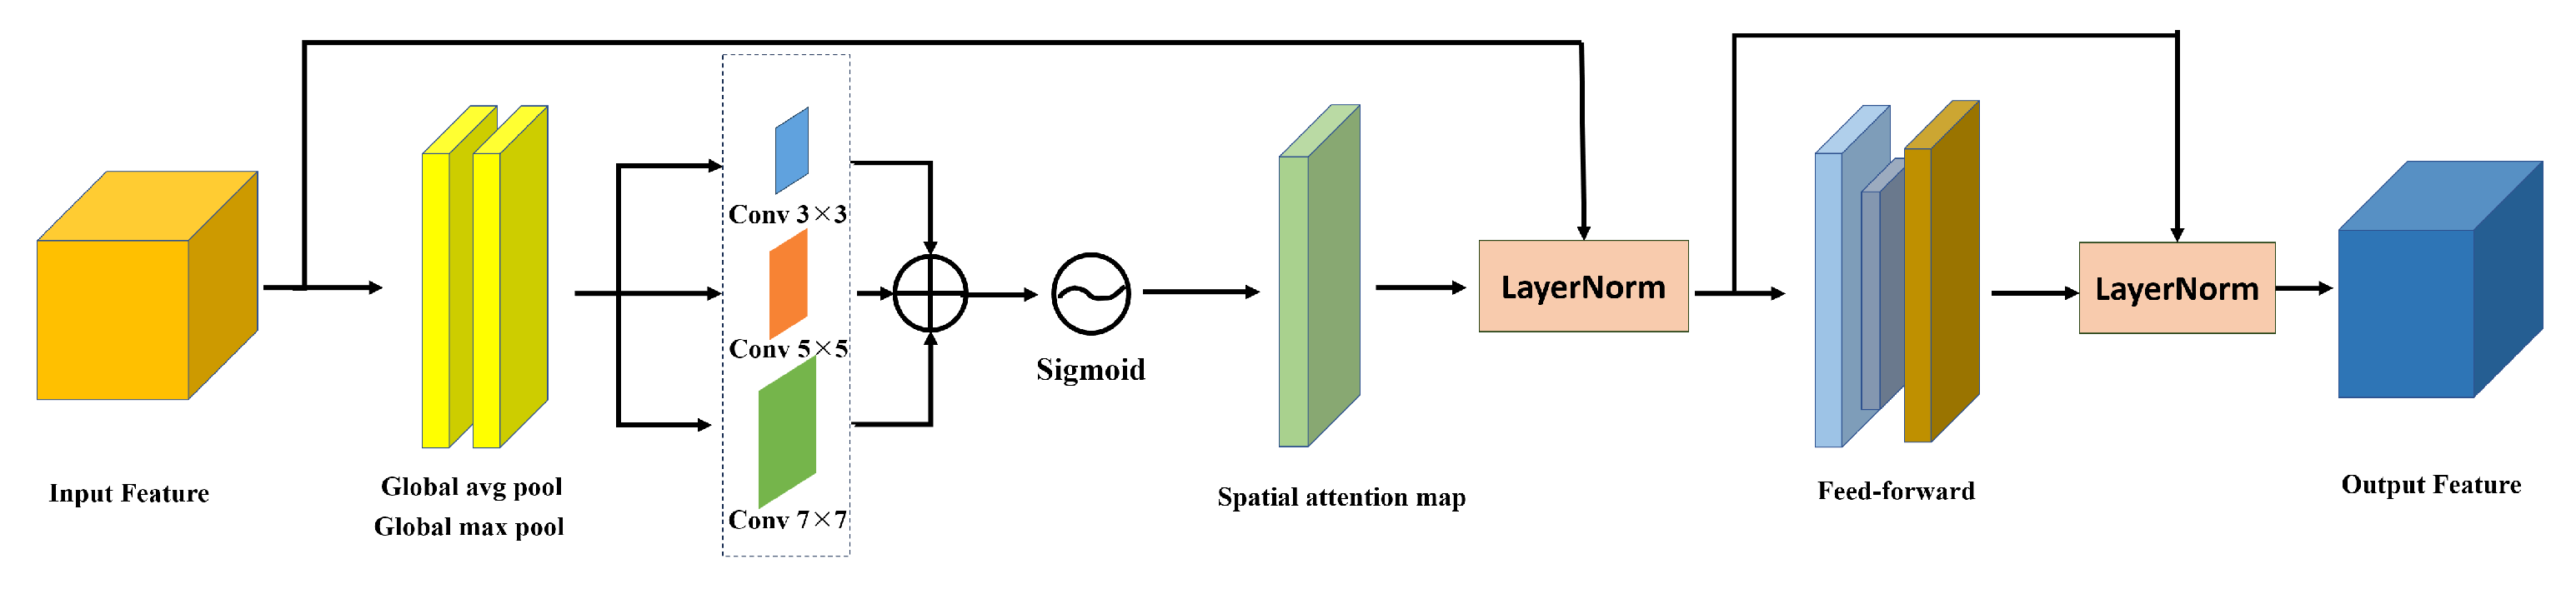
2.2. Network Architecture

Surface defects in images acquired from real industrial environments are usually small compared to other common segmentation objects. They occur mainly due to material aging, mechanical damage, and environmental effects. Generalized segmentation networks cannot be directly used for anomaly detection because multiple downsampling operations are used in their networks, which may lose the semantic information of small defects, such as cracks and breakage points. Inspired by reference [42], in this study, we eliminate all downsampling layers of the encoder in the U-Net network, retaining only the first layer, and propose a hybrid residual module (SAFM), combining a spatial attention mechanism and feed-forward neural network to replace the downsampling layers in the U-Net network, in which the spatial attention mechanism is structurally optimized, as demonstrated in Figure 3.
AnomalySeg is an improved work based on AnatomyNet [42], which is a variant of the 3D U-Net for organs-at-risk (OARs) segmentation. Taking into account the consistency of the effect, the network structure in this paper still broadly follows the latter, performing the conversion of 3D convolutional layers to 2D convolutional layers. In contrast to [42], we introduce a hybrid residual module that replaces the traditional 3 × 3 convolution with 3 × 1 and 1 × 3 convolutions on the main path of the residual module, greatly reducing computational effort, as illustrated in Figure 4. An improved spatial attention module (SAFM) is included in its branch, which first replaces the original 7 × 7 convolution with 3 × 3 , 5 × 5 , and 7 × 7 dilated convolutions based on spatial attention to capture feature information at more scales. Secondly, with reference to the transformer structure, it incorporates a feed-forward neural network (FFN) to optimize the truth value of the activation function with the necessary normalization. Thus, the SAFM substitutes the original squeeze excitation (SE) module in each residual block to improve the extraction rate of spatial feature information, as shown in Figure 5. The arithmetic formula for its structure is as follows:
M s ( F ) = σ ( f 3 × 3 + f 5 × 5 + f 7 × 7 ) ( G A P ( F ) , G M P ( F ) ) = σ ( f 3 × 3 + f 5 × 5 + f 7 × 7 ) ( F G A P s , F G M P s )
F = N o r m F F N [ N o r m ( F + M s ( F ) ) ] + N o r m ( F + M s ( F ) )
R 1 ( x ) = R E L U ( c o n v 1 ( c o n v 1 ( x ) ) + F ( x ) )
R 2 ( x ) = R E L U ( c o n v 1 ( c o n v 3 × 1 ( c o n v 1 × 3 ( c o n v 1 ( x ) ) ) ) + F ( x ) )
where F is the input feature and F is the output feature, f denotes the convolution operation, which includes 3 × 3 , 5 × 5 , and 7 × 7 ; moreover, σ denotes the sigmoid function. GAP and GMP denote the Global Avg pool and Global max pool, respectively, R 1 ( x ) and R 2 ( x ) express the output of two types of residual modules. The proposed network has empirically verified that adopting spatial attention is superior to channel-wise attention in emphasizing the meaningful features of small defects.
The input to AnomalySeg is a cropped surface image, with or without small defects, in the form N, C, H, W, where N, C, H, and W denote the number of batch sizes, the number of channels, the height of the feature map, and the width of the feature map, respectively. Considering the trade-off between accuracy and inference speed, the initial number of channels for the entire network is set to 24. The number of channels doubles with the high-level feature maps and ultimately reaches eight times the number of initial channels. In the output block, we replace the transposed convolution with bilinear interpolation followed by a convolution layer to avoid the checkerboard artifacts of deconvolution. After experimental comparisons, the final layer of AnatomyNet is replaced with a convolutional layer with 1 × 1 kernels and a sigmoid function.

2.3. Loss Function

The prototype of defect detection is commonly considered a hard sample mining problem because defect areas only account for 1% of the entire surface image. From the learning perspective, the hard sample contributes less to the loss compared with the negative sample. Neural networks cannot learn effective features from extremely unbalanced segmentation to distinguish between small defect areas and defect-free backgrounds. As a result, defective areas are often missed or only partially identified.
A common strategy to alleviate the small defect segmentation problem is to adjust the loss distribution of samples, such as using weighted cross-entropy, perceptual loss, or exponential logarithmic loss. However, these loss functions focus more on fine-grained classification and do not perform well in anomaly segmentation tasks. For instance, with an unbalanced dataset, the weighted cross-entropy loss function struggles to deal with category imbalance. In this work, we exploit a hybrid loss composed of focal [43] and Dice loss for small anomaly segmentation [42]. Dice loss guides the learning of model parameters from the perspective of sample similarity, rather than re-weighting. The focal loss can force the model to learn how to discriminate hard samples from the background. We test Dice loss, focal loss, and combined Dice-focal loss, respectively, on the Kolektor dataset using UNet and our proposed method. The results obtained are shown in Table 1. The total loss can be described by the following:
T P = n = 1 N p n g n
F N = n = 1 N ( 1 p n ) g n
F P = n = 1 N p n ( 1 g n )
L f o c a l = 1 N N n = 1 α ( 1 p n ) γ log p n
L f o c a l = 1 N N n = 1 α g n ( 1 p n ) γ log p n
L = L d i c e + λ L f o c a l = 1 2 T P 2 T P + F N + F P λ N n = 1 N α g n ( 1 p n ) γ log p n = 1 n = 1 N 2 p n g n p n + g n λ N n = 1 N α g n ( 1 p n ) γ log p n
where T P , F N , and F P , respectively symbolize the true positives, false negatives, and false positives of defective areas, p n represents the prediction probability for pixel n being a defect, g n shows the ground truth for pixel n being a defect, λ is the balancing coefficient between L d i c e and L f o c a l , which is described in Section 3.2, L f o c a l is the focal loss function, varied from Equation (4), α is the weighting factor to balance the loss distribution between positive and negative samples, set as 0.1 here, γ is the focusing parameter to adjust the weight of easily classified examples, set as 2 here, and N is the total number of pixels in the surface images.

3. Experimental Details

3.1. Hyperparameters

Aiming to alleviate the instability of learning caused by randomly initialized weights, the learning rate is gradually increased from 0 to a fixed learning rate. The fixed learning rate is set at 0.1 / M where M represents the number of batch sizes. Next, the learning rate is annealed to a small value using a cosine function. The warm-up and annealing of the learning rate have empirically demonstrated better performance in terms of convergence.
The experiments for the proposed approach were performed on a personal computer with an RTX 2080Ti. The specific parameters of the hardware and software used are shown in Table 2. Depending on the training task of our proposed network model and the analysis of three types of datasets, the number of batch sizes is set at 8 for the KolektorSDD, KolektorSDD2, and RSDD datasets. The total number of training epochs is set at 15 for the Kolektor dataset and 20 for the RSDD dataset. The number of warm-up epochs is set between [2, 5], based on the training epochs. The learning rate is warmed up to 0.1 / M in the warm-up epochs and annealed to 0.0001 in the remaining epochs, where M denotes the number of batch sizes.

3.2. Balancing the Loss Term

At the beginning of the training stage, the focal loss is significantly larger than the Dice loss to encourage the model to learn the data distribution of the background. After several training epochs, the focal loss converges to a small value, which is still larger than the Dice loss. Meanwhile, the Dice loss oscillates and is difficult to converge due to the uncertainty of the pixels. In order to avoid becoming trapped in the local minima of the loss, the balancing coefficient λ is progressively reduced from 1 to a small value to balance the loss term.

4. Experimental Results and Discussion

4.1. Choosing Network Structures

Before designing the network structure of the proposed approach, we compared different network structures based on specific metrics. The standard U-Net consists of convolution layers as the basic block. However, the 19-layer encoder–decoder network was empirically found to have poor performance in anomaly detection. To learn more effective feature information, we explored two other convolutional block structures: (a) the residual block, and (b) the attention mixed residual block. Altogether, we discuss the performance of the following four architectures:
  • SAFM Res UNet, the architecture implemented in AnomalySeg (Figure 4) with spatial attention feed-forward residual blocks.
  • Res UNet, modifying the SAFM residual blocks in SAFM Res UNet to residual blocks.
  • SE Res UNet, modifying the SAFM residual blocks in SAFM Res UNet to SE residual blocks.
  • CBAM Res UNet, modifying the SAFM residual blocks in SAFM Res UNet to CBAM residual blocks.
These models were trained and validated on the same dataset using identical training strategies. The performances measured by the intersection over union (IoU) and Dice coefficient (DSC) on the validation dataset are summarized in Table 3. We observed some meaningful insights from this study. Firstly, spatial attention consistently shows better performance than channel-wise attention in anomaly detection. It appears that spatial attention aids in quickly and accurately locating anomaly features by filtering out a large amount of useless background information. Secondly, to capture multi-scale spatial information, dilated convolution is introduced into the spatial attention module, which performs 3 × 3 , 5 × 5 , and 7 × 7 convolution operations, respectively, and then is scaled by a feed-forward neural network. This approach can effectively extract multi-scale feature information. Furthermore, when combined with the residual structure of the spatial attention module, it exhibits excellent performance in anomaly detection.

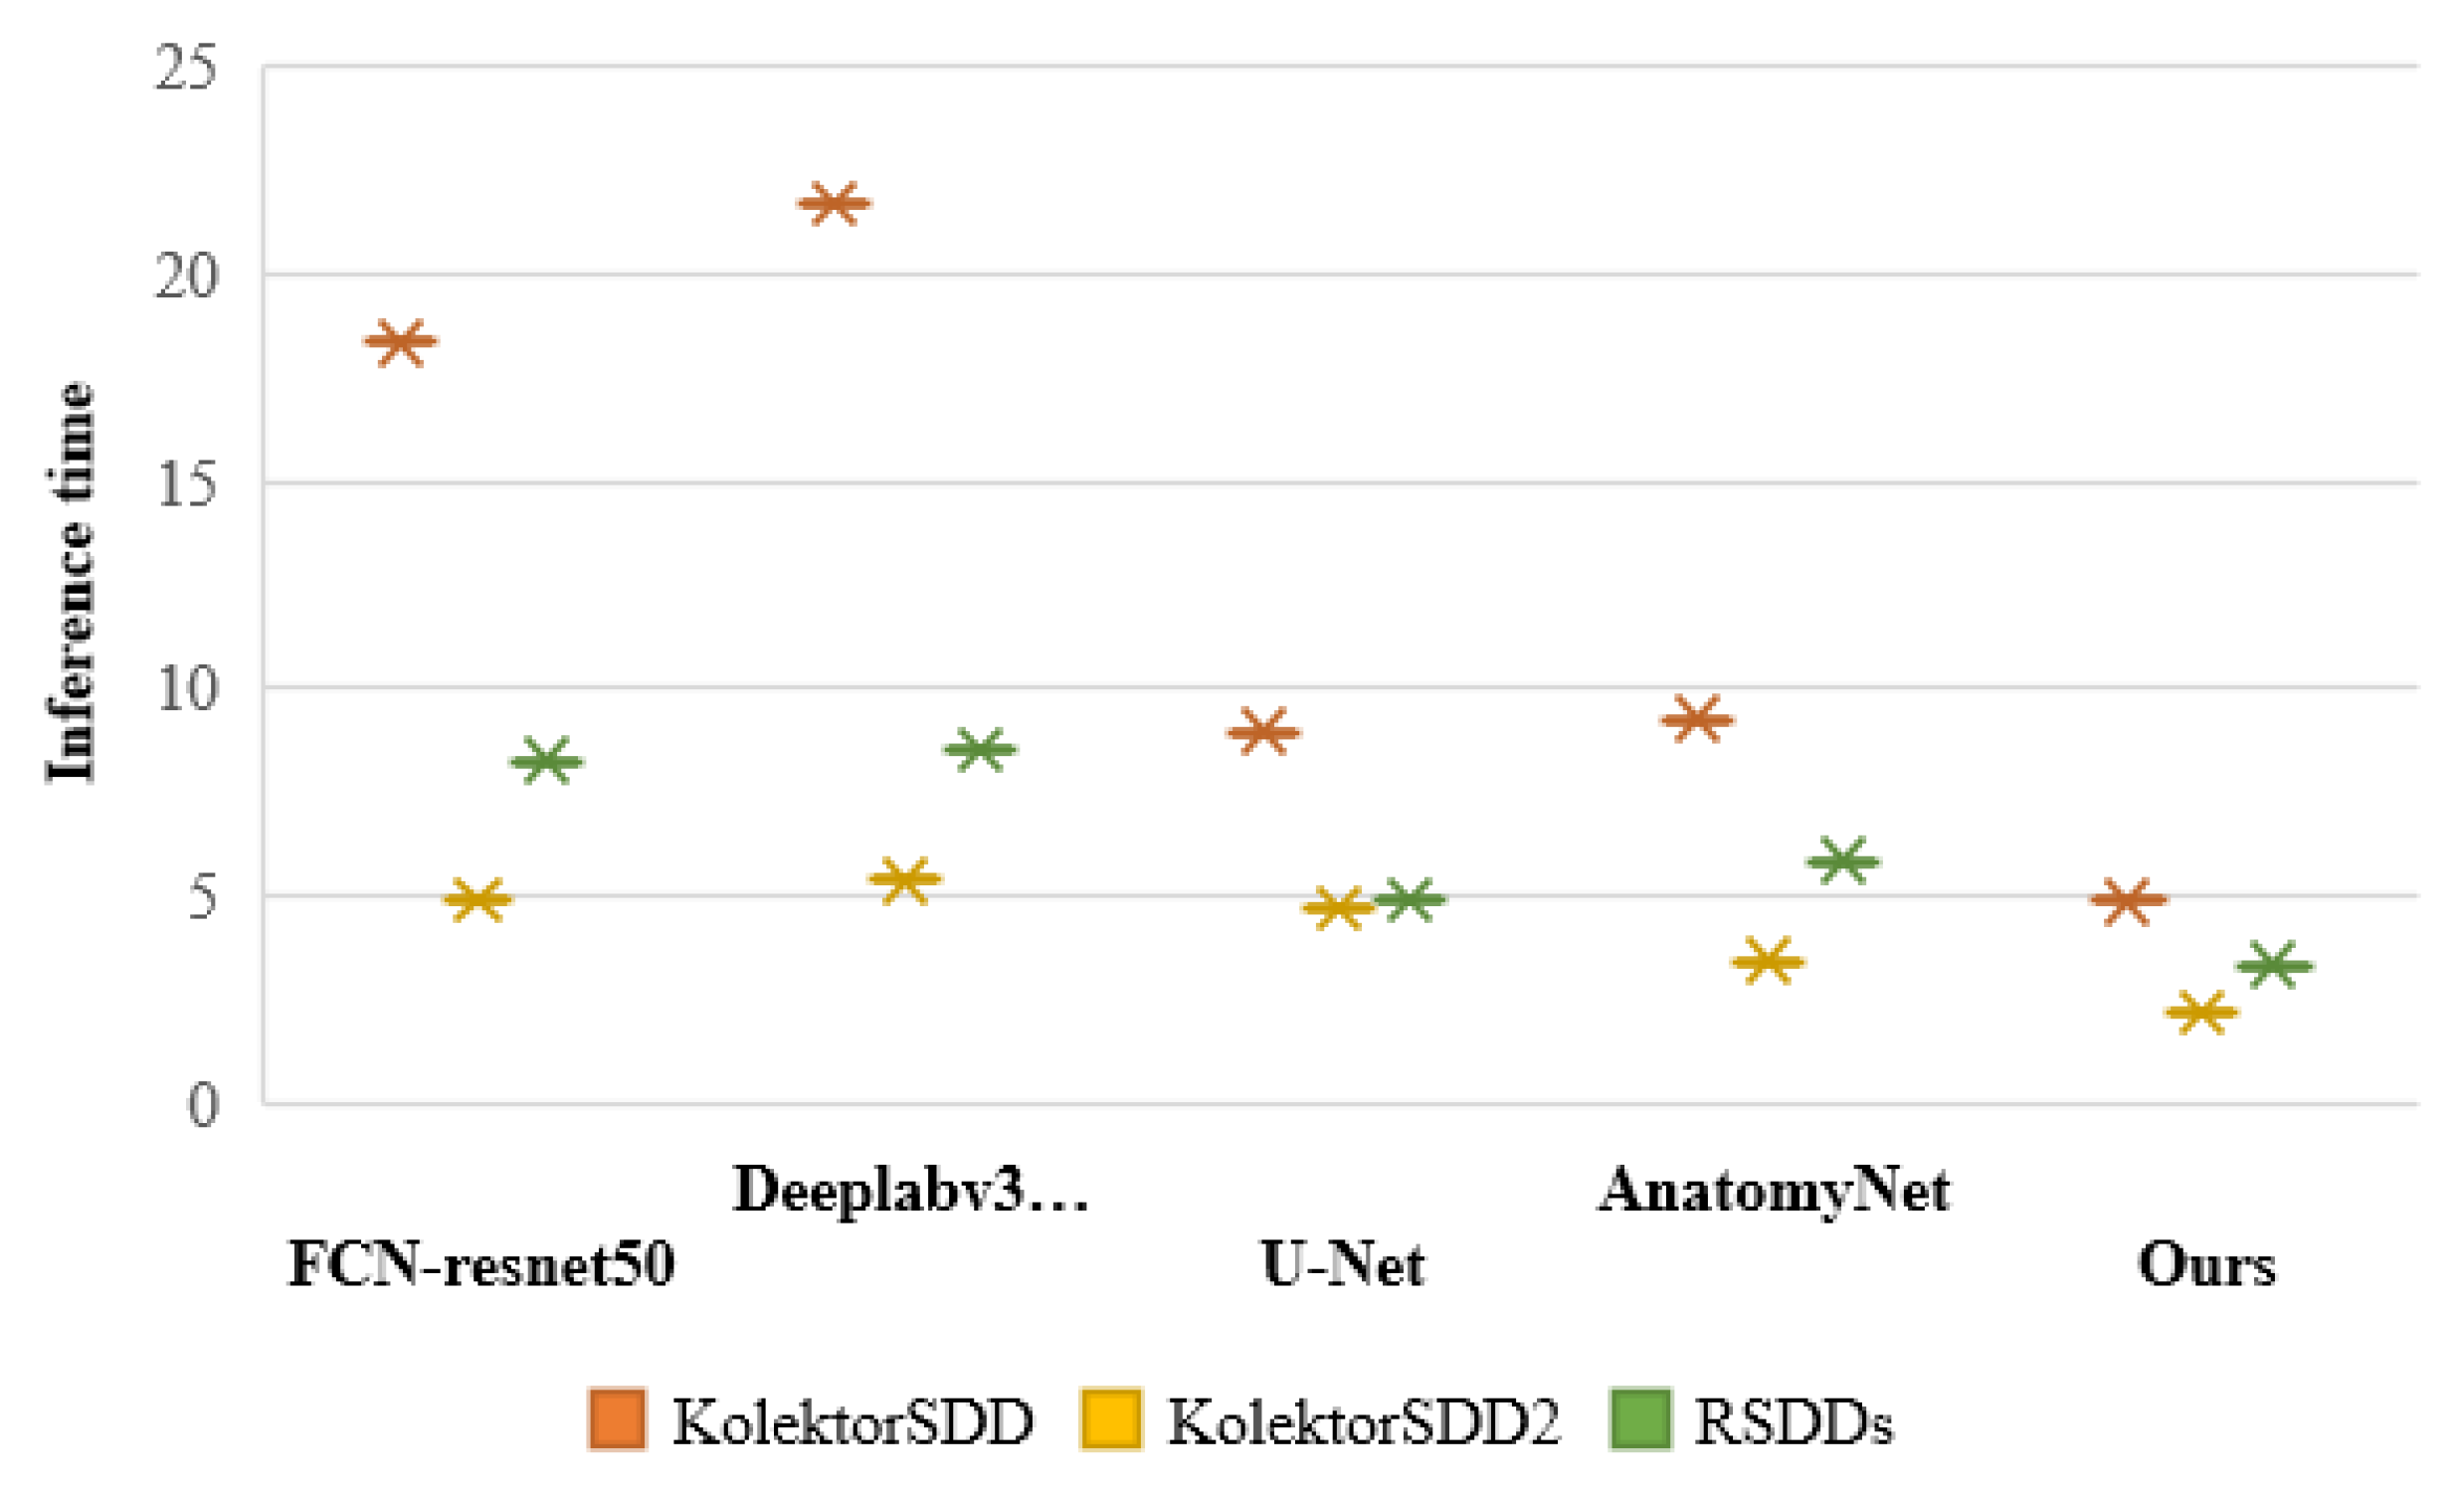
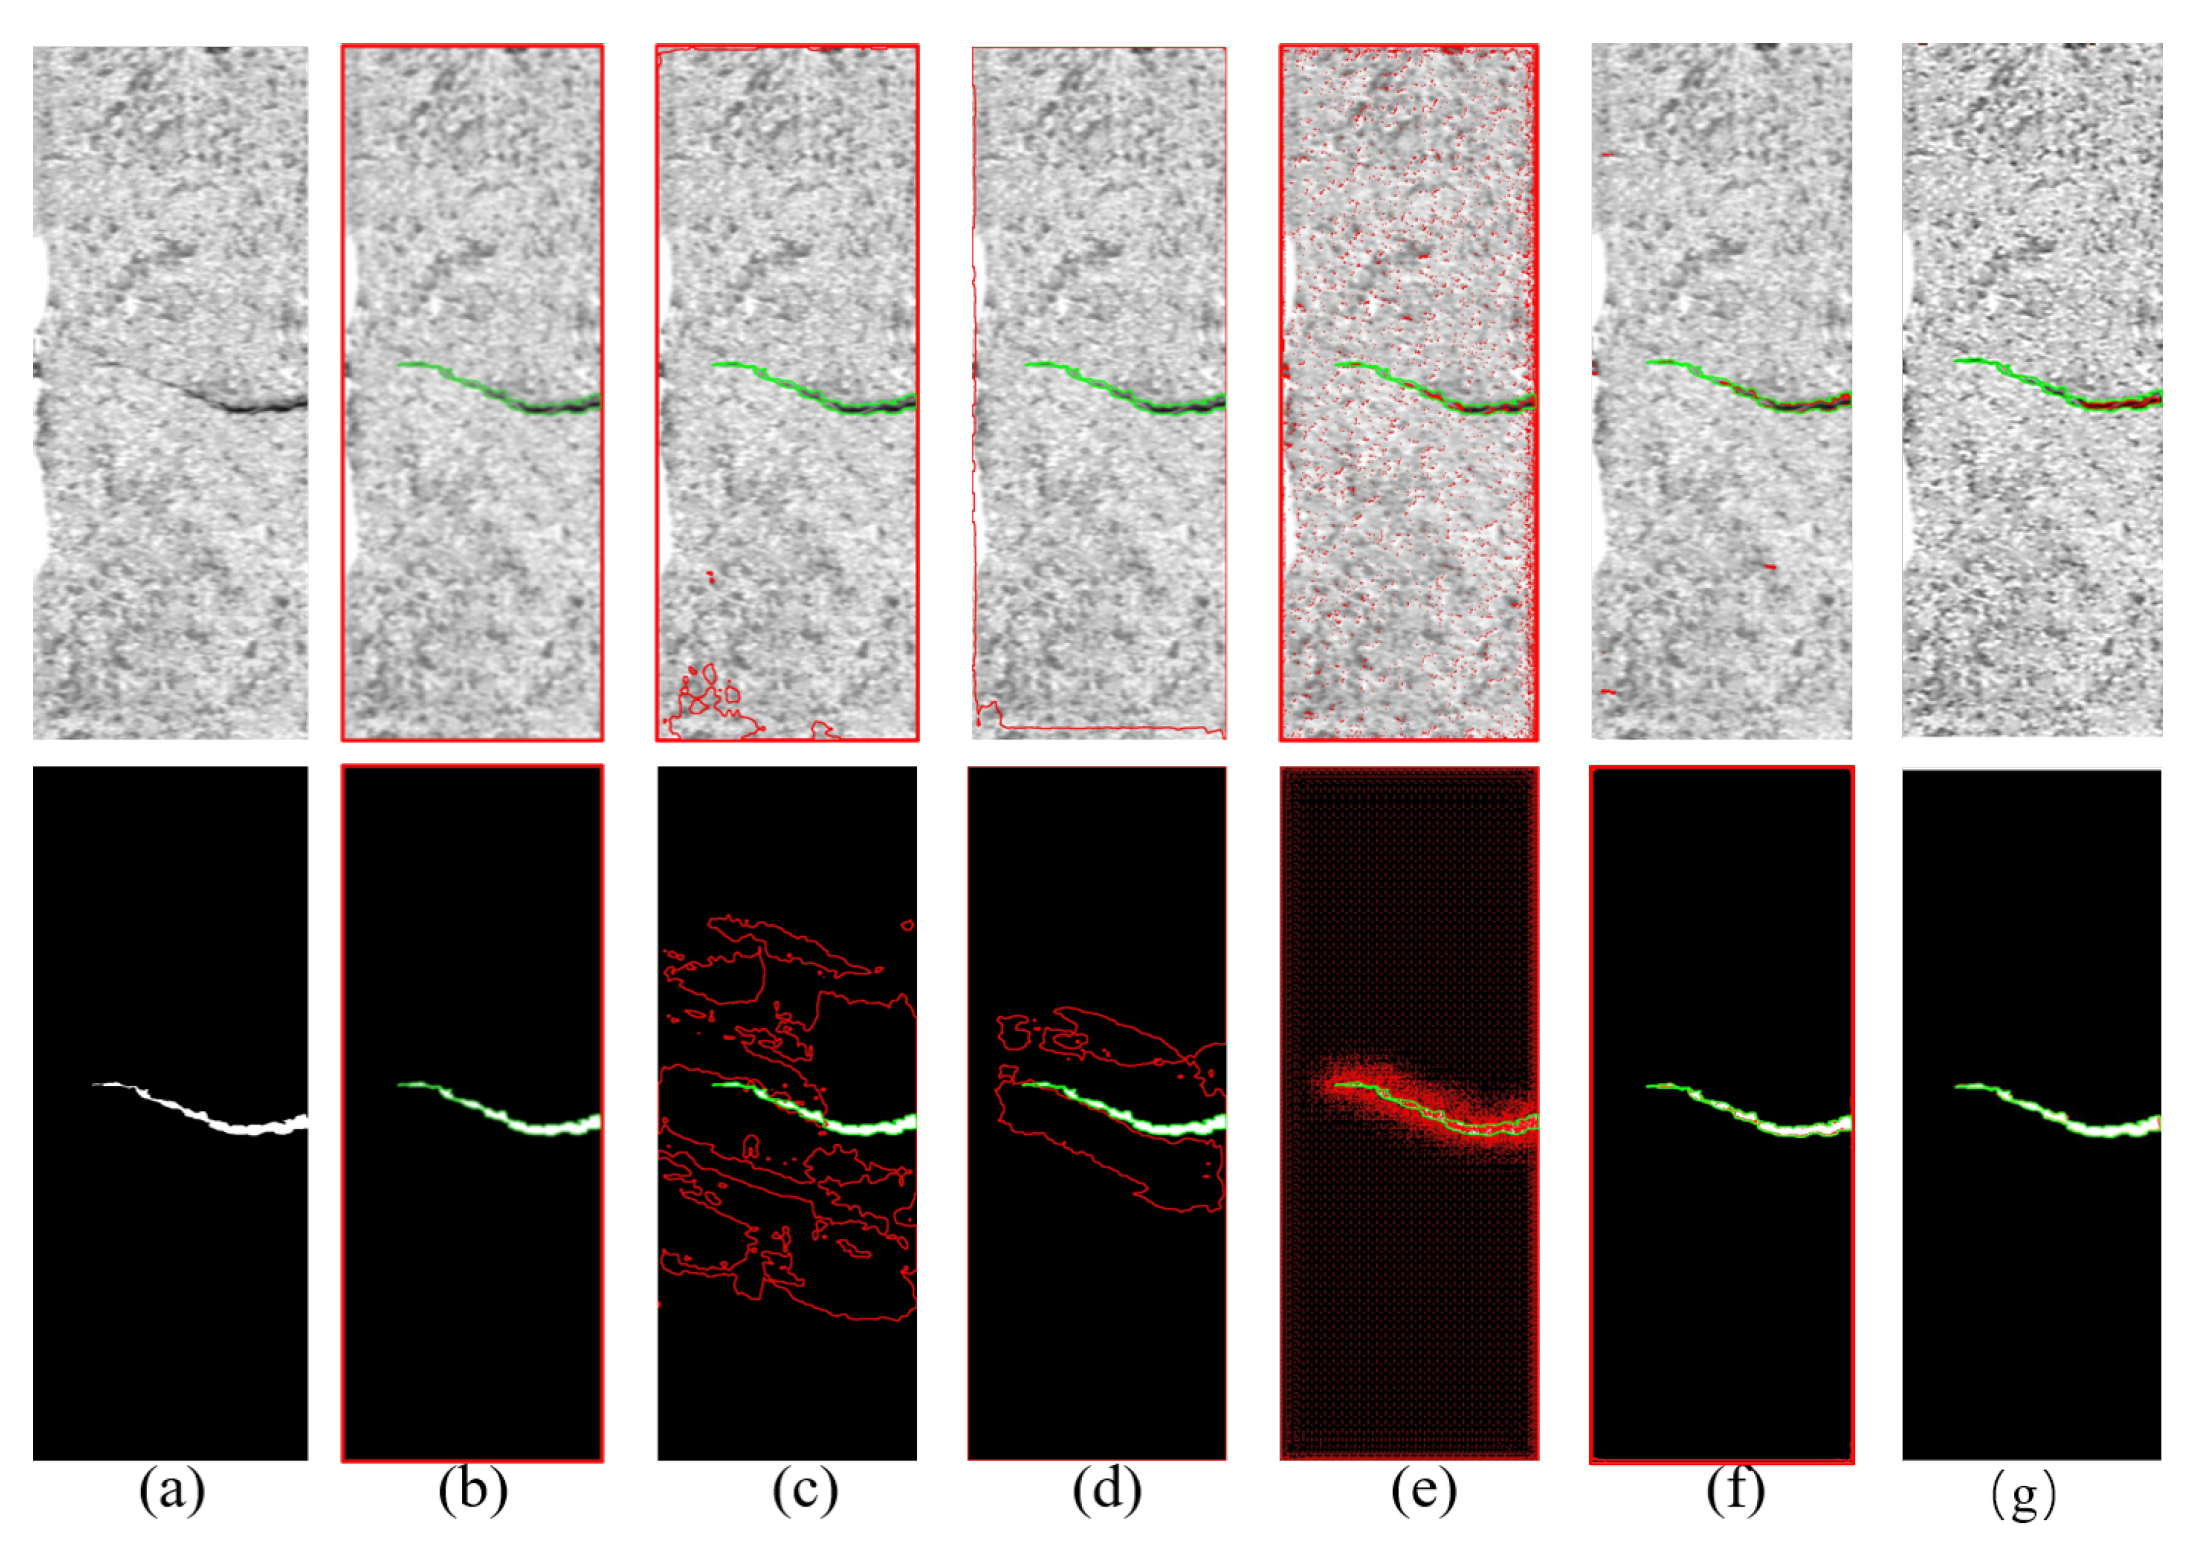
4.2. Comparing to Generic Segmentation Methods

After determining the network architecture and training strategy, we compared the performance with existing segmentation methods. Due to the lack of successful studies on small-defect semantic segmentation applications, we chose generic segmentation benchmarks. We conducted experiments comparing several commonly used segmentation methods and our method in terms of CPU inference time for the KolektorSDD, KolektorSDD2, and RSDD datasets, respectively. Our method performs faster inference than the other methods for a single process operation, as shown in Figure 6. Secondly, we performed experiments comparing the detection effectiveness of several commonly used segmentation methods with our proposed method on three types of datasets, namely KolektorSDD, KolektorSDD2, and RSDDs, respectively. The results are shown in Figure 7, Figure 8 and Figure 9. The original image, the corresponding masked image, and the predicted image are represented in these figures. The results demonstrate that our proposed approach achieves superior performance on all three types of datasets. For rigorous comparison, these models were all trained in the same way and experimentally compared on the KolektorSDD series and RSDDs validation sets, as shown in Table 4.
As a result, the FCN method [44] has the most parameters, and the DeepLab version 3 method [45] requires the largest number of FLOPs. Since AnatomyNet [42] is specifically designed for 3D segmentation, optimal performance on small defect segmentation cannot be expected. In contrast, the model proposed in this paper outperforms most algorithms in the segmentation of small defects and achieves better outcomes in terms of inference speed and segmentation accuracy. AnomalySeg achieves Dice coefficients of 95.2% and 92.9% on the KolektorSDD series of datasets, and 86.5% on the RSDD dataset, outperforming the base work, AnatomyNet, by about 9%, 13%, and 15%, respectively, in small defect segmentation. Ultimately, the segmentation results show that the designed model performs well on crack-like defects but relatively poorly on dot-like defects. As a result, we discussed the poor performance and concluded that small-shaped defects may still fail to capture comprehensive feature information during the feature extraction process, leading to poor detection performance. It is also possible that the defective regions in the detected samples are similar to the non-defective background, which subsequently causes false and missed detections.
Through the validation of our proposed model and approach, we found that the KolektorSDD series dataset has a higher defect detection rate. On the one hand, this dataset captures defect images of electronic commutators. Such products have higher defect requirements in industrial manufacturing environments because reducing the defect rate of this product will decrease the cost of product quality inspection and improve production efficiency. On the other hand, the RSDD series of datasets is mostly collected from objects working in external natural scenes, which have relatively low requirements for defects. However, in real track scenes, the detection difficulty increases. Therefore, our proposed method, in combination with automated equipment, is valuable for detecting rail defects.

5. Conclusions and Future Outlook

Product quality inspection is of great importance in automated industrial manufacturing. In this study, we propose a surface defect detection technique based on fast anomaly segmentation to address the problem of small defects on product surfaces. To tackle the challenge of small defect segmentation, our proposed model is built on an improved U-Net architecture that removes the downsampling layer from the encoder, retaining only the first layer. To improve the defect detection ability of the model, we propose a hybrid residual module (SAFM) that combines spatial attention and a feed-forward neural network instead of the downsampling layer in the encoder to extract features for defects. The spatial attention in the module is superior to the channel attention, which filters out unwanted background information and helps to locate the defect information quickly and accurately. Secondly, dilated convolution is introduced in this module, which can capture multi-scale feature spatial information. In order to solve the problem of severe imbalance in segmentation, a hybrid loss function combining Dice loss and focus loss was designed, enhancing the model’s ability to discriminate between defective regions and defect-free backgrounds. Experimental results show that the model achieves significant results in surface defect recognition. Notably, our model is very lightweight compared to previous techniques, requiring only 2.37M parameters. Overall, this study presents a practical and successful defect detection method for product surface quality inspection.
Our future work can be summarized as follows. (1) Our proposed model is applicable to most other common defect types, which we will continue to detect and validate in our later work. However, the detection model for micro-level defects needs further exploration and will be the focus of our work. (2) According to our investigation and analysis, tiny-level defects appear in many different products with varying quality requirements, posing a significant challenge for the collection and organization of our dataset. (3) Since the area of minor defects in products varies, determining how to obtain more comprehensive information on defect characteristics is also a worthy concern for us. This will be greatly helpful in dealing with minor defects.

Author Contributions

Conceptualization, W.X. and Y.S.; methodology, W.X. and H.L.; software, W.X.; validation, W.X., M.Y. and Q.Z.; investigation, W.X.; resources, H.L.; data curation, W.X.; writing—original draft preparation, W.X.; writing—review and editing, W.X., Y.S., M.Y. and H.L.; visualization, W.X. and H.L.; supervision, Y.S.; project administration, Y.S. and Y.L. All authors have read and agreed to the published version of the manuscript.

Funding

This research was supported by the Jiangsu Ocean University Postgraduate Research and Practice Innovation Program (KYCX202209).

Data Availability Statement

The data generated and/or analyzed during the current study are not publicly available due to legal/ethical reasons but are available from the corresponding author upon reasonable request.

Conflicts of Interest

The authors declare no conflicts of interest.

References

  1. Alvarenga, T.A.; Carvalho, A.L.; Honorio, L.M.; Cerqueira, A.S.; Filho, L.M.; Nobrega, R.A. Detection and classification system for rail surface defects based on Eddy current. Sensors 2021, 21, 7937. [Google Scholar] [CrossRef] [PubMed]
  2. Jia, Y.; Lu, Y.; Xiong, L.; Zhang, Y.; Wang, P.; Zhou, H. A Filtering Method for Suppressing the Lift-Off Interference in Magnetic Flux Leakage Detection of Rail Head Surface Defect. Appl. Sci. 2022, 12, 1740. [Google Scholar] [CrossRef]
  3. Zhang, Y.; Sun, Y.; Wen, Y. An imaging algorithm of planar array capacitance sensor for defect detection. Measurement 2021, 168, 108466. [Google Scholar] [CrossRef]
  4. Wang, X.; Wang, Q.; Zhang, L.; Yu, J.; Liu, Q. Three-Dimensional Defect Characterization of Ultrasonic Detection Based on GCNet Improved Contrast Learning Optimization. Electronics 2023, 12, 3944. [Google Scholar] [CrossRef]
  5. Zhang, D.; Hao, X.; Wang, D.; Qin, C.; Zhao, B.; Liang, L.; Liu, W. An efficient lightweight convolutional neural network for industrial surface defect detection. Artif. Intell. Rev. 2023, 56, 10651–10677. [Google Scholar] [CrossRef]
  6. Guo, B.; Wang, Y.; Zhen, S.; Yu, R.; Su, Z. SPEED: Semantic Prior and Extremely Efficient Dilated Convolution Network for Real-Time Metal Surface Defects Detection. IEEE Trans. Ind. Inform. 2023, 19, 11380–11390. [Google Scholar] [CrossRef]
  7. Liu, R.; Huang, M.; Gao, Z.; Cao, Z.; Cao, P. MSC-DNet: An efficient detector with multi-scale context for defect detection on strip steel surface. Measurement 2023, 209, 112467. [Google Scholar] [CrossRef]
  8. Zhao, W.; Song, K.; Wang, Y.; Liang, S.; Yan, Y. FaNet: Feature-aware Network for Few Shot Classification of Strip Steel Surface Defects. Measurement 2023, 208, 112446. [Google Scholar] [CrossRef]
  9. Zhao, X.; Zhao, J.; He, Z. A Multiple Feature-maps Interaction Pyramid Network for Defect Detection of Steel Surface. Meas. Sci. Technol. 2023, 34, 055401. [Google Scholar] [CrossRef]
  10. Zheng, Z.; Hu, Y.; Zhang, Y.; Yang, H.; Qiao, Y.; Qu, Z.; Huang, Y. Casppnet: A chained atrous spatial pyramid pooling network for steel defect detection. Meas. Sci. Technol. 2022, 33, 085403. [Google Scholar] [CrossRef]
  11. Chouhad, H.; El Mansori, M.; Knoblauch, R.; Corleto, C. Smart data driven defect detection method for surface quality control in manufacturing. Meas. Sci. Technol. 2021, 32, 105403. [Google Scholar] [CrossRef]
  12. Shu, Y.; Li, B.; Lin, H. Quality Safety Monitoring of LED Chips Using Deep Learning-Based Vision Inspection Methods. Measurement 2021, 168, 108123. [Google Scholar] [CrossRef]
  13. Dai, W.; Mujeeb, A.; Erdt, M.; Sourin, A. Soldering Defect Detection in Automatic Optical Inspection. Adv. Eng. Inform. 2020, 43, 101004. [Google Scholar] [CrossRef]
  14. Chow, J.; Su, Z.; Wu, J.; Tan, P.; Mao, X.; Wang, Y. Anomaly Detection of Defects on Concrete Structures with the Convolutional Autoencoder. Adv. Eng. Inform. 2020, 45, 101105. [Google Scholar] [CrossRef]
  15. Chen, J.; Liu, D. Bottom-up Image Detection of Water Channel Slope Damages Based on Superpixel Segmentation and Support Vector Machine. Adv. Eng. Inform. 2021, 47, 101205. [Google Scholar] [CrossRef]
  16. Chen, Q.; Huang, Y.; Sun, H.; Huang, W. Pavement Crack Detection Using Hessian Structure Propagation. Adv. Eng. Inform. 2021, 49, 101303. [Google Scholar] [CrossRef]
  17. Li, D.; Xie, Q.; Gong, X.; Yu, Z.; Xu, J.; Sun, Y.; Wang, J. Automatic Defect Detection of Metro Tunnel Surfaces Using a Vision-Based Inspection System. Adv. Eng. Inform. 2021, 47, 101206. [Google Scholar] [CrossRef]
  18. Yin, X.; Chen, Y.; Bouferguene, A.; Zaman, H.; Al-Hussein, M.; Kurach, L. A Deep Learning-Based Framework for an Automated Defect Detection System for Sewer Pipes. Autom. Constr. 2020, 109, 102967. [Google Scholar] [CrossRef]
  19. Gharesi, N.; Arefi, M.M.; Razavi-Far, R.; Zarei, J.; Yin, S. A Neuro-Wavelet Based Approach for Diagnosing Bearing Defects. Adv. Eng. Inform. 2020, 46, 101172. [Google Scholar] [CrossRef]
  20. Tabernik, D.; Šela, S.; Skvarč, J.; Skočaj, D. Segmentation-Based Deep-Learning Approach for Surface-Defect Detection. J. Intell. Manuf. 2020, 31, 759–776. [Google Scholar] [CrossRef]
  21. Chen, L.C.; Pardeshi, M.S.; Lo, W.T.; Sheu, R.K.; Pai, K.C.; Chen, C.Y.; Tsai, P.Y.; Tsai, Y.T. Edge-glued wooden panel defect detection using deep learning. Wood Sci. Technol. 2022, 56, 477–507. [Google Scholar] [CrossRef]
  22. Kang, G.; Gao, S.; Yu, L.; Zhang, D. Deep Architecture for High-Speed Railway Insulator Surface Defect Detection: Denoising Autoencoder With Multitask Learning. IEEE Trans. Instrum. Meas. 2019, 68, 2679–2690. [Google Scholar] [CrossRef]
  23. Zorić, B.; Matić, T.; Hocenski, Ž. Classification of Biscuit Tiles for Defect Detection Using Fourier Transform Features. ISA Trans. 2022, 125, 400–414. [Google Scholar] [CrossRef] [PubMed]
  24. Jia, L.; Chen, C.; Xu, S.; Shen, J. Fabric Defect Inspection Based on Lattice Segmentation and Template Statistics. Inf. Sci. 2020, 512, 964–984. [Google Scholar] [CrossRef]
  25. Mo, D.; Wong, W.K.; Lai, Z.; Zhou, J. Weighted Double-Low-Rank Decomposition with Application to Fabric Defect Detection. IEEE Trans. Automat. Sci. Eng. 2021, 18, 1170–1190. [Google Scholar] [CrossRef]
  26. Riana, D.; Rahayu, S.; Hasan, M. Comparison of Segmentation and Identification of Swietenia Mahagoni Wood Defects with Augmentation Images. Heliyon 2021, 7, e07417. [Google Scholar] [CrossRef] [PubMed]
  27. Qi, Z.; Ni, P.; Jiang, W.; Qiu, X.; Wang, R.; Zhang, W. Quantitative Detection of Minor Defects in Metal Materials Based on Variation Coefficient of CT Image. Optik 2020, 223, 165269. [Google Scholar] [CrossRef]
  28. Krizhevsky, A.; Sutskever, I.; Hinton, G.E. ImageNet Classification with Deep Convolutional Neural Networks. Commun. ACM 2017, 60, 84–90. [Google Scholar] [CrossRef]
  29. Wang, Y.; Liu, M.; Zheng, P.; Yang, H.; Zou, J. A Smart Surface Inspection System Using Faster R-CNN in Cloud-Edge Computing Environment. Adv. Eng. Inform. 2020, 43, 101037. [Google Scholar] [CrossRef]
  30. He, Y.; Song, K.; Meng, Q.; Yan, Y. An End-to-End Steel Surface Defect Detection Approach via Fusing Multiple Hierarchical Features. IEEE Trans. Instrum. Meas. 2020, 69, 1493–1504. [Google Scholar] [CrossRef]
  31. Du, W.; Shen, H.; Fu, J.; Zhang, G.; He, Q. Approaches for Improvement of the X-ray Image Defect Detection of Automobile Casting Aluminum Parts Based on Deep Learning. NDT E Int. 2019, 107, 102144. [Google Scholar] [CrossRef]
  32. Li, Y.; Zhang, D.; Lee, D.J. Automatic Fabric Defect Detection with a Wide-and-Compact Network. Neurocomputing 2019, 329, 329–338. [Google Scholar] [CrossRef]
  33. Zhou, T.; Zhang, J.; Su, H.; Zou, W.; Zhang, B. EDDs: A Series of Efficient Defect Detectors for Fabric Quality Inspection. Measurement 2021, 172, 108885. [Google Scholar] [CrossRef]
  34. Li, Y.; Huang, H.; Xie, Q.; Yao, L.; Chen, Q. Research on a Surface Defect Detection Algorithm Based on MobileNet-SSD. Appl. Sci. 2018, 8, 1678. [Google Scholar] [CrossRef]
  35. Chen, S.H.; Tsai, C.C. SMD LED Chips Defect Detection Using a YOLOv3-dense Model. Adv. Eng. Inform. 2021, 47, 101255. [Google Scholar] [CrossRef]
  36. Ho, C.C.; Hernandez, M.A.B.; Chen, Y.F.; Lin, C.J.; Chen, C.S. Deep residual neural network-based defect detection on complex backgrounds. IEEE Trans. Instrum. Meas. 2022, 71, 1–10. [Google Scholar] [CrossRef]
  37. Yang, L.; Fan, J.; Huo, B.; Li, E.; Liu, Y. A nondestructive automatic defect detection method with pixelwise segmentation. Knowl.-Based Syst. 2022, 242, 108338. [Google Scholar] [CrossRef]
  38. Tao, X.; Zhang, D.; Ma, W.; Liu, X.; Xu, D. Automatic Metallic Surface Defect Detection and Recognition with Convolutional Neural Networks. Appl. Sci. 2018, 8, 1575. [Google Scholar] [CrossRef]
  39. Mei, S.; Yang, H.; Yin, Z. An Unsupervised-Learning-Based Approach for Automated Defect Inspection on Textured Surfaces. IEEE Trans. Instrum. Meas. 2018, 67, 1266–1277. [Google Scholar] [CrossRef]
  40. Li, X.; Zheng, Y.; Chen, B.; Zheng, E. Dual Attention-Based Industrial Surface Defect Detection with Consistency Loss. Sensors 2022, 22, 5141. [Google Scholar] [CrossRef]
  41. Božič, J.; Tabernik, D.; Skočaj, D. Mixed supervision for surface-defect detection: From weakly to fully supervised learning. Comput. Ind. 2021, 129, 103459. [Google Scholar] [CrossRef]
  42. Zhu, W.; Huang, Y.; Zeng, L.; Chen, X.; Liu, Y.; Qian, Z.; Du, N.; Fan, W.; Xie, X. AnatomyNet: Deep Learning for Fast and Fully Automated Whole-volume Segmentation of Head and Neck Anatomy. Med. Phys. 2019, 46, 576–589. [Google Scholar] [CrossRef] [PubMed]
  43. Khanam, S.; Ahmedy, I.; Idris, M.Y.I.; Jaward, M.H. Towards an Effective Intrusion Detection Model Using Focal Loss Variational Autoencoder for Internet of Things (IoT). Sensors 2022, 22, 5822. [Google Scholar] [CrossRef] [PubMed]
  44. Fan, J.; Hua, Q.; Li, X.; Wen, Z.; Yang, M. Biomedical sensor image segmentation algorithm based on improved fully convolutional network. Measurement 2022, 197, 111307. [Google Scholar] [CrossRef]
  45. Zhang, X.; Bian, H.; Cai, Y.; Zhang, K.; Li, H. An improved tongue image segmentation algorithm based on Deeplabv3+ framework. IET Image Process. 2022, 16, 1473–1485. [Google Scholar] [CrossRef]
Figure 1. Several samples from the KolektorSDD and KolektorSDD2 datasets, showcasing defect visual images, with their masks on the top and defect-free images on the bottom.
Electronics 13 00284 g001
Figure 2. Several samples of the RSDD dataset, including defect images and their masks.
Electronics 13 00284 g002
Figure 3. Network architecture of the segmentation detector proposed for the anomaly detection.
Electronics 13 00284 g003
Figure 4. Structural framework diagram of two types of residual blocks; (a) indicates the SAFM residual module with a dilation of 1, (b) indicates the SAFM residual module with a dilation of 3.
Electronics 13 00284 g004
Figure 5. Structural framework diagram of the spatial attention feed-forward module (SAFM).
Electronics 13 00284 g005
Figure 6. Inference time of generic segmentation methods on CPU for three types of datasets.
Electronics 13 00284 g006
Figure 7. Detection results of the six network models under the KolektorSDD dataset. Columns from left to right are represented by (a). Original image; (b). Lraspp-mobilenetV3; (c). Deeplabv3-resnet50; (d). Fcn-resnet50; (e). U-Net; (f). AnatomyNet; (g). Our proposed approach. Each row represents one sample image. Red denotes the predictions. Green represents the ground truths.
Electronics 13 00284 g007
Figure 8. Detection results of the six network models under the KolektorSDD2 dataset. Columns from left to right are represented by (a). Original image; (b). Lraspp-mobilenetV3; (c). Deeplabv3-resnet50; (d). Fcn-resnet50; (e). U-Net; (f). AnatomyNet; (g). Our proposed approach. Each row represents one sample image. Red denotes the predictions. Green represents the ground truths.
Electronics 13 00284 g008
Figure 9. Detection results of the six network models under the RSDD dataset. Columns from left to right are represented by (a). Original; (b). Lraspp-mobilenetV3; (c). Deeplabv3-resnet50; (d). Fcn-resnet50; (e). U-Net; (f). AnatomyNet; (g). Our proposed approach, which covers the original and masked images in each method. Each row represents one sample image. Red denotes the predictions. Green represents the ground truths.
Electronics 13 00284 g009
Table 1. The results of the Kolektor datasets by utilizing UNet and our proposed method.
Loss FunctionsMethodsKolektor
DSC (%)IOU (%)
Dice lossUNet78.277.9
Anomalyseg84.583.7
Focal lossUNet71.570.9
Anomalyseg88.587.5
Dice + FocalUNet75.473.5
Anomalyseg95.289.6
Table 2. Hardware and software configuration information.
NameConfiguration Information
Operation systemUbuntu 18.04
CPUIntel CORE i5 8th Gen
GPUNVIDIA GeForce RTX 2080 Ti 11G
LanguagePython 3.7
Deep learning frameworkPyTorch 1.11.0
Table 3. Comparison of several metrics for different residual module network structures.
MethodIoU (%)DSC (%)
KolektorRSDDsKolektorRSDDs
Res UNet57.952.586.377.2
SE Res UNet61.853.888.982.6
CBAM Res UNet62.753.489.781.6
SAFM Res UNet68.466.295.286.5
Table 4. Performance comparisons with generic segmentation methods, showing the DSC on validation sets.
MethodParameters (M)FLOPs (G)DSC(%)
KolektorSDDKolektorSDD2RSDDs
FCNResNet5032.9538.5733.231.560.1
DeepLabv3ResNet5010.01182.7757.753.154.6
UNet4.178.0256.254.842.3
UNet++9.1617.3569.362.260.6
AttenUnet34.8830.2372.569.558.4
AnatomyNet0.60211.2886.380.472.9
AnomalySeg2.3742.3595.292.986.5
Disclaimer/Publisher’s Note: The statements, opinions and data contained in all publications are solely those of the individual author(s) and contributor(s) and not of MDPI and/or the editor(s). MDPI and/or the editor(s) disclaim responsibility for any injury to people or property resulting from any ideas, methods, instructions or products referred to in the content.

