Article

Research on a Multi-Channel High-Speed Interferometric Signal Acquisition System

1
State Key Laboratory of Infrared Physics, Shanghai Institute of Technical Physics, Chinese Academy of Sciences, Shanghai 200083, China
2
College of Information Engineering, Shanghai Maritime University, Shanghai 201306, China
3
Joint Lab of Calibration and Metrology Technology of Infrared Remote Sensing, Shanghai Institute of Technical Physics, Shanghai 200083, China
4
Key Laboratory of Polar Materials and Devices (MOE), Department of Electronics, East China Normal University, Shanghai 200241, China
*
Authors to whom correspondence should be addressed.
These authors contributed equally to this work.
Electronics 2024, 13(2), 370; https://doi.org/10.3390/electronics13020370
Submission received: 5 December 2023 / Revised: 1 January 2024 / Accepted: 8 January 2024 / Published: 16 January 2024
(This article belongs to the Section Circuit and Signal Processing)

Abstract

:
In order to capture the large-scale interferometric signal generated by the space-borne interferometric infrared Fourier spectrometer (IRIFS) in real time, and overcome the limitations of insufficient sampling rate, transmission rate, and significant signal noise in current equipment, a multi-channel high-speed acquisition system for large-scale interferometric signals is designed. A high-performance analog-to-digital converter (ADC) oversampling scheme is designed, which can realize up to 8 synchronous acquisition channels and has a maximum sampling rate of 125 Msps/Ch to ensure the acquisition of interferometric signals. The scheme of jesd204b inter-board transmission and optical fiber terminal transmission is designed. The inter-board transmission rate is 12.5 Gbps, and the terminal transmission rate is 10 GB/s to ensure high-speed data transmission. A hardware filter is designed to realize spatial noise processing of interference signals and ensure the accuracy of acquisition results. The dynamic performance of the data acquisition (DAQ) card is analyzed using discrete Fourier transform in the frequency domain. The spurious free dynamic range (SFDR) is 84 dB, the signal-to-noise ratio (SNR) is 72.7 dB, and the cross-talk is −81.6 dB, which verifies the dynamic stability of the DAQ card. Finally, the infrared radiation in real space is measured. The average Δ N E S R of long wave reaches 48 mW m 2 sr 1 , and the average Δ N E S R of medium wave reaches 12.3 mW m 2 sr 1 , which verifies the reliability of the system performance. The system is of great significance for large-scale infrared interferometric signal acquisition, and has strong practical application value in multi-channel synchronization, real-time high-speed acquisition, and high-speed data transmission.

1. Introduction

The Geostationary Interferometric Infrared Sounder (GIIRS) is a precise remote sensing instrument that uses infrared hyper-spectral interferometric spectroscopy to detect the vertical structure of the atmosphere in the geostationary orbit [1]. By collecting infrared interferometric signals, the vertical distribution information of atmospheric parameters such as temperature and humidity can be obtained, and then more accurate meteorological and environmental monitoring data can be provided for numerical weather prediction [2,3]. At present, GIIRS has been successfully applied to China’s FY-4 series meteorological satellites, and it is the first IRIFS in the world to operate in a stationary orbit. Numerical weather prediction (NWP) plays an important role in disaster warning and climate research [4]. It can provide early warning information of impending extreme weather events (such as storms, floods, etc.), helping to accurately assess risks and take appropriate preventive and protective measures [5,6,7,8]. Since numerical weather prediction is based on large-scale infrared observation data for prediction, the high-speed acquisition of large-scale infrared observation data has been a focus among researchers in this field.
In the United States and Europe, the research and development of the space-borne IRIFS has attracted increasing attention. At present, there are many representative projects, such as the Transorbital Infrared Sounder (CrIS) [9,10], the Geostationary Imaging Fourier Transform Spectrometer (GIFTS) [11], the Infrared Atmospheric Sounding Interferometer (IASI) [12,13], and the Third-Generation Infrared Sounder (MTG-IRS) [14]. The applications of these projects mainly focus on weather prediction, numerical weather prediction model improvement, severe weather monitoring, etc. They provide important hyper-spectral infrared observation data for meteorology and meteorological prediction.
The high-speed interferometric signal acquisition system is an indispensable part of the IRIFS, and its system design and noise optimization scheme have always been concerned by relevant researchers. In 2012, Bekker et al. designed a pan-Fourier transform spectrometer for the Geosynchronous Coastal and Air Pollution Event (GEO-CAPE) mission, but the acquisition system can only achieve single-channel data acquisition at a sampling rate of 100 MSPS [15]. In 2013, Tamas-Selicean et al. proposed a partitioned Fourier spectrometer design to reduce the complexity of development, validation, and integration. However, due to the limited computing resources, applications dealing with spectrum acquisition and processing may produce competition for computing resources [16]. In 2015, Yiu et al. introduced CIRIS (Combinatorial Infrared Interferometer Spectrometer). Due to the limited performance of the selected InGaAs detector, CIRIS can only produce about 10 interferometers per second, which cannot meet the needs of large-scale observation data for NWP [17]. In 2018, Gao et al. quantitatively analyzed the effect of noise on NESR (noise-equivalent spectral radiance) in the interferometric signal collected by the focal plane array (FPA) Fourier spectrometer through mathematical calculation, and introduced the correction algorithm to solve these problems, but did not optimize the noise from the noise source [18]. In 2022, Shen et al. proposed an improved weighted adaptive Kalman filter (WAKF) to reduce the noise of multiple measurements per pixel for the interference signal of a large FPA in a long-wave infrared Fourier spectrometer. However, although the noise of interference data after WAKF processing is reduced, the information in the interferogram may be lost [19].
The design scheme of IRIFS acquisition system proposed above is limited by the development level of electronic devices at that time, and can not meet the current demand for large-scale infrared observation data for NWP. The above optimization schemes for noise in infrared interference data rely more on algorithm processing and digital filtering, and do not optimize noise from the hardware level.
Due to the inadequacy of the current design scheme for IRIFS acquisition system in meeting the requirements of large-scale infrared interferometric signal acquisition, this paper proposes a multi-channel high-speed interferometric signal acquisition system for medium-wave and long-wave infrared radiation. The IRIFS acquisition system is designed to address the aforementioned issues in the research literature. The first aspect involves designing a multi-channel data acquisition card with a resolution of 16 bits, 8 synchronous acquisition channels, and a maximum sampling rate of 125 Msps/Ch in order to achieve high-speed acquisition. The second aspect involves the design of a hardware filter to address the issue of interferometric signals being influenced by spatial noise and other external factors. The third aspect focuses on the design of jesd204b and optical fiber transmission scheme, aiming to achieve high-speed transmission of large-scale data. The dynamic performance analysis of the DAQ card is concurrently conducted to ensure the dynamic stability of the large-scale interference signal acquisition system. Subsequently, measurements are taken in real space to ascertain the reliability of system performance for medium-wave and long-wave infrared radiation. This study represents a preliminary endeavor by our team aimed at meeting the requirements of space-borne IRIFS (such as FY-3 and FY-4 IRIFS) for high-speed acquisition of extensive infrared observation data.

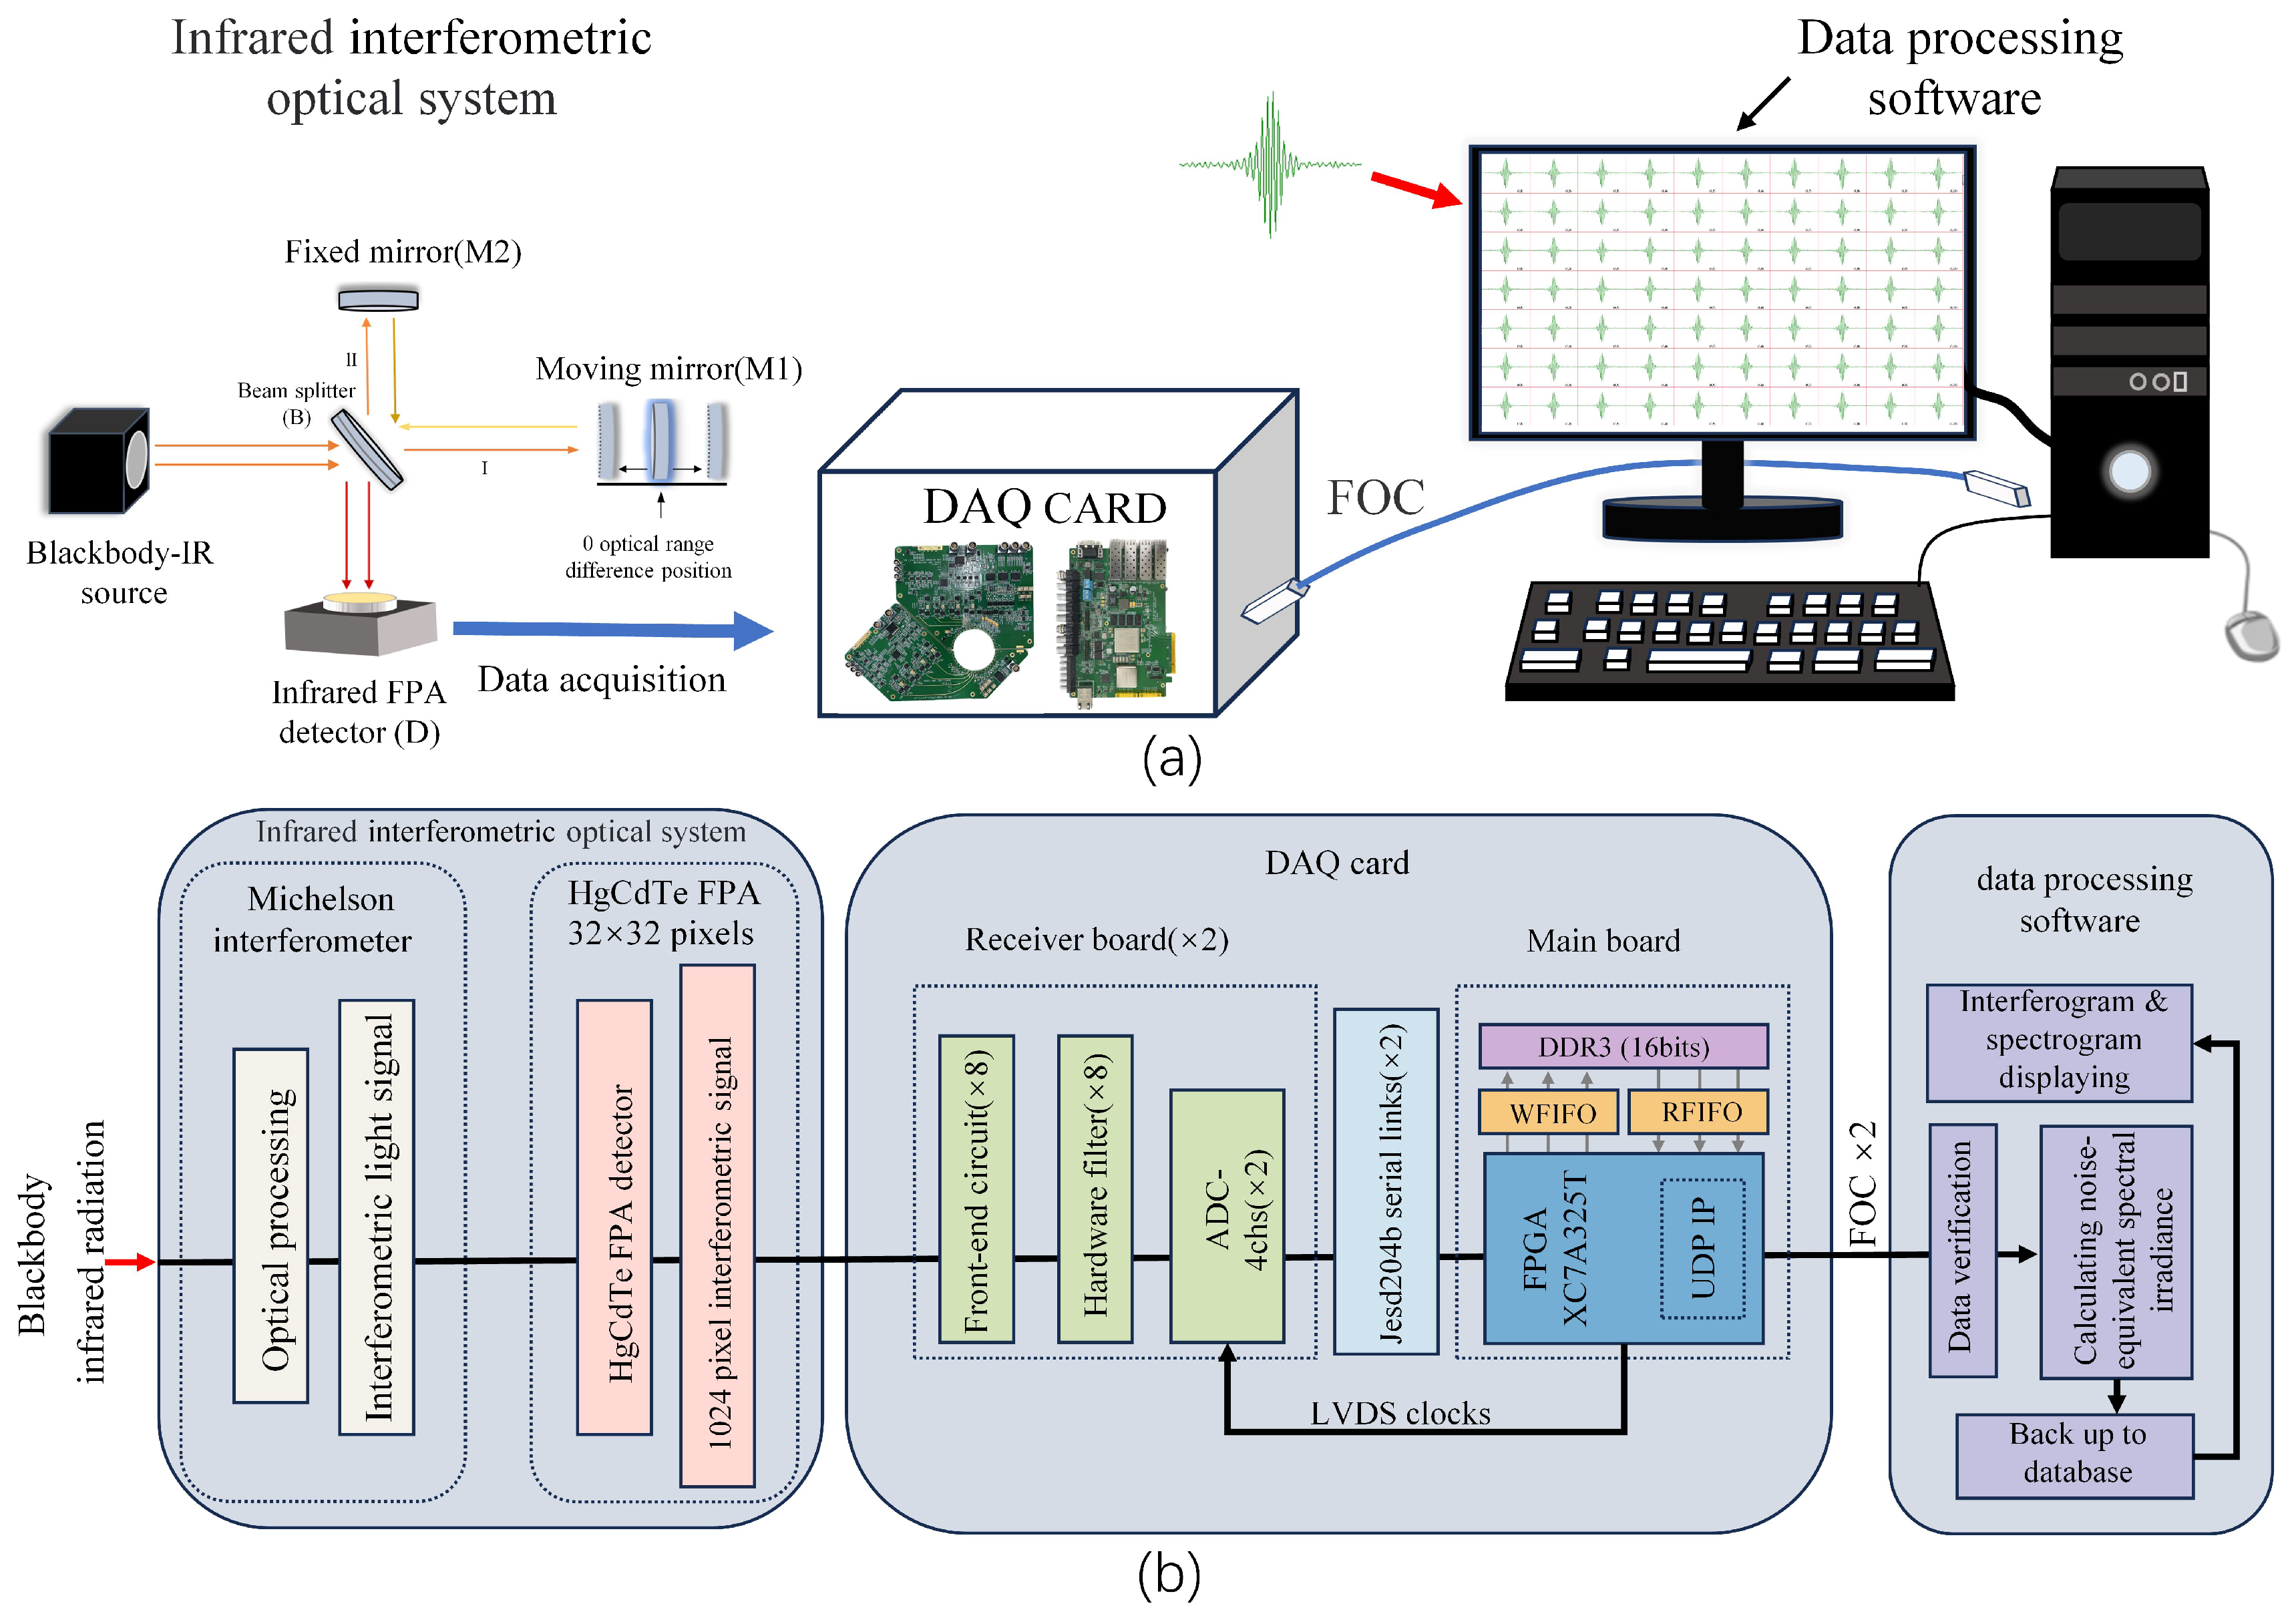
2. IRIFS Acquisition System

The IRIFS acquisition system is mainly composed of an infrared interferometric optical system, a multi-channel high-speed DAQ card, and upper computer software. The system structure is shown in Figure 1. The blackbody is a basic model for the study of thermal radiation, which is used to simulate the infrared radiation received by the spectrometer in the meteorological satellite. The infrared interferometric optical system is mainly composed of Michelson interferometer and mercury cadmium telluride (HgCdTe) infrared focal plane (FPA) detector. The infrared radiation information is converted into infrared interferometric light signal by Michelson interferometer, which is converted into eight parallel output step wave signals by a 32 × 32 pixel infrared FPA detector. The step wave signal is acquired through a multi-channel high-speed DAQ card. The DAQ card consists of two high performance receiving boards and a main board. The communication protocol between the receiving boards and the main board is jesd204b protocol. There is a 16-bit differential ADC with 4-channel synchronous sampling on each receiver board, which can realize high-speed parallel data acquisition of 8 (4 × 2) channels and the maximum sampling rate of 125 Msps/Ch. The motherboard receives data through the jesd204b protocol and pre-processes the data. Finally, the main board interacts with the upper computer through fiber optical communications (FOC). At the same time, in the upper computer software, the CUDA programming architecture is used to parallelize the Fourier transform algorithm for the acquired interferometric signal, and the spectral information is obtained to realize the acquisition of a large-scale interferometric signal.

2.1. Infrared Interferometric Optical System

The IRIFS acquisition system is used to obtain infrared radiation information in the atmosphere, and the acquisition system requires a Michelson interferometer to convert infrared radiation into an interferometric light signal [20]. The principle of the moving-mirror time-modulated Michelson interferometer is shown in Figure 1a. It consists of two plane mirrors (moving mirror M1 and fixed mirror M2) at a 90 degree angle to each other and beam splitter B (B and M1, M2 at a 45 degree angle). The plane mirror M1 can move back and forth in uniform speed along the direction of the arrow, while M2 is a fixed mirror and cannot be moved. Beam splitter B divides the light emitted from the light source into two equal beams, I and I I , through refraction and reflection. When the two beams reach the detector convergence, the optical path difference changes periodically as the moving mirror M1 moves back and forth. Based on the principle of interferometric light, the interferometric signal with light intensity change in the form of cosine will be obtained at detector D [21].
Infrared detector is an important part of IRIFS, the quality of the detector directly affects the performance of the instrument. The FPA detector used in IRIFS needs to have a high response rate (more than 10 kHz); additionally, it needs a high-speed real-time response ability in responding to high-frequency external trigger signals and high dynamic range outputs—this is not available in conventional infrared FPA detectors. The HgCdTe detector is a typical ternary alloy detector, and future development trends will involve development in the direction of a large-area array detector. The FPA detector has an external trigger sampling mechanism, a high response ability, and high dynamic range output, which can meet the requirements of the IRIFS acquisition system.
In this paper, the HgCdTe FPA detector with 32 × 32 pixels developed by the Shanghai Institute of Technical Physics is used in the IRIFS acquisition system to detect medium-wave and long-wave infrared radiation, respectively [22]. The detector adopts a readout circuit structure so that multiple detector units output from the same output channel, and the order of output is controlled by the readout clock. The number of output ports can be determined according to the number of internal detectors and external application requirements. This design uses a readout structure with 8 output ports, as shown in Figure 2; the total number of internal detection units is 32 × 32, so the output of the detector signal needs 128 consecutive occurrences—that is, through 128 consecutive clock controls, the output signal comprises 8 channels with 128 pixel step waves.

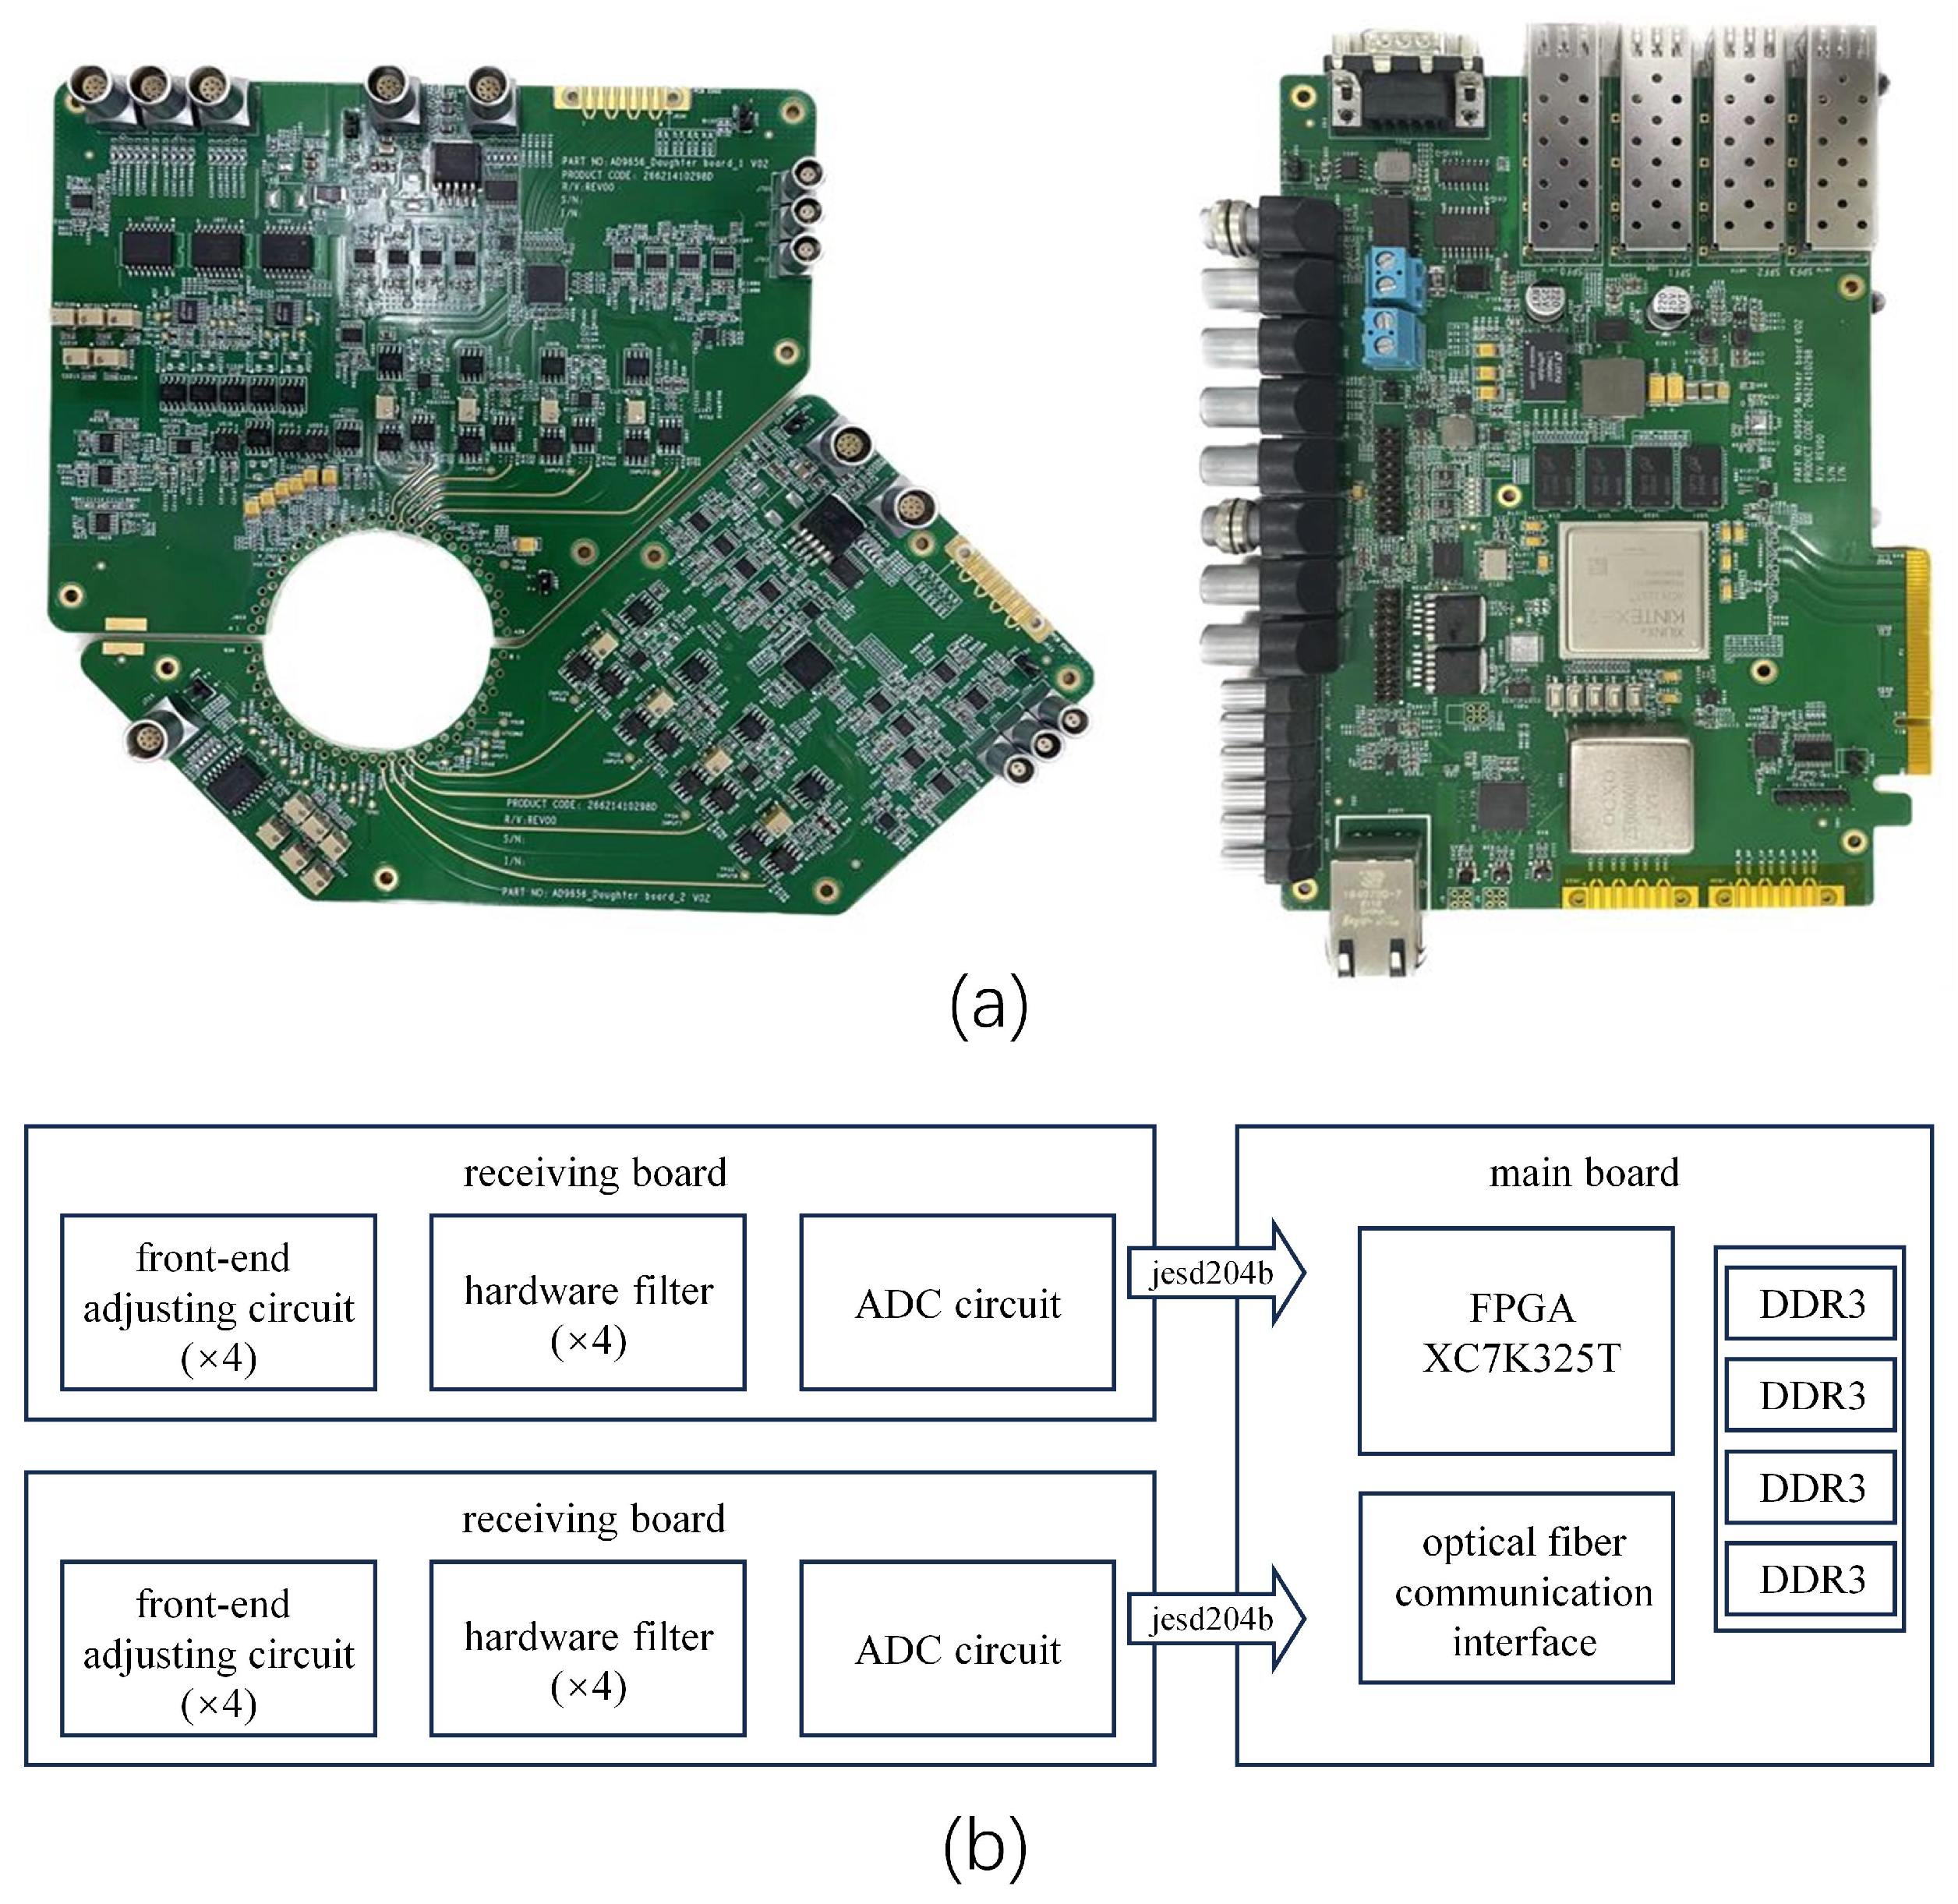
2.2. Multi-Channel High-Speed Daq Card

The design concept of the multi-channel DAQ card is modular structure, which is composed of two receiving boards and a main board. Each receiving board is composed of a front-end adjusting circuit, a high order Butterworth hardware filter, a 4-channel synchronous sampling differential ADC, and jesd204b high-speed connector. The physical diagram and structure block diagram of the acquisition card are shown in Figure 3; these can realize 8-channel large-scale interferometric signal acquisitions and high-speed transmissions. The main board is composed of a jesd204b high-speed interface, a DDR3, an optical fiber communication interface, and an XC7K325T FPGA master controller released by the Xilinx company.

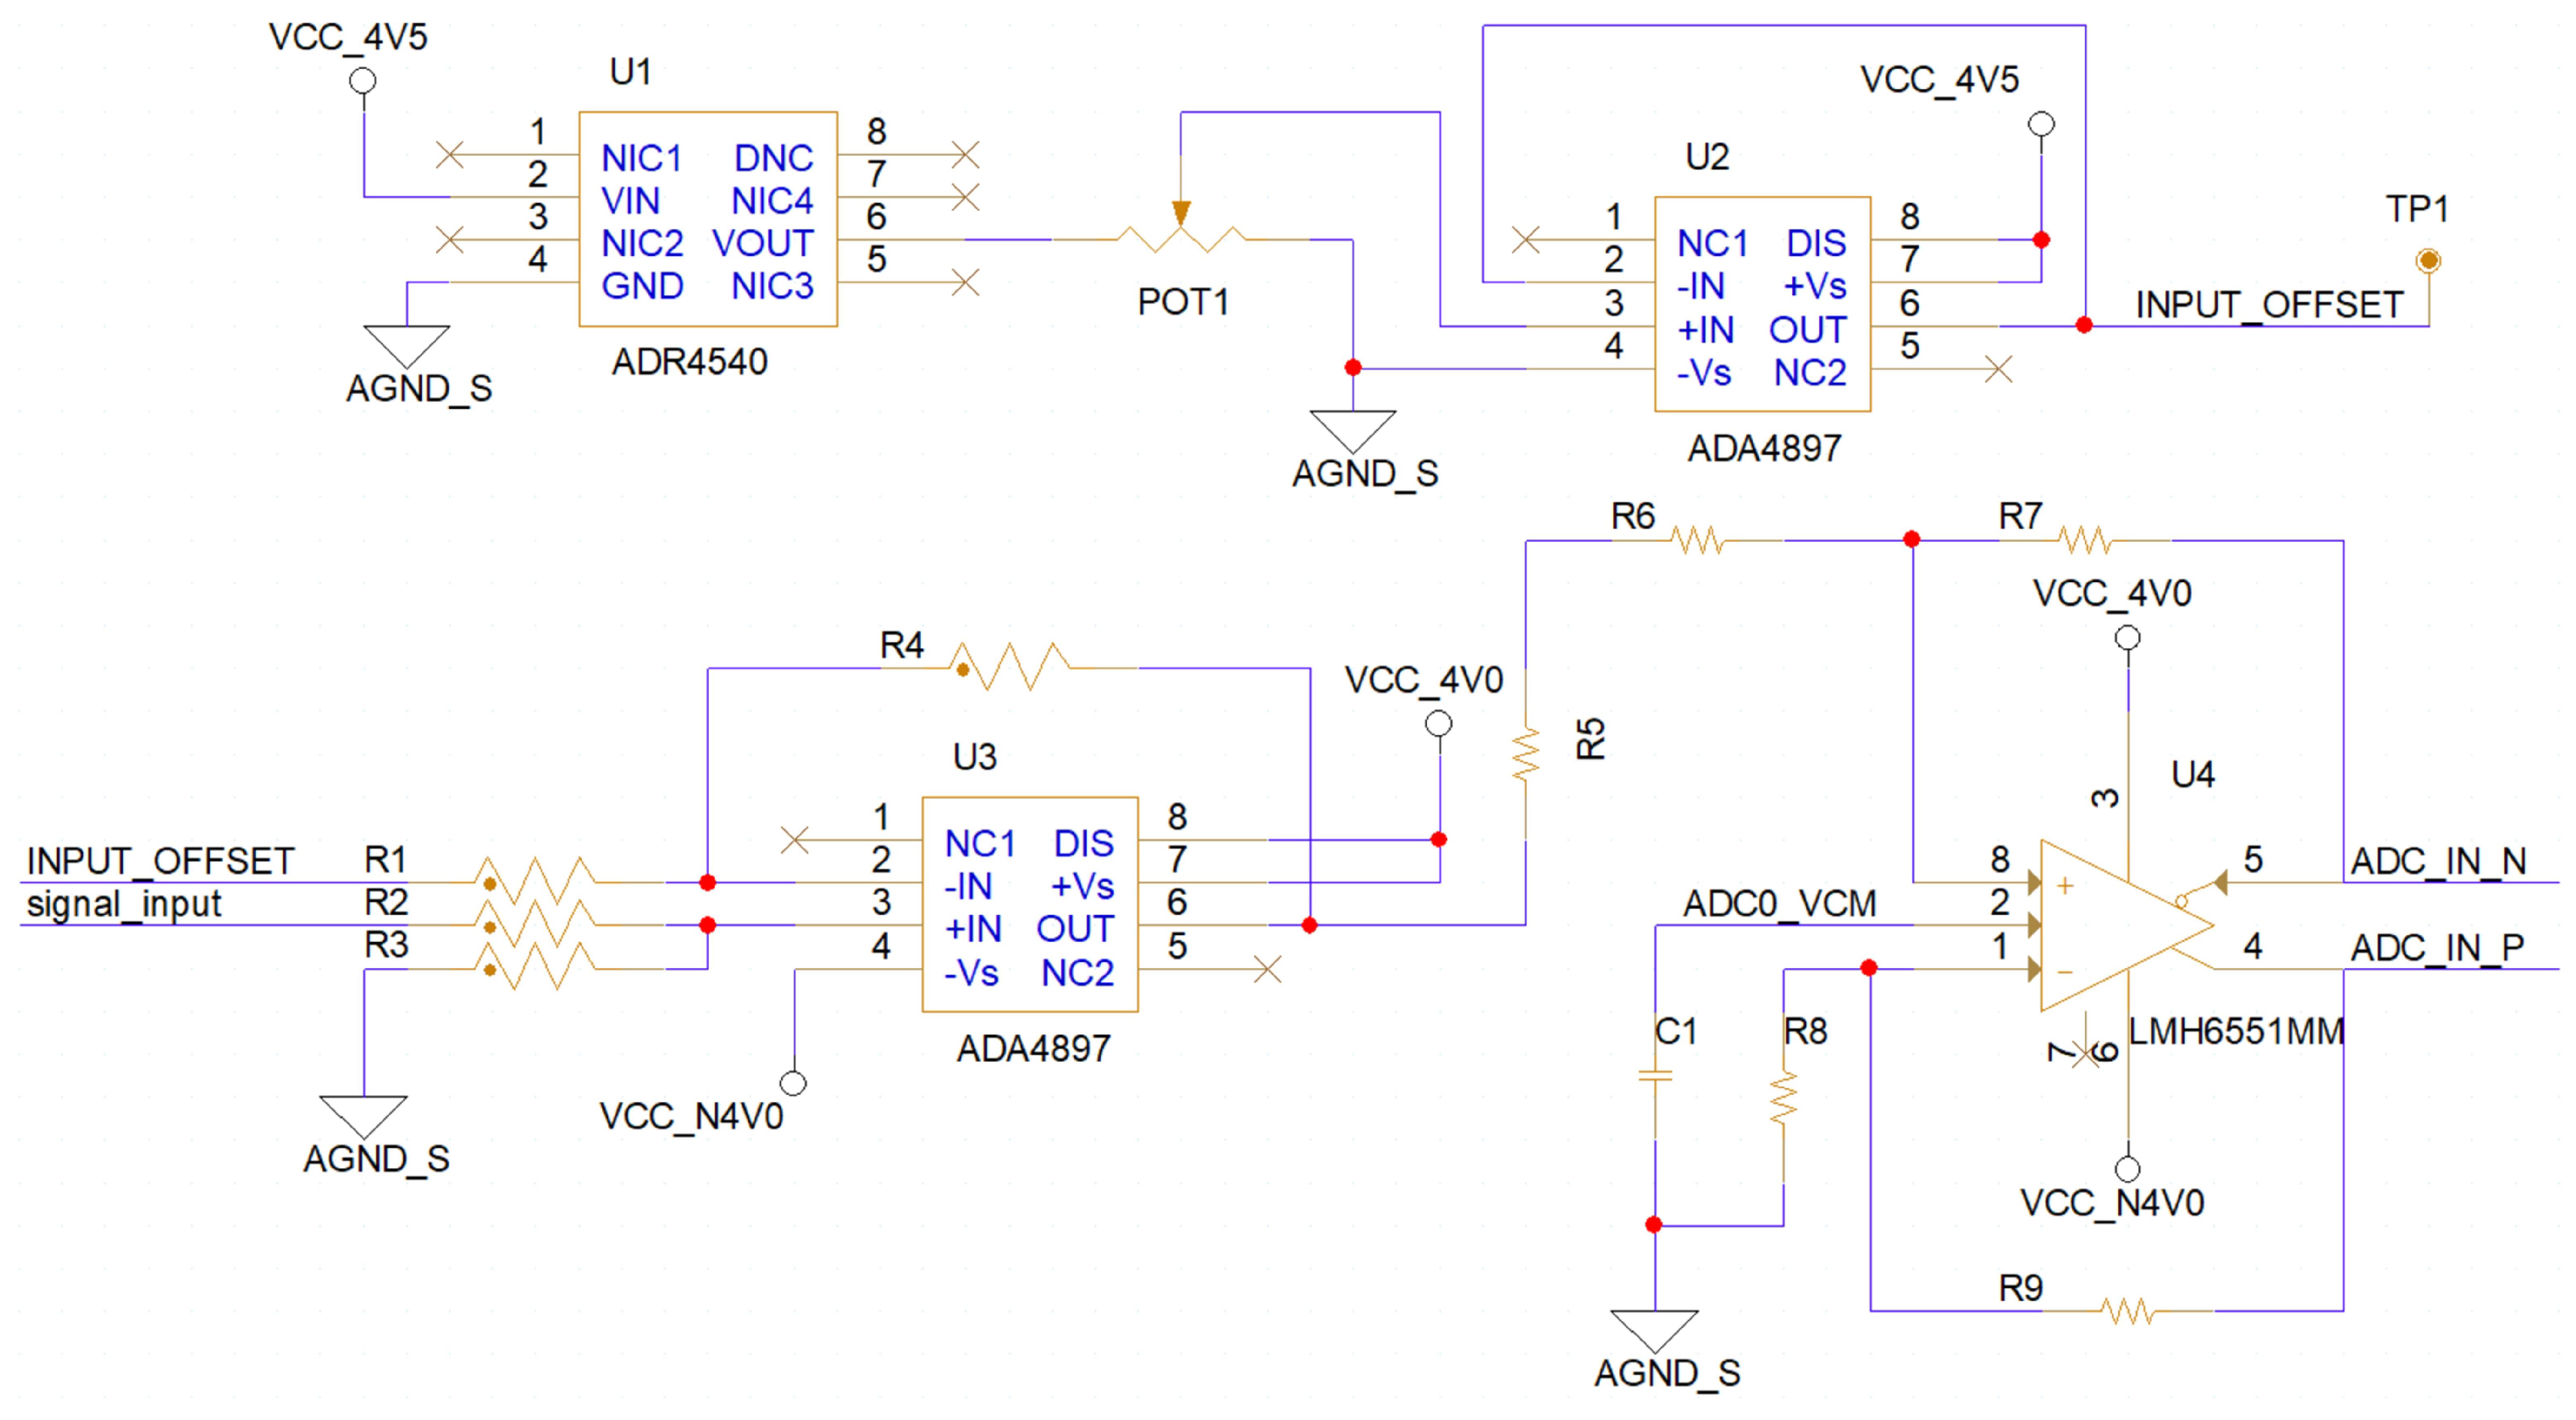
2.2.1. Front-End Processing Circuit

The infrared interference signal is photoelectric converted by the HgCdTe FPA detector, and the 128 pixel single-ended stepped wave signal with 8 serial outputs is generated. The ADC input supports differential input signal, so the single-ended stepped wave analog signal output by the detector needs to be pre-processed by the front-end processing circuit.
The front-end processing circuit consists of a voltage regulator circuit, a follower circuit, a subtractor circuit and a single-ended conversion differential circuit, as shown in Figure 4. A 4.096 V low-noise, high-precision reference voltage is provided by chip U1 powered by a 4.5 V power supply. The adjustable subtractor bias voltage is obtained by a high-precision sliding rheostat, which has the advantages of simple structure and low cost, but the output impedance of the circuit is large, the change of output current has a great influence on the output voltage, and the dynamic stability is poor. In order to ensure the impedance matching between circuits, a U2 follower circuit is connected in series between the regulator and the subtractor. After the bias voltage is passed through the follower, it is output to the subtractor circuit built by U3, and the bias voltage is added to the single-ended stepped wave analog signal output by the focal plane detector through the adjustment of the sliding rheostat, so as to ensure that the stepped wave signal is not distorted at the zero crossing, so that it is within the optimal sampling range of the ADC. Finally, the single-ended conversion differential circuit constructed by U4 converts the step wave signal into a differential signal output, which meets the signal requirements of the input of ADC.

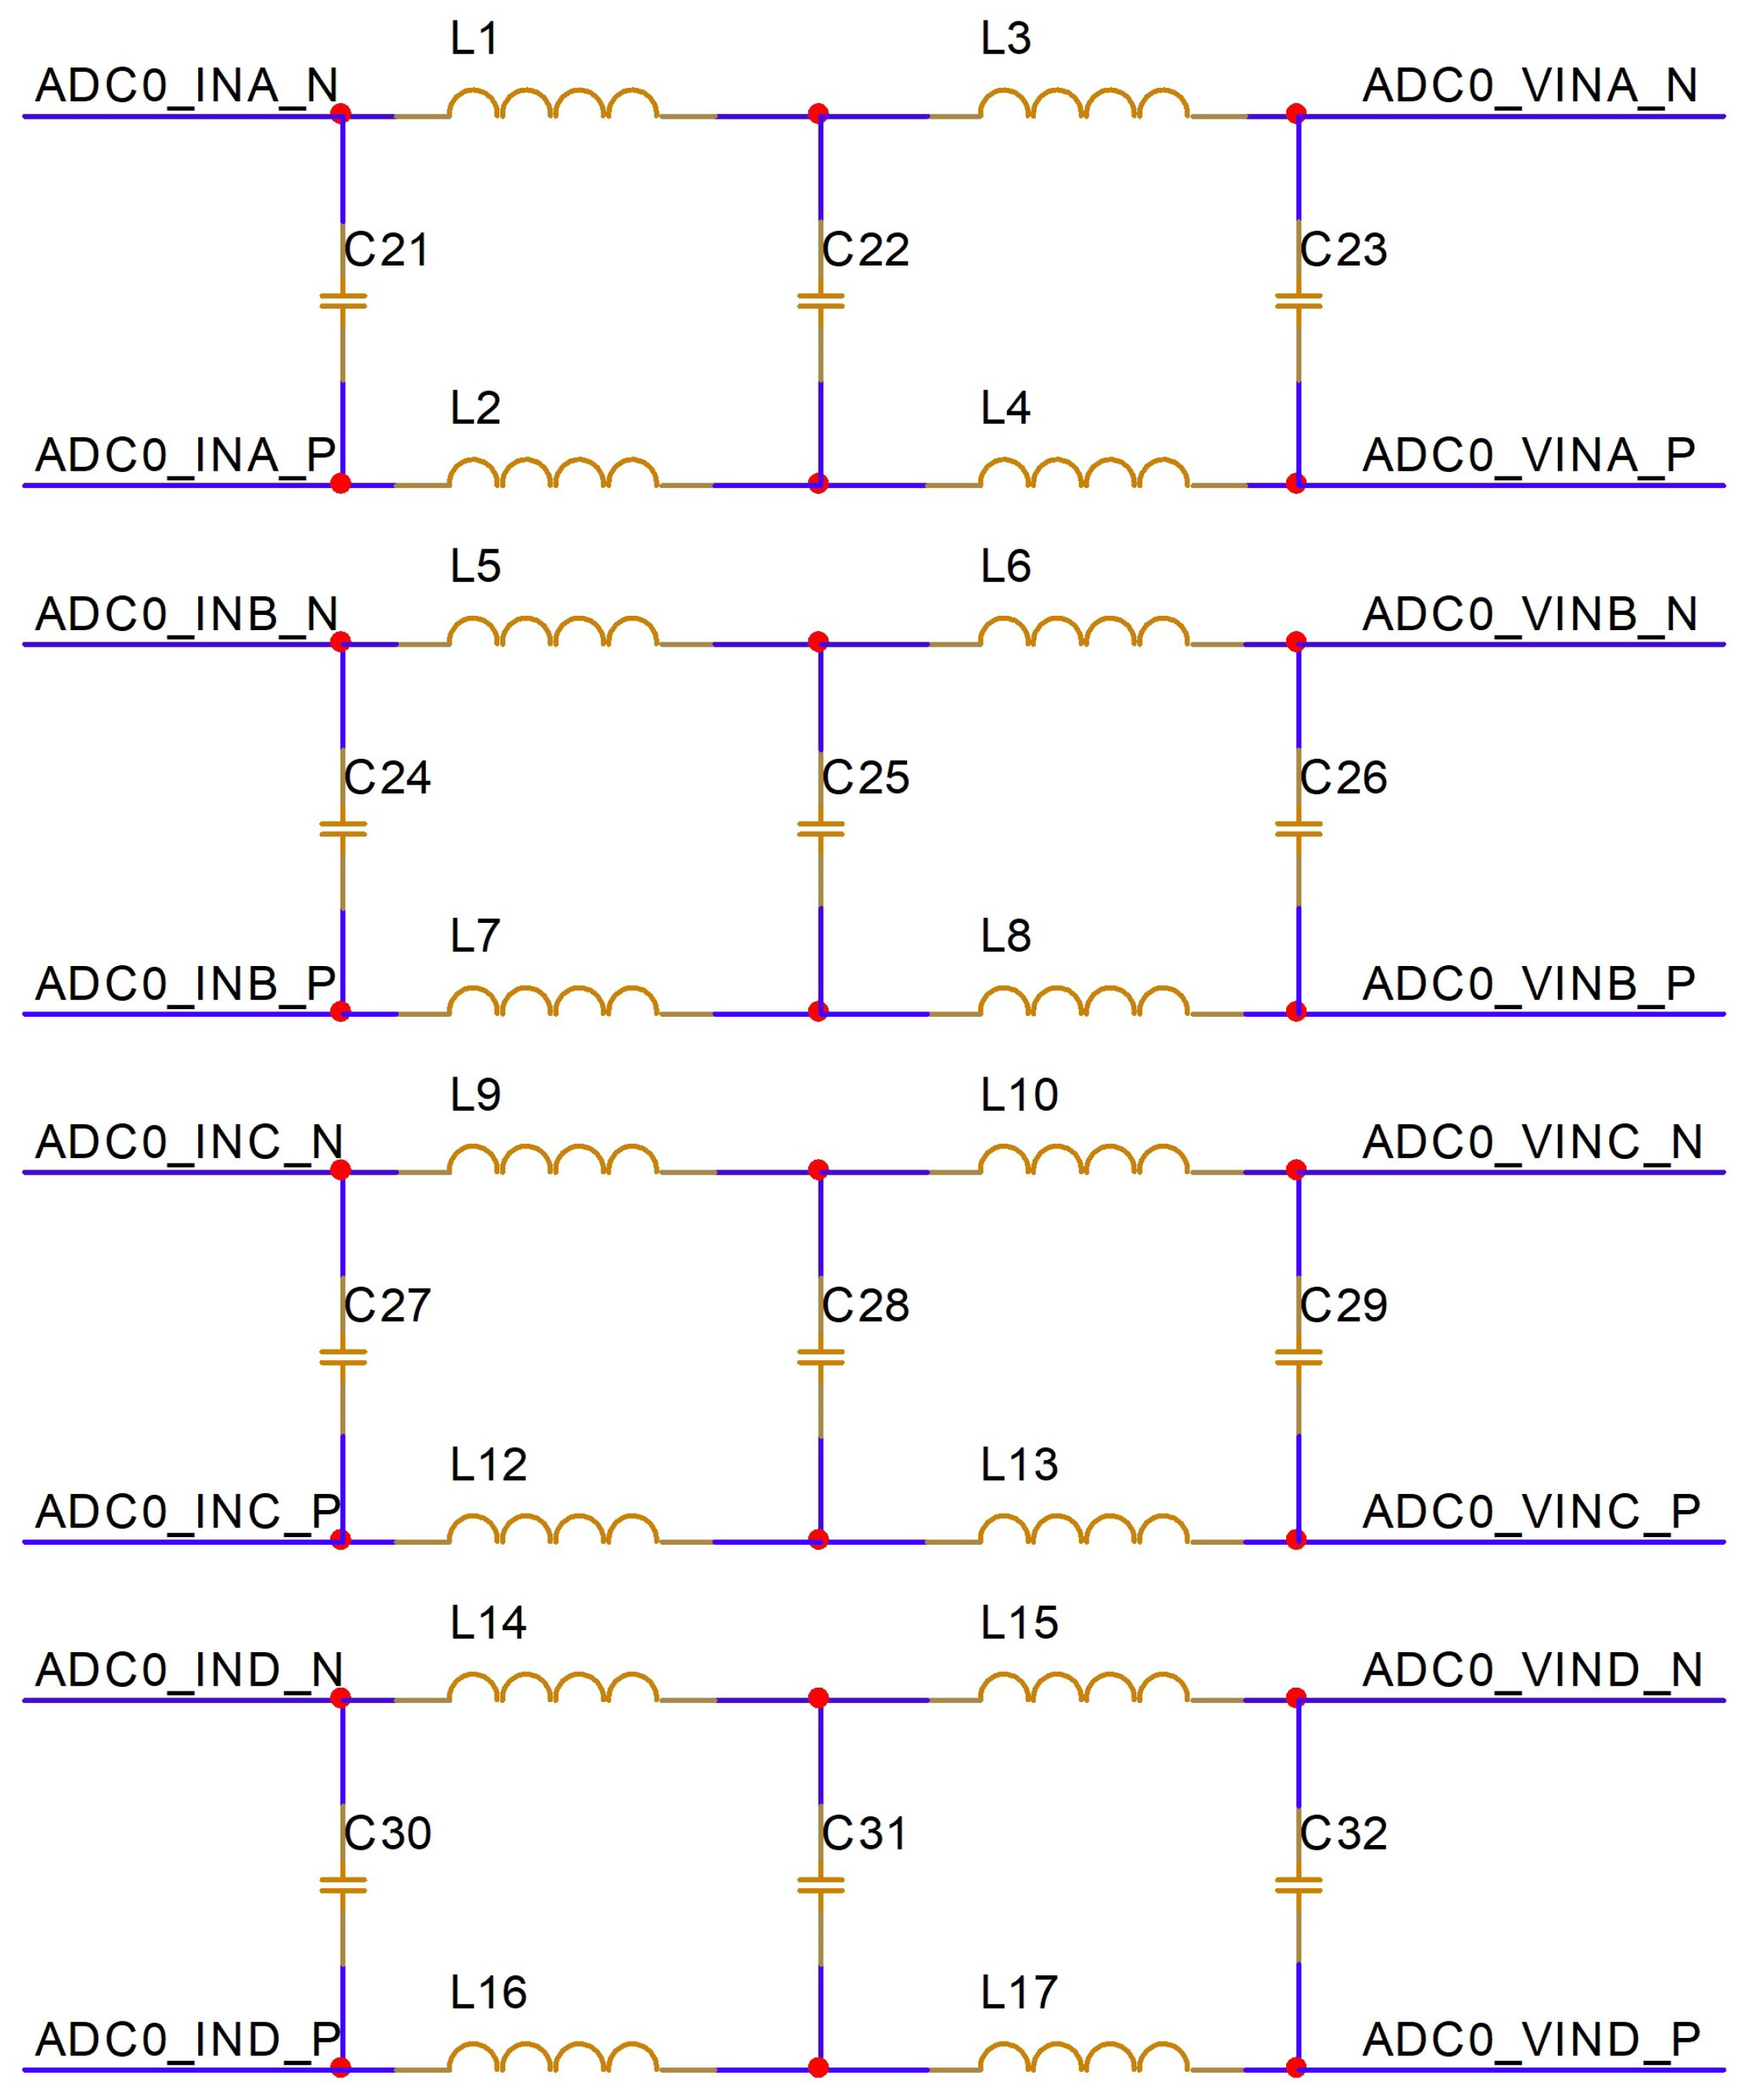
2.2.2. Hardware Filter
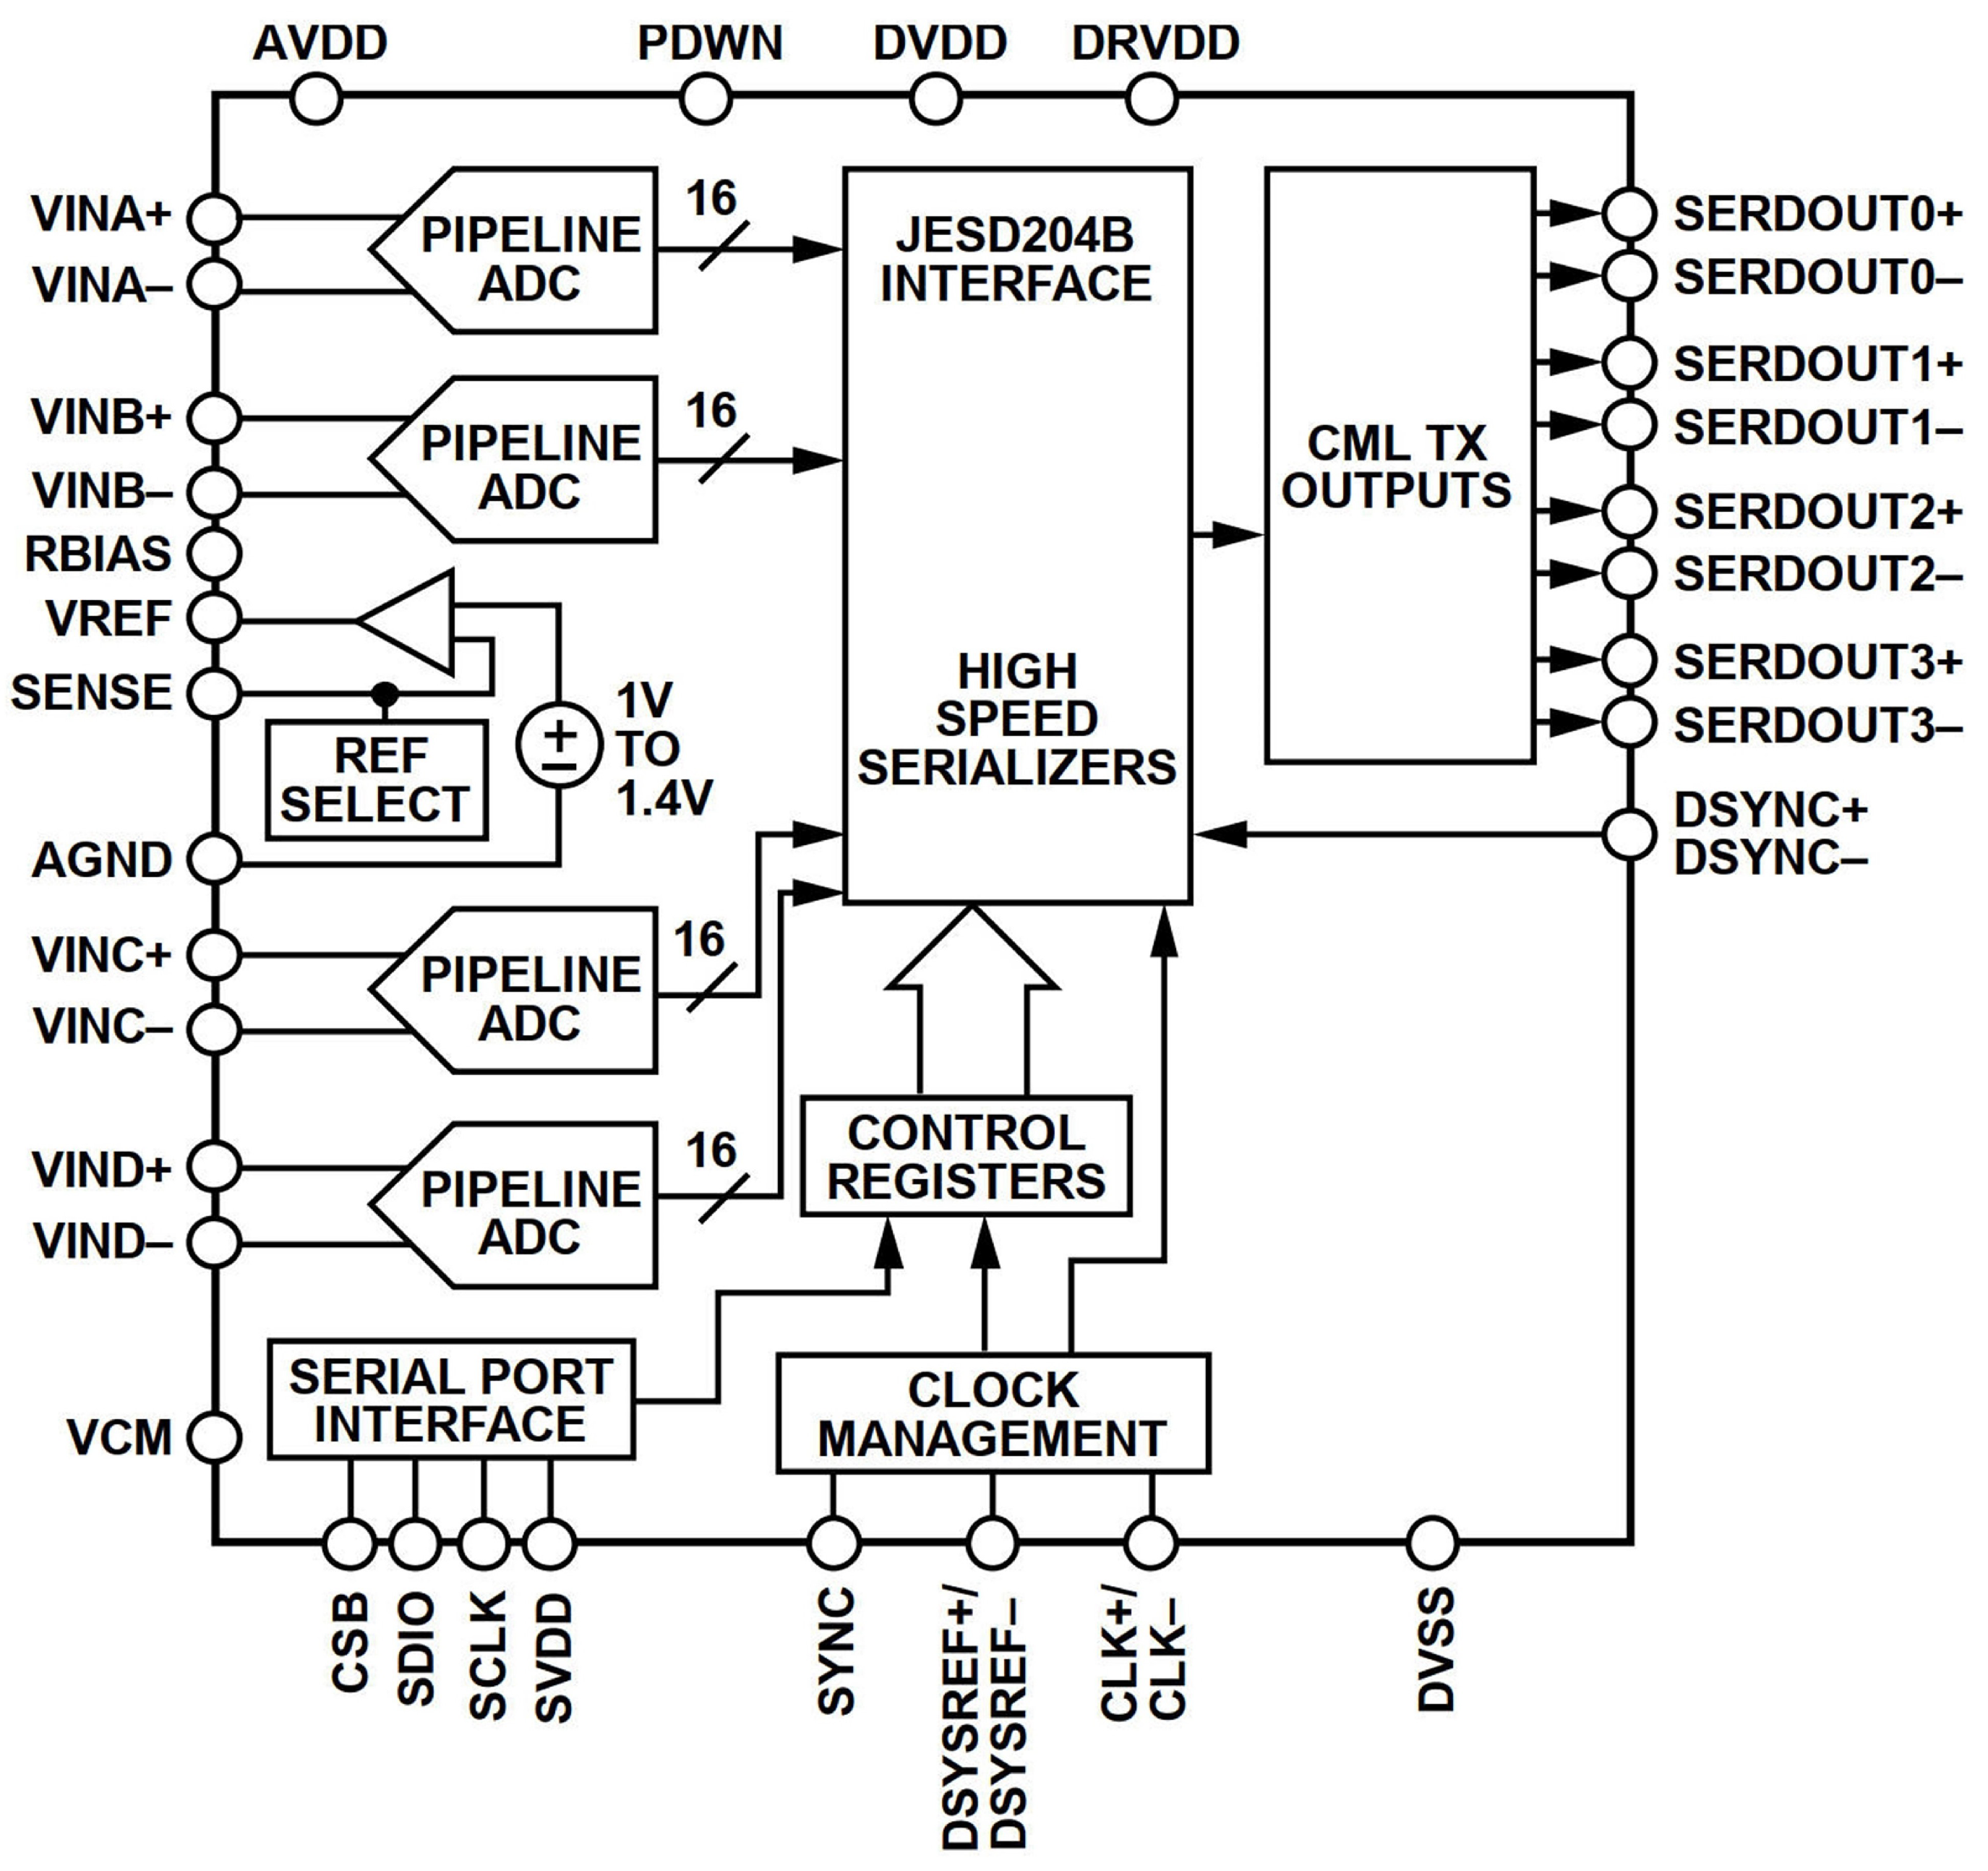
Due to the use of high-frequency oversampling technology, a large amount of step wave data is collected each time; an amount which is more than the previous FPA data per pixel. In this case, an interferogram consisting of raw data will become noticeably noisy after a few experimental measurements. Through further experiments, it is found that, because the adjacent steps of the output step wave are the output levels of different pixels of FPA, the amplitude difference of the adjacent steps is very large, and the DAQ card is affected by space noise interference and other factors, resulting in overshoot and ringing of the step wave signal, as shown in Figure 5. In order to improve the signal-to-noise ratio of the interferometric signal and filter out the overshot and ringing of the FPA output step wave, it is necessary to add a hardware filter between the ADC input and the front-end processing circuit.
In this paper, a high-order Butterworth hardware filter with maximum flat amplitude in the passband is selected. Figure 6 shows the schematic diagram of the ADC board’s 4-channel Butterworth filter. The high-order Butterworth differential filter circuit is connected in series between the ADC input and signal conditioning circuit, ensuring strict adherence to a wiring impedance of 50 Ω for the differential pair.

2.2.3. ADC Circuit

The adc chip is connected to the output of the front-end and the input of the fpga, which plays a critical role in the entire DAQ card, and its input voltage range should meet the output voltage range of the analog front circuit. The ADC used in DAQ card is a 4-channel, 16-bit, 125 Msps/Ch ADC that supports jesd204b subclass 1 coded serial digital output interface. The ADC functional block diagram is shown in Figure 7. The 1.8 V input power of the ADC is generated by an ultra-low-noise, high-PSR RF linear regulator to ensure the stability of the ADC. An external reference voltage of 1.4 V is used to improve the ADC gain accuracy and thermal drift characteristics. The clock input structure is LVDS, and the three sets of differential clock inputs are processed by jitter attenuators to ensure that the jitter of the clock source is below 135 fs rms, meeting the requirements of the ADC clock source input. The ADC selected in this paper has excellent dynamic performance and low power consumption. Therefore, on the basis of ensuring good system performance, two 4-channel ADC chips were selected to realize the high-speed acquisition of the output signal of the FPA detector.

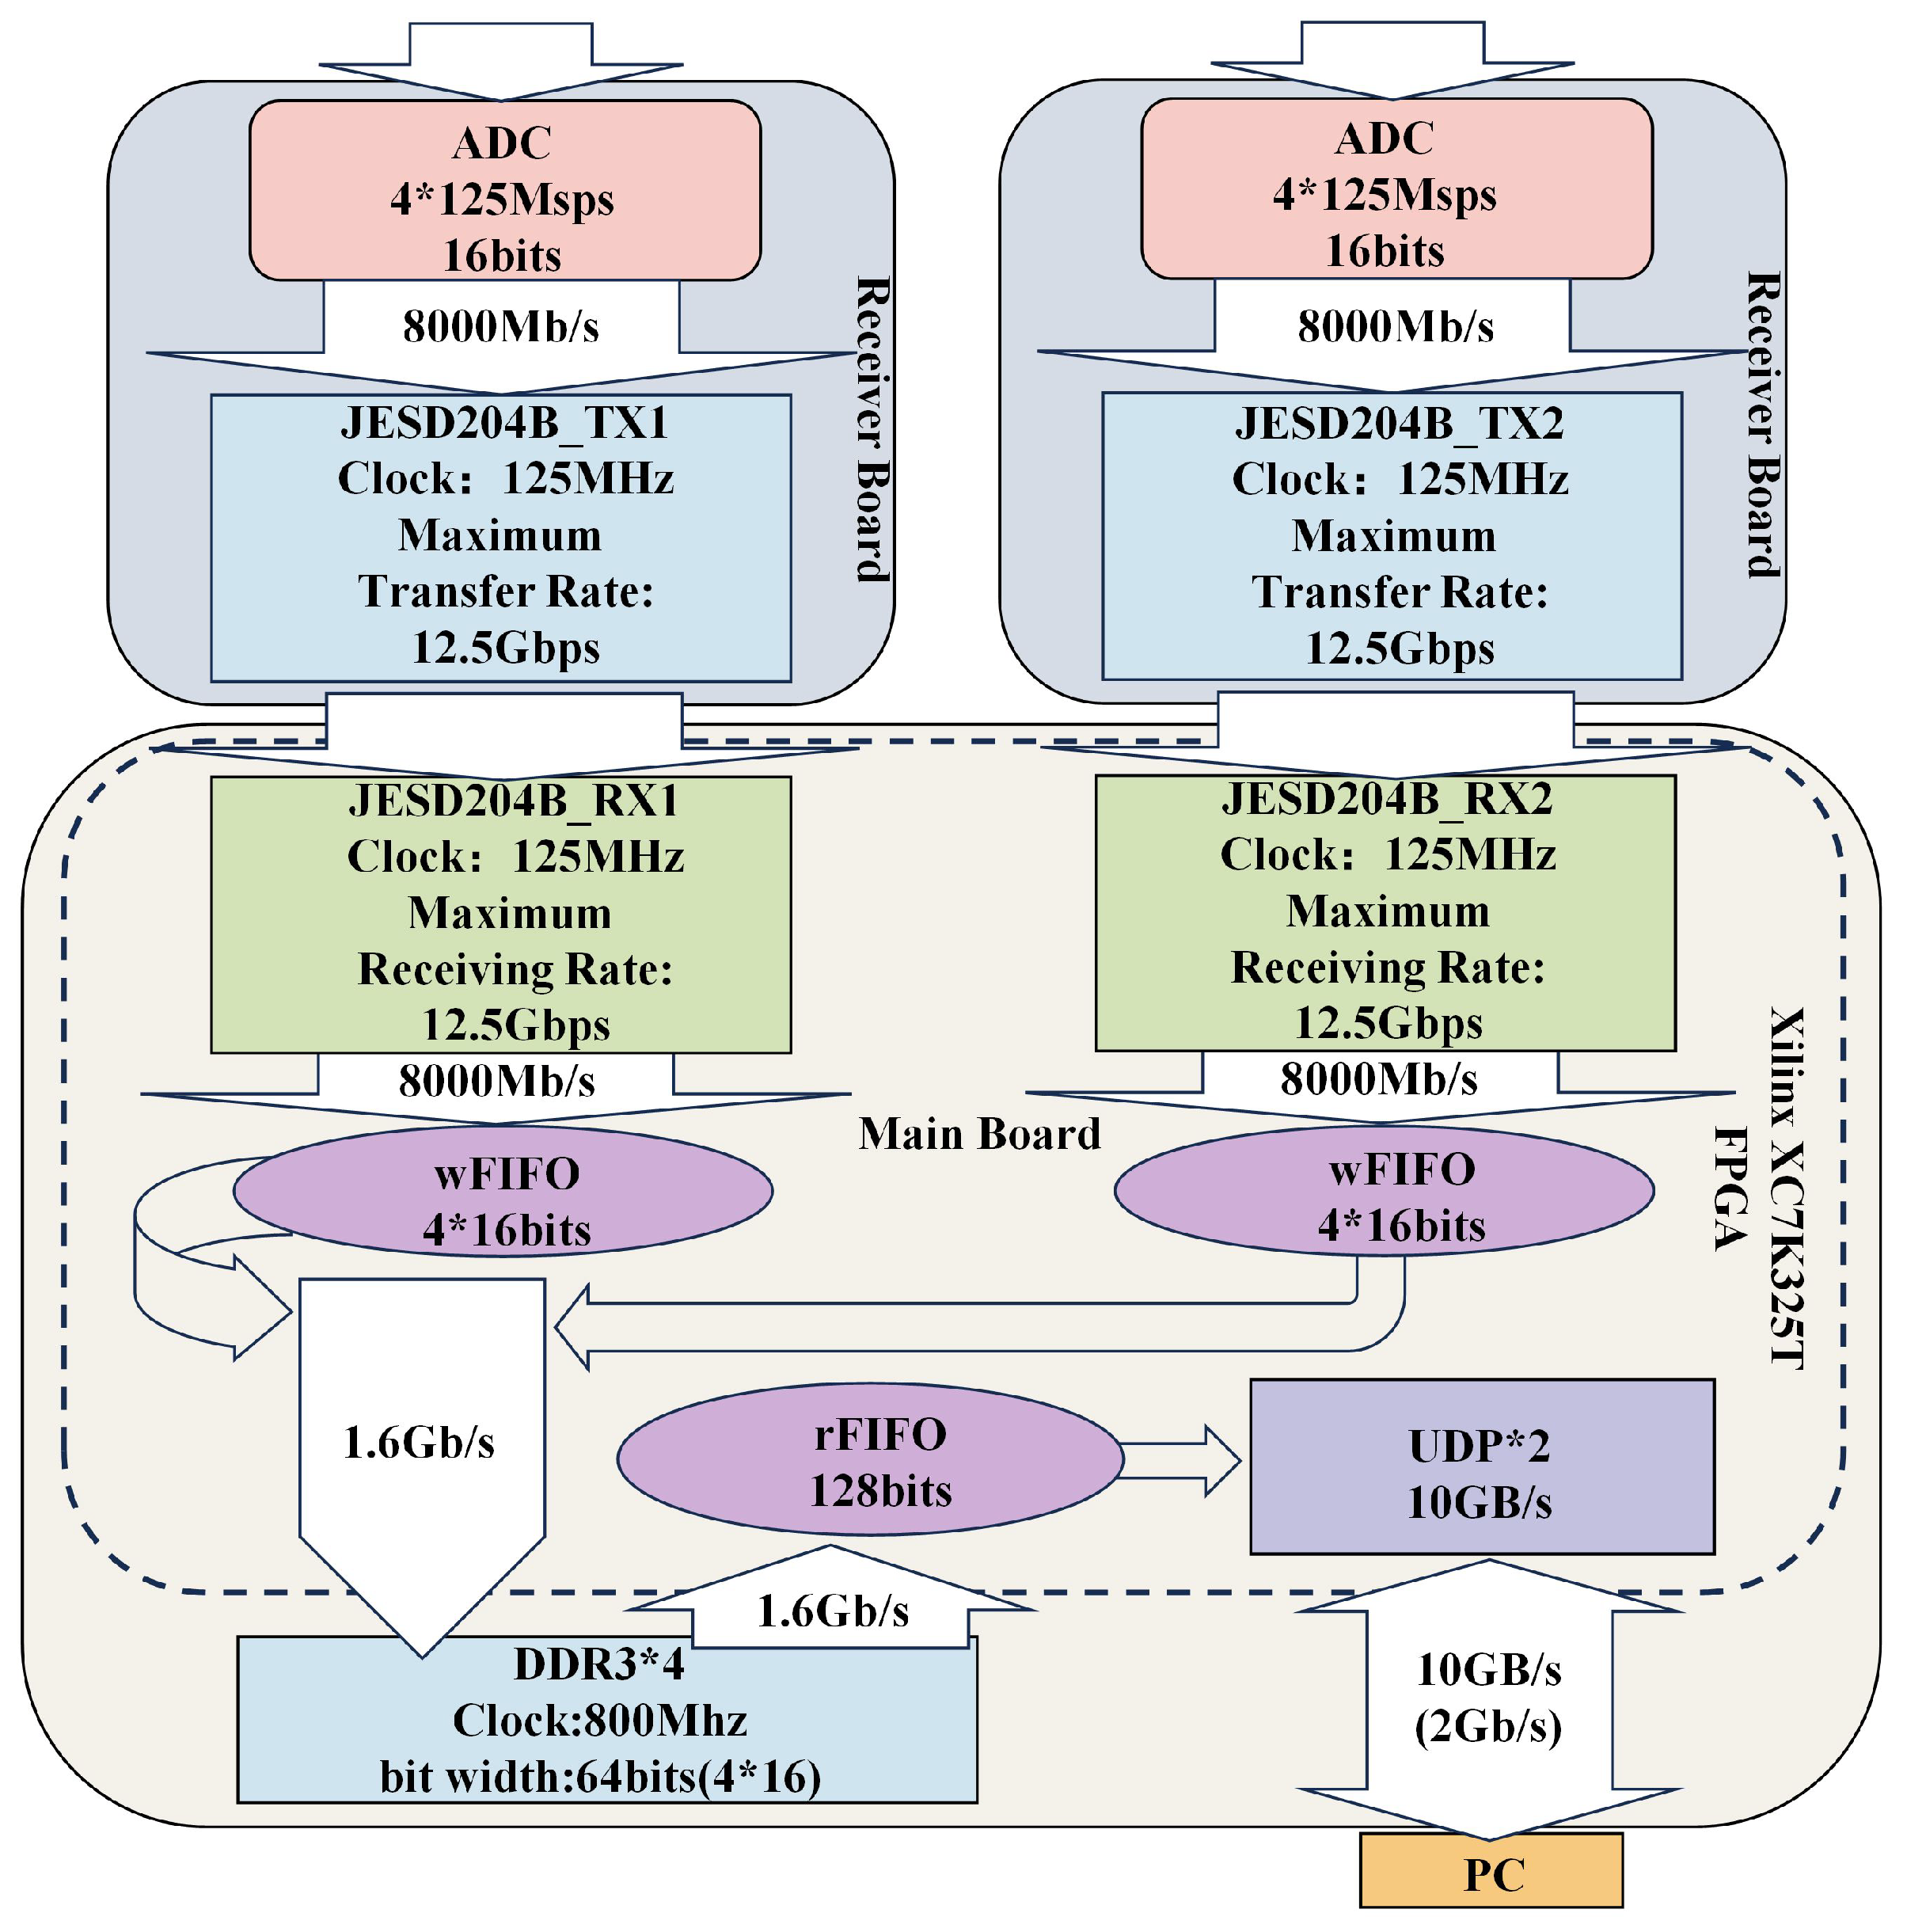
2.3. High-Speed Data Transmission Network

The data generation rate of the IRIFS acquisition system is very fast; however, the the system can only operate normally when the data throughput during the transmission process meets the requirements. The data throughput evaluation diagram of the system is shown in Figure 8. The selected 4-channel high performance ADC has a maximum sampling rate of 125 Msps/Ch and a resolution of 16 bits. During the signal acquisition period, each receiver board generates 8000 (16 × 125 × 4) Mb/s of data. The receiver board uses XC7K325T FPGA released by the Xilinx company (San Jose, CA, USA) as the main controller, and jesd204b transmission protocol as the communication interface protocol between the receiver board and the acquisition board. The standard can support internal synchronization of a single converter and synchronization between multiple converters, and the data transmission rate can reach 12.5 Gbps, which can meet the real-time transmission of 8000 Mb/s data on the single board. The motherboard and pc use UDP optical fiber transmission protocol, and the transmission is carried out through two optical fibers; the maximum transmission rate of each fiber can reach 10 GB/s.
It can be seen that the transmission scheme of real-time acquisition of DAC card designed in this paper has been over-designed, which is designed to be compatible with the next generation of larger array focal plane detectors. With the increase in the array, the amount of interference data will also increase. A faster transmission scheme is a necessary requirement for the design of the focal plane detector acquisition system.

3. Experiments and Results

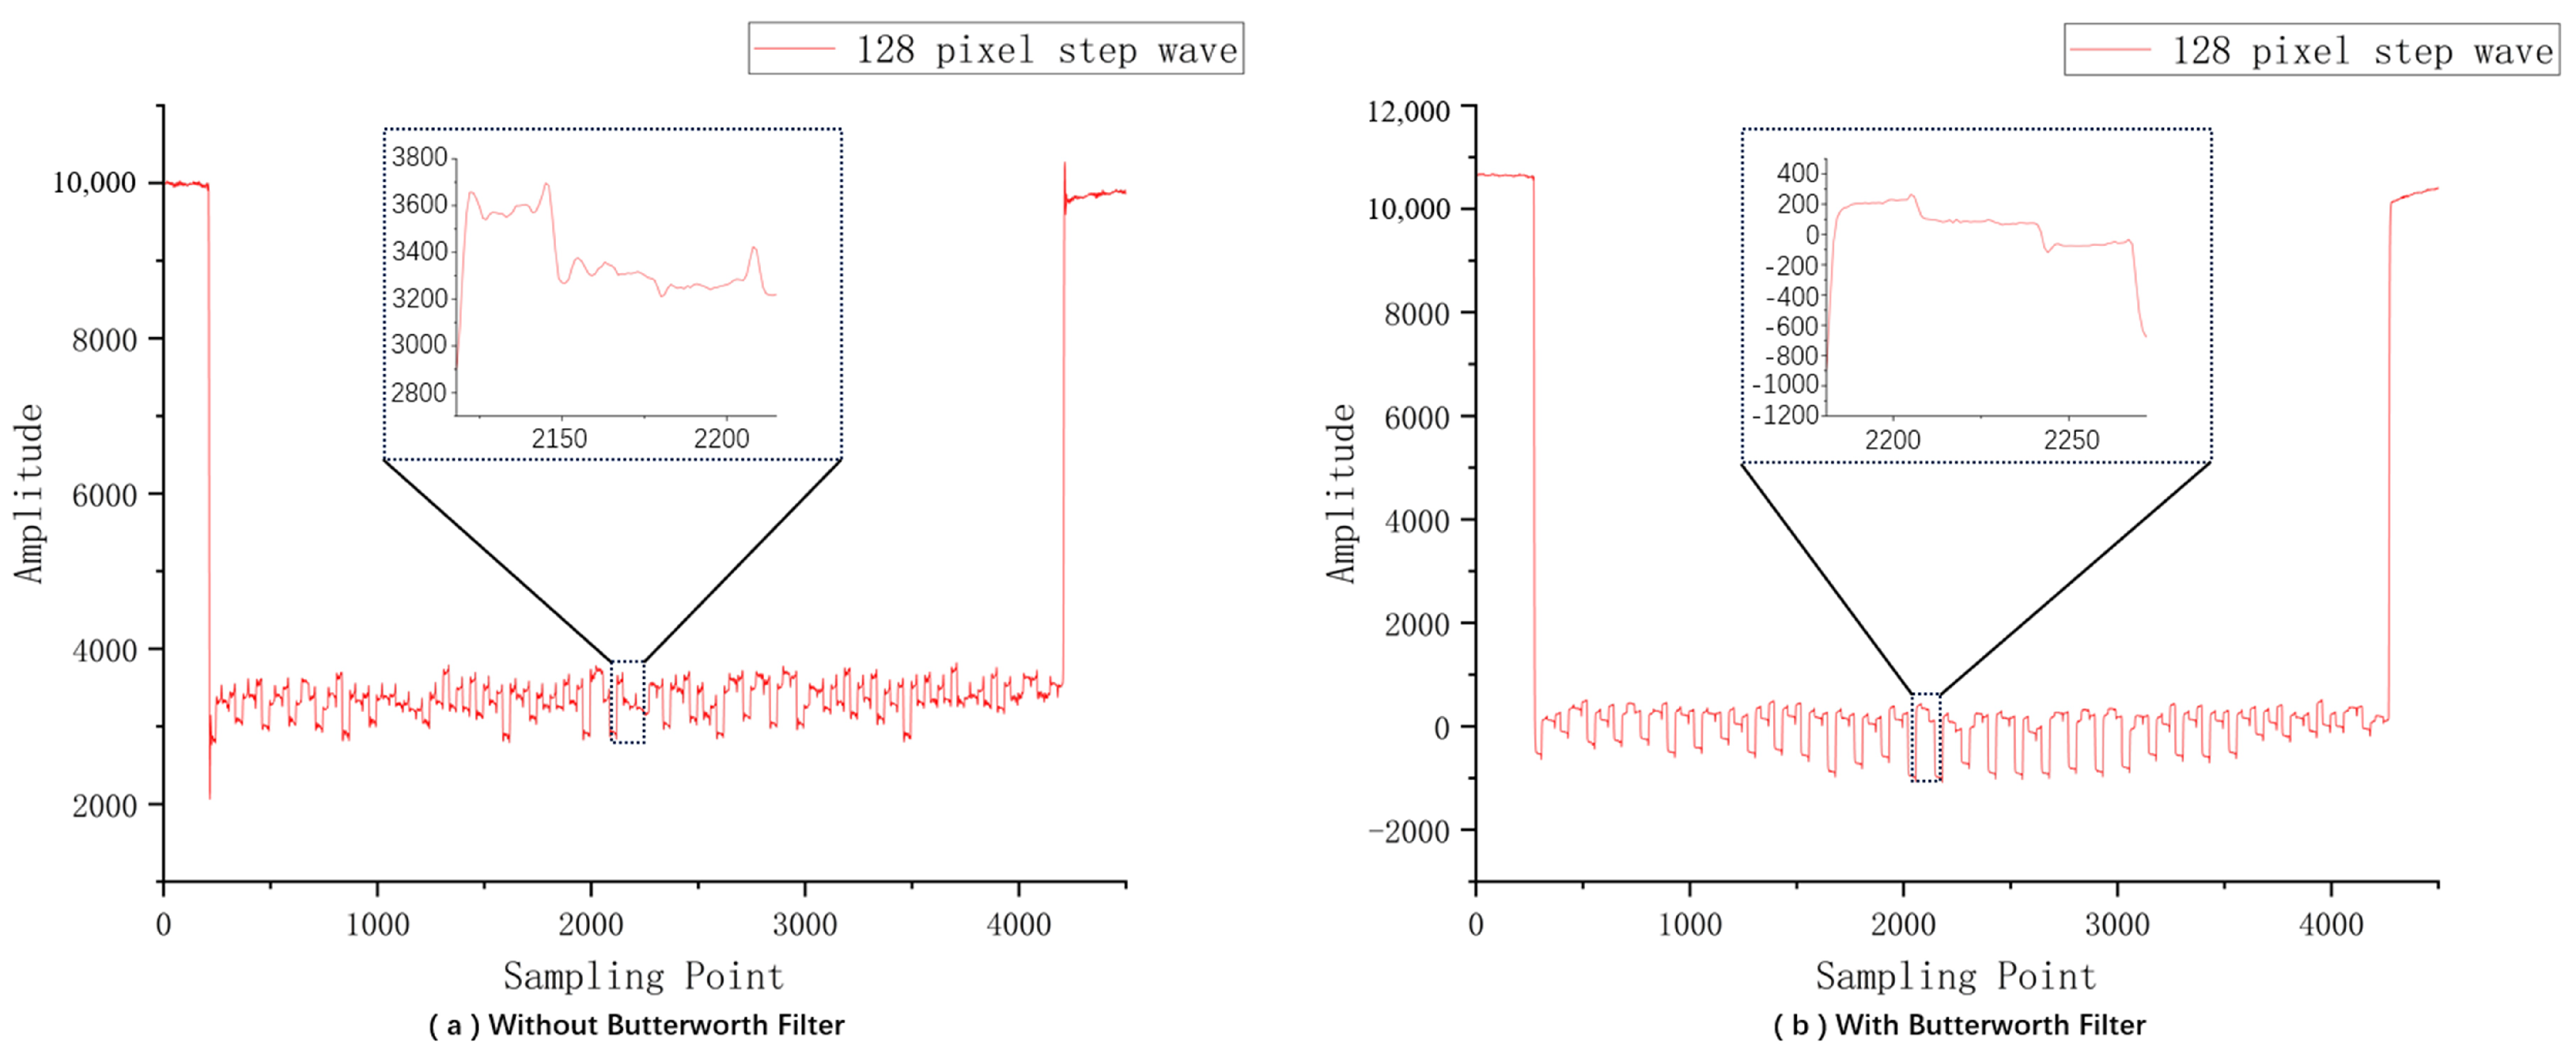
3.1. Hardware Filter Simulation Design and Verification

3.1.1. Hardware Filter Design Principle

The Butterworth filter, the Chebyshev filter, and the Bessel filter are the three commonly used hardware filters in signal processing and circuit design. Their amplitude–frequency characteristics are plotted in Figure 9a. The Butterworth filter has a maximally flat response, but with moderate phase distortion [23]. The Chebyshev filter has a steeper transition, but creates ripple in the passband or stopband [24]. Bessel filters emphasize phase linearity and smoother roll-off, and are often used where the shape of the signal is required [25]. For the step wave output by the FPA detector, it is very important to ensure the flatness of each step signal. The roll-off rate of the Butterworth filter increases with the increase in the order. The higher the order, the more steep the roll-off, and the amplitude response of the filter will be closer to the ideal “brick wall” response, which means that the higher-order filter can achieve a sharper transition between the passband and the cutoff band, as shown in Figure 9b. Therefore, the high-order Butterworth filter with the largest flat amplitude in the passband is selected to solve the noise interference of the output step wave of the FPA detector.
Transfer function plays a crucial role in high-order Butterworth hardware filter design. It defines the relationship between the input and output signals, so the filter response can be calculated at different cut-off frequencies and orders. The transfer function H (s) describes how the filter attenuates or passes through signals at different frequencies.
The squared magnitude function of a Butterworth low-pass filter:
H j ω 2 = 1 1 + ω ω c 2 n
where n is the filter order and ω c is the cutoff frequency of the filter.
Substituting s = j ω into H ω 2 yields:
H s 2 = 1 1 + s j ω c 2 n
Let the denominator polynomial be equal to zero; solving the poles yields:
s k = ω c e j π 2 k 1 2 n
where: s k = ω c and k = 1, 2, , 2n.
The results show that the 2n poles of the Butterworth filter transfer function have a uniform distribution interval π n , and the first pole position π 2 n + π 2 . Furthermore, because the filter is stable, all the poles of the left S-plane are taken as the poles of H ω , and the poles of the right S-plane are H ω , which is obtained by combining the amplitude square function of Equation (1):
H s = ω c n k = 1 n s s k
When n is even:
H s = ω c n k = 1 n / 2 s 2 2 ω c cos 2 k 1 2 n π + π 2 s + ω c 2
When n is odd:
H s = ω c n k = 1 n 1 / 2 s + ω c s 2 2 ω c cos 2 k 1 2 n π + π 2 s + ω c 2
Normalize the transfer function, substitute s = s ¯ · ω c into the transfer function expression:
When n is even:
H s ¯ = 1 k = 1 n / 2 s ¯ 2 2 cos 2 k 1 2 n π + π 2 s ¯ + 1
When n is odd:
H s ¯ = 1 k = 1 n 1 / 2 s ¯ + 1 s ¯ 2 2 cos 2 k 1 2 n π + π 2 s ¯ + 1
Its general formula is:
H s ¯ = 1 k = 0 n a k s ¯ k , a 0 = a n = 1
The parameters a k can be obtained by looking up the normalized Butterworth polynomial table (Table 1) and calculating the general formula H s ¯ of the transfer function. The standard transfer function H s is obtained by substituting s ¯ = s / ω c into H s ¯ , and the desired filter is obtained through the circuit configuration of H s . On the basis of the configured single-ended circuit, the differential form filter can be configured by keeping the capacitance value in the single-ended filter circuit fixed and evenly distributing the inductance to the two branches of the differential circuit.

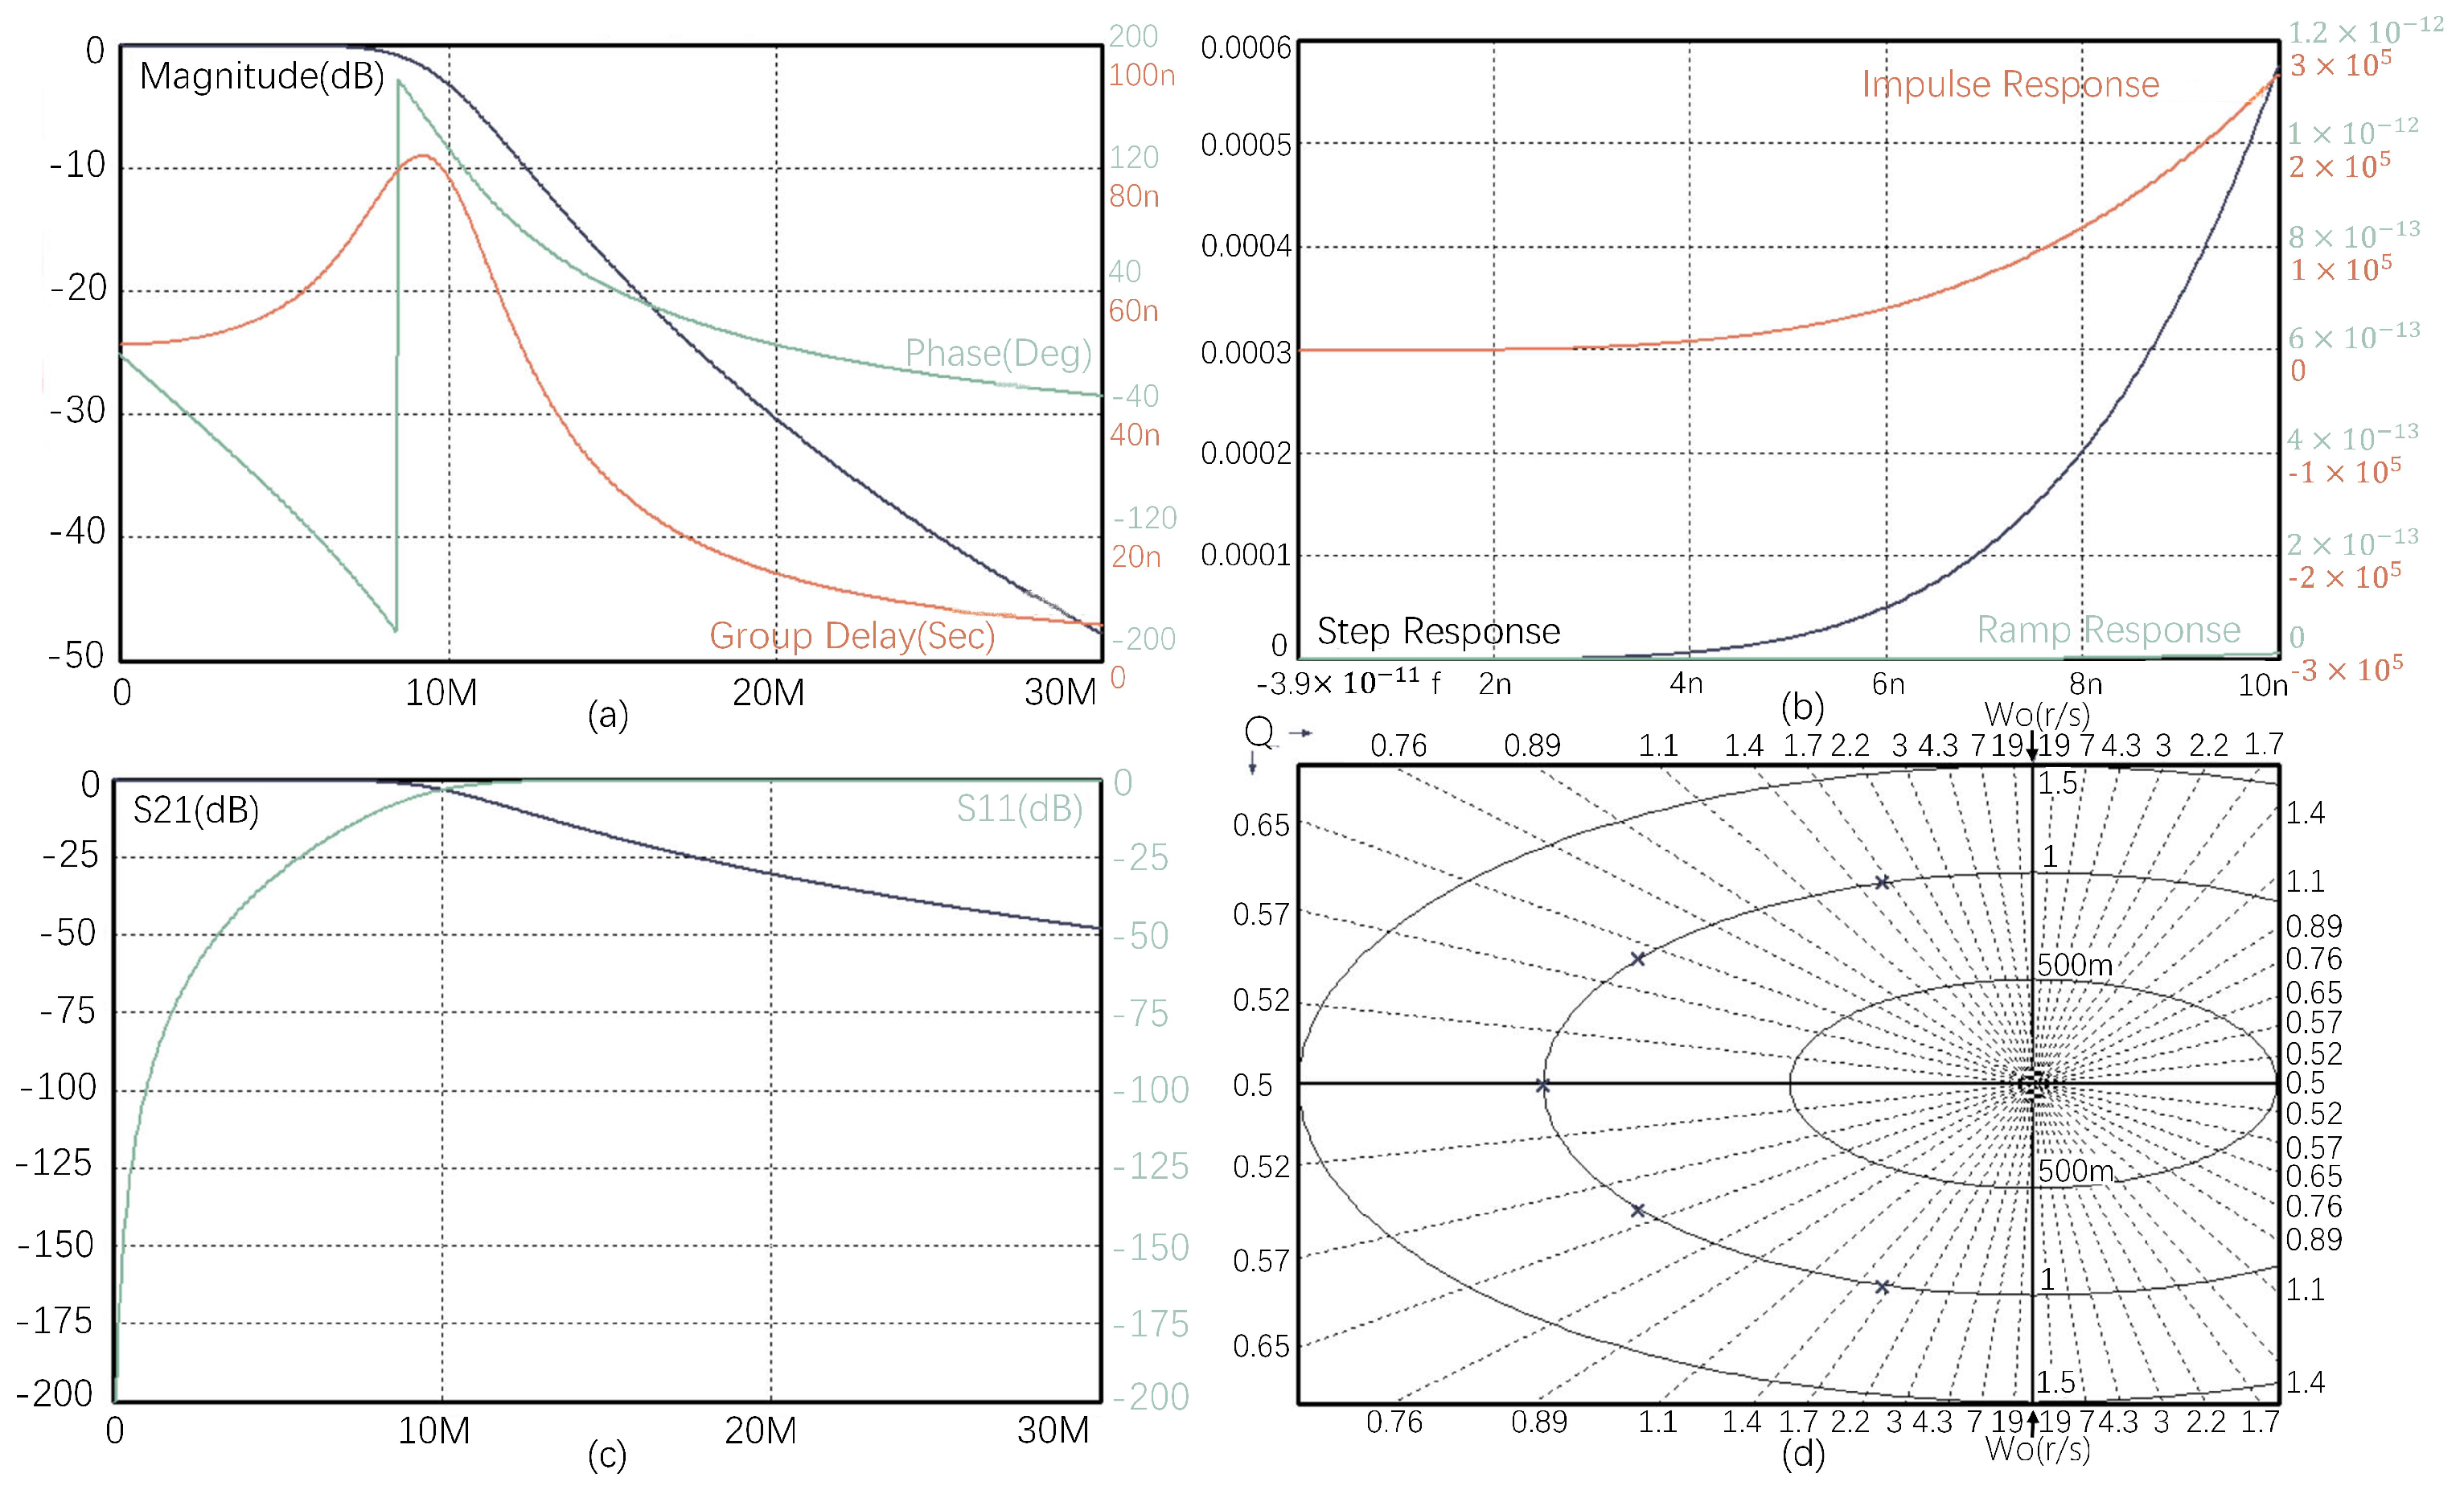
3.1.2. Simulation Verification of Hardware Filter

Based on the transfer function of the Butterworth filter calculated using Formula (9), the performance parameters of the fifth-order Butterworth low-pass filter are simulated and verified using the Filter Solutions 16.3 simulation design software, as shown in Figure 10a–d. The fifth-order Butterworth low-pass filter satisfies a flat low-pass band with a cut-off frequency of 10 MHz, and the group delay is kept below 80 ns. The step response within 10 ns is below 0.0006. In the passband of 10 MHz, reflection coefficient S11 and transmission coefficient S21 meet the requirements. The zeros and poles of the filter are all distributed in the left half plane, so the system converges. According to the results of simulation verification, the designed 5th-order Butterworth low-pass filter meets the design requirements.

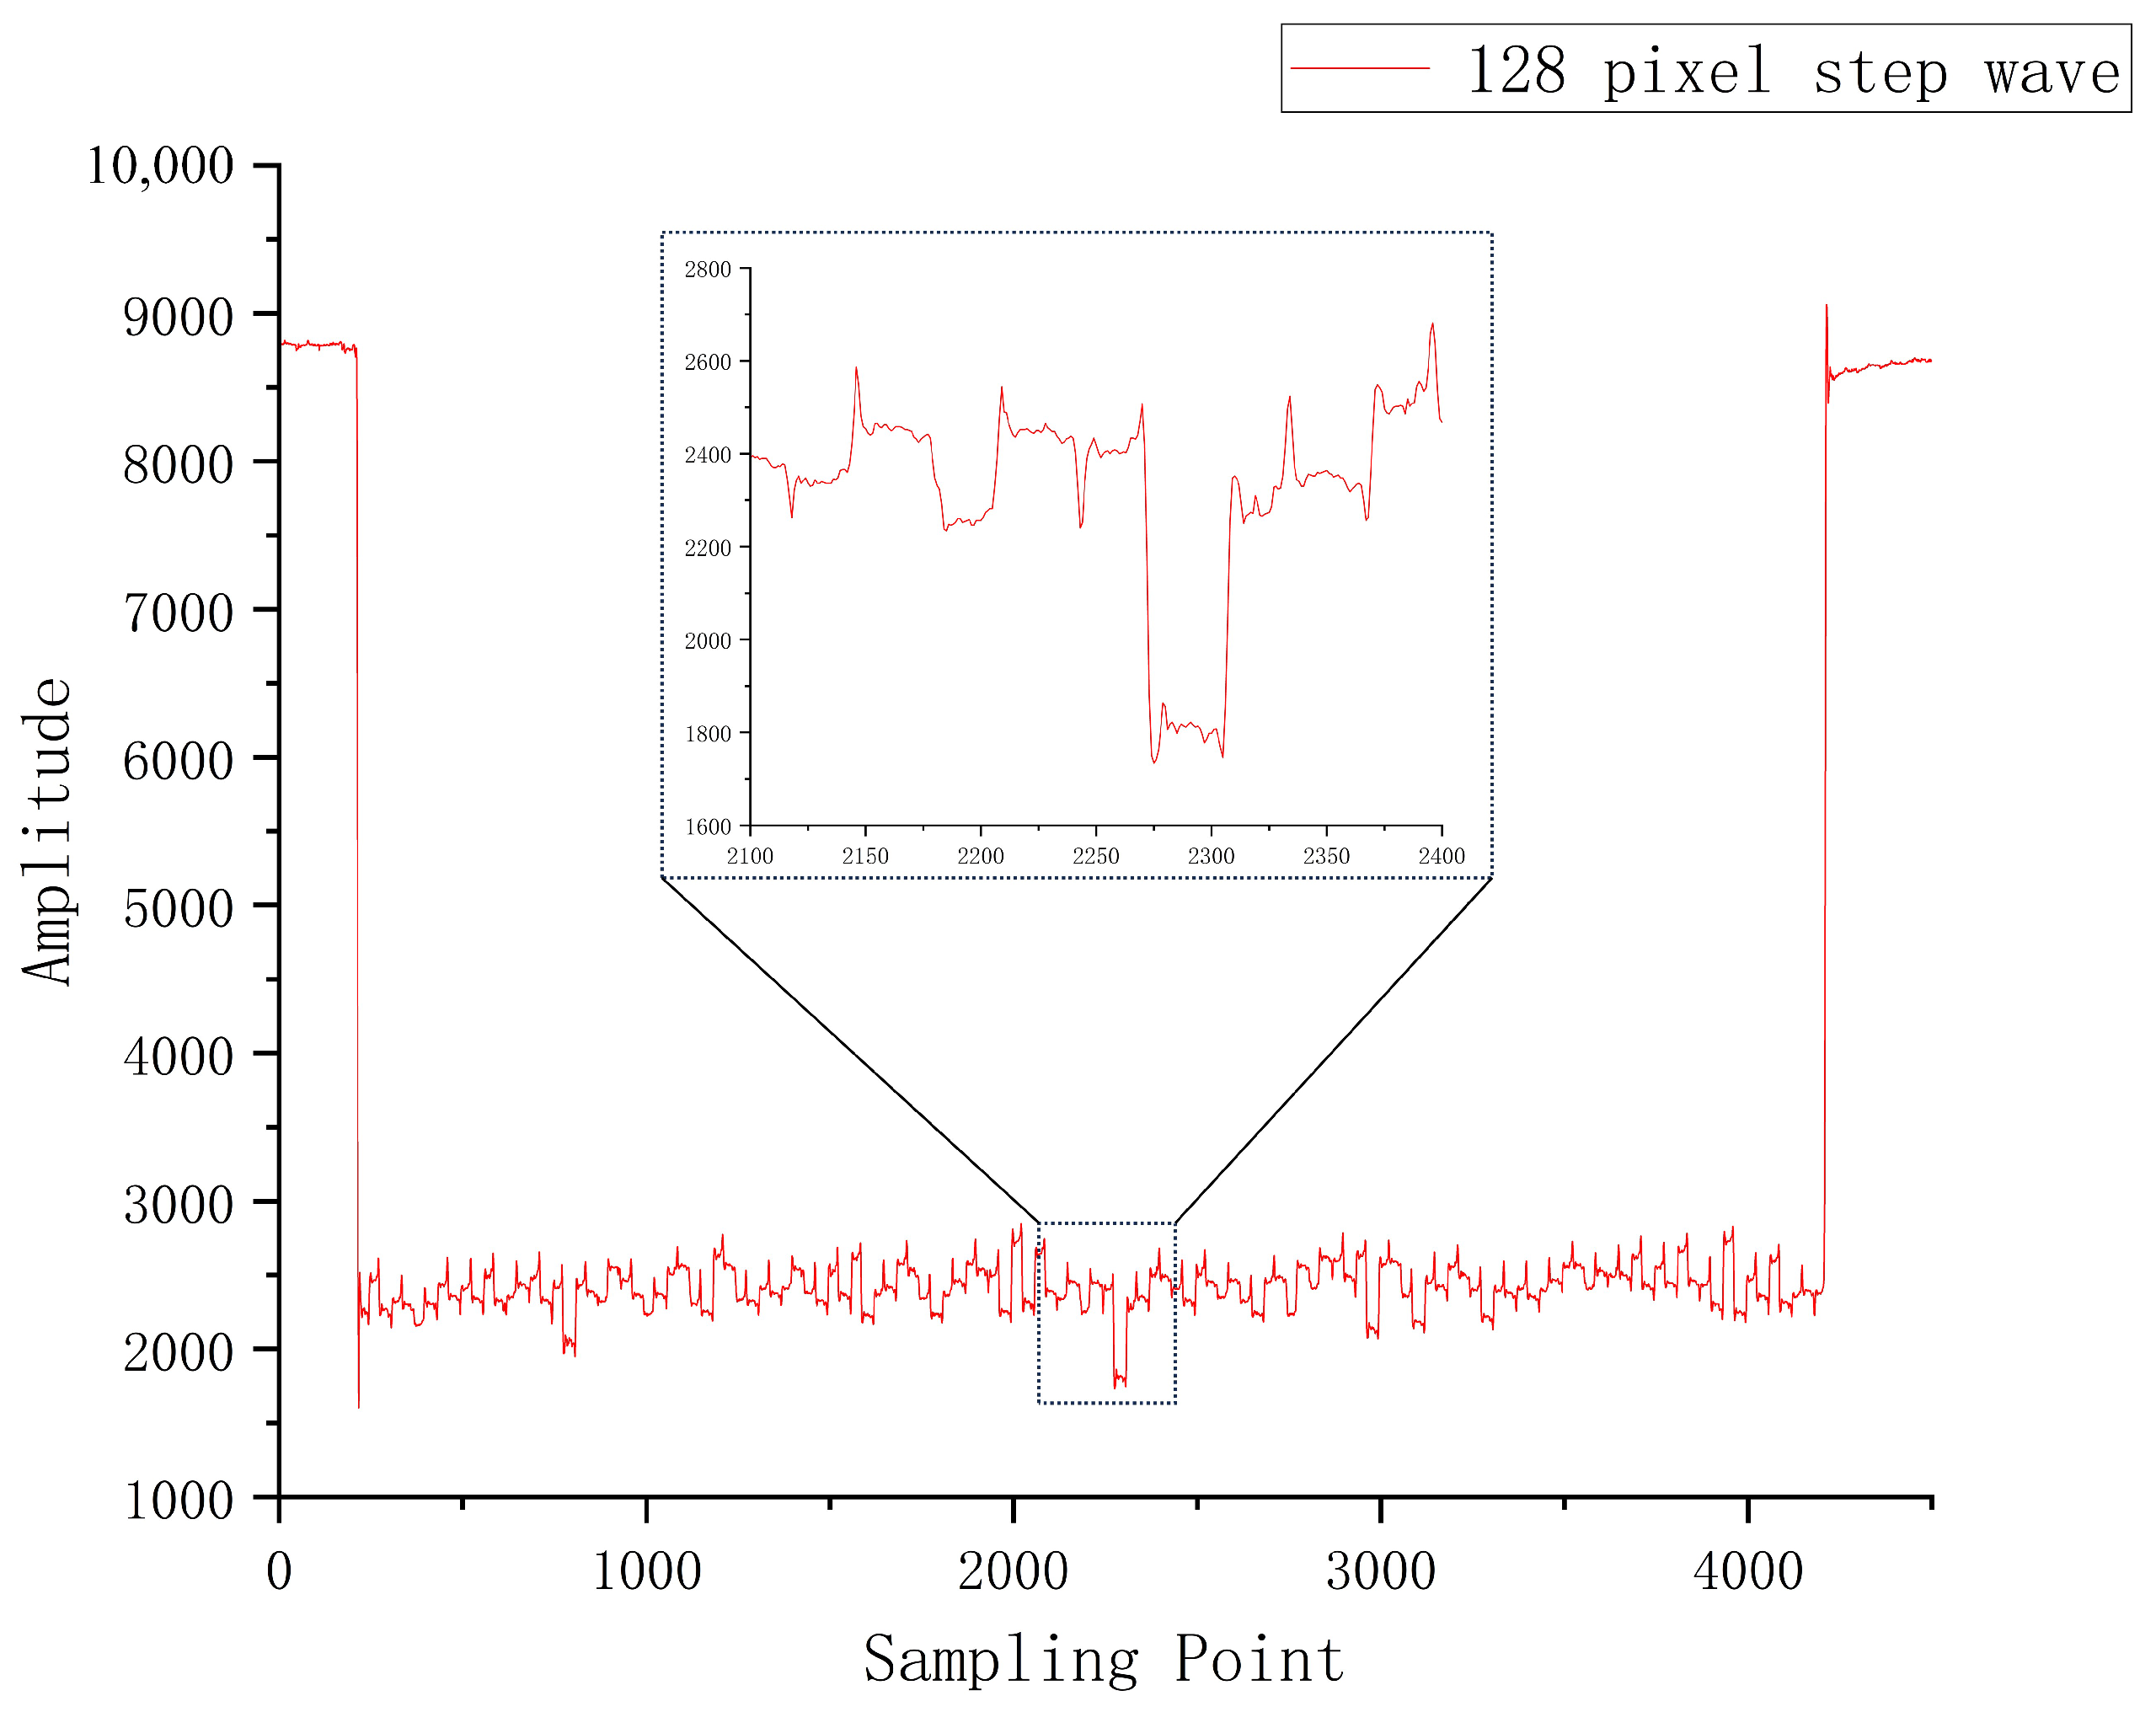
3.1.3. Hardware Filter System Verification

The DAQ board is verified in the system after incorporating filter optimization, as depicted in Figure 11. The obtained results demonstrate that the high-order Butterworth filter exhibits remarkable suppression effects on both overshoot and ringing of FPA output step wave, while also significantly enhancing the overall SNR of the system.

3.2. Daq Card Performance Analysis

3.2.1. Evaluation Index

The commonly used ADC dynamic parameters mainly include total harmonic distortion (THD), SFDR, SNR, and a significant number of bits (ENOB). For multi-channel DAQ cards, cross-talk is also an important parameter.
(1) Total harmonic distortion: This is the ratio of the harmonic components added to the output to the input. THD quantifies the harmonic component in the output signal, and (10)–(12) are used to calculate THD.
T H D = T H E A r m s
T H E = 1 M 2 h = 2 N H X a v g n h 2 + h = N H 2 X a v g n h 2
A = 1 M X a v g n i 2 + X a v g M n i 2
where T H E is the total harmonic energy, N H is the highest harmonic number (usually 10), n h corresponds to the 1st harmonic, n i corresponds to the input signal, and A r m s is the root mean square value of the input sine signal.
(2) Spurious free dynamic range—SFDR: This refers to the ratio of the basic signal energy to the maximum spurious signal energy within the sampling frequency. SFDR is mainly used to represent the anti-interference ability of the signal, and its calculation formula is as follows:
S F D R = 20 lg X a v g n i 20 lg X d i s t o r t i o n _ m a x
where X a v g n i corresponds to the input signal amplitude, X d i s t o r t i o n _ m a x corresponds to the maximum clutter signal amplitude.
(3) Signal–noise–distortion ratio: The signal–noise–distortion ratio (SINAD) is the ratio of the root mean square value of the signal to the root mean square value of the noise and distortion (NAD), and (14) and (15) are used to calculate SINAD and NAD.
S I N A D = A r m s N A D
N A D = X a v g m m ϵ S 0 M M 3
where S 0 is the set of all integers between 1 and M 1 , excluding the two values corresponding to the fundamental frequency and DC components.
(4) SNR: SNR is the ratio of signal to noise, and the following formula is used to calculate the SNR:
S N R = A r m s η
η = N A D 2 T H E
where η is the root mean square of the noise.
(5) Effective number of bits: ENOB is the nonlinear performance index of ADC, which represents the dynamic performance of ADC. The calculation formula of ENOB is as follows:
E N O B = log 2 S I N A D 1 2 log 2 1.5 log 2 A F S R / 2
where A is the amplitude of the sinusoidal test signal, and FSR is the full range of the ADC input.
(6) Cross-talk: It is the ratio of the root mean square of the cross-talk signal generated by the interference in a channel to the root mean square of the signal in the adjacent channel, which is an important indicator of the multi-channel DAC card. The calculation formula is as follows:
C r o s s t a l k = 1 M k = 0 M 1 X a v g k 2 1 2 1 M k = 0 M 1 X a v g k 2 1 2
where X a v g k is the average spectral amplitude of the test channel and X a v g k is the average spectral amplitude of the adjacent channels.

3.2.2. Experimental Methods and Results

It is a common method to test the dynamic performance of ADC by converting the sampled data from time domain to frequency domain and analyzing the signal by discrete Fourier transform [26]. In the experiment, a sinusoidal signal with a peak-to-peak value of 2V (ADC full scale 90 % peak-to-peak voltage signal) and a frequency of about 1 MHz is generated through a signal generator for collection and testing. In order to reduce the spectrum leakage in the Fourier transform process, this paper adopts the coherent average sampling method, and ensures the necessary conditions such as the same starting point and width of the coherent signal through the design of pre-triggering and sampling window [27]. In the experiment process, the sampling set is set to 3, each sampling point is sampled 1024, and then the detected signal is processed. At the same time, in order to reduce the small value error, The average spectral amplitude is used to calculate the subsequent dynamic parameters. The average spectral amplitude is calculated as follows:
X a v g j = 1 L X l j , j = 0 , 1 , 2 , , J 1
where L is the number of sample sets, J is the number of samples per sample set, X l j is the amplitude of j frequencies per sample set, and X a v g j is the average spectral amplitude of sample set. Thus, the standard deviation of the random error of X l j is L times that of X a v g j .
The average amplitude obtained from (20) is substituted into the calculation formula of the dynamic parameters of the ADC to obtain the dynamic parameters of the ADC. The dynamic parameters of all channels of the DAQ card are calculated and their average values are obtained, and the dynamic performance is compared with other 16-bit DAQ cards on the market. The comparison results are shown in Table 2. DAQ cards A, B, and C are 16-bit DAQ cards selected from different companies. DAQ card A is from Fanret Corporation; DAQ card B is ART PCIe-5640; DAQ card C is a ZTIC PL2180G. It can be seen that the dynamic performances of the DAQ cards mentioned in this article is very good.
The comparison of the system’s channel cross-talk with common multi-channel data acquisition systems on the market is shown in Table 3. The DAQ card D is ZFD10012A, which is a commercial 2-channel 100MSPS DAQ card; the DAQ card E is the M2i.49 from YXTEST Inc (Beijing, China).

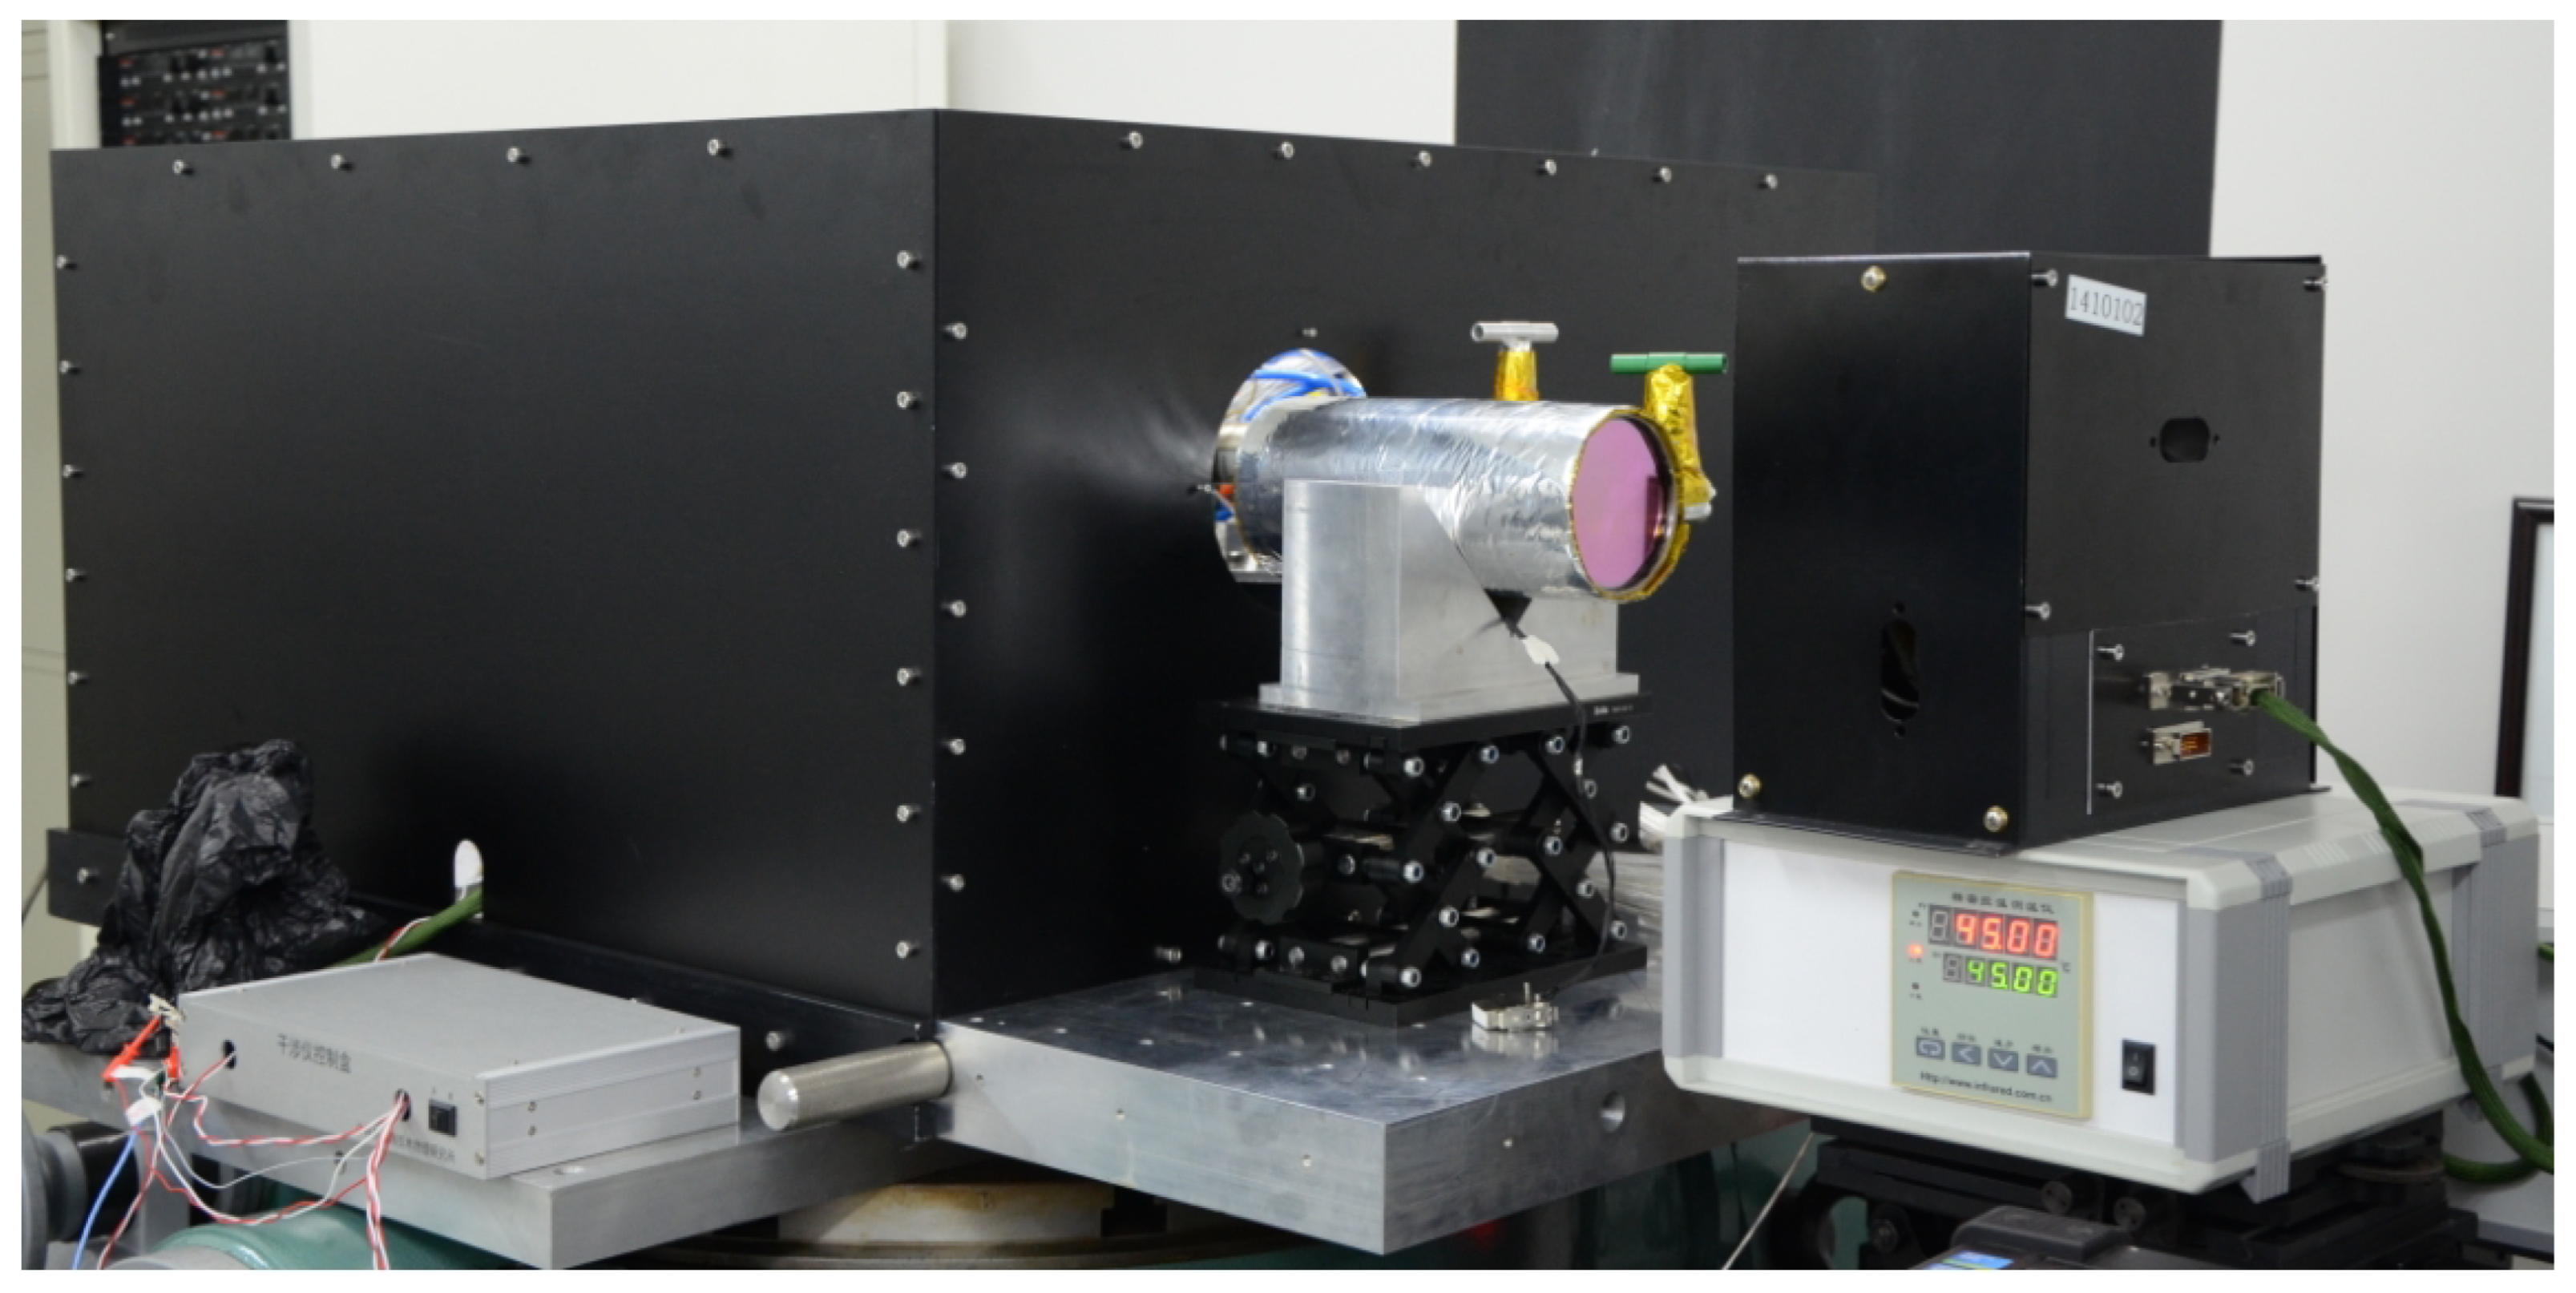
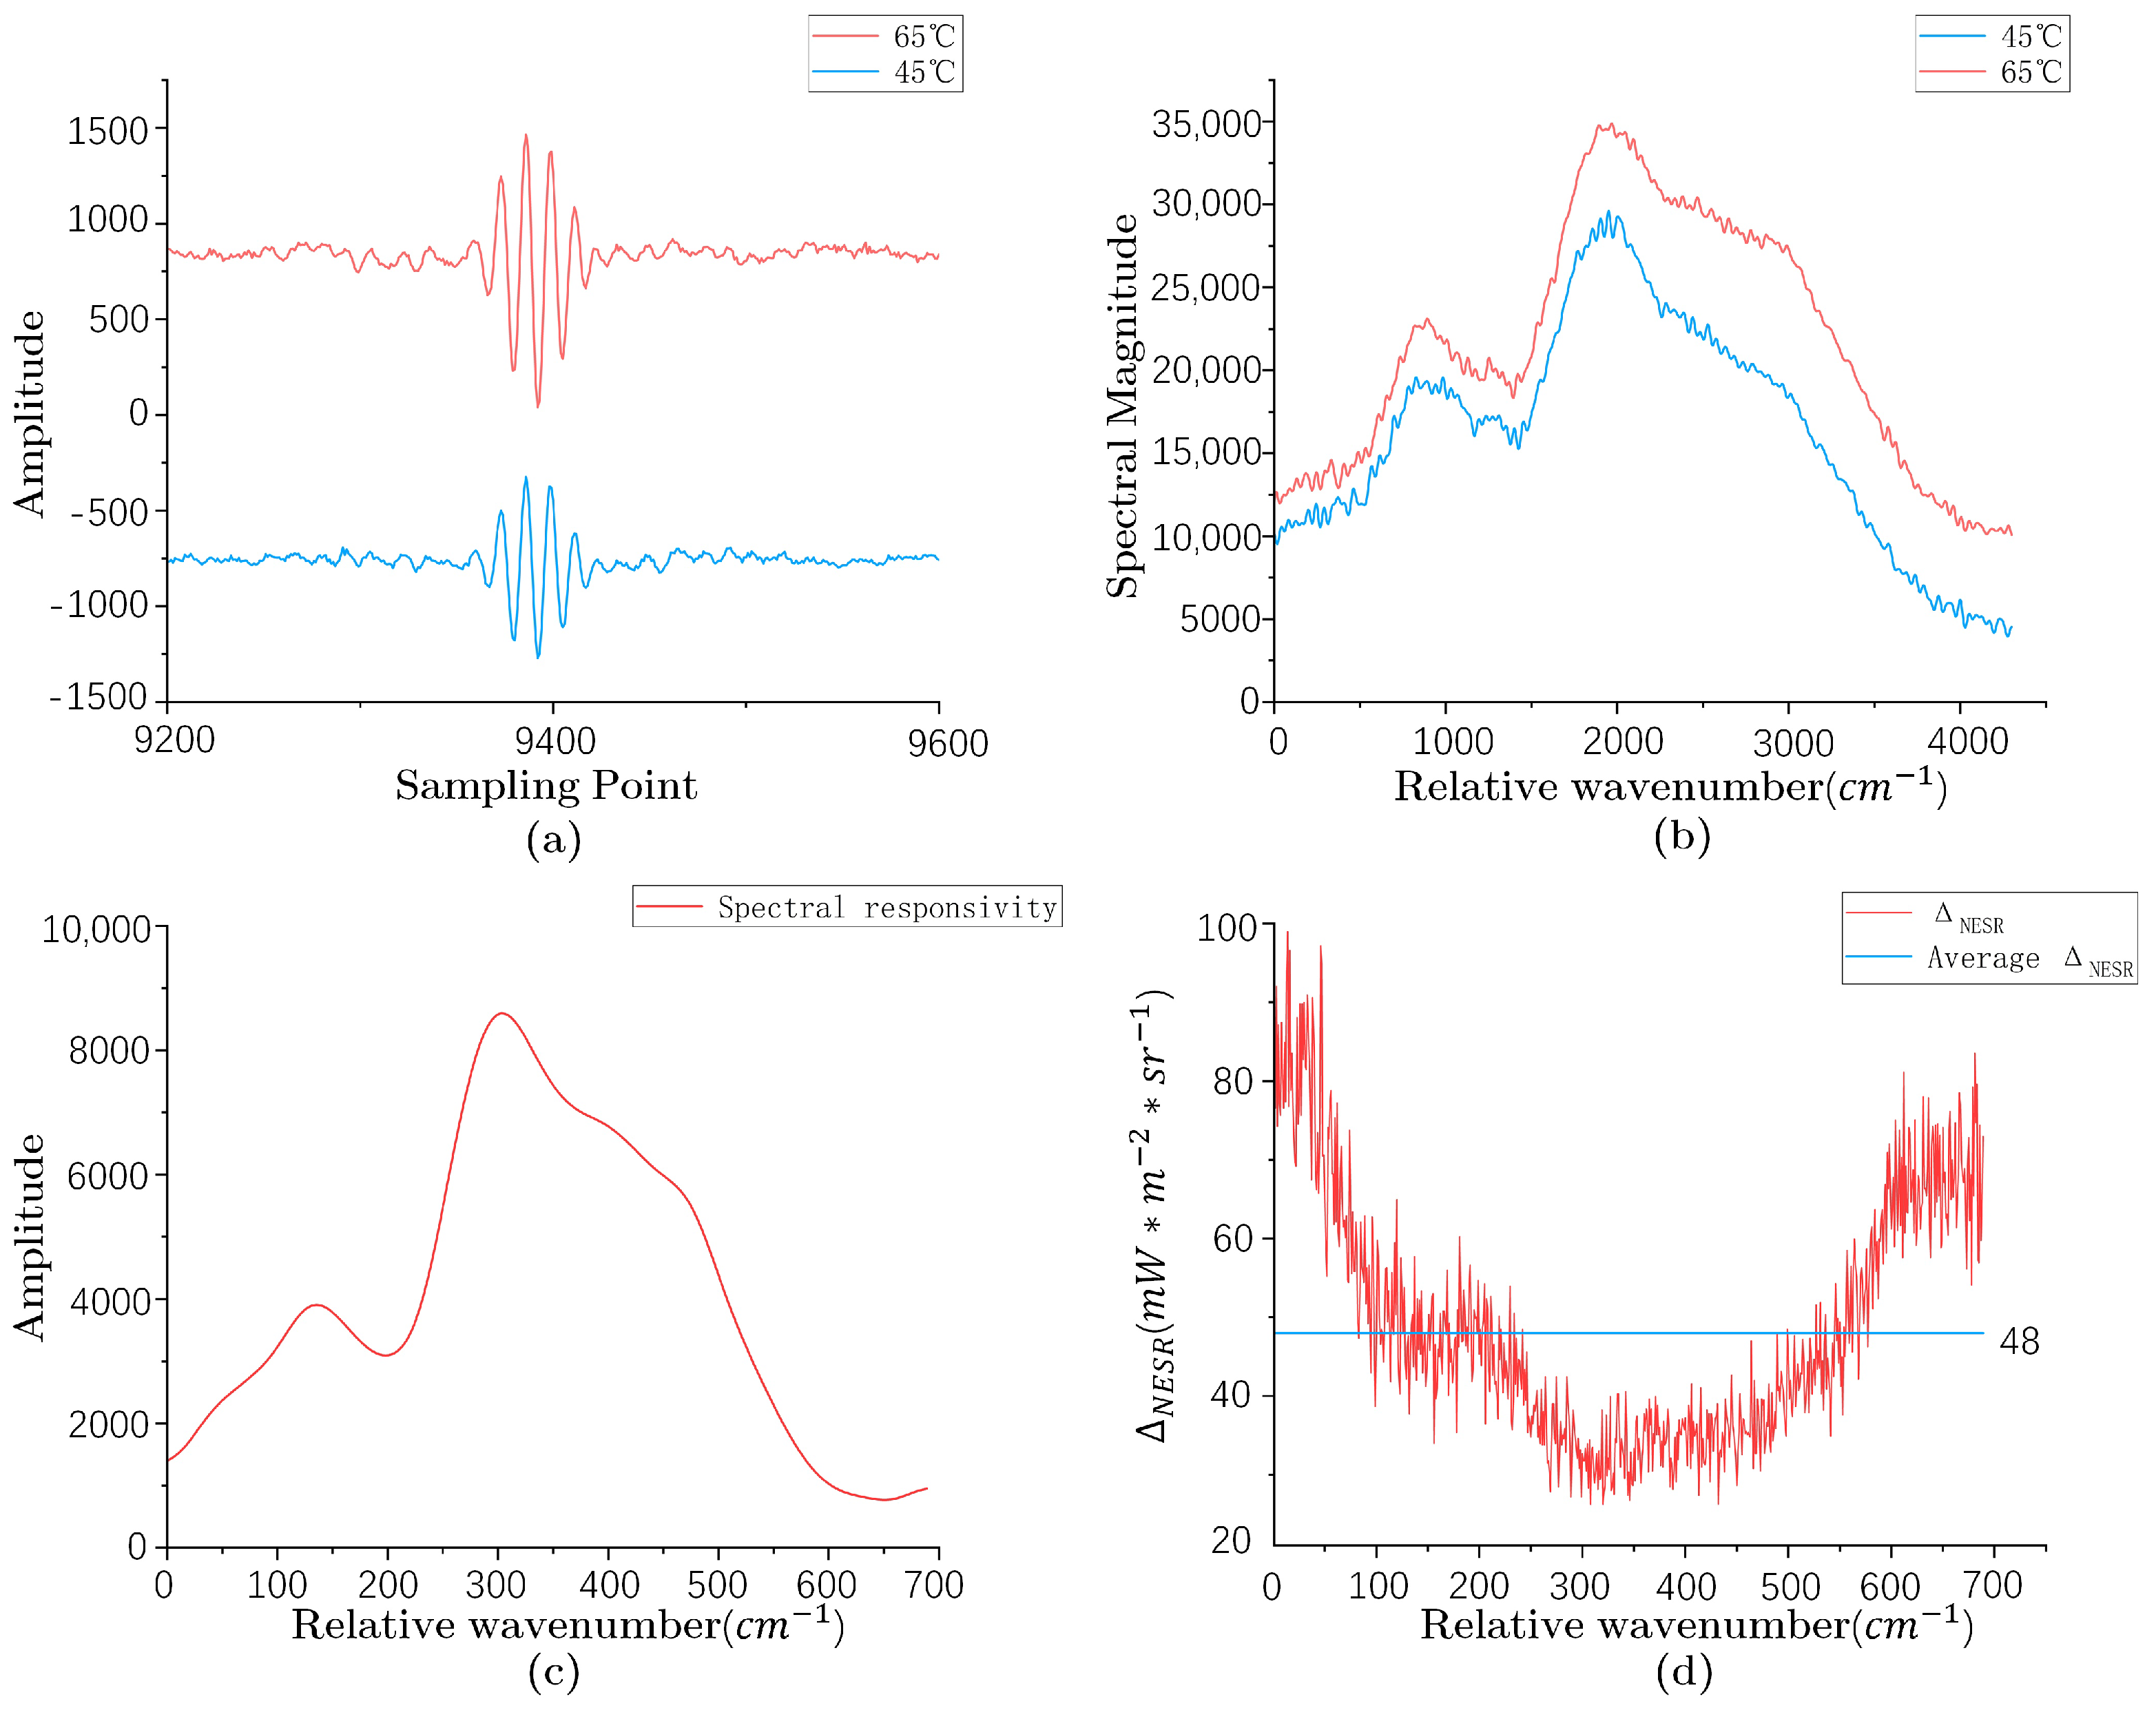
3.3. IRIFS System Performance Verification

There are two main performance indicators for space-borne IRIFS: spectral responsivity and noise-equivalent spectral radiance (NESR). The spectral response of the system refers to the sensitivity of the system to light radiation at different wavelengths or frequencies. It describes how efficiently a system detects or responds to light signals at different wavelengths. This response is critical in a variety of applications such as photodetectors, sensors, and imaging systems, where sensitivity to different wavelengths can affect overall performance [28,29]. The spectral response is usually represented as a graph showing the responsivity of the system as a function of wavelength or frequency. NESR is an important parameter in remote sensing and optical measurement. It represents the spectral radiance that produces a signal-to-noise ratio (SNR) of 1 in a particular optical detector or imaging system [30,31]. In other words, NESR represents the minimum detectable radiation level for a particular wavelength channel. It is an important metric for evaluating the sensitivity and performance of optical instruments. NESR takes into account both the noise characteristics of the detector and the spectral response of the system. This parameter helps to determine the ability of the instrument to distinguish weak signals from noise in practical applications.
Since the experimental test is carried out in a non-vacuum environment, it is generally believed that the radiation spectrum information obtained by the system is the result of the spectral signal added by the system response and the background of the laboratory environment. Two groups of different interferogram data can be obtained by two different blackbody radiation sources of high temperature (HT) and low temperature (LT), respectively. The spectral response can be obtained after the background radiation is canceled through the subtraction operation. The field test diagram of IRIFS system is shown in Figure 12. In the laboratory, the HFY-300A blackbody was used as the light source, and the blackbody temperature was set as T1 = 45 °C and T2 = 65 °C respectively. The interferograms were recorded at the two temperature points, respectively, and the spectrograms were obtained by inversion of the interferograms. Spectral radiation measurement curves C H v s . and C L v s . at T1 and T2 temperatures, respectively, were obtained after data fitting. Set S H v s . and S L v s . as blackbody theoretical radiation spectra at temperatures T1 and T2, respectively; this can be calculated using Planck’s Formulas (21) and (22); additionally, this is used to calculate the spectral response of the system.
S T v s . = 8 π h c v 5 e T h c v k 1
R v s . = C H v s . C L v s . S H v s . S L v s .
where R v s . is the spectral response, S T v s . is Planck’s formula, k is Boltzmann’s constant, h is Planck’s constant, and T is the blackbody Fahrenheit temperature.
In the laboratory environment, the performance of the DAQ card is usually evaluated by parameters such as signal-to-noise ratio. However, for the IRIFS system, after the interferometric data is converted into spectral data, the signal-to-noise ratio of the acquired spectral signal will change greatly due to the strong radiation or absorption line in the spectrum, which may be several orders of magnitude. Therefore, the noise level of the signal acquisition system of the Fourier spectrometer is usually evaluated by the noise-equivalent spectral radiance (NESR), whose unit is consistent with the unit of the spectral radiance, and is mW m 2 sr 1 . Considering the effect of laboratory background noise, we defined Δ N E S R to evaluate the system performance, assuming that M times of spectral data are acquired, Δ N E S R can be calculated as follows:
N E S R v s . = 1 M i = 1 M X i v s . X v s . ¯ R v s . 2
Δ N E S R = N E S R + B ,
where is the X i v s . spectrum diagram obtained by Fourier transform of the interferometric data collected from the infrared interferometric signal at the ith time, X v ¯ is the mean value of the M times spectrum, R v s . is the spectral response rate, and B is the laboratory background noise.
In this experiment, both long-wave and medium-wave infrared radiation were tested, and one pixel out of 1024 pixels was randomly selected for display. In order to eliminate the accidental effect of single acquisition and random noise, 200 interferometric data points were collected for each group to meet the requirements of obtaining the system response coefficient. Two sets of average interference data at high temperature and low temperature can be calculated, and the corresponding spectral images C H v and C L v can be obtained by Fourier transform, and then the spectral response rate and noise-equivalent spectral radiation can be calculated. Figure 13 shows the system performance parameter data of a pixel randomly selected from the long-wave data in 45 °C and 65 °C environments. In one observation time, the Δ N E S R value is basically kept below 90 mW m 2 sr 1 . In the very long wave band, the average Δ N E S R value of the measured spectrometer can be kept at about 48 mW m 2 sr 1 . Figure 14 shows the system performance parameter data of a pixel randomly selected from the medium-wave data under the 45 °C and 65 °C environments. In one observation time, the Δ N E S R value of the spectrometer is basically kept below 20 mW m 2 sr 1 . In the medium-wave band, the mean value of the Δ N E S R measured by the spectrometer can be maintained at about 12.3 mW m 2 sr 1 . The above experiments verify the accuracy of the space-borne IRIFS, and also verify the feasibility and good performance of the multi-channel high-speed hardware filtering acquisition system designed in this paper in the high-speed signal acquisition of the IRIFS.

4. Conclusions

A multi-channel high-speed acquisition system is proposed for real-time acquisition of large-scale interferometric signals generated by space-borne IRIFS. The system uses a signal conditioning circuit and a high-performance ADC circuit to realize a high sampling rate of 125 Msps/Ch. Hardware filters are used to suppress the overshoot and ringing caused by spatial noise interference and other reasons, so as to improve the signal quality and the SNR of the system. At the same time, the high data throughput of the system is analyzed. The multi-channel high-speed acquisition system also has good dynamic performance: SNR and SFDR can reach 72.7 dB and 84.0 dB, respectively, SINAD can reach 72.1 dB, ENOB can reach 11.7bits, and multi-channel cross-talk can reach −81.6 dB. At the same time, the system performance of the IRIFS acquisition system is also outstanding, with the average long-wave Δ N E S R reaching 48 mW m 2 sr 1 and the average medium-wave Δ N E S R reaching 12.3 mW m 2 sr 1 . In short, the multi-channel high-speed acquisition system proposed in this paper successfully realizes the high-speed acquisition and transmission of large-scale interferometric signals. For further research, there will be an increasing demand for big data in the field of meteorology with the advent of the big data era. The expanded array of focal plane infrared detectors and higher frequency signals also necessitate a corresponding acquisition system with enhanced capabilities for high-speed and reliable signal acquisition and data transmission. Additionally, effectively suppressing the influence of spatial noise and other external factors has become a key focus for future investigations as signal frequencies continue to rise.

Author Contributions

Literature survey and conceptualization, J.H.; experiments, J.H.; literature review, J.H., Y.C., J.S. and Y.L.; data collection, J.H. and Y.C.; data analysis, J.H., Y.C., R.C., M.G. and Z.W. Writing—manuscript preparation, J.H.; writing—review and editing, Z.X., R.C. and J.H.; Z.X. and R.C. organized the project, analyzed the results, and prepared the manuscript. All authors have read and agreed to the published version of the manuscript.

Funding

This work was partially supported by the National Key Research and Development Program of China (2023YFB3900189), the National Key Research and Development Program of China (2018YFB0504700), China’s National Key Special Earth Observation and Navigation Project “Atmospheric radiation hyper-spectral detection technology”, Ministry of Science and Technology of the People’s Republic of China (MOST) (YFB0500600) and Mid-infrared Observation System for Accurate Measurement of Solar Magnetic Field, National Natural Science Foundation of China (No. 11427901).

Data Availability Statement

Data are contained within the article.

Conflicts of Interest

The authors declare no conflicts of interest.

References

  1. Guo, Q.; Yang, J.; Wei, C.; Chen, B.; Wang, X.; Han, C.; Hui, W.; Xu, W.; Wen, R.; Liu, Y. Spectrum calibration of the first hyper-spectral infrared measurements from a geostationary platform: Method and preliminary assessment. Q. J. R. Meteorol. Soc. 2021, 147, 1562–1583. [Google Scholar] [CrossRef]
  2. Feng, J.; Qin, X.; Wu, C.; Zhang, P.; Yang, L.; Shen, X.; Han, W.; Liu, Y. Improving typhoon predictions by assimilating the retrieval of atmospheric temperature profiles from the FengYun-4A’s Geostationary Interferometric Infrared Sounder (GIIRS). Atmos. Res. 2022, 280, 106391. [Google Scholar] [CrossRef]
  3. Di, D.; Li, J.; Han, W.; Bai, W.; Wu, C.; Menzel, W.P. Enhancing the fast radiative transfer model for fengyun-4 giirs by using local training profiles. J. Geophys. Res. Atmos. 2018, 123, 12–583. [Google Scholar] [CrossRef]
  4. Hua, J.; Wang, Z.; Duan, J.; Li, L.; Zhang, C.; Wu, X.; Fan, Q.; Chen, R.; Sun, X.; Zhao, L.; et al. Review of geostationary interferometric infrared sounder. Chin. Opt. Lett. 2018, 16, 111203. [Google Scholar]
  5. Yin, R.; Han, W.; Gao, Z.; Li, J. Impact of high temporal resolution FY-4A Geostationary Interferometric Infrared Sounder (GIIRS) radiance measurements on Typhoon forecasts: Maria (2018) case with GRAPES global 4D-Var assimilation system. Geophys. Res. Lett. 2021, 48, e2021GL093672. [Google Scholar] [CrossRef]
  6. Clarisse, L.; Van Damme, M.; Hurtmans, D.; Franco, B.; Clerbaux, C.; Coheur, P.F. The diel cycle of NH3 observed from the FY-4A Geostationary Interferometric Infrared Sounder (GIIRS). Geophys. Res. Lett. 2021, 48, e2021GL093010. [Google Scholar] [CrossRef]
  7. Cai, X.; Bao, Y.; Petropoulos, G.P.; Lu, F.; Lu, Q.; Zhu, L.; Wu, Y. Temperature and humidity profile retrieval from FY4-GIIRS hyperspectral data using artificial neural networks. Remote Sens. 2020, 12, 1872. [Google Scholar] [CrossRef]
  8. Ma, Z.; Li, J.; Han, W.; Li, Z.; Zeng, Q.; Menzel, W.P.; Schmit, T.J.; Di, D.; Liu, C.Y. Four-dimensional wind fields from geostationary hyperspectral infrared sounder radiance measurements with high temporal resolution. Geophys. Res. Lett. 2021, 48, e2021GL093794. [Google Scholar] [CrossRef]
  9. Gong, X.; Li, Z.; Li, J.; Moeller, C.C.; Cao, C.; Wang, W.; Menzel, W.P. Intercomparison between VIIRS and CrIS by taking into account the CrIS subpixel cloudiness and viewing geometry. J. Geophys. Res. Atmos. 2018, 123, 5335–5345. [Google Scholar] [CrossRef]
  10. Wang, L.; Tremblay, D.A.; Han, Y.; Esplin, M.; Hagan, D.E.; Predina, J.; Suwinski, L.; Jin, X.; Chen, Y. Geolocation assessment for CrIS sensor data records. J. Geophys. Res. Atmos. 2013, 118, 12–690. [Google Scholar] [CrossRef]
  11. Zhou, D.K.; Smith, W.L., Sr.; Bingham, G.E.; Huppi, R.J.; Revercomb, H.E.; Zollinger, L.J.; Elwell, J.D.; Larar, A.M.; Liu, X.; Tansock, J.J., Jr.; et al. Ground-based measurements with the Geosynchronous Imaging Fourier Transform Spectrometer (GIFTS) engineering demonstration unit-experiment description and first results. J. Appl. Remote Sens. 2007, 1, 013528. [Google Scholar]
  12. Hurtmans, D.; Coheur, P.F.; Wespes, C.; Clarisse, L.; Scharf, O.; Clerbaux, C.; Hadji-Lazaro, J.; George, M.; Turquety, S. FORLI radiative transfer and retrieval code for IASI. J. Quant. Spectrosc. Radiat. Transf. 2012, 113, 1391–1408. [Google Scholar] [CrossRef]
  13. Bouillon, M.; Safieddine, S.; Hadji-Lazaro, J.; Whitburn, S.; Clarisse, L.; Doutriaux-Boucher, M.; Coppens, D.; August, T.; Jacquette, E.; Clerbaux, C. Ten-year assessment of IASI radiance and temperature. Remote Sens. 2020, 12, 2393. [Google Scholar] [CrossRef]
  14. Camps-Valls, G.; Munoz-Mari, J.; Gomez-Chova, L.; Guanter, L.; Calbet, X. Nonlinear statistical retrieval of atmospheric profiles from MetOp-IASI and MTG-IRS infrared sounding data. IEEE Trans. Geosci. Remote Sens. 2011, 50, 1759–1769. [Google Scholar] [CrossRef]
  15. Bekker, D.L.; Blavier, J.F.L.; Fu, D.; Key, R.W.; Manatt, K.S.; McKinney, C.; Rider, D.M.; Sander, S.P.; Werne, T.A.; Wu, A.C.; et al. Command and data handling system for the Panchromatic Fourier Transform Spectrometer. In Proceedings of the 2012 IEEE Aerospace Conference, Big Sky, MT, USA, 3–10 March 2012; IEEE: Piscataway, NJ, USA, 2012; pp. 1–10. [Google Scholar]
  16. Tămaş-Selicean, D.; Keymeulen, D.; Berisford, D.; Carlson, R.; Hand, K.; Pop, P.; Wadsworth, W.; Levy, R. Fourier transform spectrometer controller for partitioned architectures. In Proceedings of the 2013 IEEE Aerospace Conference, Big Sky, MT, USA, 2–9 March 2013; IEEE: Piscataway, NJ, USA, 2013; pp. 1–11. [Google Scholar]
  17. Yiu, P.; Iturbe, X.; Keymeulen, D.; Berisford, D.; Hand, K.; Carlson, R.; Wadsworth, W.; Dybwad, J.P.; Levy, R. Adaptive controller for a Fourier Transform Spectrometer with space applications. In Proceedings of the 2015 IEEE Aerospace Conference, Big Sky, MT, USA, 7–14 March 2015; IEEE: Piscataway, NJ, USA, 2015; pp. 1–7. [Google Scholar]
  18. Gao, C.; Mao, J.; Chen, R. Correction of interferogram data acquired using a focal plane FT-IR spectrometer system. Appl. Opt. 2018, 57, 2434–2440. [Google Scholar] [CrossRef] [PubMed]
  19. Shen, Q.; Liu, Y.; Chen, R.; Xu, Z.; Zhang, Y.; Chen, Y.; Huang, J. The Atmospheric Vertical Detection of Large Area Regions Based on Interference Signal Denoising of Weighted Adaptive Kalman Filter. Sensors 2022, 22, 8724. [Google Scholar] [CrossRef]
  20. Xie, D.; Xu, C.; Wang, A.M. Michelson interferometer for measuring temperature. Phys. Lett. A 2017, 381, 3038–3042. [Google Scholar] [CrossRef]
  21. Huang, Y.; Duan, J.; Guo, Q.; Wang, Z.; Hua, J. Based on the Feedforward Inputs Obtained by the Intelligent Algorithm the Moving Mirror Control System of the Fourier Transform Spectrometer. Electronics 2023, 12, 4568. [Google Scholar] [CrossRef]
  22. Hao, L.; Huang, A.; Xie, X.; Li, H.; Lai, C.; Chen, H.; Wei, Y.; Ding, R. 32 × 32 very long wave infrared HgCdTe FPAs. Infrared Laser Eng. 2017, 46, 504001. [Google Scholar]
  23. Mahata, S.; Herencsar, N.; Kubanek, D. Optimal approximation of fractional-order Butterworth filter based on weighted sum of classical Butterworth filters. IEEE Access 2021, 9, 81097–81114. [Google Scholar] [CrossRef]
  24. Carini, A.; Sicuranza, G.L. A study about Chebyshev nonlinear filters. Signal Process. 2016, 122, 24–32. [Google Scholar] [CrossRef]
  25. Soni, A.; Gupta, M. Analysis and design of optimized fractional order low-pass Bessel filter. J. Circuits Syst. Comput. 2021, 30, 2150035. [Google Scholar] [CrossRef]
  26. Schell, B.; Tsividis, Y. Analysis and simulation of continuous-time digital signal processors. Signal Process. 2009, 89, 2013–2026. [Google Scholar] [CrossRef]
  27. Kimura, M.; Minegishi, A.; Kobayashi, K.; Kobayashi, H. A new coherent sampling system with a triggered time interpolation. IEICE Trans. Fundam. Electron. Commun. Comput. Sci. 2001, 84, 713–719. [Google Scholar]
  28. Zonca, A.; Franceschet, C.; Battaglia, P.; Villa, F.; Mennella, A.; D’Arcangelo, O.; Silvestri, R.; Bersanelli, M.; Artal, E.; Butler, R.; et al. Planck-LFI radiometers’ spectral response. J. Instrum. 2009, 4, T12010. [Google Scholar] [CrossRef]
  29. Bliss, M.; Smith, A.; Betts, T.R.; Baker, J.; De Rossi, F.; Bai, S.; Watson, T.; Snaith, H.; Gottschalg, R. Spectral response measurements of perovskite solar cells. IEEE J. Photovoltaics 2018, 9, 220–226. [Google Scholar] [CrossRef]
  30. Silny, J.F.; Zellinger, L. Radiometric sensitivity contrast metrics for spectral remote sensors. Opt. Eng. 2017, 56, 081807. [Google Scholar] [CrossRef]
  31. Renhorn, I.G.; Svensson, T.; Boreman, G.D. Performance of an uncooled imaging interferometric spectrometer with intrinsic background radiation. Opt. Eng. 2008, 60, 033106. [Google Scholar] [CrossRef]
Figure 1. (a) Physical connection diagram of IRIFS acquisition system. (b) IRIFS acquisition system structure block diagram.
Electronics 13 00370 g001
Figure 2. Output signal diagram of 32 × 32 pixel HgCdTe FPA detector.
Electronics 13 00370 g002
Figure 3. (a) The physical picture of multi-channel high-speed DAQ card. (b) The structure block diagram of multi-channel high-speed DAQ card.
Electronics 13 00370 g003
Figure 4. Design of interferometric signal front-end processing circuit.
Electronics 13 00370 g004
Figure 5. Schematic diagram of single-channel 128 pixel step wave overshoot and ringing.
Electronics 13 00370 g005
Figure 6. Circuit schematic diagram of the four-channel Butterworth low-pass filter.
Electronics 13 00370 g006
Figure 7. ADC functional block diagram.
Electronics 13 00370 g007
Figure 8. High-speed data transmission network diagram.
Electronics 13 00370 g008
Figure 9. (a) Amplitude-frequency characteristics of the Butterworth, Chebyshev and Bessel filters. (b) Gain patterns of Butterworth low-pass filters of order one-six.
Electronics 13 00370 g009
Figure 10. The simulation verification diagram of the 5th order Butterworth low-pass filter: (a) Continuous frequency response plot. (b) continuous time response plot. (c) continuous S-parameter plot. (d) Prototype pole-zero diagram.
Electronics 13 00370 g010
Figure 11. Comparison of 128 pixel step wave in a single channel: (a) Single-channel 128-pixel step wave without Butterworth filter. (b) Single-channel 128-pixel step wave diagram with Butterworth filter.
Electronics 13 00370 g011
Figure 12. Field test diagram of IRIFS system.
Electronics 13 00370 g012
Figure 13. System performance parameter plot of a randomly selected pixel from 1024 pixels of the long-wave FPA detector: (a) 45 °C, 65 °C interferograms; (b) 45 °C, 65 °C spectrogram; (c) spectral responsivity plot of this pixel; (d) Δ N E S R diagram of this pixel.
Electronics 13 00370 g013
Figure 14. System performance parameter plot of a randomly selected pixel from 1024 pixels of the medium-wave FPA detector: (a) 45 °C, 65 °C interferograms; (b) 45 °C, 65 °C spectrogram; (c) spectral responsivity plot of this pixel; (d) Δ N E S R diagram of this pixel.
Electronics 13 00370 g014
Table 1. Normalized Butterworth polynomial table.
nButterworth Polynomials
1 s ¯ + 1
2 s ¯ 2 + 2 s ¯ + 1
3 s ¯ 3 + 2 s ¯ 2 + 2 s ¯ + 1
4 s ¯ 4 + 2.613 s ¯ 3 + 3.414 s ¯ 2 + 2.613 s ¯ + 1
5 s ¯ 5 + 3.236 s ¯ 4 + 5.236 s ¯ 3 + 5.236 s ¯ 2 + 3.263 s ¯ + 1
Table 2. Comparison of dynamic performance of 16-bit DAQ cards.
Performance
Index
DAQ Card
A
DAQ Card
B
DAQ Card
C
Current
DAQ Card
THD (dB)78.072.868.280.8
SNR (dB)66.96463.572.7
SFDR (dB)747072.484.0
SINAD (dB)65-6372.1
ENOB (bits)10.810.510.211.7
Table 3. Cross-talk comparison of multi-channel DAQ cards.
Performance
Index
DAQ Card
D
DAQ Card
E
Current
DAQ Card
Cross-talk (dB)−80−76−81.6
Disclaimer/Publisher’s Note: The statements, opinions and data contained in all publications are solely those of the individual author(s) and contributor(s) and not of MDPI and/or the editor(s). MDPI and/or the editor(s) disclaim responsibility for any injury to people or property resulting from any ideas, methods, instructions or products referred to in the content.

