
A Management Framework and Optimization Scheduling for Electric Vehicles Participating in a Regional Power Grid Demand Response under Battery Swapping Mode


Abstract
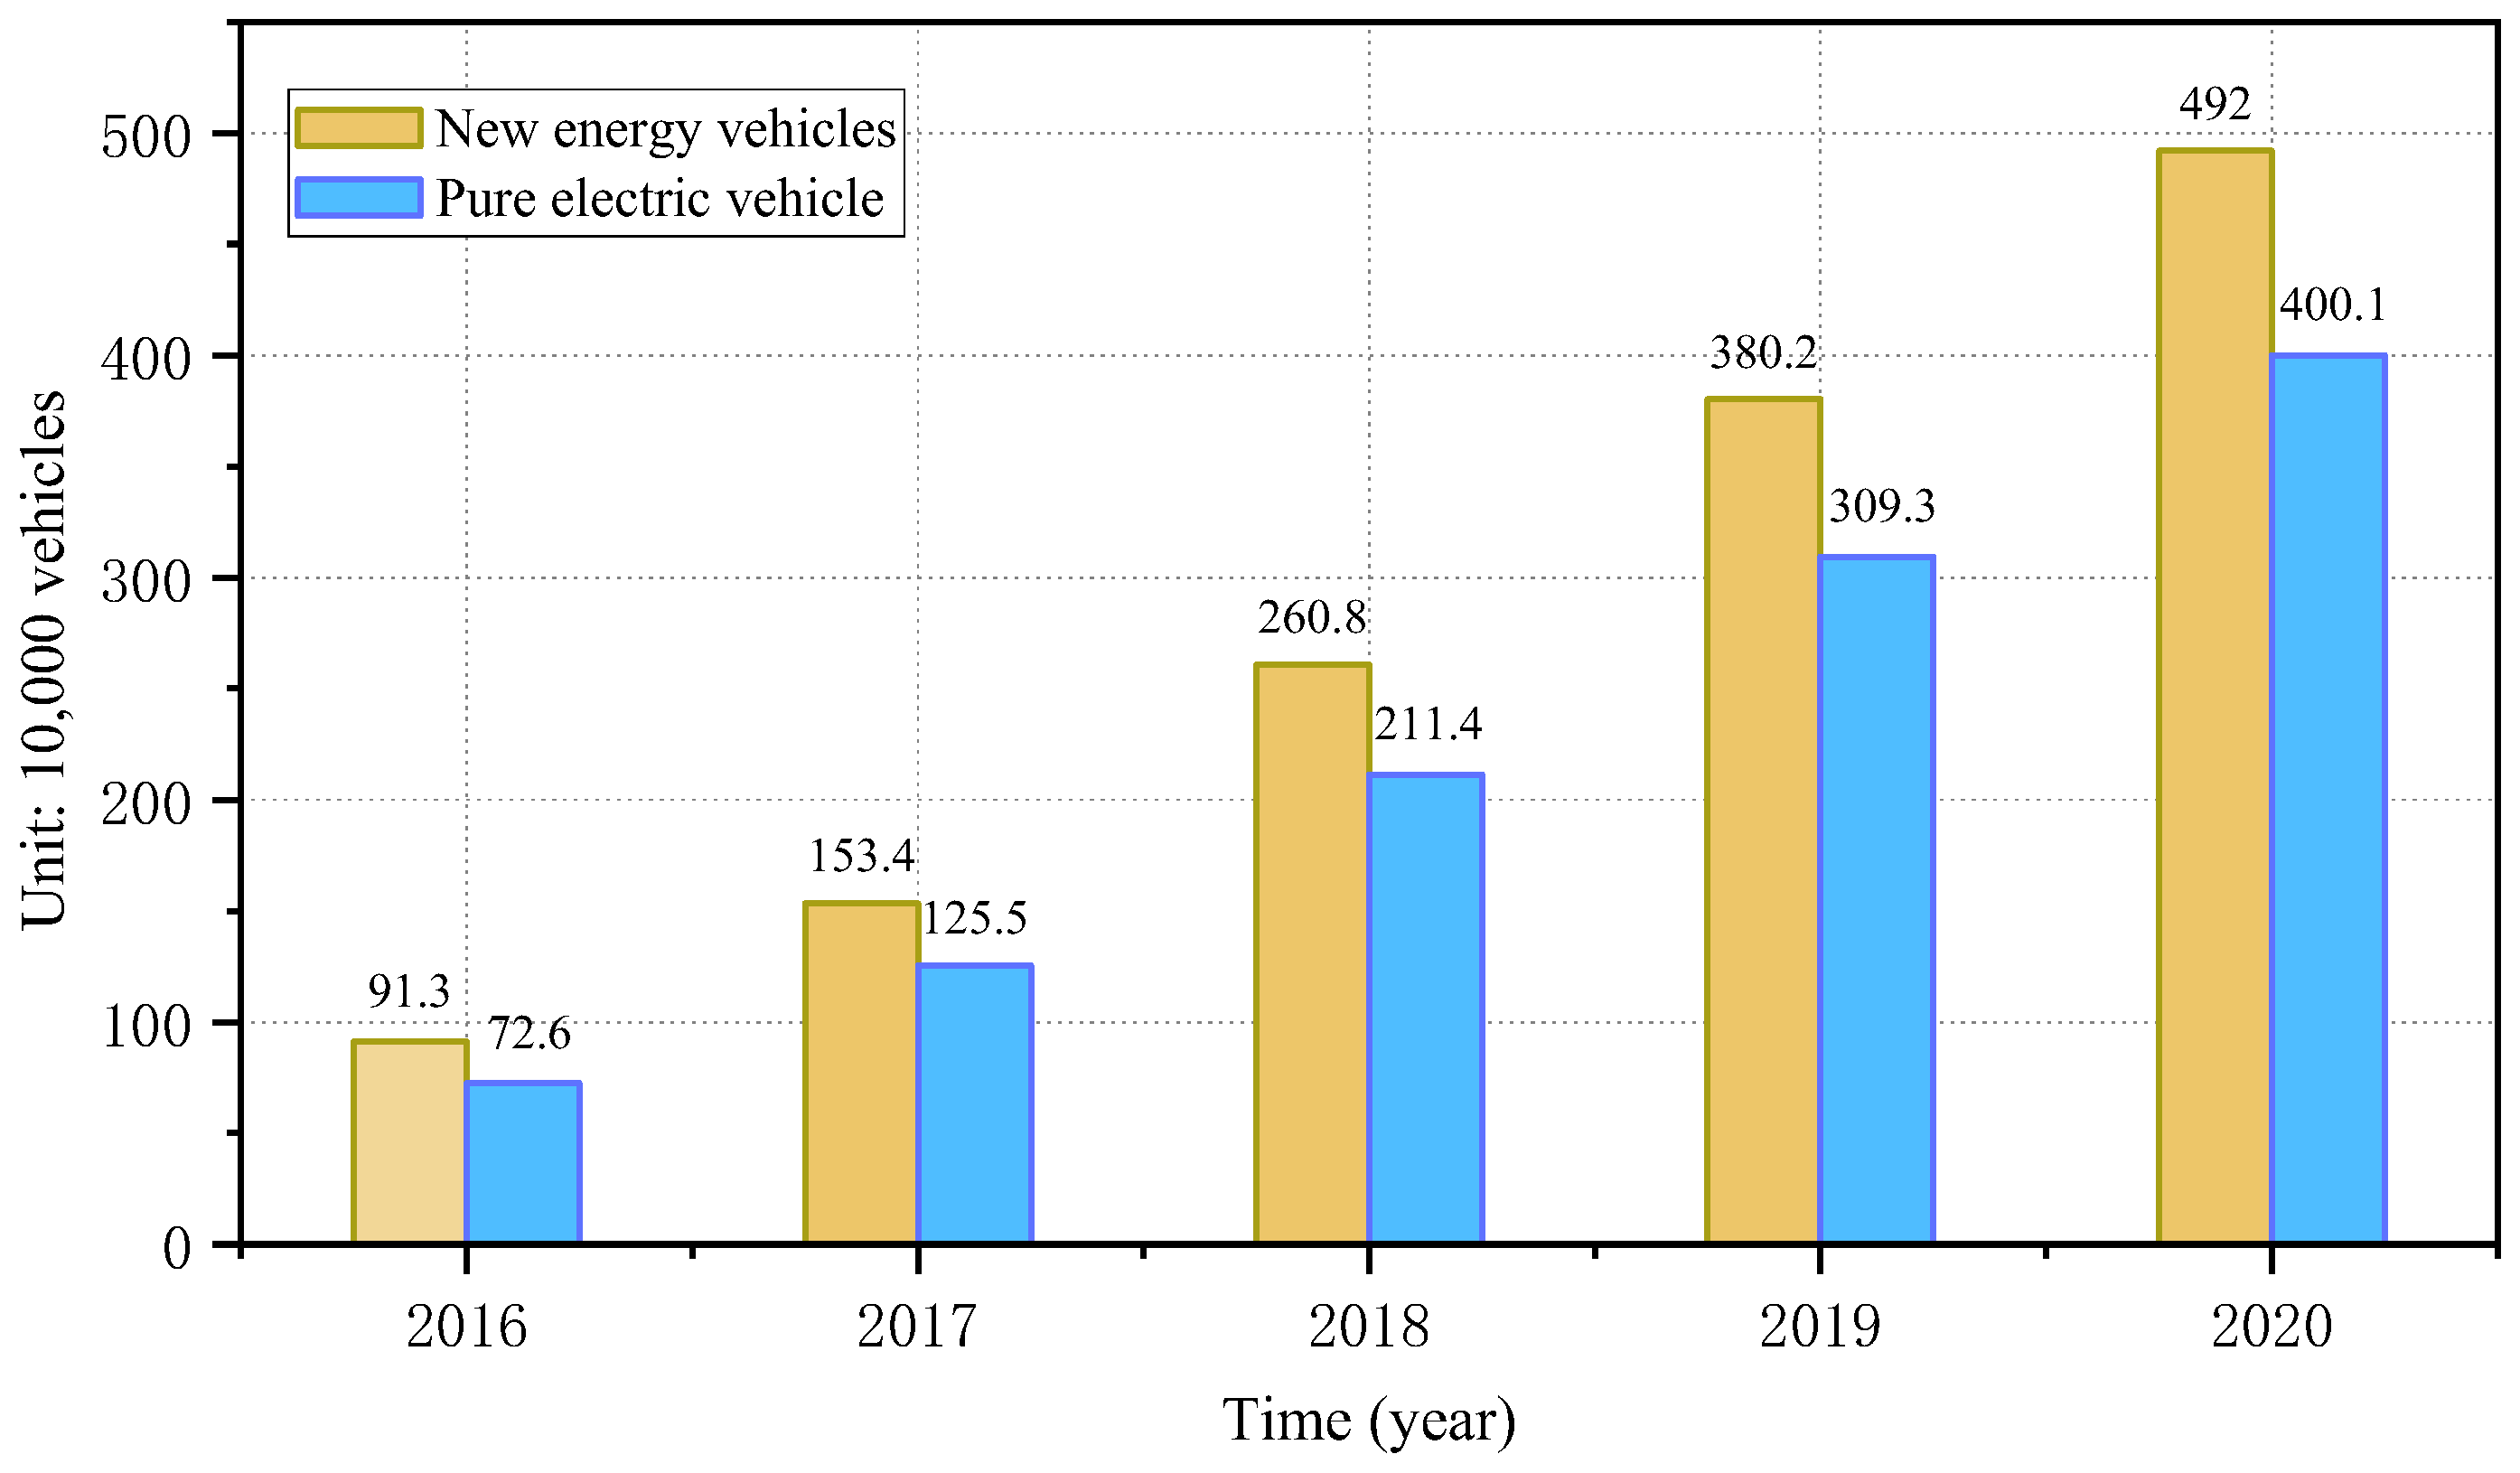
:1. Introduction
- (1)
- Different time series analysis models for swapping mode states were constructed.
- (2)
- Optimal scheduling model for electric vehicles in the battery swapping mode was proposed.
- (3)
- The impact of power battery charging load on the regional grid was analyzed.
- (4)
- Research can help the grid balance the contradiction between supply and demand in peaks and valleys and promote the consumption of new energy.
2. Current State of Knowledge
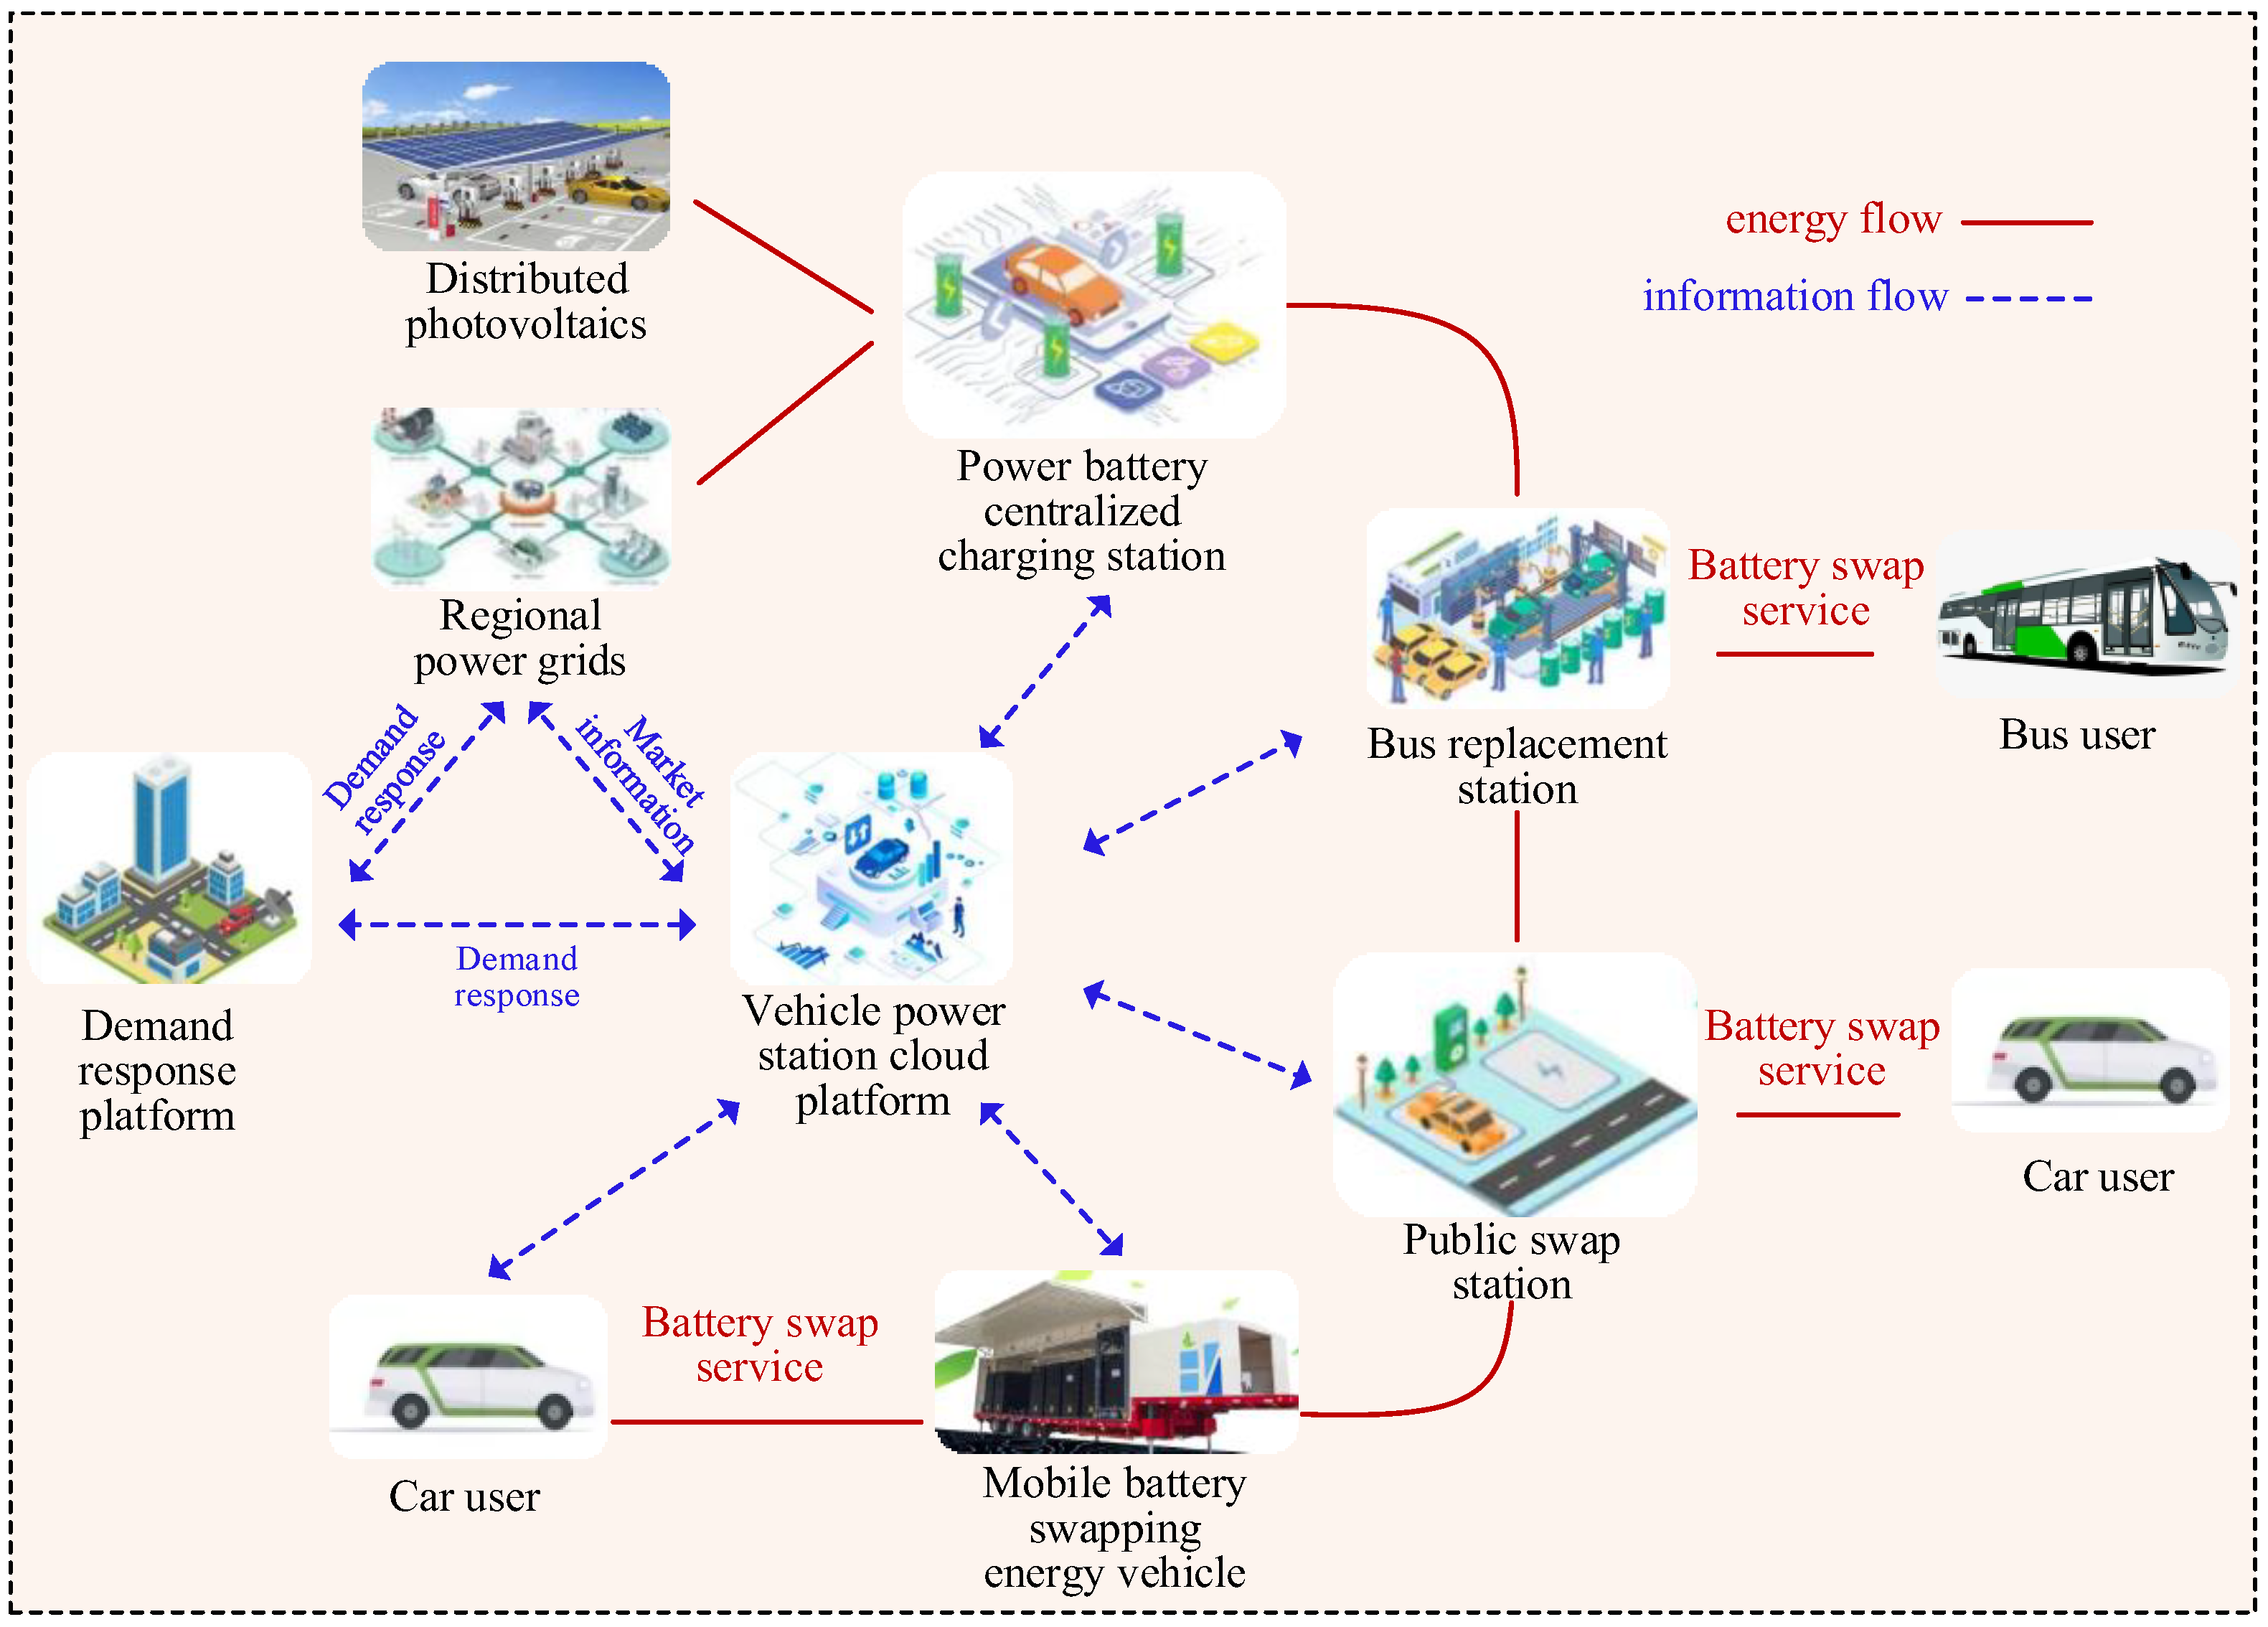
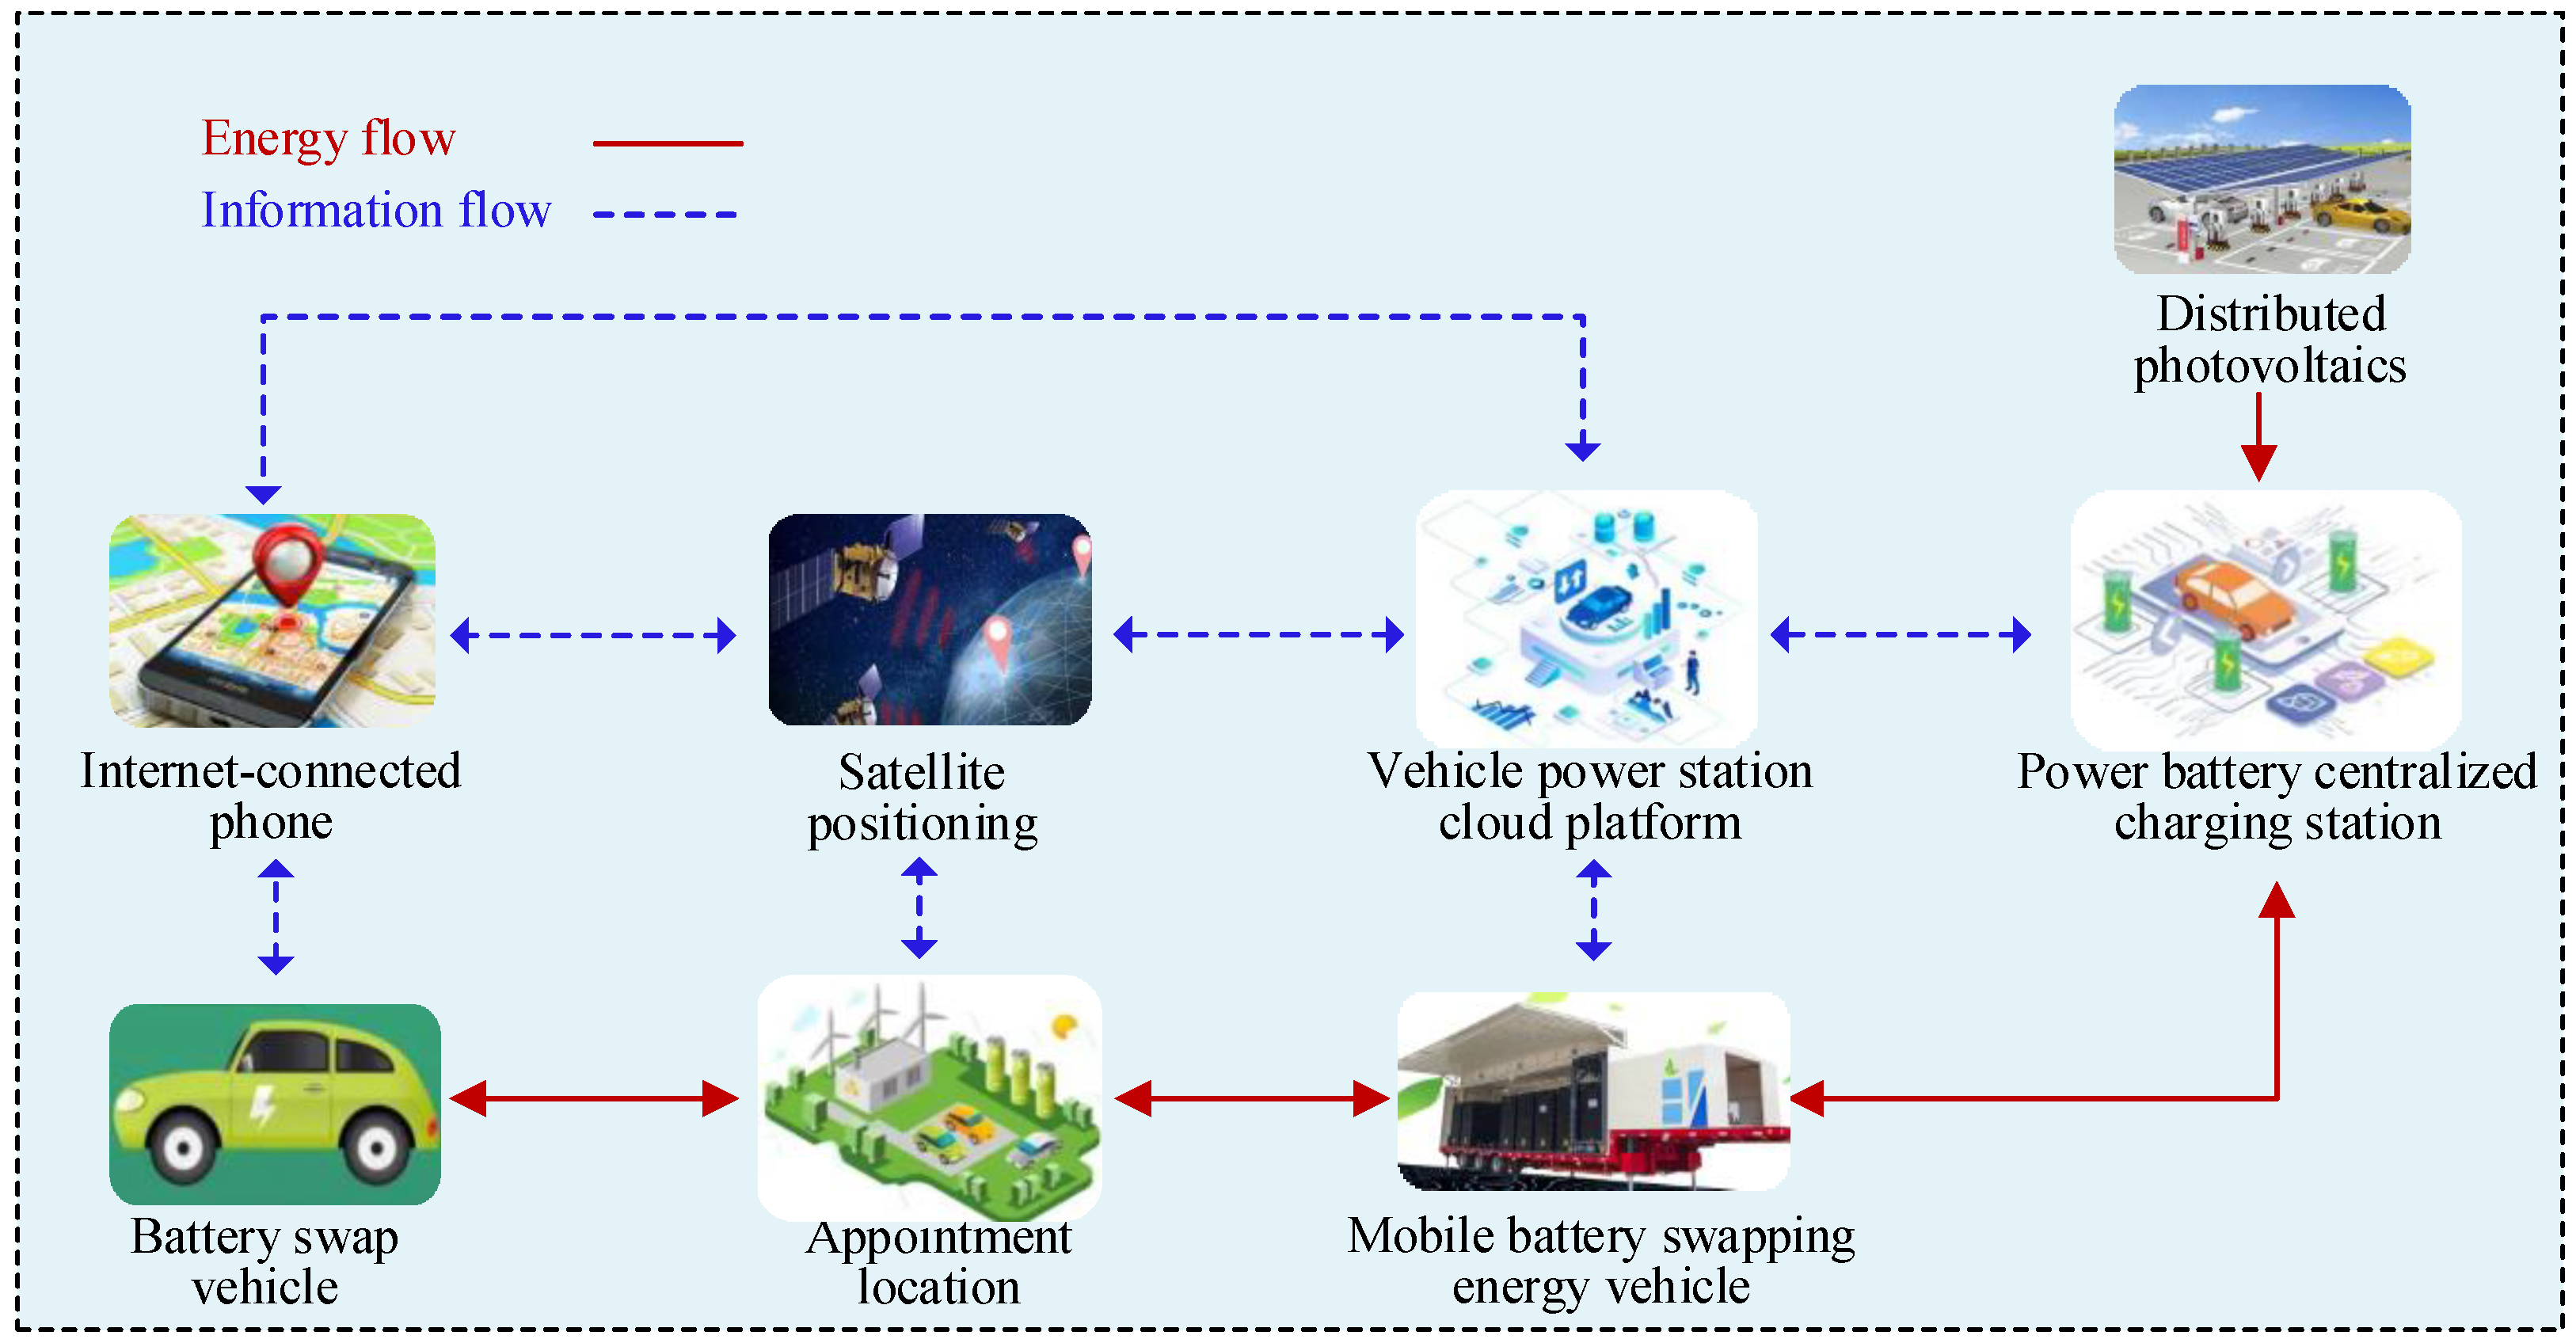
3. Framework Design
4. Time Series Analysis Model of Electric Vehicle Battery Swapping State
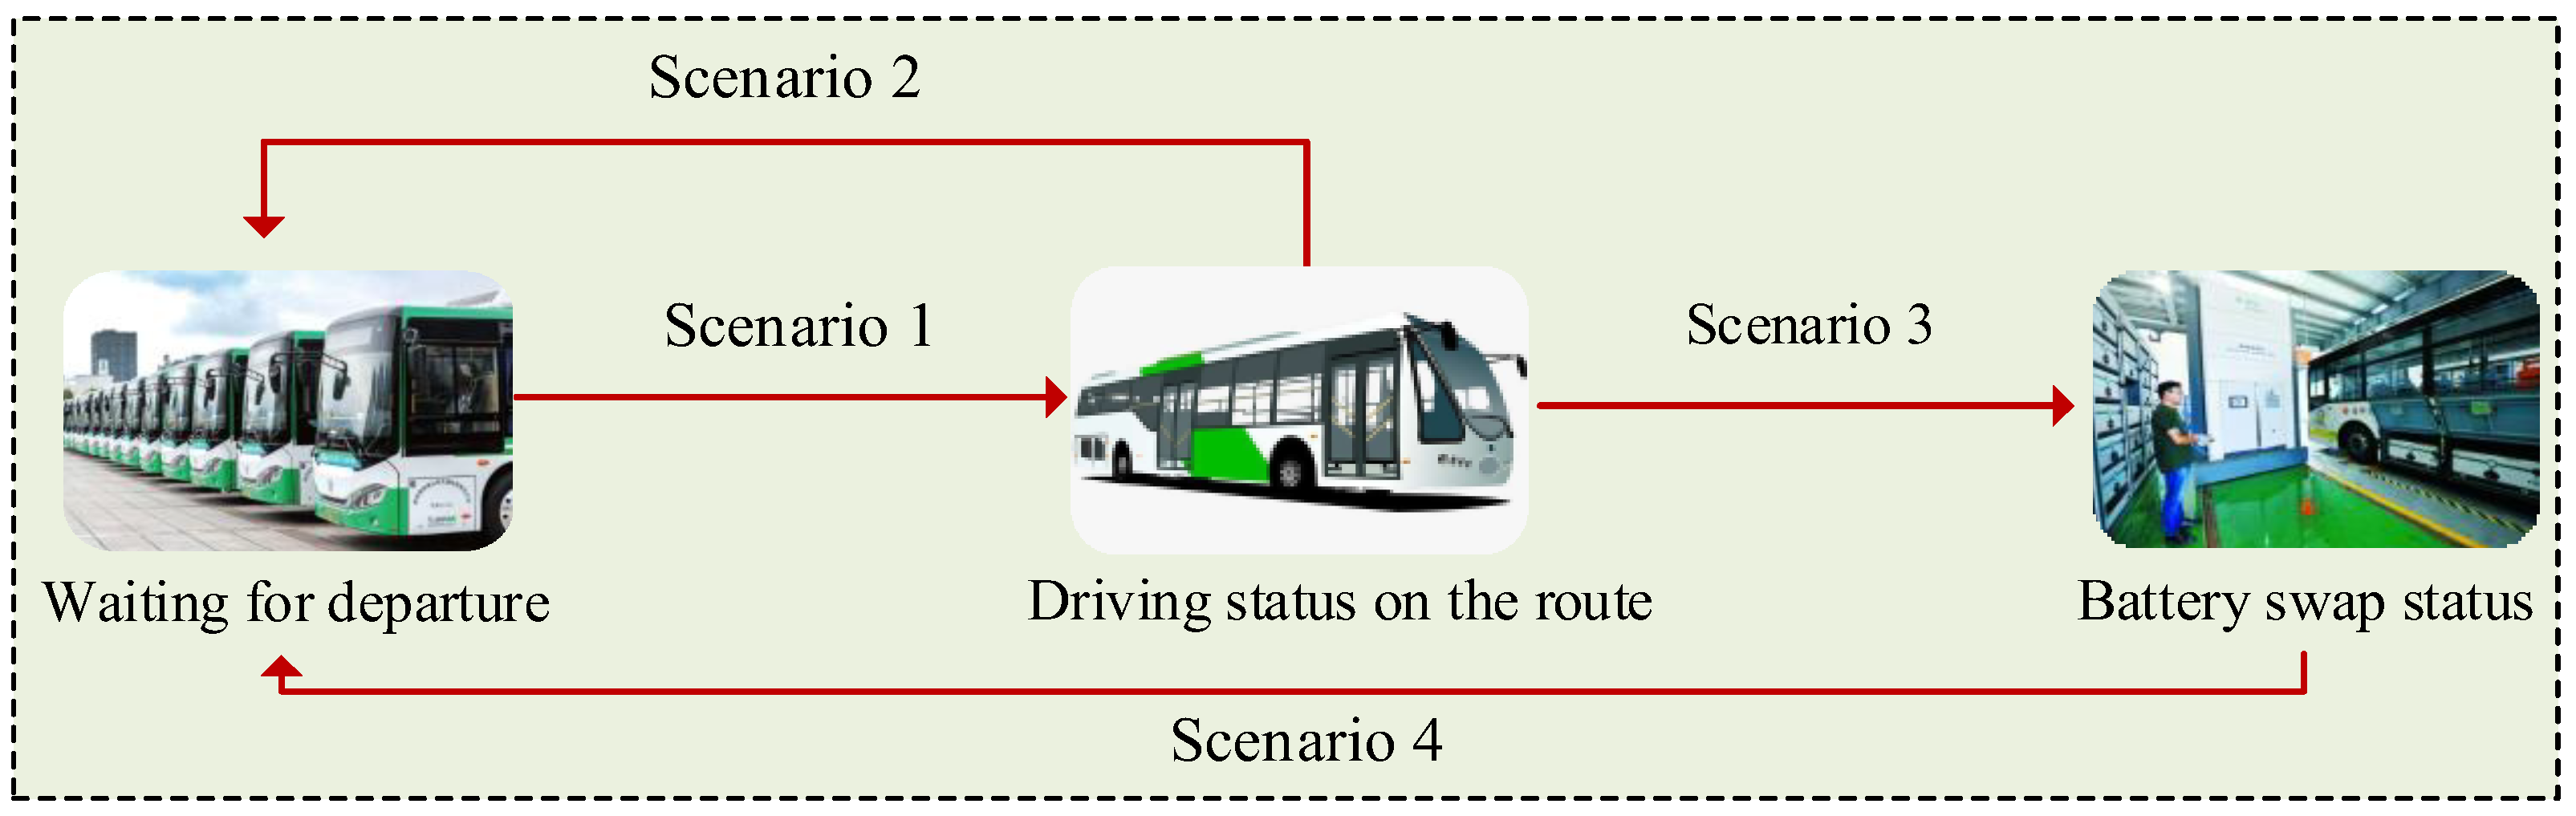
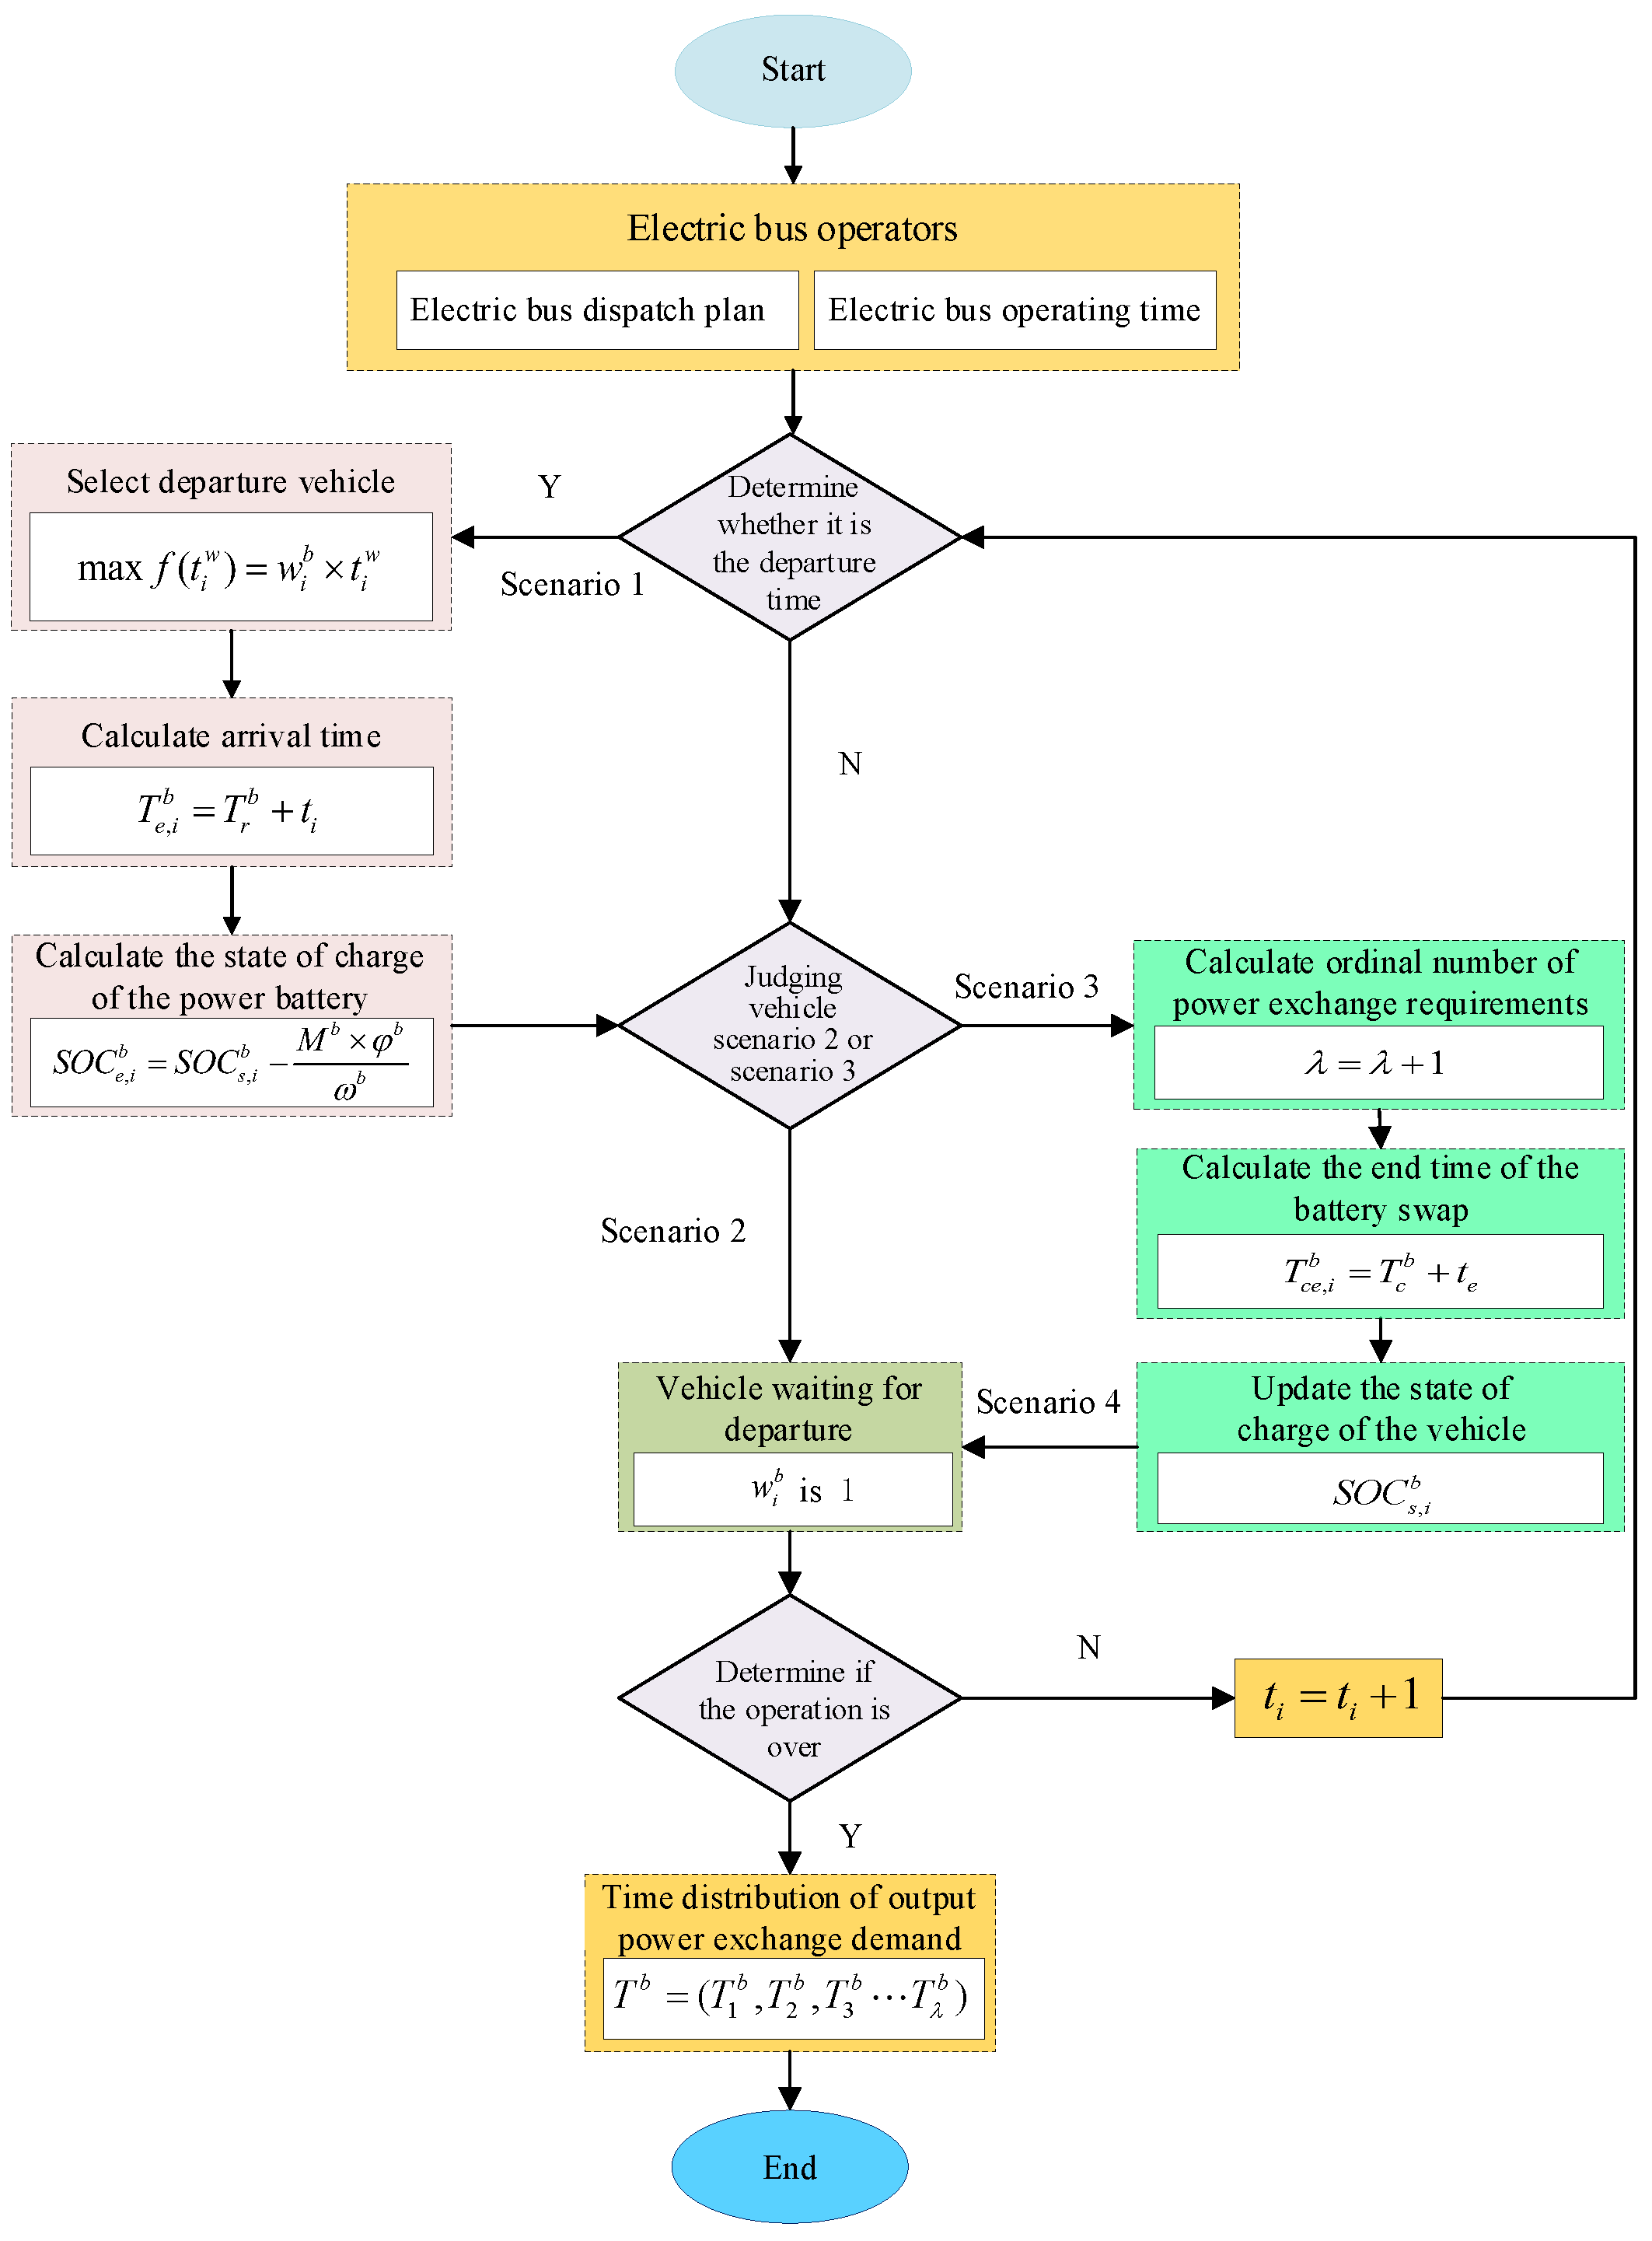
4.1. Time Series Analysis of Bus Switching State
4.1.1. Constraint of Required Driving Mileage
4.1.2. Bus State Transition Process Analysis Model
4.2. Time Series Analysis of Battery Swapping Status of Public Power Station
4.3. Time Series Analysis of Power Change State of Mobile Power Change Vehicle
5. Optimal Management Decision-Making Model Is Established for Participating in Demand Response Charging Plan under Battery Swapping Mode
5.1. Quantity Analysis of Batteries in Battery Swapping Modes
5.2. Objective Function and Constraints of Charging Load Optimization in Battery Swapping Modes
5.2.1. Objective Function
5.2.2. Constraint
- (1)
- Constraints on Configuration Number of Electric Buses on Lines
- (2)
- Constraints on configuration number of mobile electric energy vehicles
- (3)
- Constraints on the number of spare batteries for different vehicles
- (4)
- Replace the battery to charge the maximum number of constraints at the same time
- (5)
- Constraints of regional power grid load
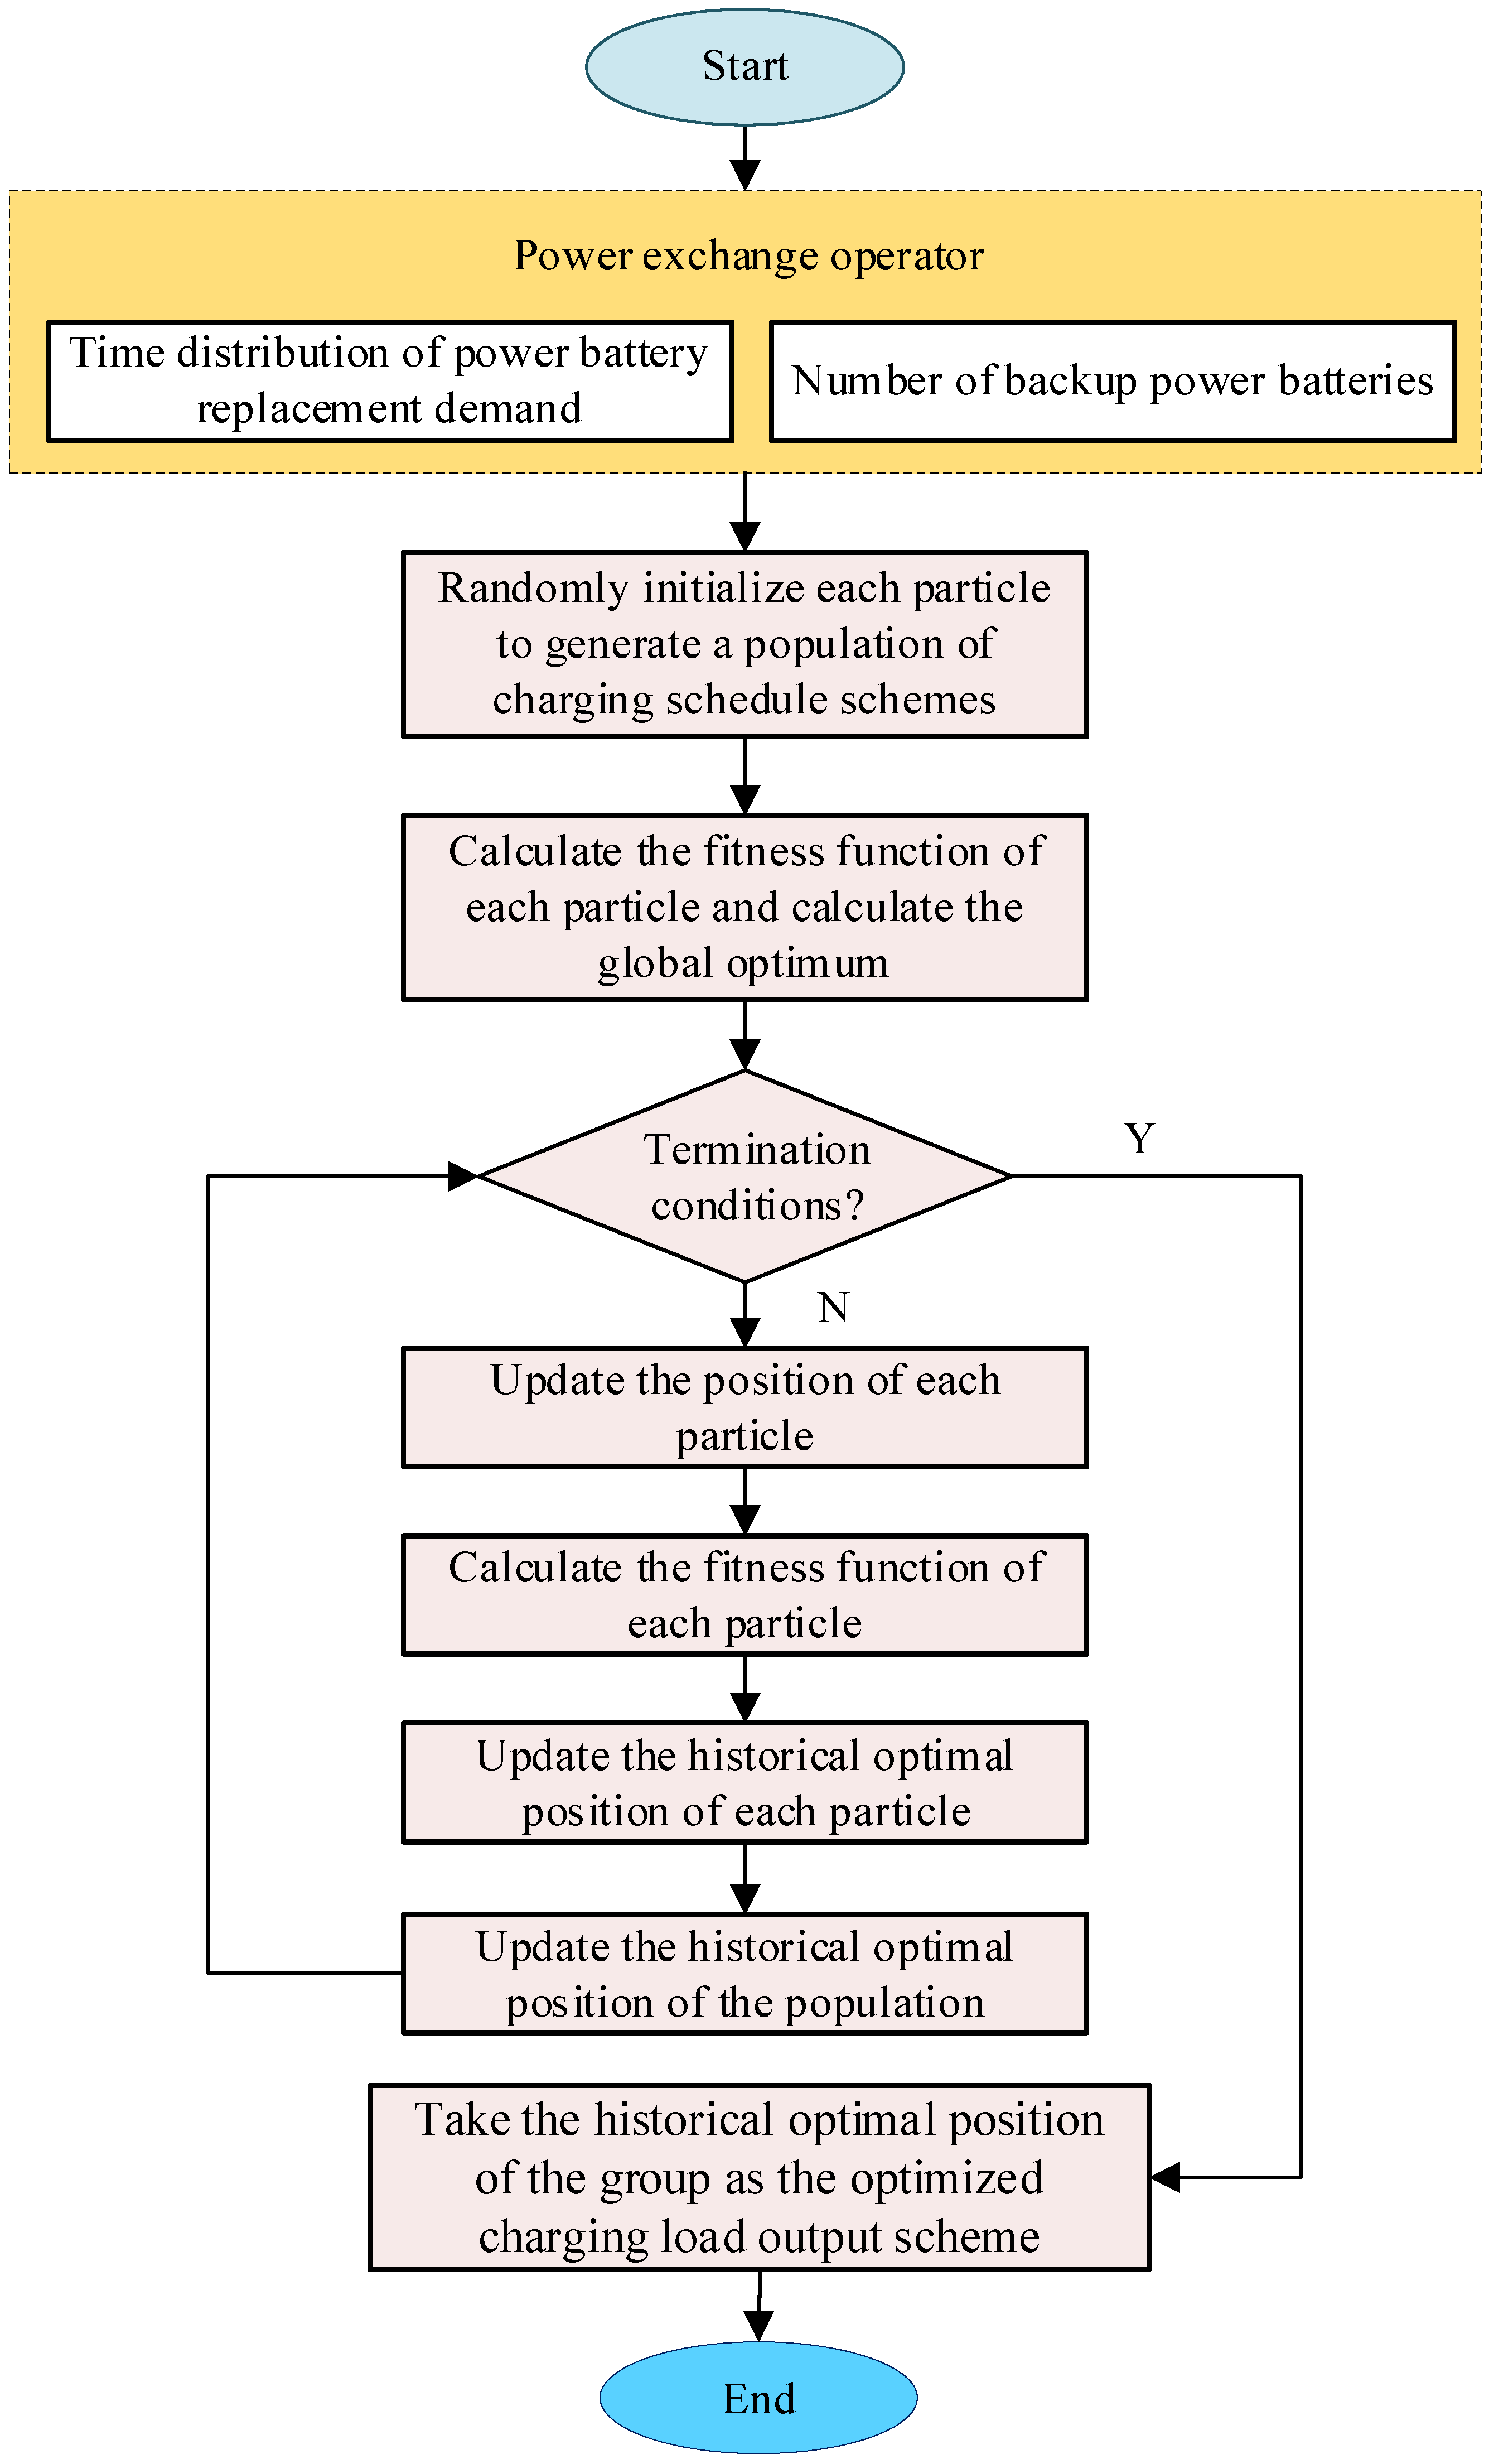
5.3. Model Optimization Based on Particle Swarm Optimization in Battery Swapping Mode
6. Case Analysis
6.1. Data and Parameter Settings
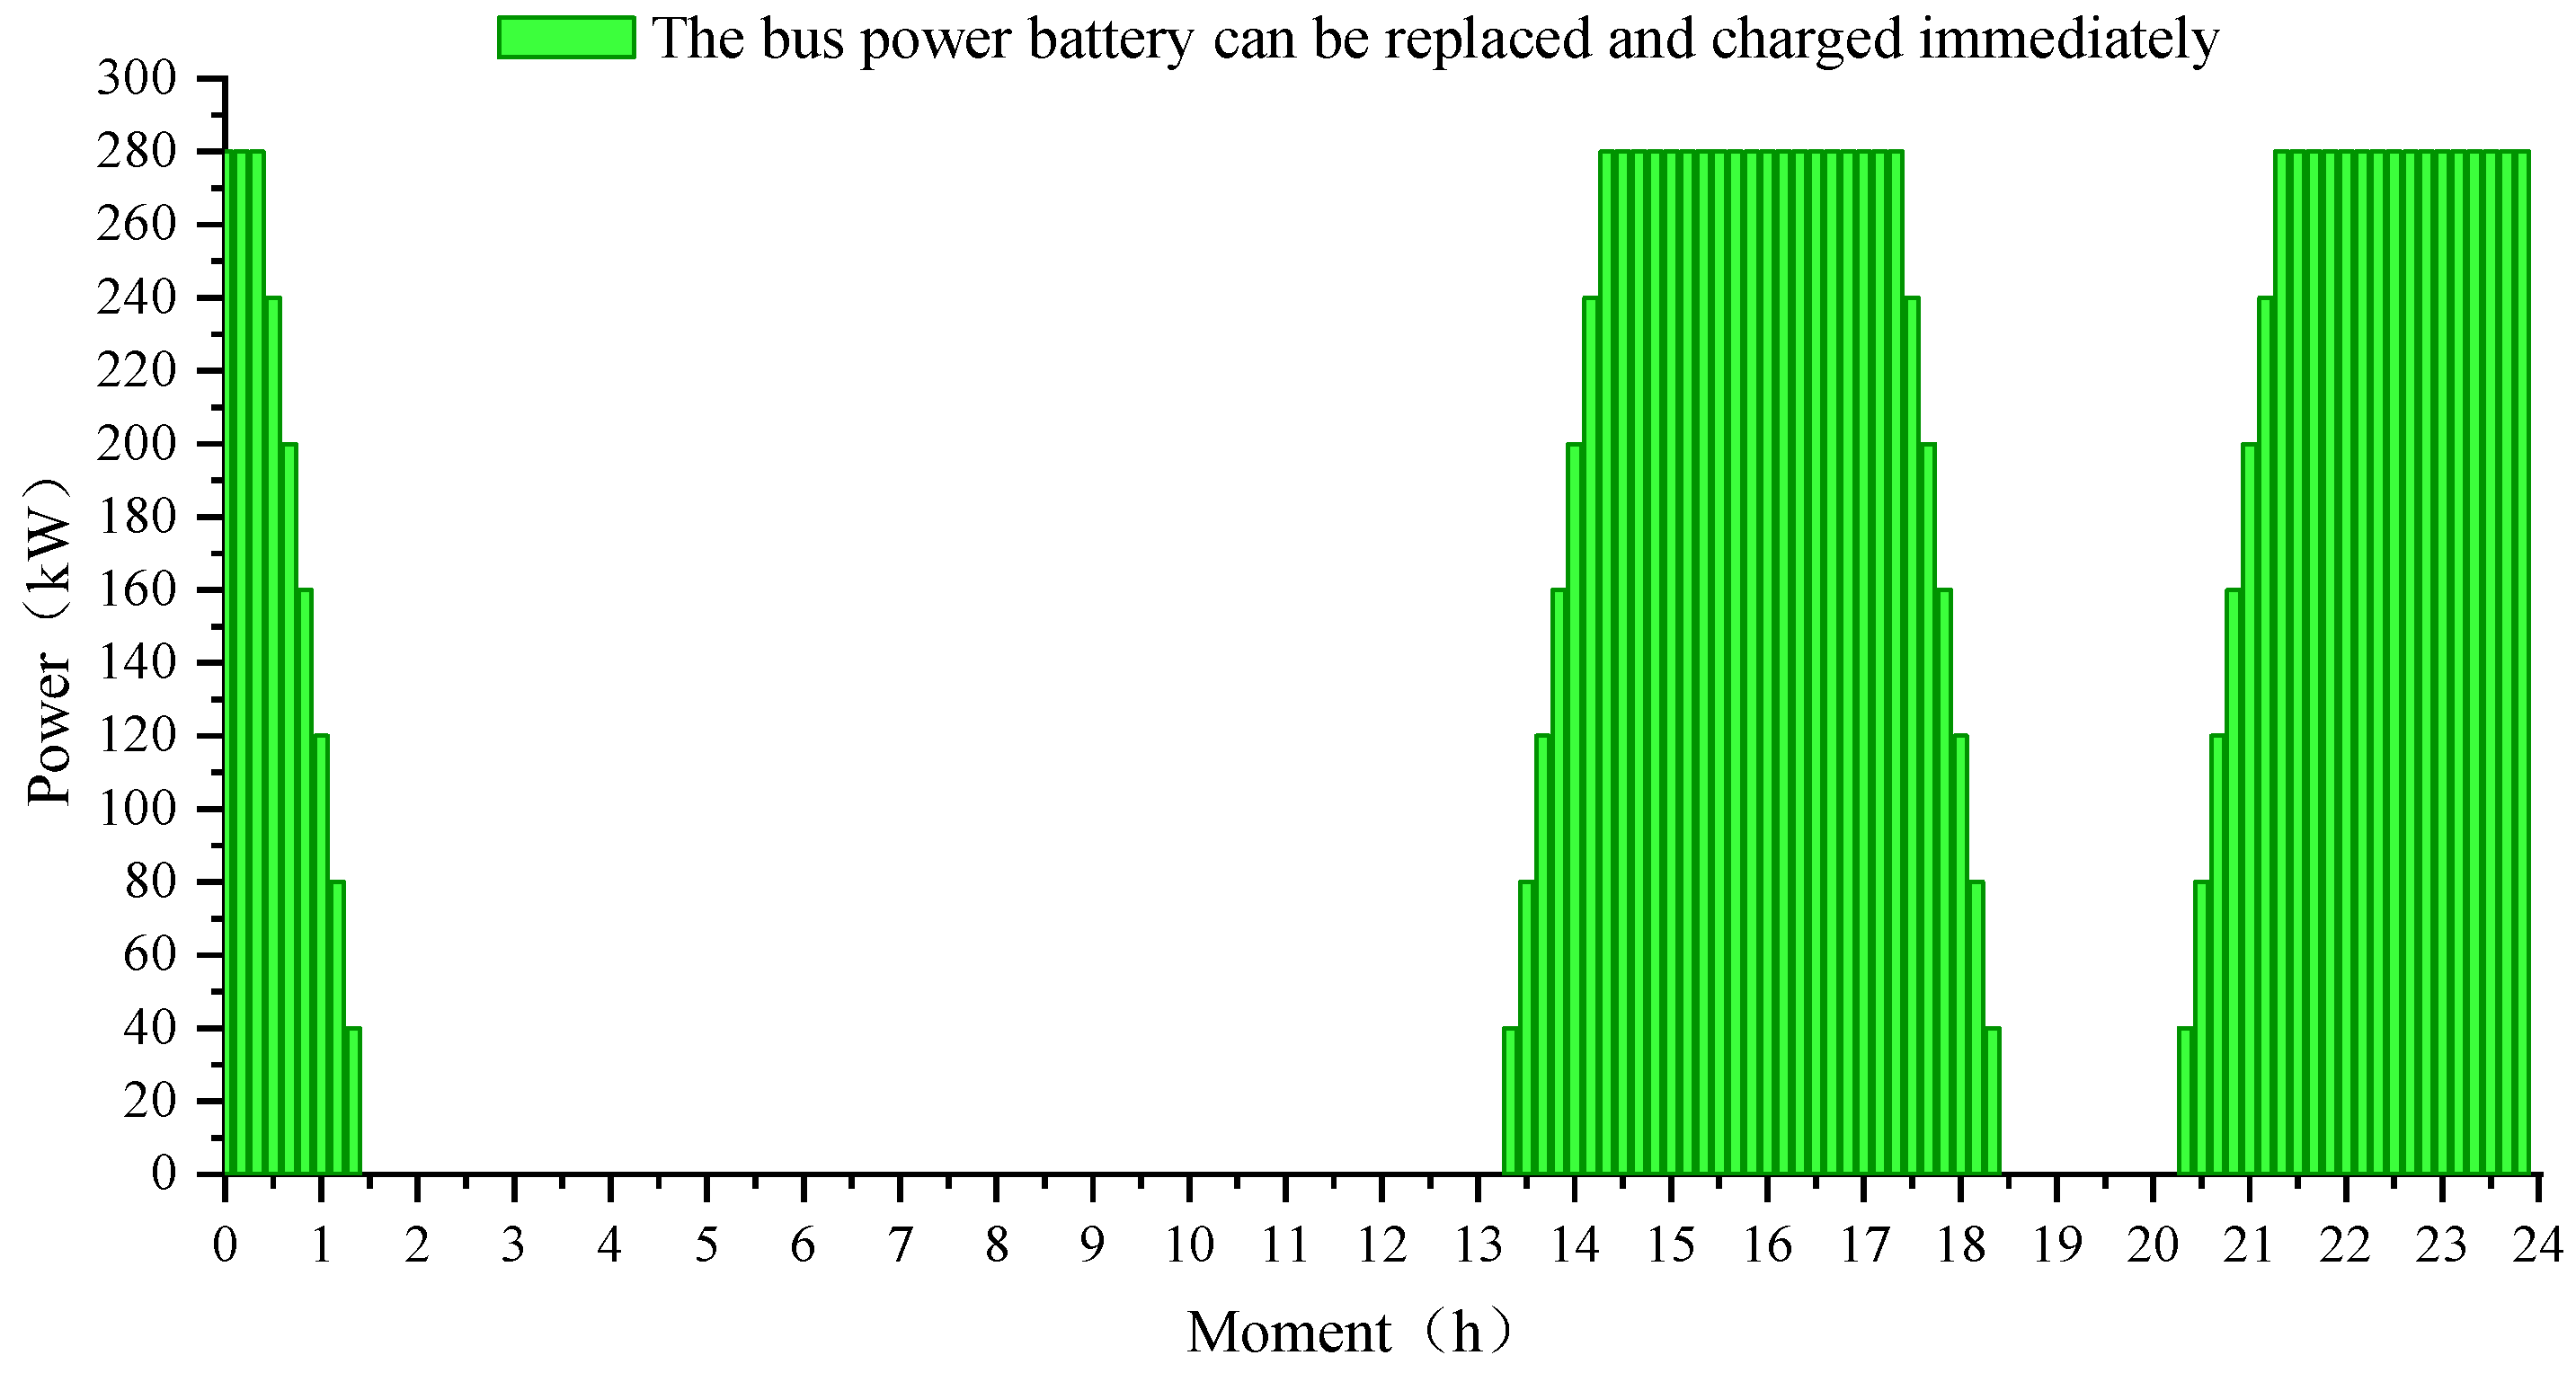
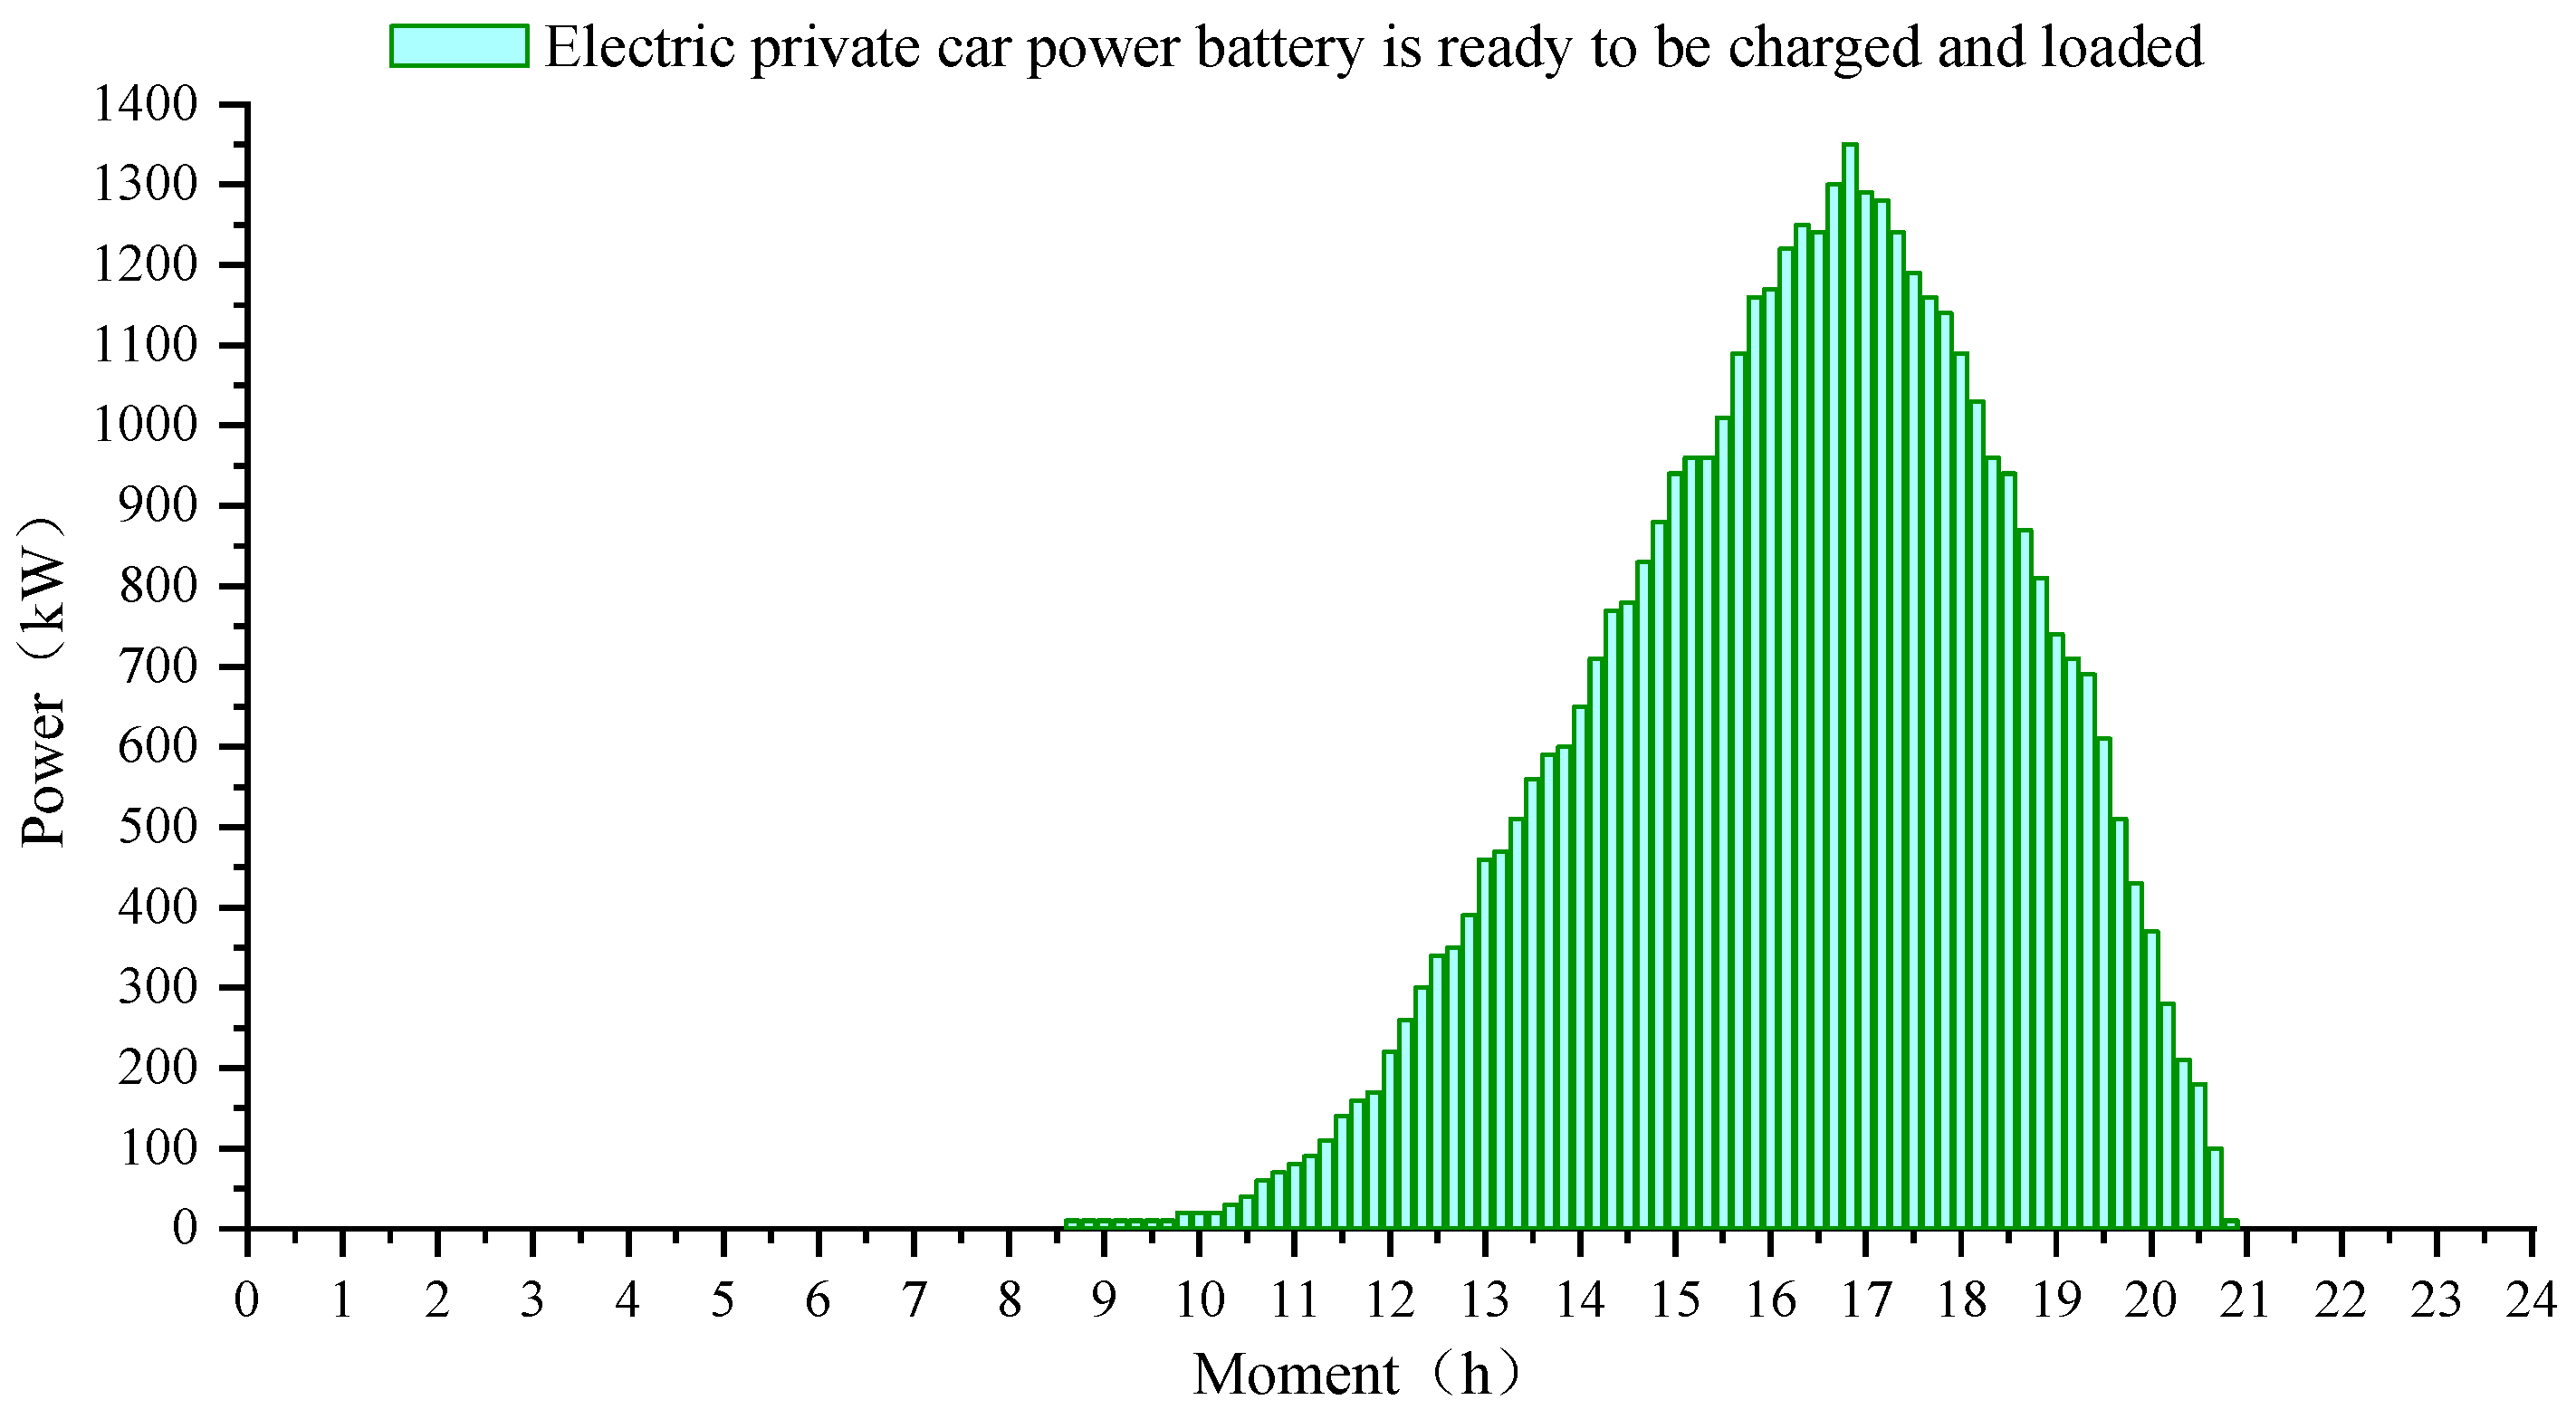
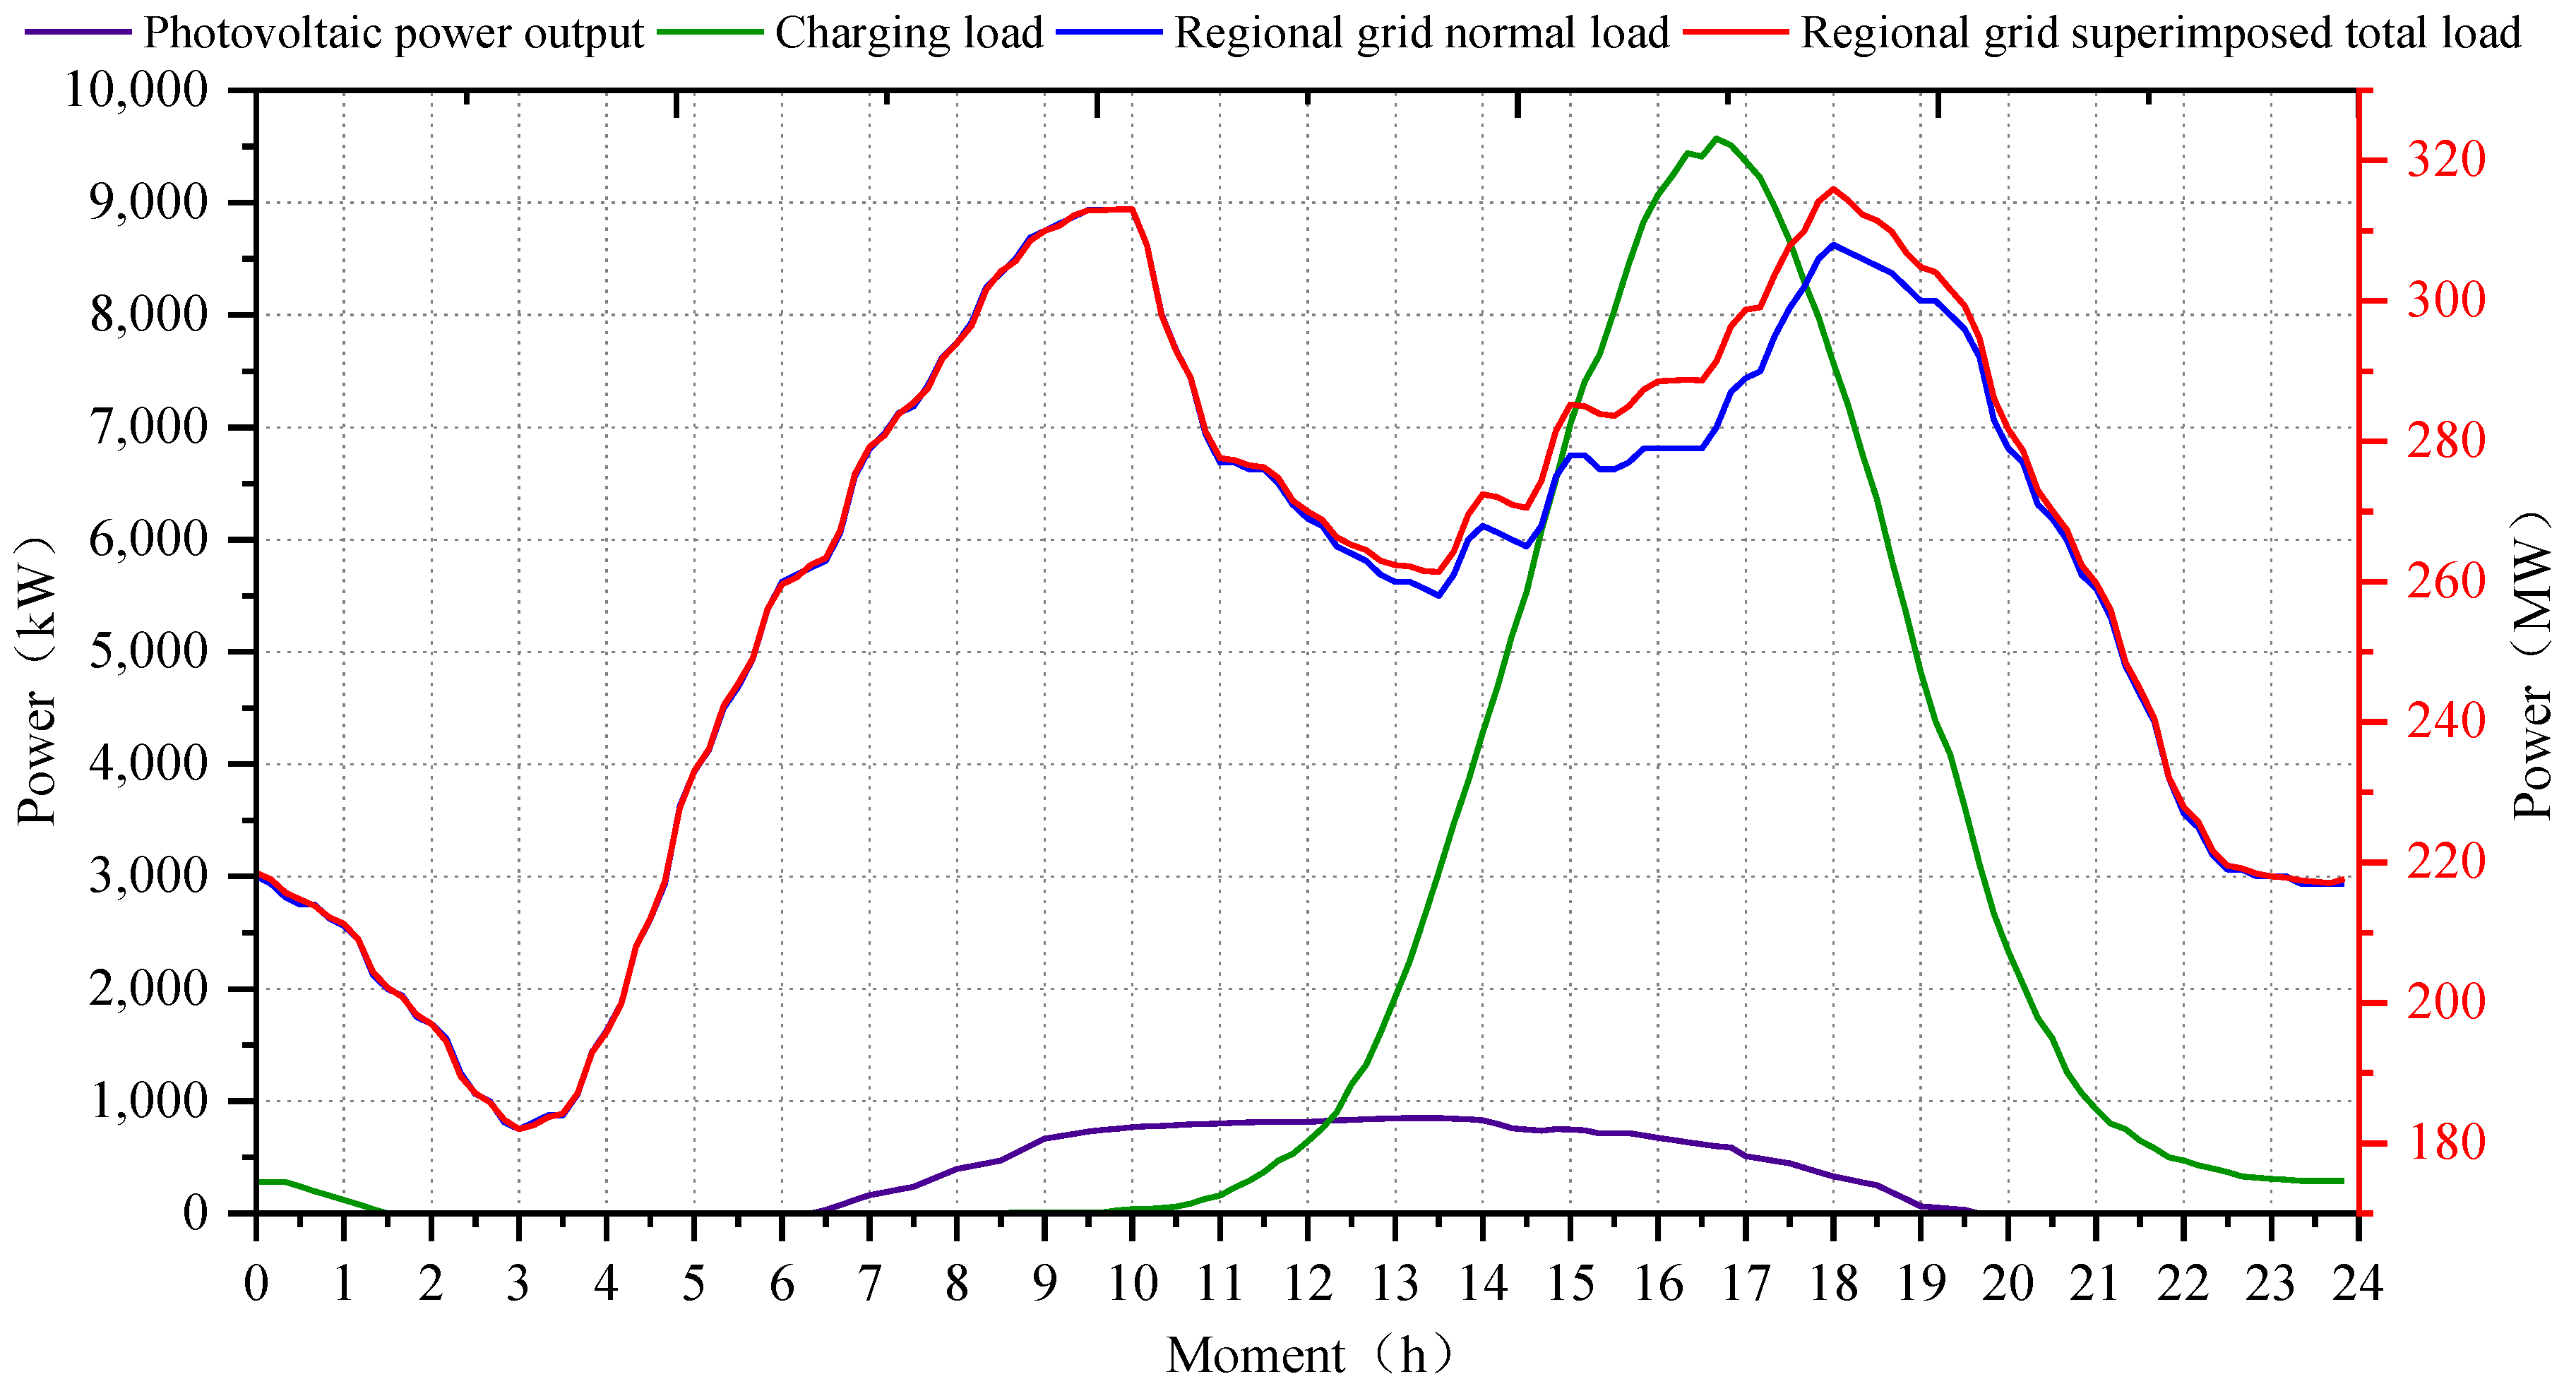
6.2. Discussion of Charging Load in Switching Mode
6.3. Discussion of Charging Load Optimization Results in Battery Swapping Mode
6.3.1. Discussion of Optimization Results
6.3.2. Sensitivity Analysis of Battery Configuration to Demand Response Capability
7. Conclusions
- (1)
- Grid demand response: The battery swapping mode, facilitated by centralized charging stations, offers enhanced control over charging times, allowing more responsive and flexible integration with the grid. Optimized management decisions can significantly improve grid response rates and alleviate urban electricity consumption pressures. The coordination between supply and demand during peak and valley periods is greatly enhanced, promoting the efficient absorption of renewable energy and improving overall energy utilization.
- (2)
- User experience: From the perspective of electric vehicle users, the battery swapping mode provides a fast and efficient energy replenishment experience. The time required for battery swapping is comparable to the refueling time for traditional internal combustion engine vehicles, effectively addressing issues such as range anxiety and low battery concerns. This enhances user satisfaction and fosters broader adoption of electric vehicles.
- (3)
- Power battery management: Centralized battery management at swapping stations enables the uniform handling of large quantities of batteries, which contributes to maintaining battery performance. This not only improves the operational efficiency of power batteries but also extends their service life, maximizing resource utilization. Proper battery management is critical for sustaining long-term battery health and reducing the frequency of battery replacements.
Author Contributions
Funding
Data Availability Statement
Conflicts of Interest
Appendix A

| Symbol | Description | Unit |
|---|---|---|
| First bus operating time | time | |
| Last bus operating hours | time | |
| Bus runs one cycle time | min | |
| Departure time between every two buses | min | |
| The time it takes for a bus to replace a battery | min | |
| The mileage of the bus running a cycle | km | |
| Electricity consumption per bus mileage | kWh/100 km | |
| Rated capacity when the bus is fully charged | kWh | |
| Rated charging power of the bus battery | kW | |
| The bus needs to change the state of charge critical value | % | |
| Number of electric taxis | unit | |
| Average daily mileage of electric taxis | km | |
| Electric taxis have a cruising range | km | |
| Rated capacity of electric taxis | kWh | |
| The time it takes for an electric taxi to replace the battery | min | |
| Electric taxis need to change the state of charge threshold | % | |
| Rated charging power of electric taxi batteries | kW | |
| The start time of the mobile battery-swappable energy vehicle | time | |
| The end of running time of the mobile battery-swappable energy vehicle | time | |
| Time required to replace the battery | min | |
| Time required to arrive at the reserved location | min | |
| Time to return to centralized charging station | min | |
| Number of mobile battery-swappable energy vehicles | unit | |
| Electric private cars need to change the state of charge threshold | % | |
| Rated capacity of private car power battery | kWh | |
| Electricity consumption of electric private car per mileage | kWh/100 km | |
| Rated charging power of electric private car batteries | kW |
References
- The General Office of the State Council. New Energy Automobile Industry Development Plan (2021–2035); China Association of Automobile Manufacturers: Beijing, China, 2020.
- Yang, X.; Niu, D.; Sun, L.; Ji, Z.; Zhou, J.; Wang, K.; Siqin, Z. A bi-level optimization model for electric vehicle charging strategy based on regional grid load following. J. Clean. Prod. 2021, 325, 129313. [Google Scholar] [CrossRef]
- Zhang, Y.; Qi, D.; Lei, S.; Wu, K.; Wang, Y. Research on the optimal planning of the battery switch station for electric vehicles. Iet Intell. Transp. Syst. 2016, 10, 635–641. [Google Scholar] [CrossRef]
- Ni, L.; Sun, B.; Tan, X.; Tsang, D.H.K. Inventory Planning and Real-Time Routing for Network of Electric Vehicle Battery-Swapping Stations. IEEE Trans. Transp. Electrif. 2021, 7, 542–553. [Google Scholar] [CrossRef]
- Rao, R.; Zhang, X.; Xie, J.; Ju, L. Optimizing electric vehicle users’ charging behavior in battery swapping mode. Appl. Energy 2015, 155, 547–559. [Google Scholar] [CrossRef]
- Zhao, Q.; Wang, J.; Han, Y. Multi-objective stochastic economic dispatch of power system with battery swapping stations. In Proceedings of the 2016 35th Chinese Control Conference (CCC), Chengdu, China, 27–29 July 2016; pp. 9930–9934. [Google Scholar]
- Li, Z.; Khajepour, A.; Song, J. A comprehensive review of the key technologies for pure electric vehicles. Energy 2019, 182, 824–839. [Google Scholar] [CrossRef]
- Niu, S.; Zeng, B.; Liu, W.; Liu, Y. Cooperative game based optimal capacity configuration of battery swapping station for electric vehicles. South. Power Syst. Technol. 2016, 10, 53–60. [Google Scholar]
- Zhigang, L.; Wentao, W.; Dan, Z. Collaborative Planning of Distributed Power and Charging and Switching Stations Based on Distribution Grid Reliability. Acta Energiae Solaris Sin. 2020, 4, 348–356. [Google Scholar]
- Zhang, F.; Yao, S.; Zeng, X.; Yang, P.; Zhao, Z.; Lai, C.S.; Lai, L.L. Operation Strategy for Electric Vehicle Battery Swap Station Cluster Participating in Frequency Regulation Service. Processes 2021, 9, 1513. [Google Scholar] [CrossRef]
- Tian, Y.; Liao, Q.; Yutian, X.U.; Chen, Y. Multi-scenario coordinated planning method of EV battery-swapping station and distributed generation based on coordinated charging strategy. Electr. Power Autom. Equip. 2017, 37, 62–69. [Google Scholar]
- Liu, N.; Chen, Z.; Liu, J.; Tang, X.; Xiao, X.; Zhang, J. Multi-objective optimization for component capacity of the photovoltaic-based battery switch stations: Towards benefits of economy and environment. Energy 2014, 64, 779–792. [Google Scholar] [CrossRef]
- Sun, W.; Liu, T.; Chen, S.; Pan, L.; Xiaodong, W.U. Analysis on Load Characteristic and Management Benefits of Electric Vehicle Battery Swapping Station. Power Syst. Clean Energy 2016, 32, 127–132. [Google Scholar]
- Yang, J.; Wang, W.; Ma, K.; Yang, B. Optimal Dispatching Strategy for Shared Battery Station of Electric Vehicle by Divisional Battery Control. IEEE Access 2019, 7, 38224–38235. [Google Scholar] [CrossRef]
- Liang, Y.; Zhang, X.; Xie, J.; Liu, W. An Optimal Operation Model and Ordered Charging/Discharging Strategy for Battery Swapping Stations. Sustainability 2017, 9, 700. [Google Scholar] [CrossRef]
- Liang, Y.; Zhang, X. Battery swap pricing and charging strategy for electric taxis in China. Energy 2018, 147, 561–577. [Google Scholar] [CrossRef]
- Zhang, T.; Chen, X.; Yu, Z.; Zhu, X.; Shi, D. A Monte Carlo Simulation Approach to Evaluate Service Capacities of EV Charging and Battery Swapping Stations. IEEE Trans. Ind. Inform. 2018, 14, 3914–3923. [Google Scholar] [CrossRef]
- Infante, W.F.; Ma, J.; Chi, Y. Operational strategy and load profile sensitivity analysis for an electric vehicle battery swapping station. In Proceedings of the 2016 IEEE International Conference on Power System Technology (POWERCON), Wollongong, Australia, 28 September–1 October 2016; pp. 1–6. [Google Scholar]
- Zhang, L.; Liu, W.; Liu, Z. A scope for the research and argument activities on electric vehicle development mode in demonstration city. In Proceedings of the 2014 IEEE Innovative Smart Grid Technologies-Asia (ISGT ASIA), Kuala Lumpur, Malaysia, 20–23 May 2014; pp. 394–399. [Google Scholar]
- Ziegler, D.; Abdelkafi, N. Business models for electric vehicles: Literature review and key insights. J. Clean. Prod. 2022, 330, 129803. [Google Scholar] [CrossRef]
- Yang, S.; Yao, J.; Kang, T.; Zhu, X. Dynamic operation model of the battery swapping station for EV (electric vehicle) in electricity market. Energy 2014, 65, 544–549. [Google Scholar] [CrossRef]
- Zhong, L.; Pei, M. Optimal Design for a Shared Swap Charging System Considering the Electric Vehicle Battery Charging Rate. Energies 2020, 13, 1213. [Google Scholar] [CrossRef]
- Gan, H.; Zheng, C. Operation optimization of electric vehicle based on demand side management. In Proceedings of the 2019 34rd Youth Academic Annual Conference of Chinese Association of Automation (YAC), Jinzhou, China, 6–8 June 2019; pp. 100–105. [Google Scholar]
- Zhang, X.; Rao, R. A Benefit Analysis of Electric Vehicle Battery Swapping and Leasing Modes in China. Emerg. Mark. Financ. Trade 2016, 52, 1414–1426. [Google Scholar] [CrossRef]
- Zhang, L.; Zhao, Z.; Kan, Z. Private-sector partner selection for public-private partnership projects of electric vehicle charging infrastructure. Energy Sci. Eng. 2019, 7, 1469–1484. [Google Scholar] [CrossRef]
- Yang, Y.; Hu, Z.; Song, Y. Research on optimal operation of battery swapping and charging station for electric buses. Zhongguo Dianji Gongcheng Xuebao/Proc. Chin. Soc. Electr. Eng. 2012, 32, 35–42. [Google Scholar]
- Ayad, A.; El-Taweel, N.A.; Farag, H.E.Z. Optimal Design of Battery Swapping-Based Electrified Public Bus Transit Systems. IEEE Trans. Transp. Electrif. 2021, 7, 2390–2401. [Google Scholar] [CrossRef]
- Zhang, X.; Peng, L.; Cao, Y.; Liu, S.; Zhou, H.; Huang, K. Towards holistic charging management for urban electric taxi via a hybrid deployment of battery charging and swap stations. Renew. Energy 2020, 155, 703–716. [Google Scholar] [CrossRef]
- Zhang, X.; Zou, Y.; Fan, J.; Guo, H. Usage pattern analysis of Beijing private electric vehicles based on real-world data. Energy 2019, 167, 1074–1085. [Google Scholar] [CrossRef]
- Awasthi, A.; Venkitusamy, K.; Padmanaban, S.; Selvamuthukumaran, R.; Blaabjerg, F.; Singh, A.K. Optimal planning of electric vehicle charging station at the distribution system using hybrid optimization algorithm. Energy 2017, 133, 70–78. [Google Scholar] [CrossRef]
- Hu, C.; Gao, Y.; Huang, A.Q. Power management strategy of hybrid electric vehicles based on particle swarm optimization. In Proceedings of the 2015 IEEE Transportation Electrification Conference and Expo (ITEC), Dearborn, MI, USA, 14–17 June 2015; pp. 1–6. [Google Scholar]


| Parameter Name | Parameter Notation | Parameter Value | Parameter Unit |
|---|---|---|---|
| First bus operating time | 6:00 | time | |
| Last bus operating hours | 22:00 | time | |
| Bus runs one cycle time | 60 | min | |
| Departure time between every two buses | 10 | min | |
| The time it takes for a bus to replace a battery | 10 | min | |
| The mileage of the bus running a cycle | 20 | km | |
| Electricity consumption per bus mileage | 100 | kWh/100 km | |
| Rated capacity when the bus is fully charged | 160 | kWh | |
| Rated charging power of the bus battery | 40 | kW | |
| The bus needs to change the state of charge critical value | 15 | % |
| Parameter Name | Parameter Notation | Parameter Value | Parameter Unit |
|---|---|---|---|
| Number of electric taxis | 1000 | unit | |
| Average daily mileage of electric taxis | 350 | km | |
| Electric taxis have a cruising range | 200 | km | |
| Rated capacity of electric taxis | 40 | kWh | |
| The time it takes for an electric taxi to replace the battery | 5 | min | |
| Electric taxis need to change the state of charge threshold | 10 | % | |
| Rated charging power of electric taxi batteries | 10 | kW |
| Parameter Name | Parameter Notation | Parameter Value | Parameter Unit |
|---|---|---|---|
| Number of electric private cars in the area | 2000 | unit | |
| The start time of the mobile battery-swappable energy vehicle | 8:00 | time | |
| The end of running time of the mobile battery-swappable energy vehicle | 17:00 | time | |
| Time required to replace the battery | 5 | min | |
| Time required to arrive at the reserved location | 20 | min | |
| Time to return to centralized charging station | 20 | min | |
| Number of mobile battery-swappable energy vehicles | 10 | vehicle | |
| Electric private cars need to change the state of charge threshold | 10 | % | |
| Rated capacity of private car power battery | 40 | kWh | |
| Electricity consumption of electric private car per mileage | 15 | kWh/100 km | |
| Rated charging power of electric private car batteries | 10 | kW |
Disclaimer/Publisher’s Note: The statements, opinions and data contained in all publications are solely those of the individual author(s) and contributor(s) and not of MDPI and/or the editor(s). MDPI and/or the editor(s) disclaim responsibility for any injury to people or property resulting from any ideas, methods, instructions or products referred to in the content. |
© 2024 by the authors. Licensee MDPI, Basel, Switzerland. This article is an open access article distributed under the terms and conditions of the Creative Commons Attribution (CC BY) license (https://creativecommons.org/licenses/by/4.0/).
Share and Cite
Yang, X.; Du, R.; Ji, Z.; Wang, Q.; Qu, M.; Gao, W. A Management Framework and Optimization Scheduling for Electric Vehicles Participating in a Regional Power Grid Demand Response under Battery Swapping Mode. Electronics 2024, 13, 3987. https://doi.org/10.3390/electronics13203987
Yang X, Du R, Ji Z, Wang Q, Qu M, Gao W. A Management Framework and Optimization Scheduling for Electric Vehicles Participating in a Regional Power Grid Demand Response under Battery Swapping Mode. Electronics. 2024; 13(20):3987. https://doi.org/10.3390/electronics13203987
Chicago/Turabian StyleYang, Xiaolong, Ruoyun Du, Zhengsen Ji, Qian Wang, Meiyu Qu, and Weiyao Gao. 2024. "A Management Framework and Optimization Scheduling for Electric Vehicles Participating in a Regional Power Grid Demand Response under Battery Swapping Mode" Electronics 13, no. 20: 3987. https://doi.org/10.3390/electronics13203987