

Development of a Wearable System for the Detection of Ingestible Medication Based on Electromagnetic Waves


Abstract
:1. Introduction
2. The Basic Principle of Electromagnetic Material Detection
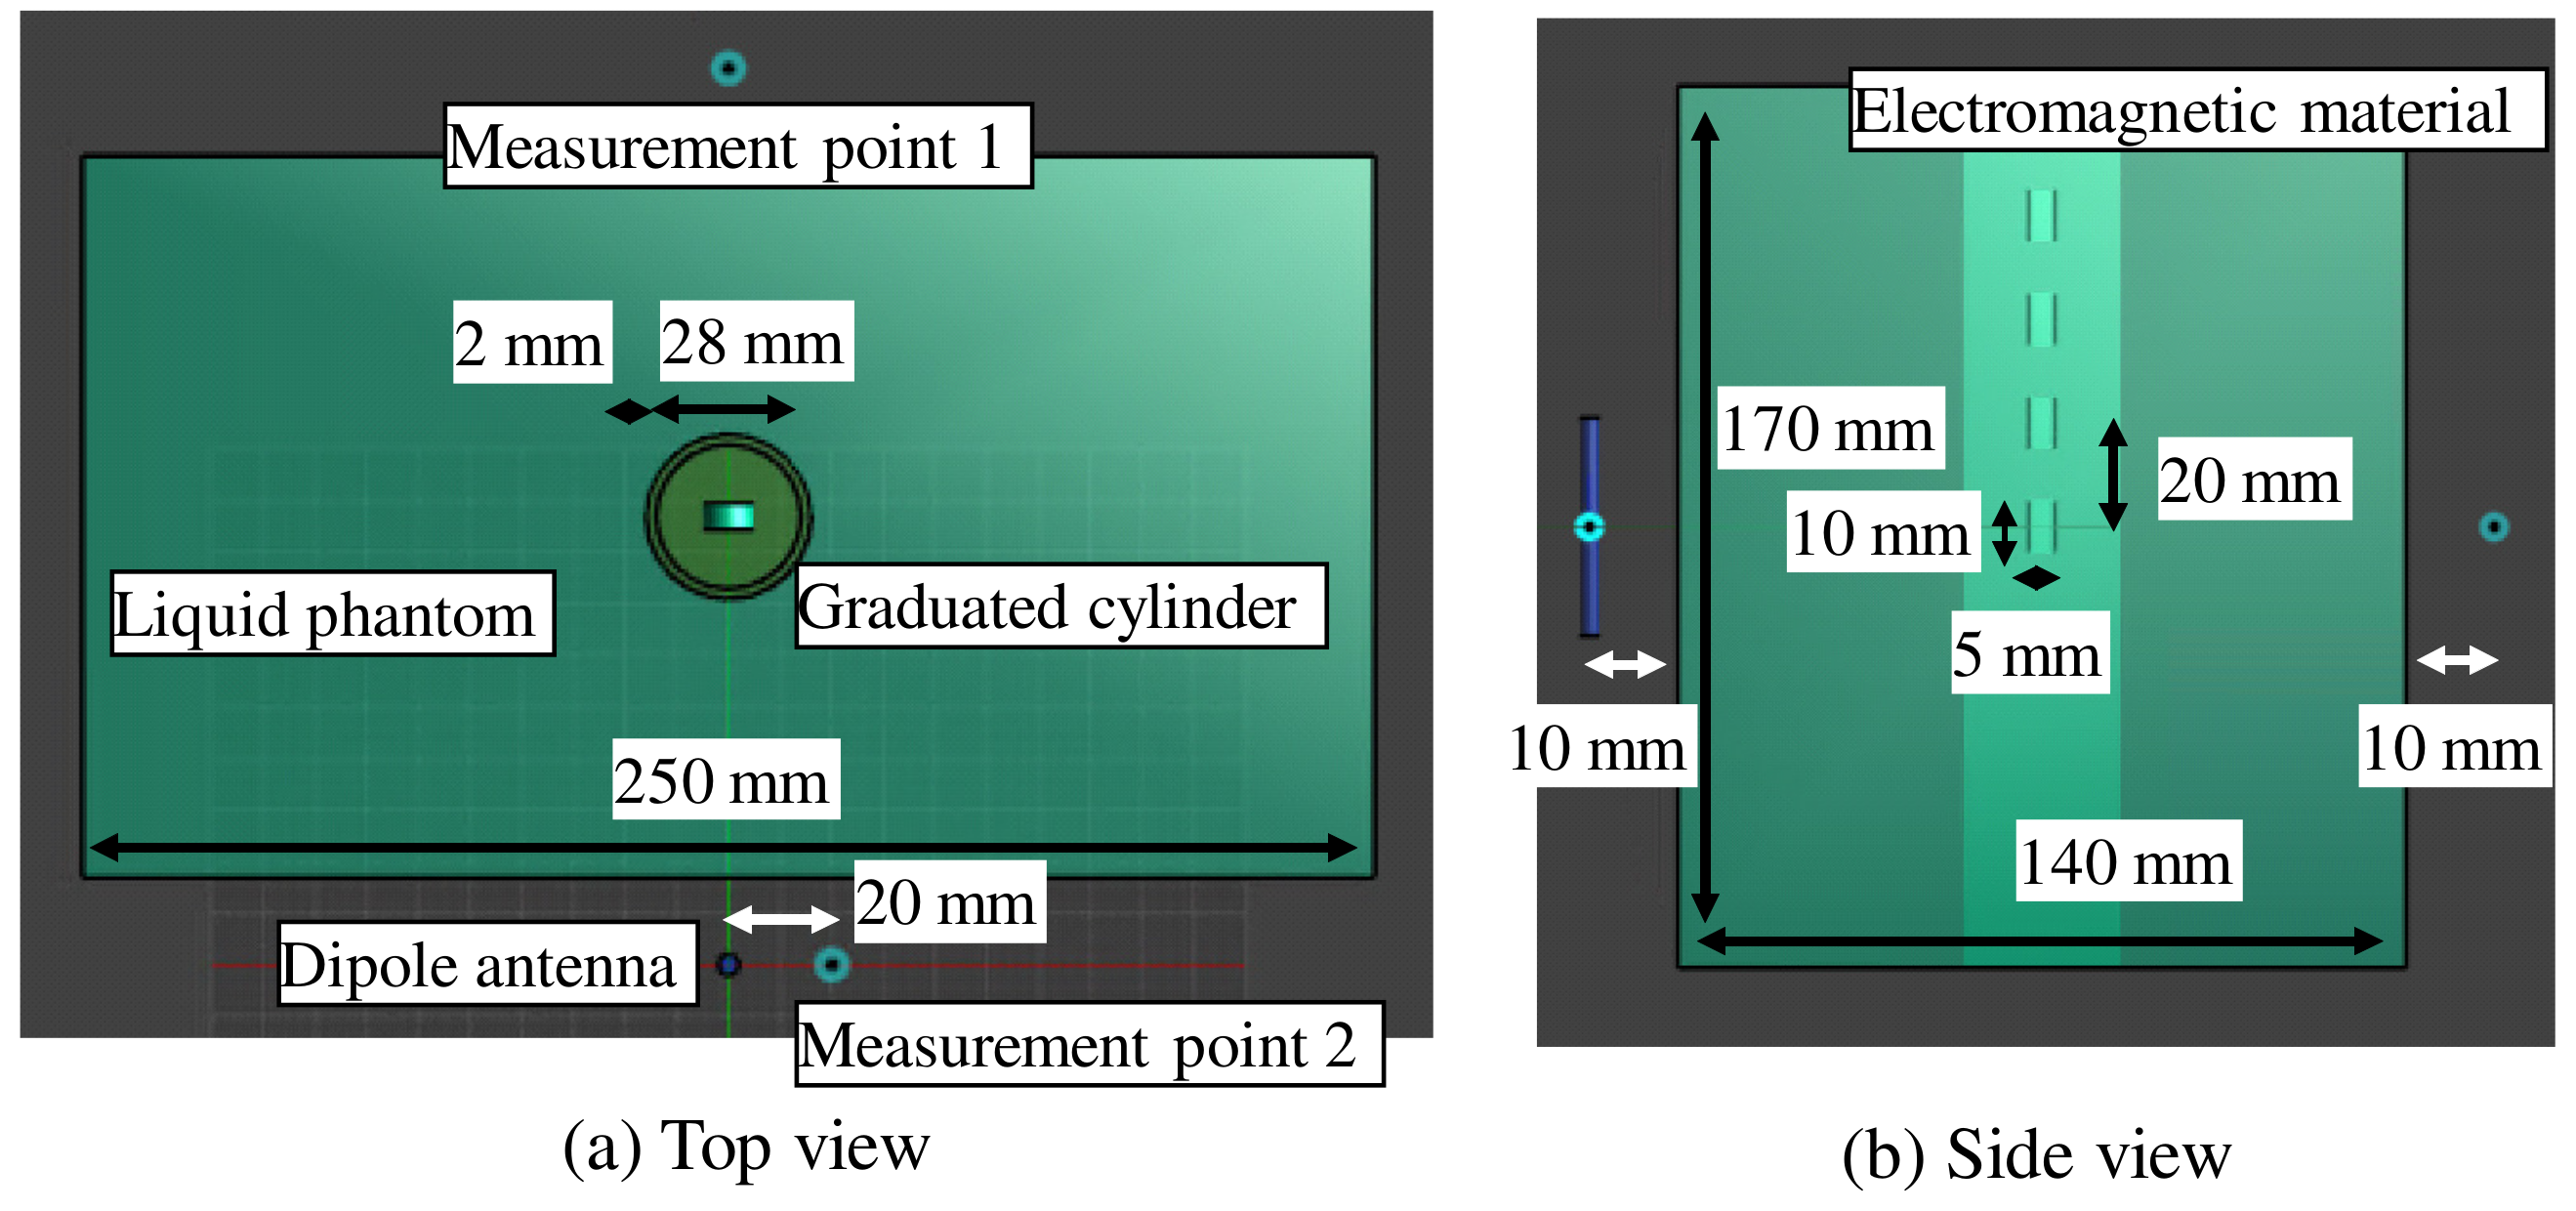
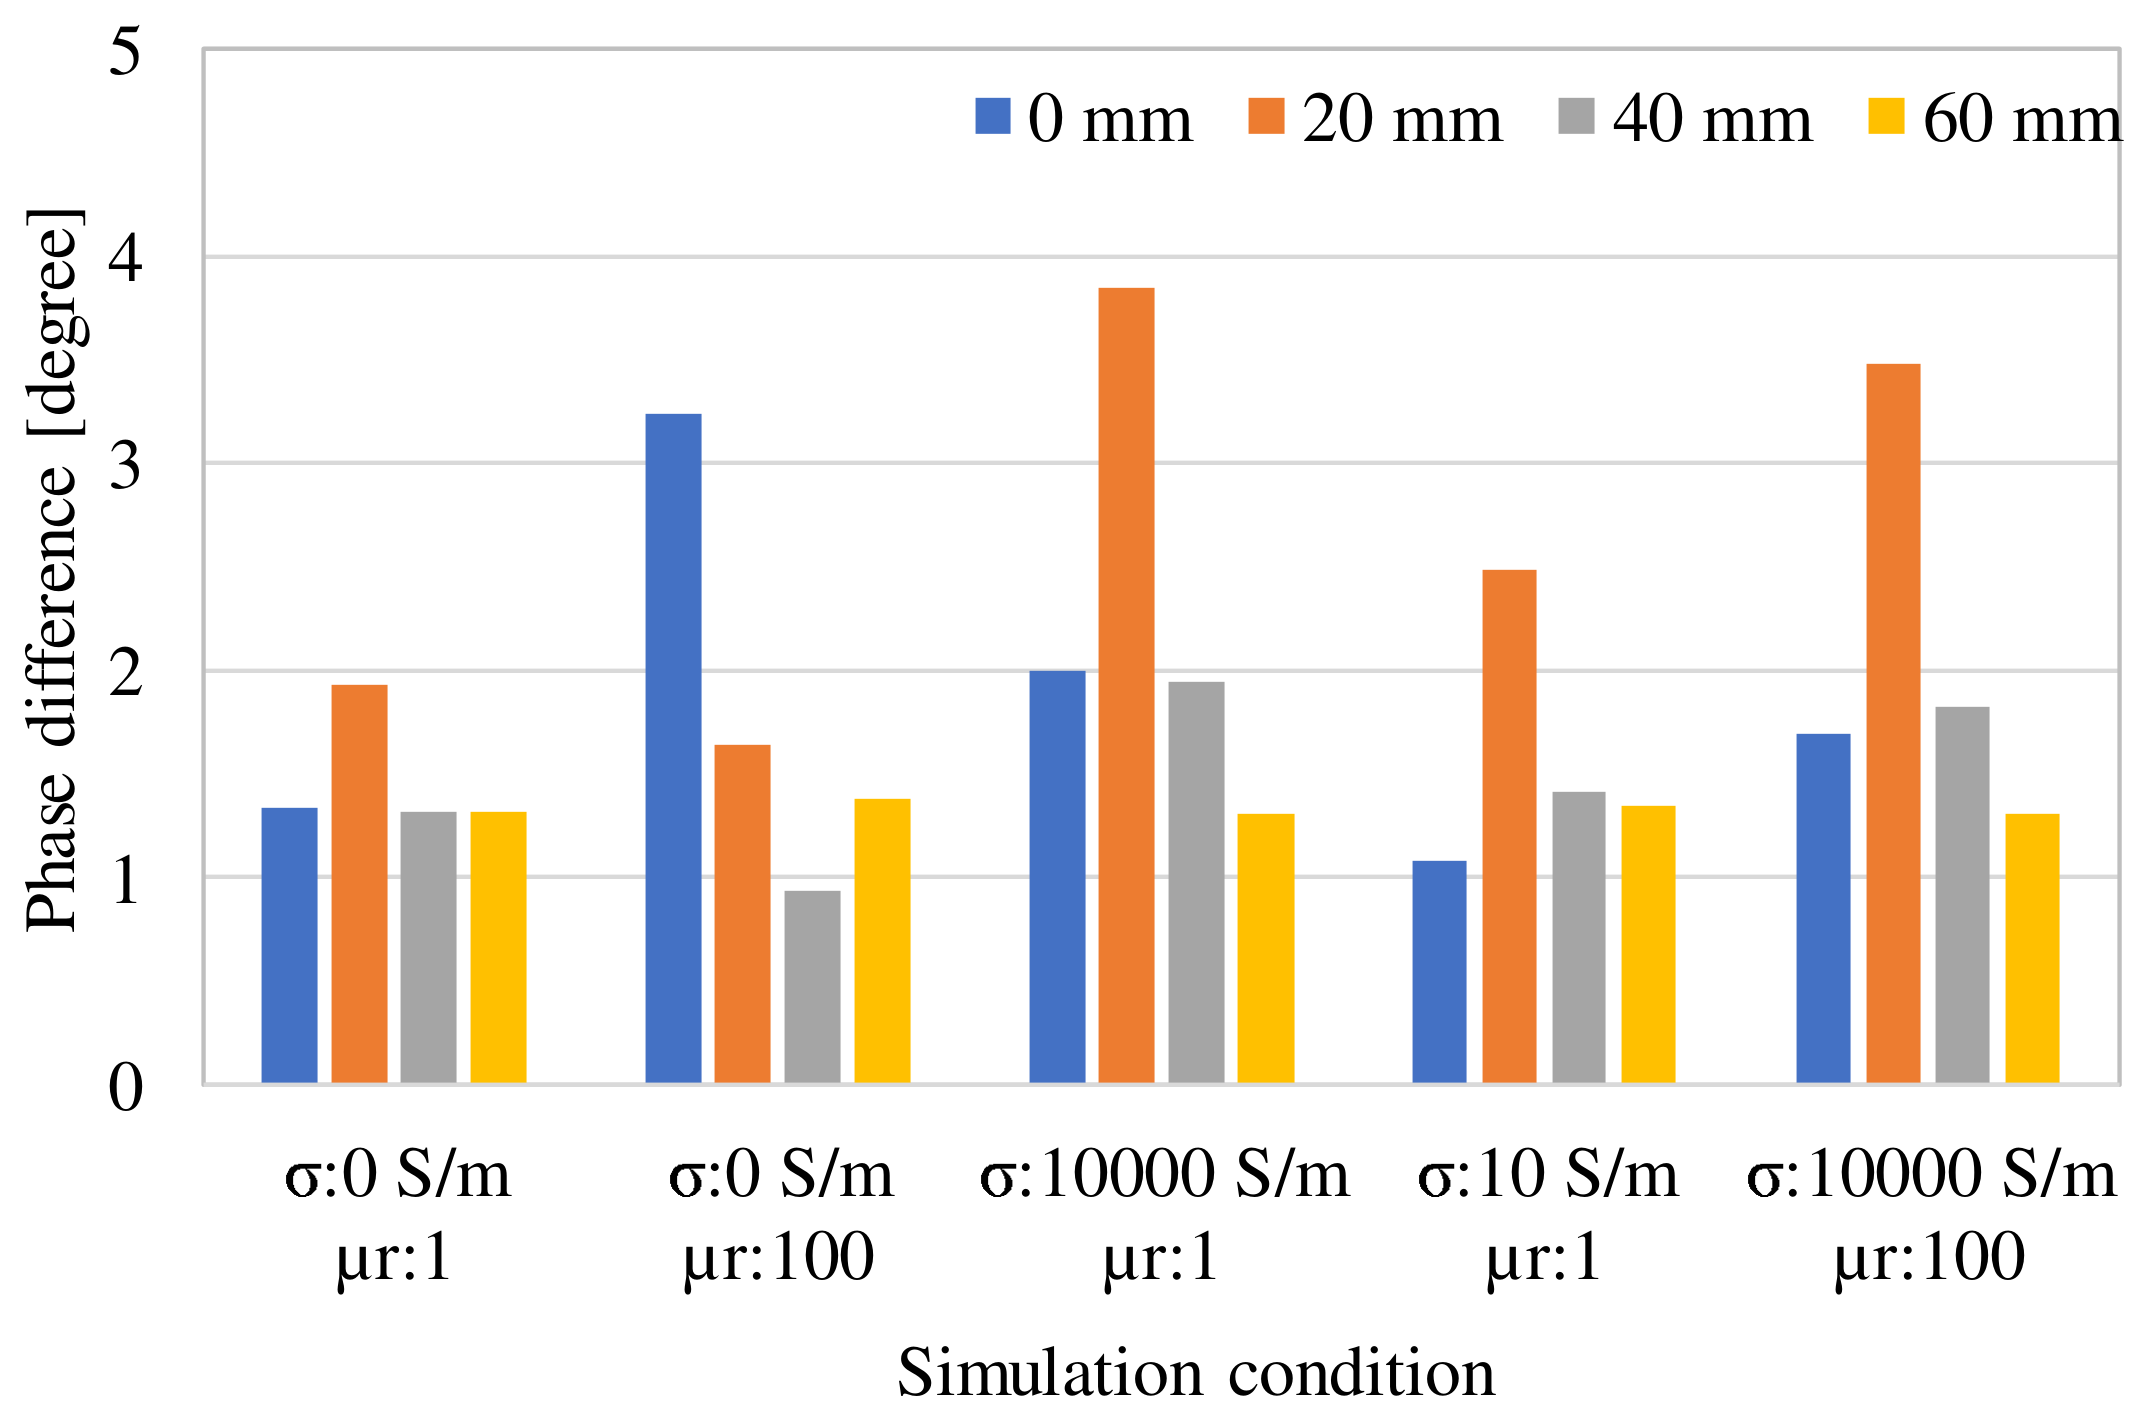
3. Examination of Various Parameters Using Electromagnetic Field Simulation
4. Experimental Measurement of Scattered Field Fluctuations Caused by Electromagnetic Materials
4.1. Selection of Electromagnetic Materials
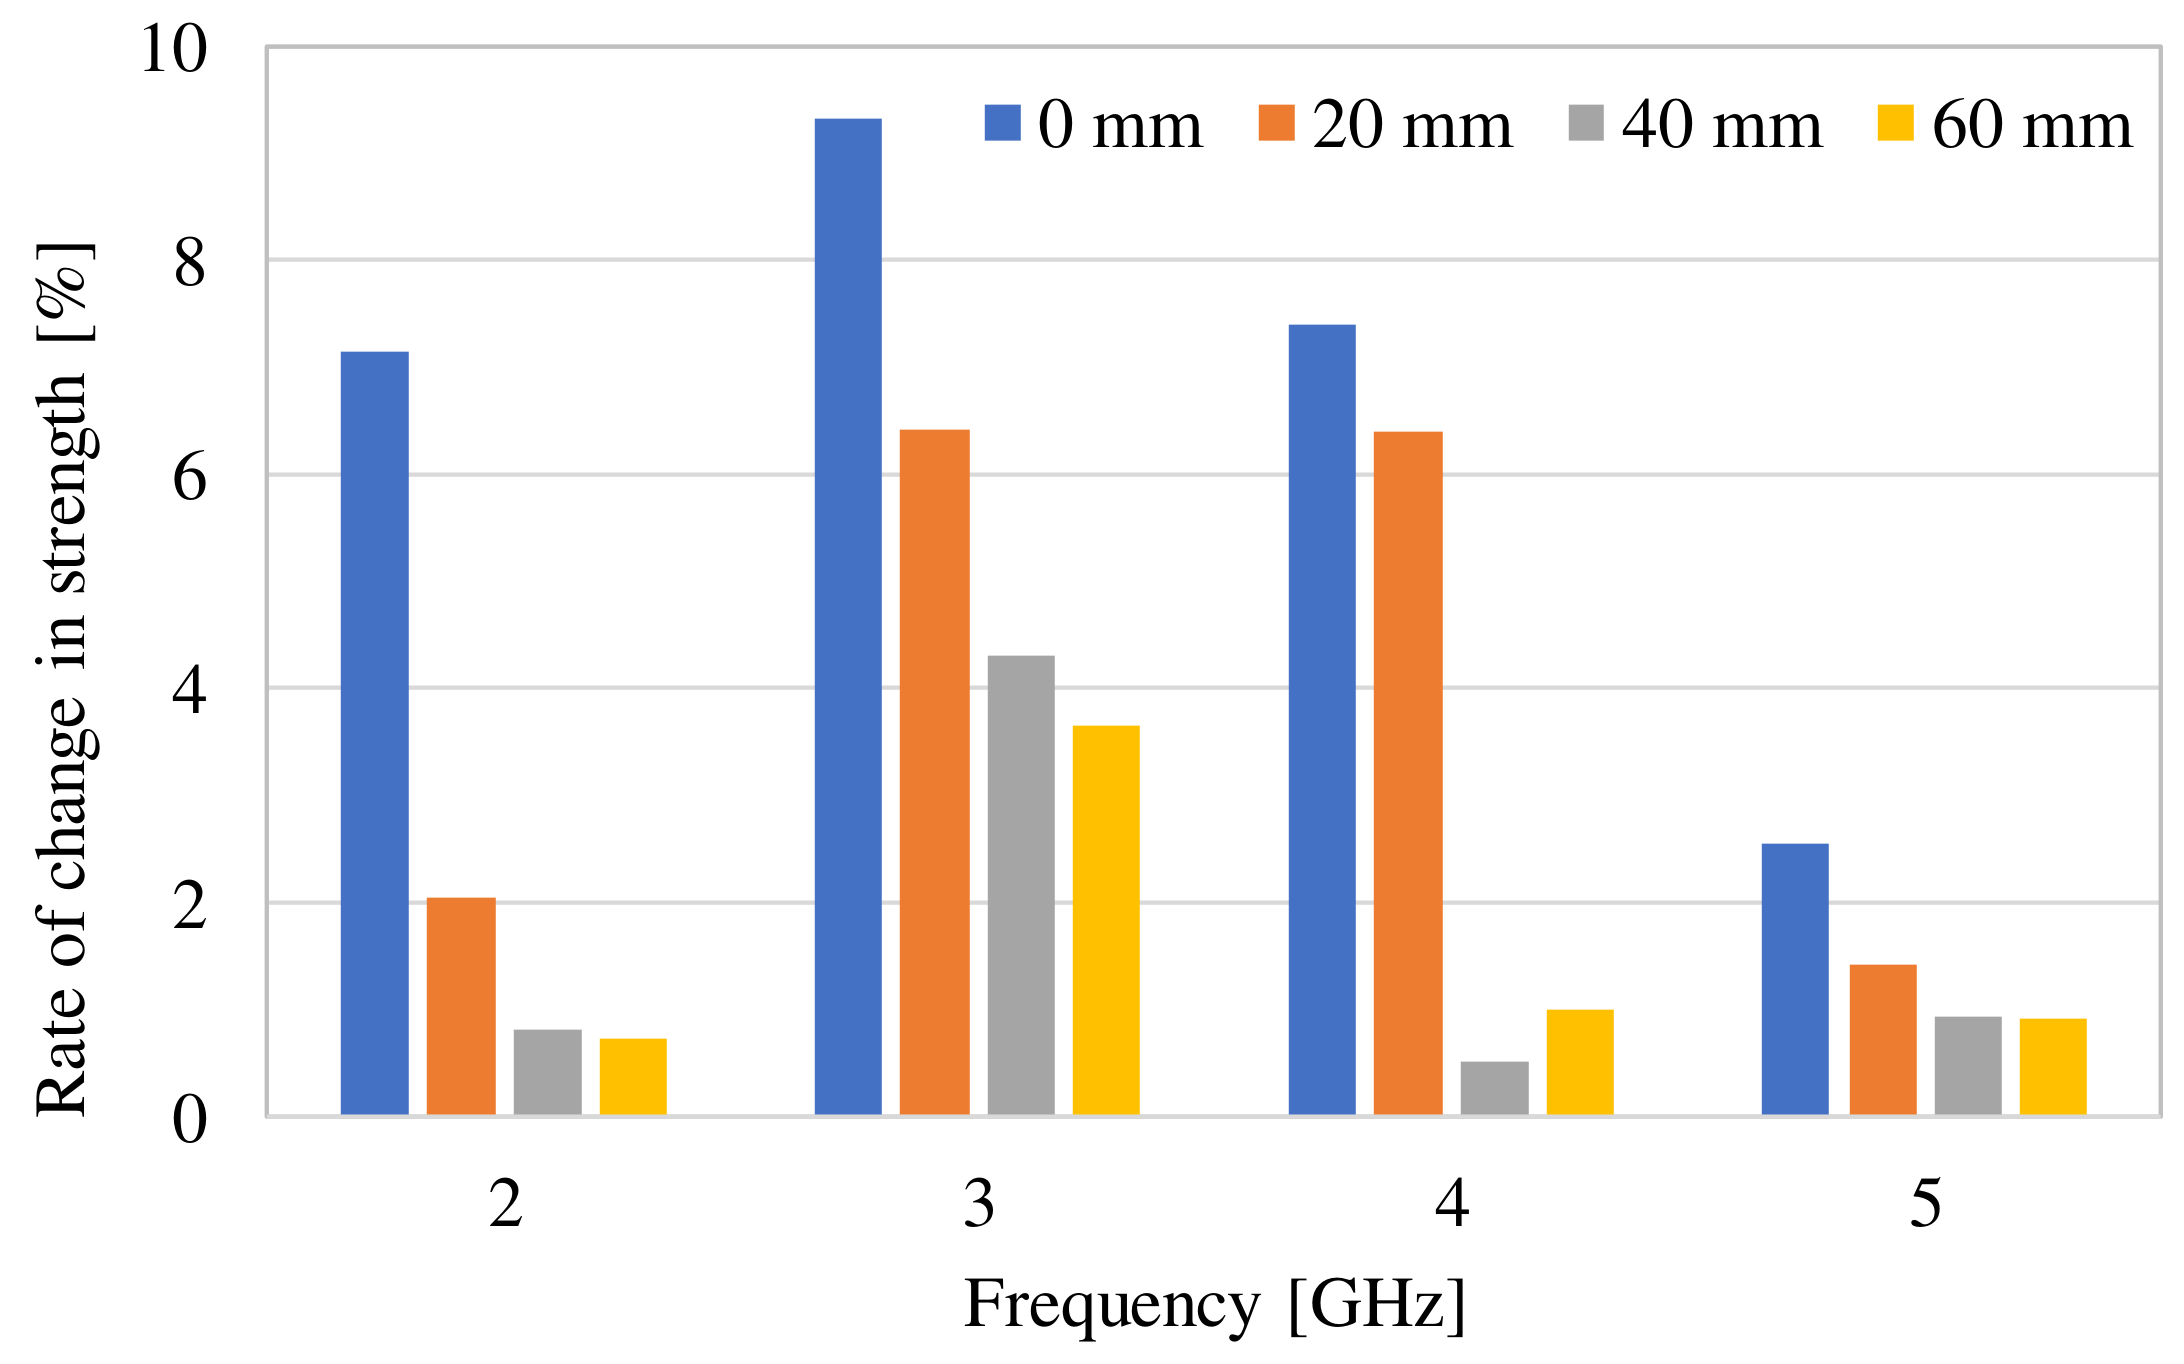
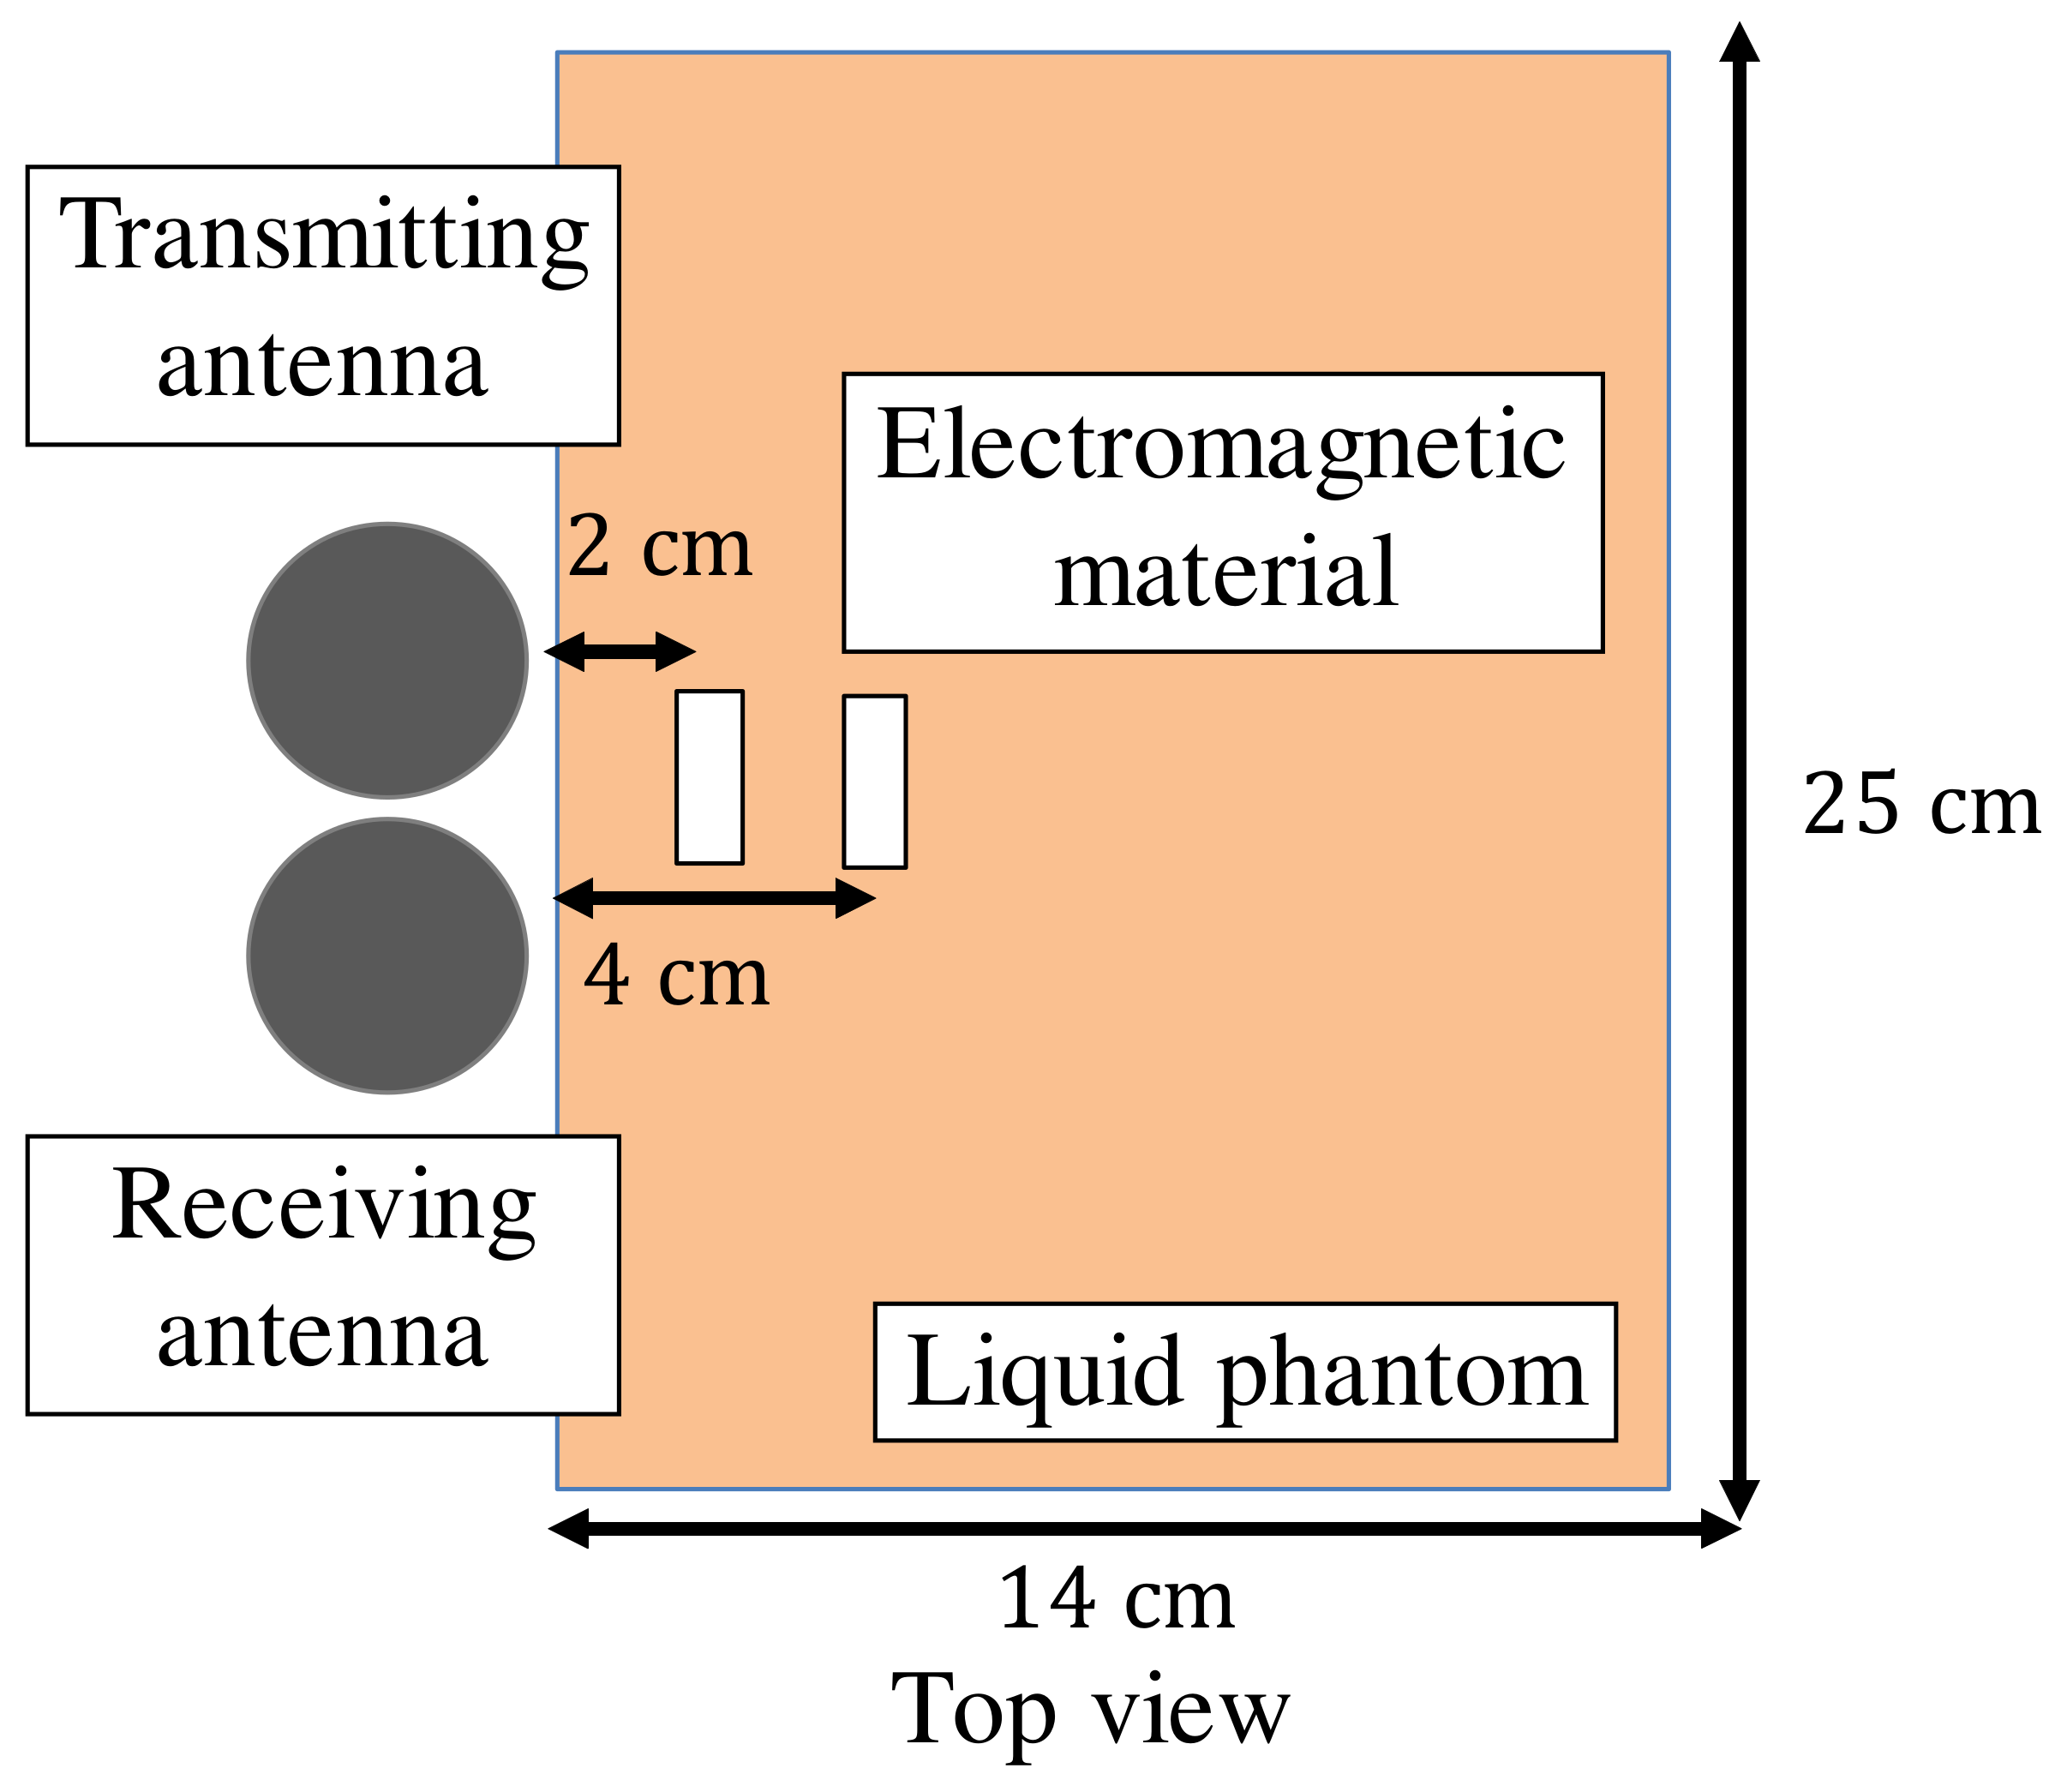
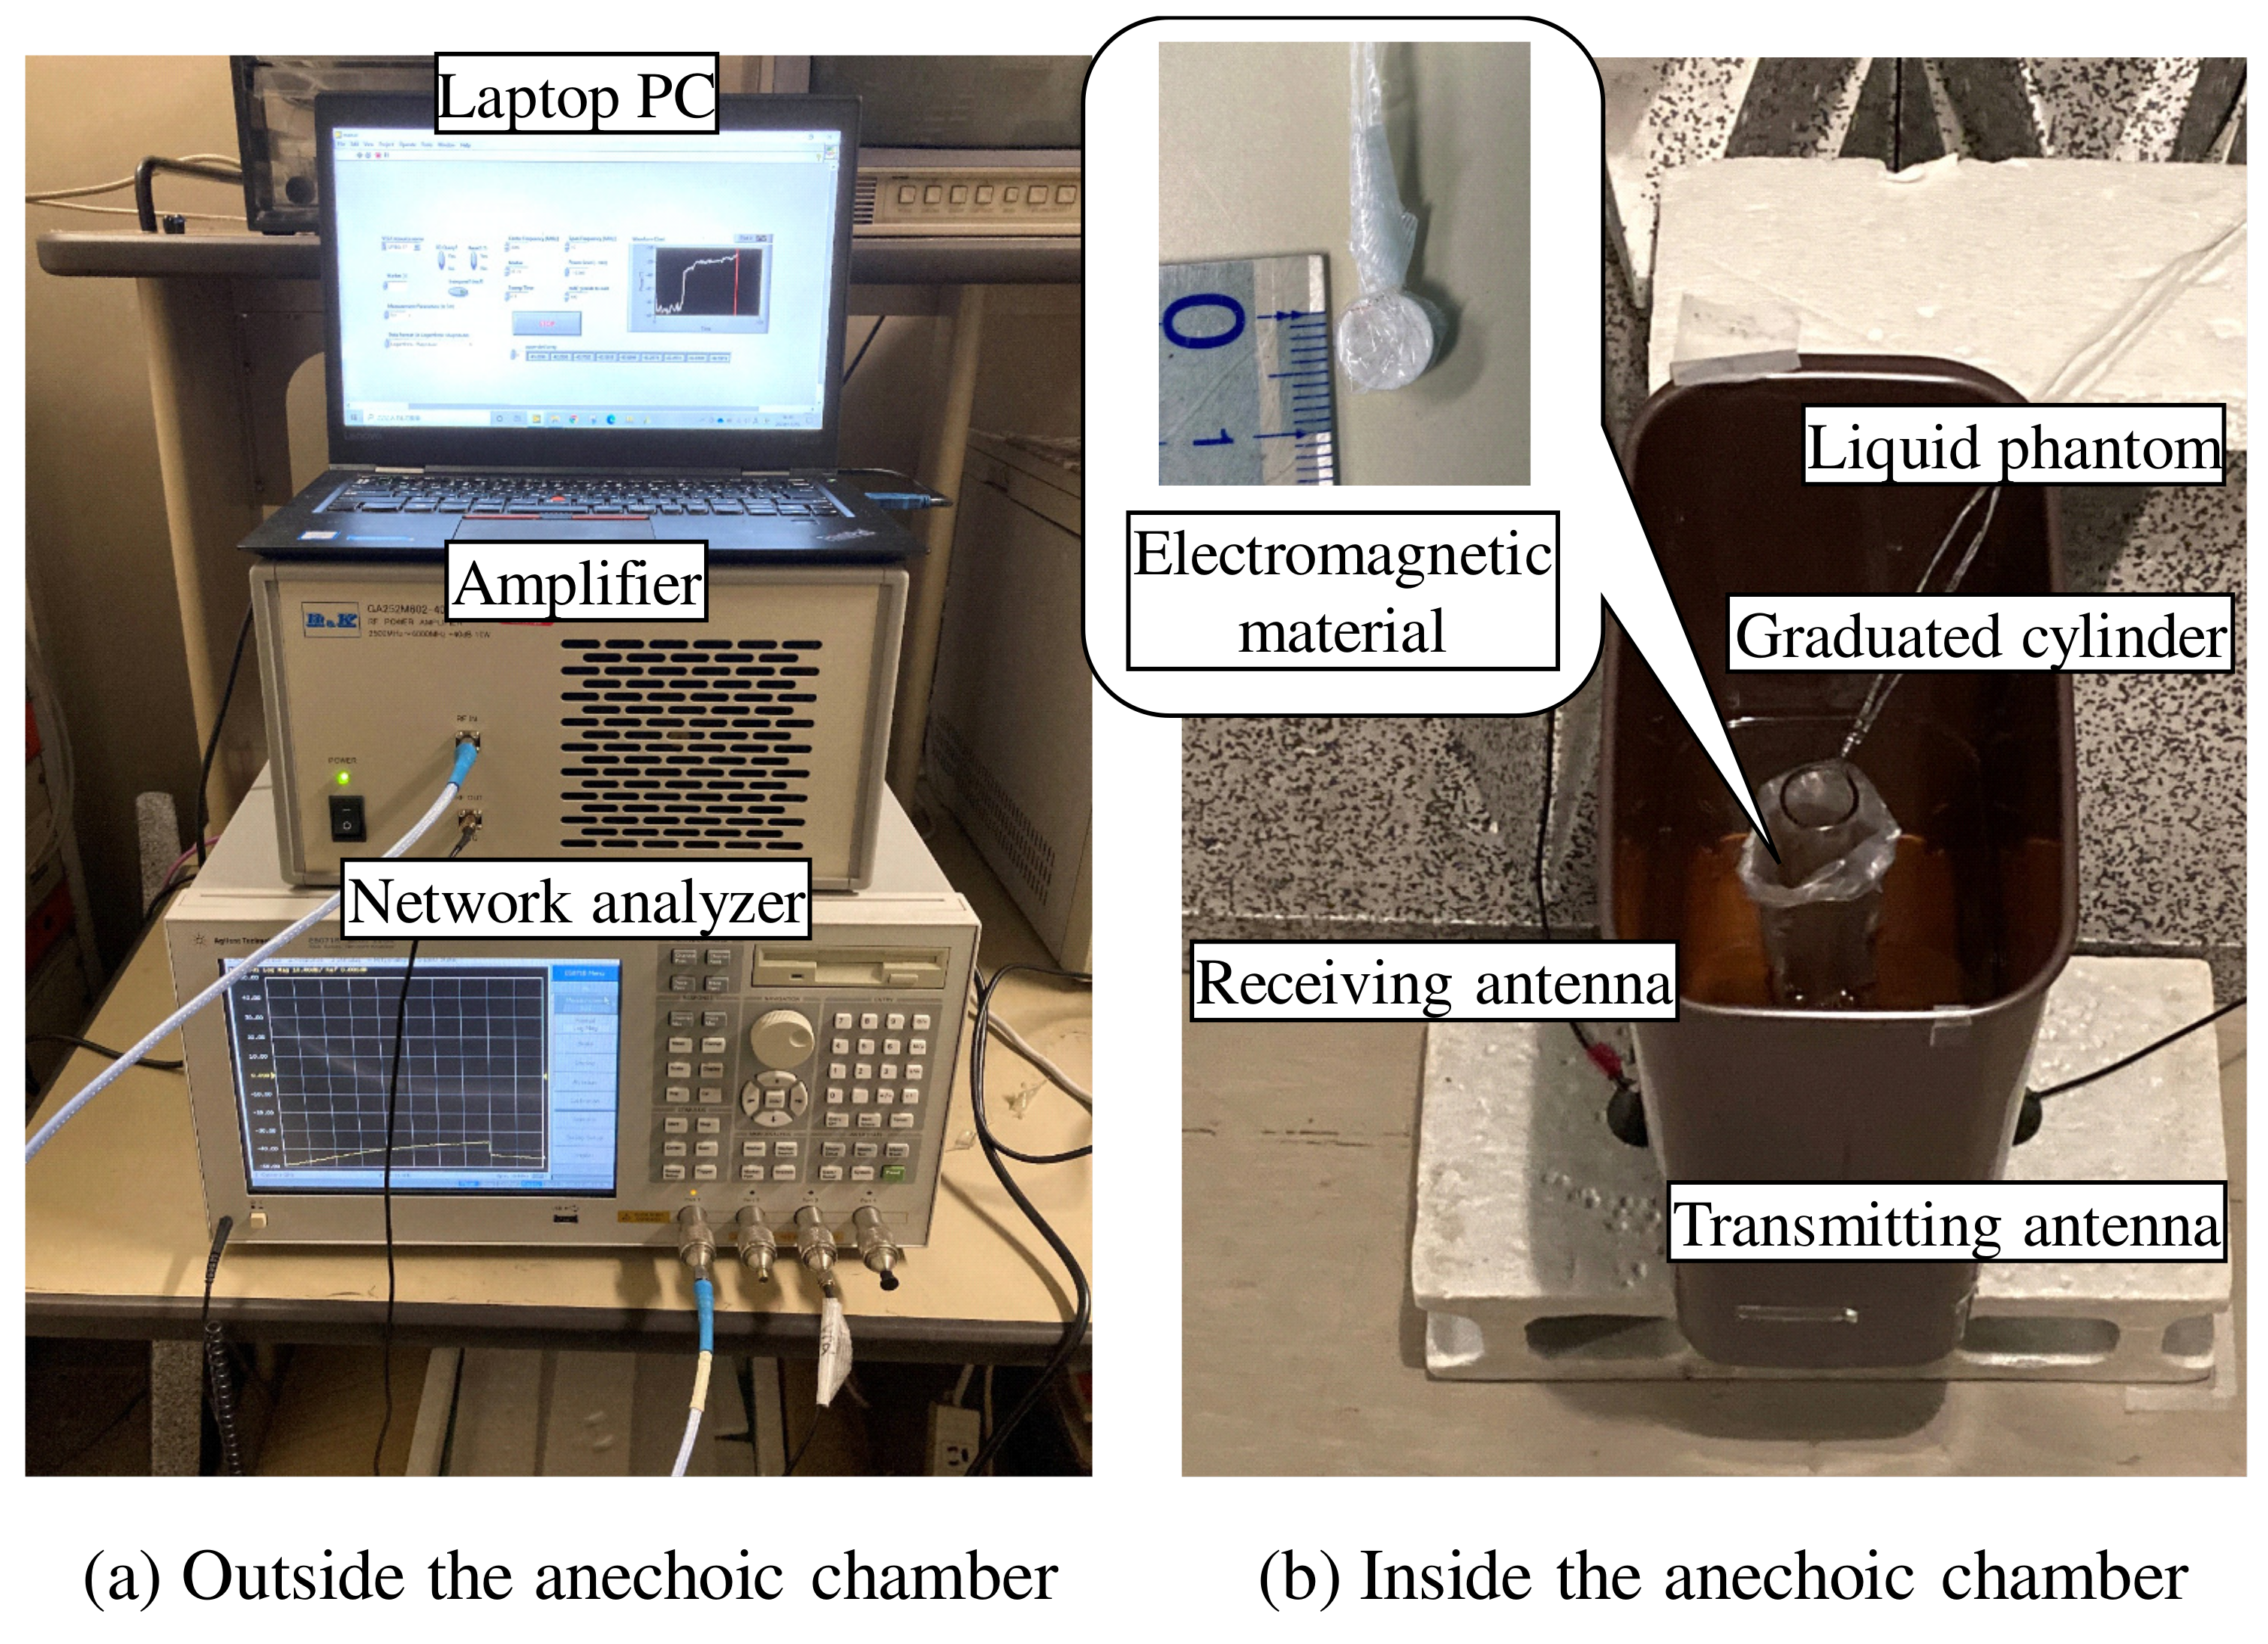
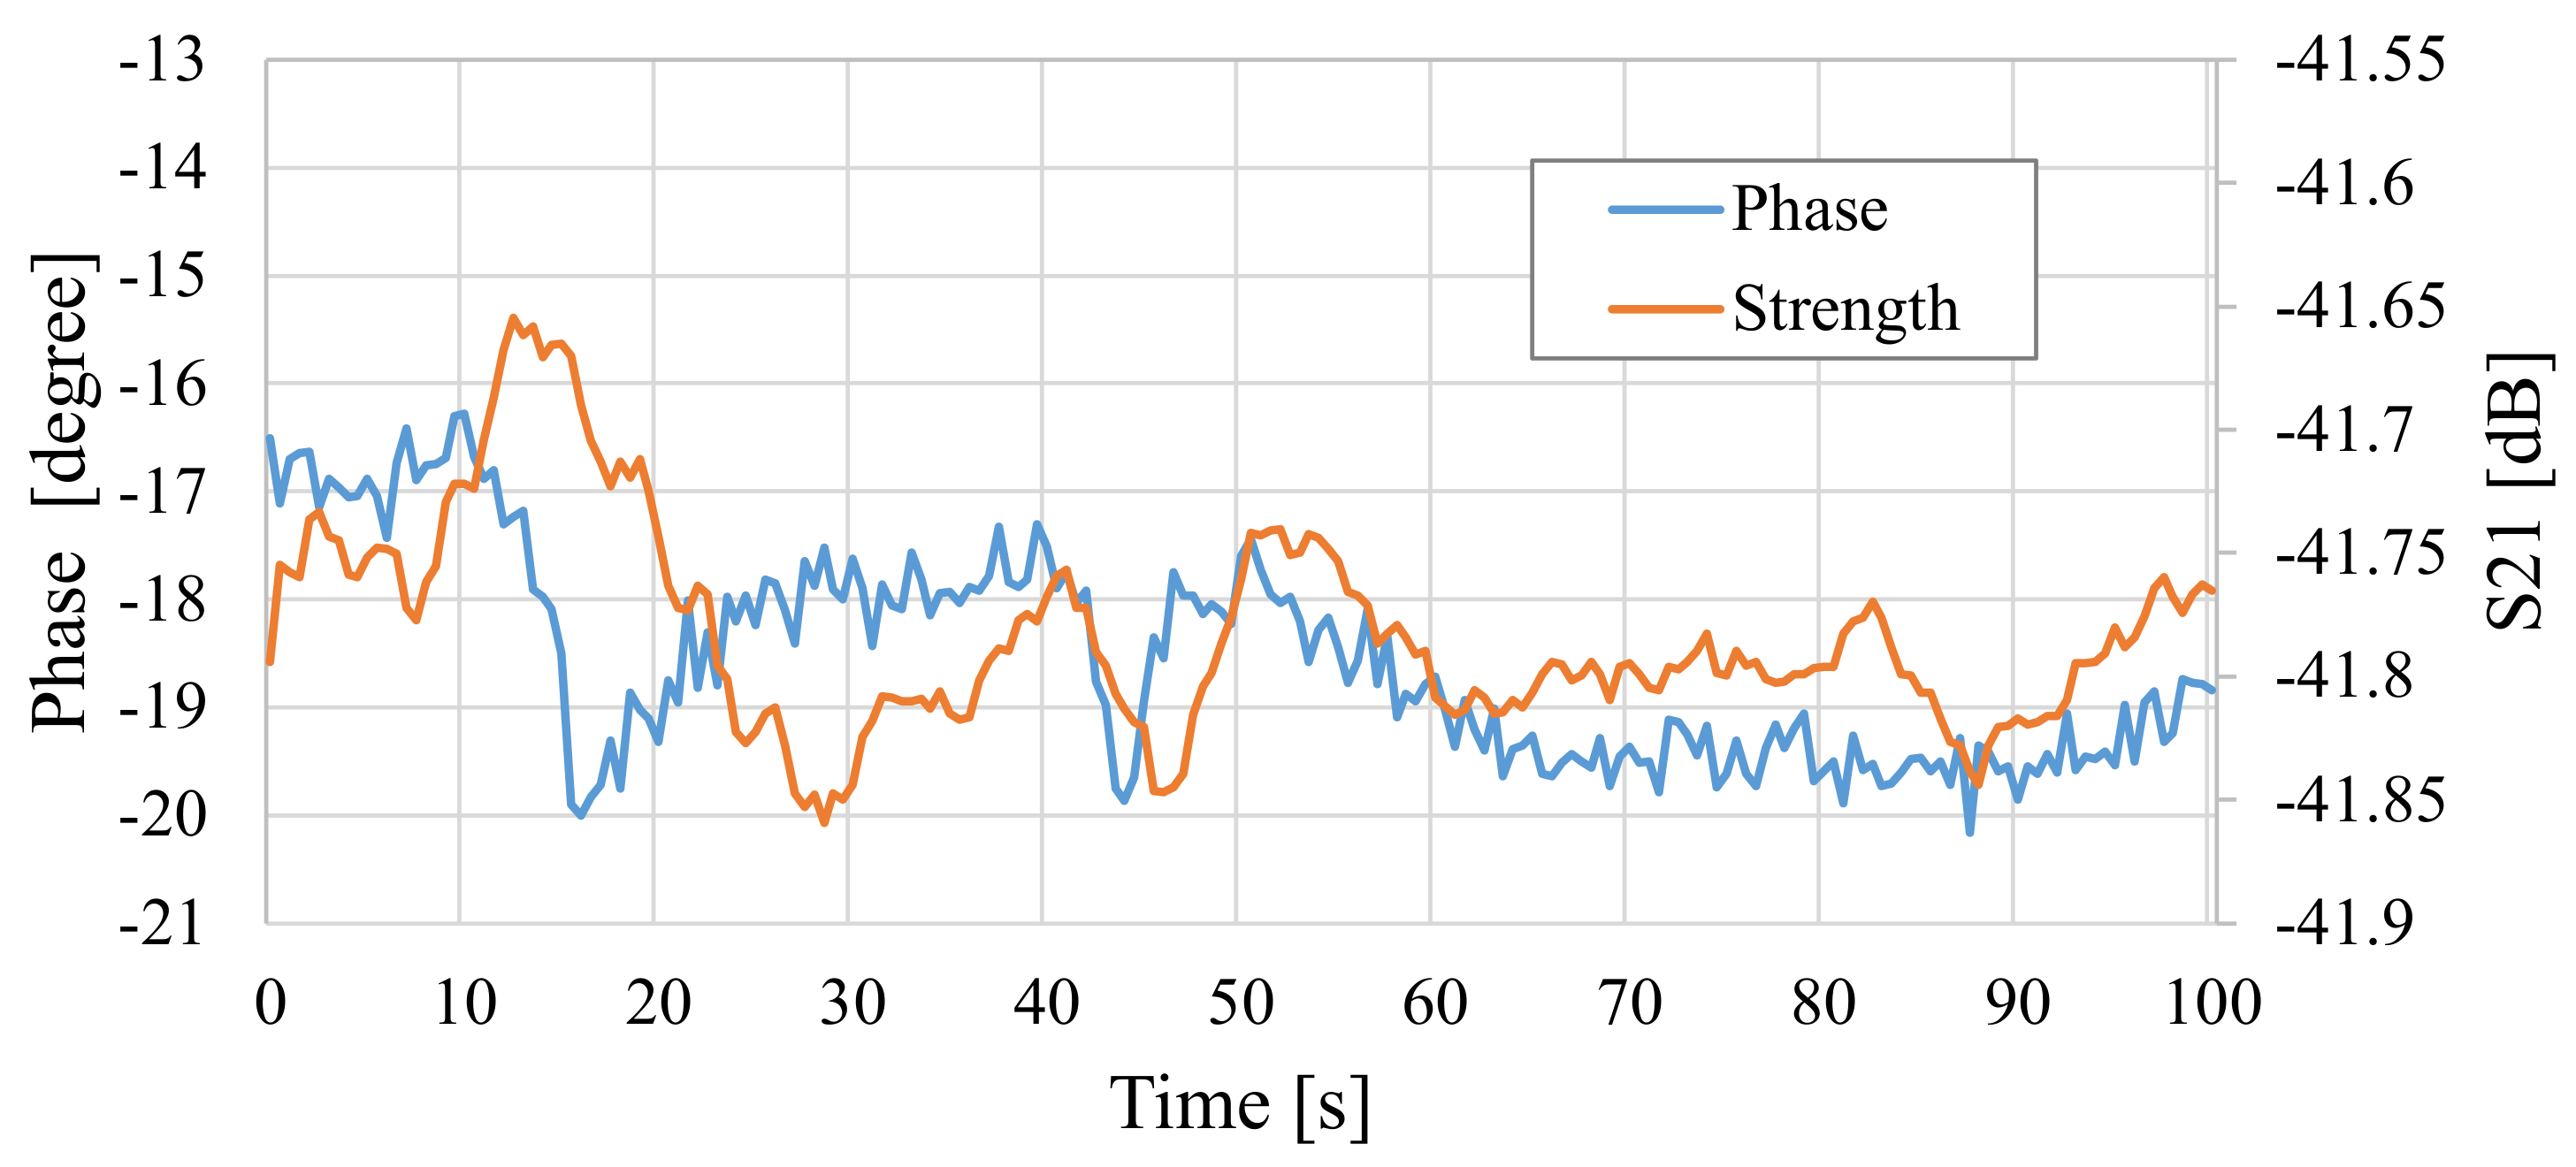
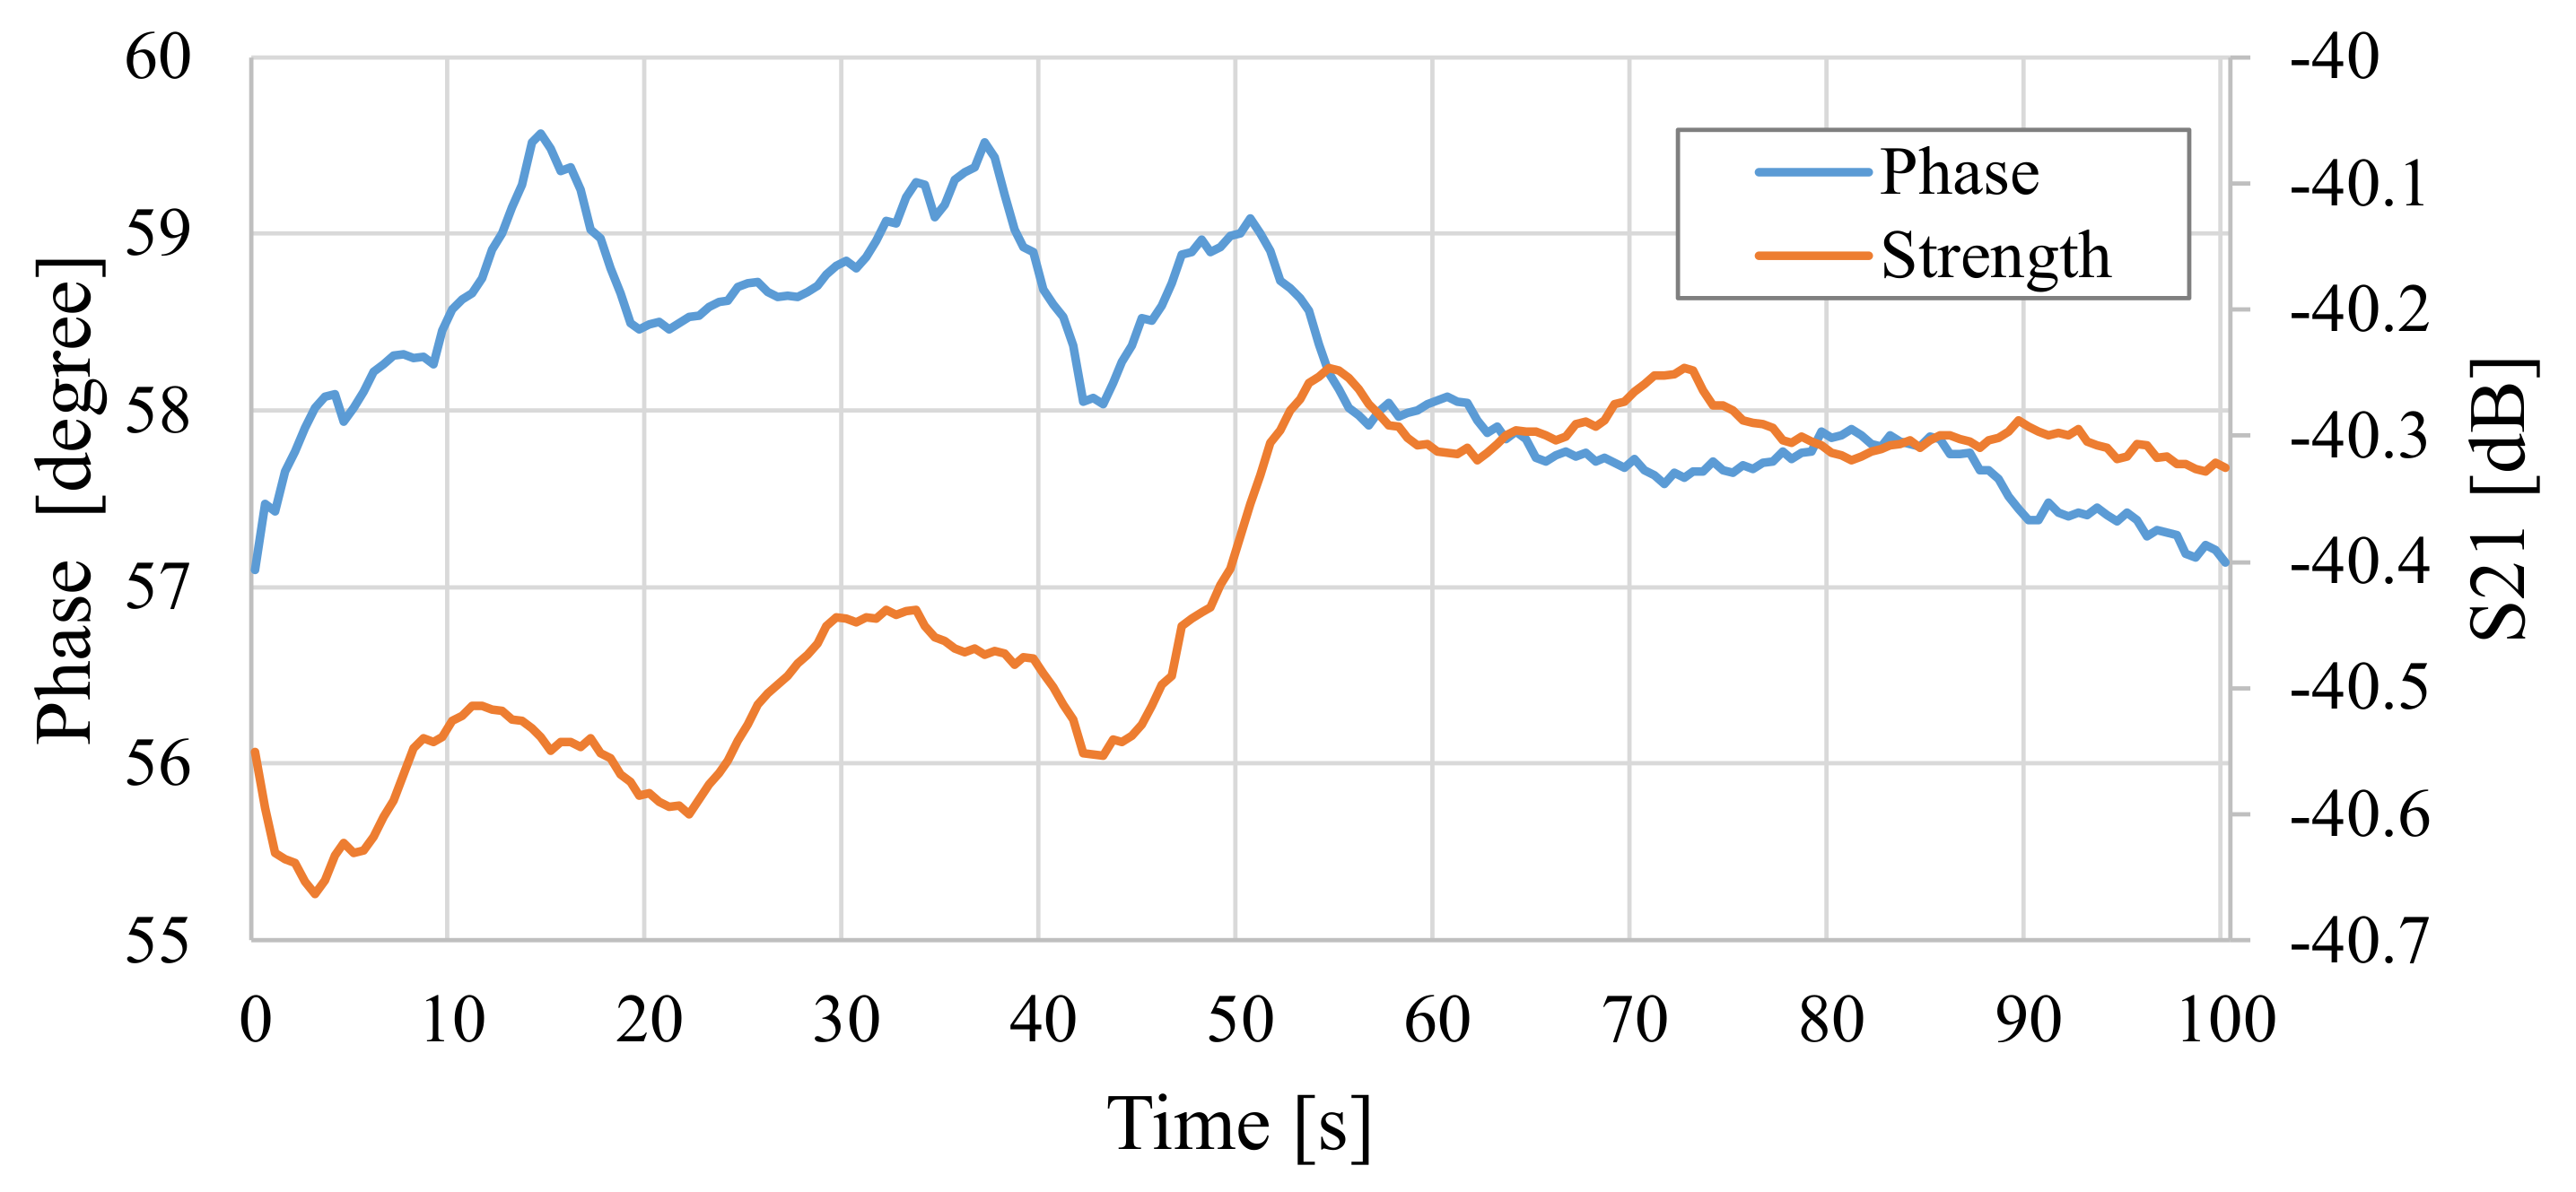
4.2. Experimental Measurement of Changes in Total Electric Field
5. Characteristic Evaluation of Detection Rate of Electromagnetic Materials
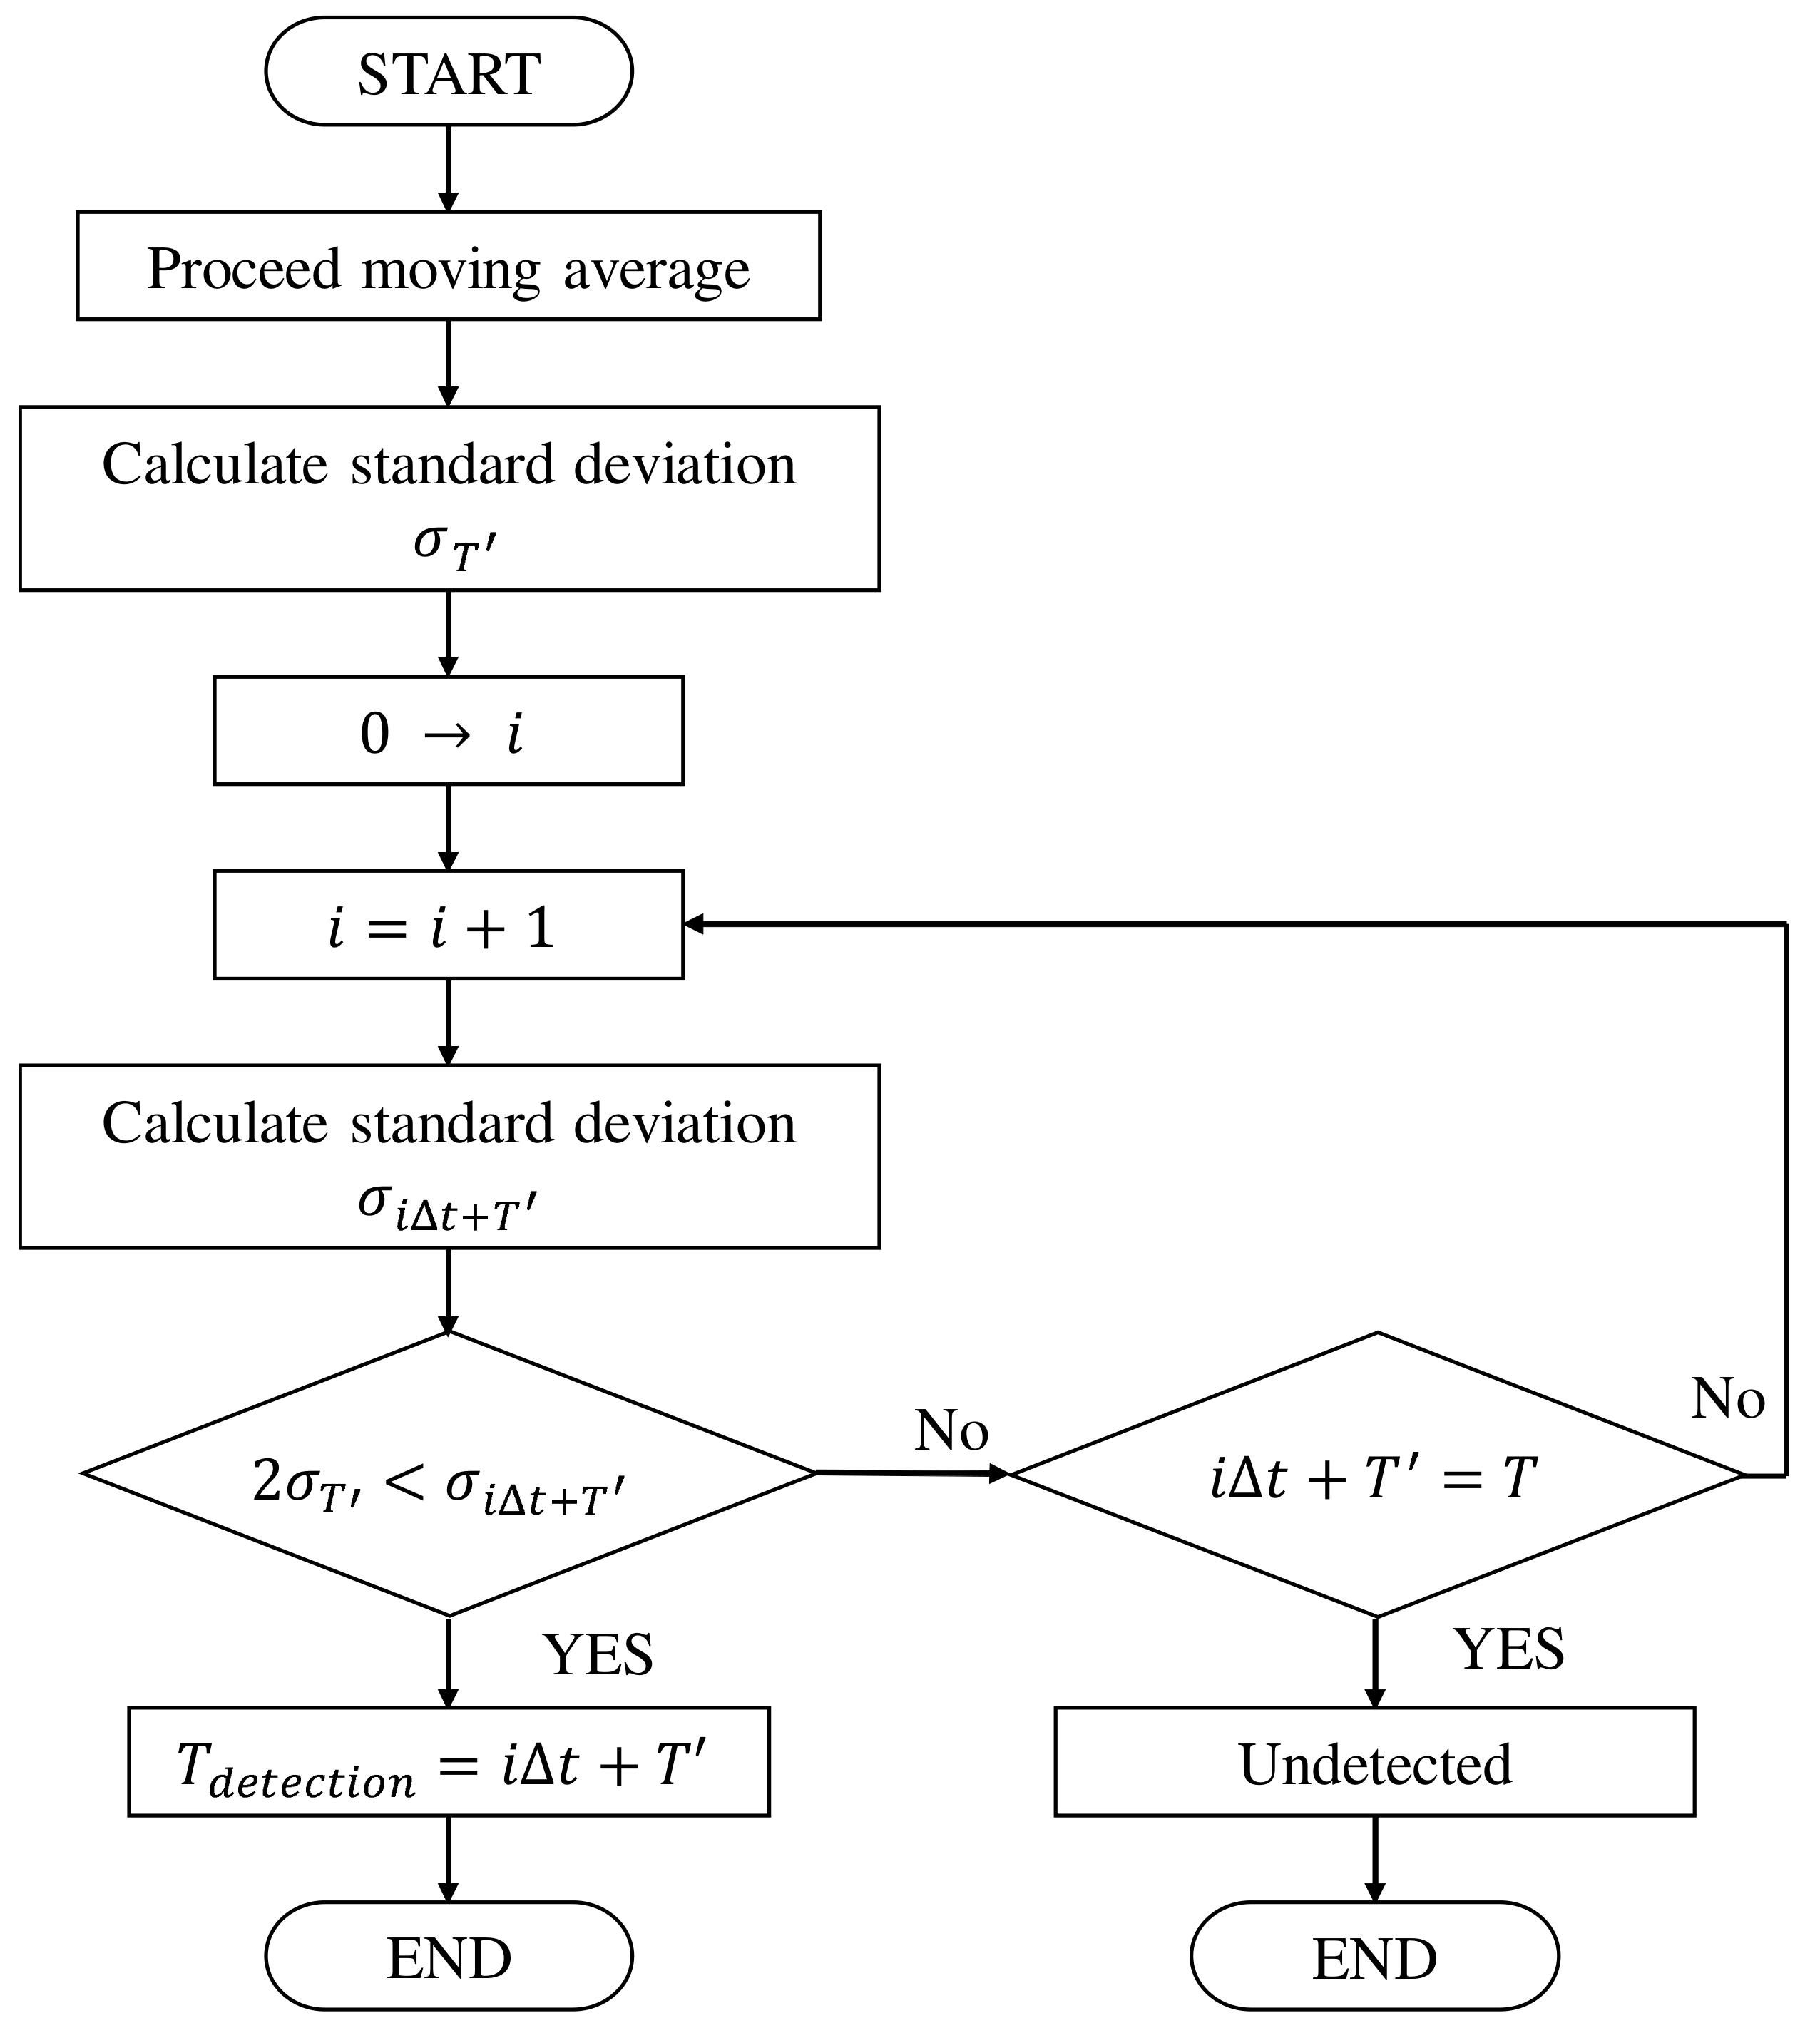
5.1. Proposal of Electromagnetic Material Detection Algorithm
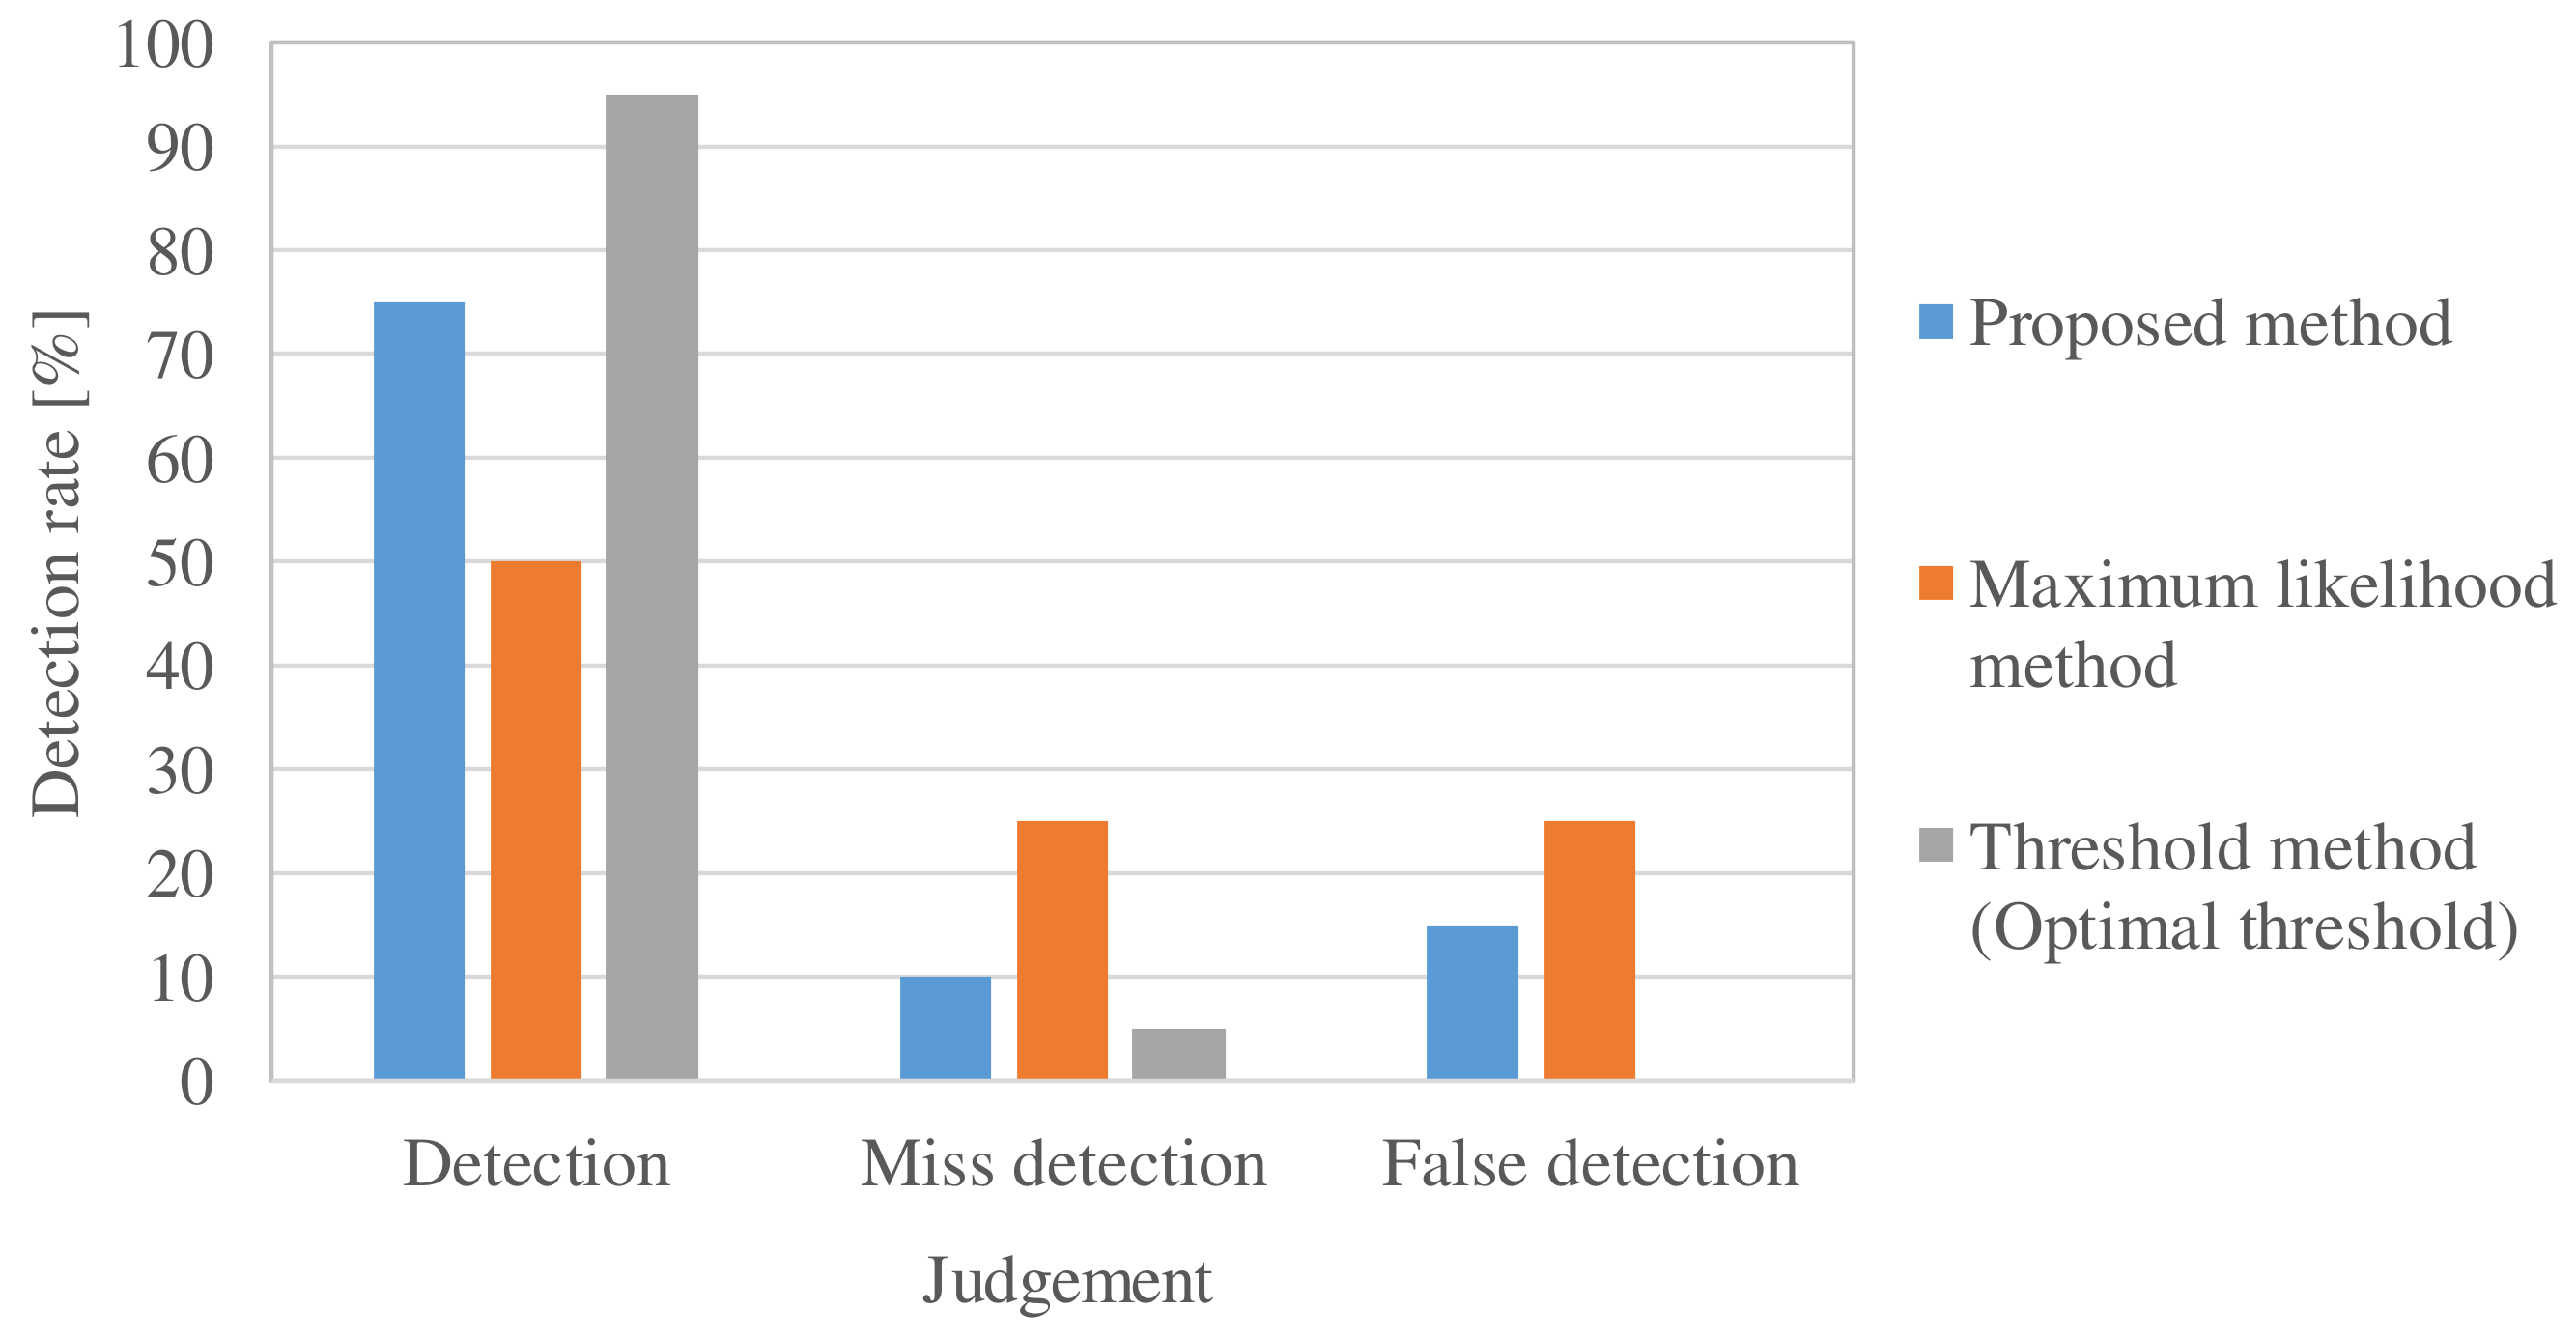
5.2. Experimental Evaluation of Electromagnetic Material Detection Rate
6. Conclusions
Author Contributions
Funding
Data Availability Statement
Conflicts of Interest
Abbreviations
| BAN | Body area network |
| WCE | Wireless capsule endoscopy |
| EM | Electromagnetic |
| RSSI | Received signal strength indicator |
| TOA | Time of arrival |
| CT | Computed tomography |
| FDTD | Finite-difference time-domain |
| MRI | Magnetic resonance imaging |
| SAR | Specific absorption rate |
References
- Wang, J.; Wang, Q. Body Area Communications: Channel Modeling, Communication Systems, and EMC; John Wiley & Sons: Hoboken, NJ, USA, 2012. [Google Scholar] [CrossRef]
- Otto, C.; Milenković, A.; Sanders, C.; Jovanov, E. System architecture of a wireless body area sensor network for ubiquitous health monitoring. J. Mob. Multimed. 2006, 1, 307–326. [Google Scholar] [CrossRef]
- 802.15.6-2012; IEEE Standard for Local and metropolitan area networks—Part 15.6: Wireless Body Area Networks. IEEE: Piscataway, NJ, USA, 2012. [CrossRef]
- Hafezi, H.; Robertson, T.L.; Moon, G.D.; Au-Yeung, K.Y.; Zdeblick, M.J.; Savage, G.M. An ingestible sensor for measuring medication adherence. IEEE Trans. Biomed. Eng. 2014, 62, 99–109. [Google Scholar] [CrossRef] [PubMed]
- Otsuka Pharmaceutical Co., Ltd. Otsuka and Proteus Announce the First U.S. FDA Approval of a Digital Medicine System: ABILIFY MYCITE (Aripiprazole Tablets with Sensor). Available online: https://www.otsuka.co.jp/en/company/newsreleases/2017/20171114_1.html (accessed on 8 January 2024).
- Kawasaki, M.; Kohno, R. Position estimation method of medical implanted devices using estimation of propagation velocity inside human body. IEICE Trans. Commun. 2009, 92, 403–409. [Google Scholar] [CrossRef]
- Pourhomayoun, M.; Fowler, M.; Jin, Z. A novel method for medical implant in-body localization. In Proceedings of the 2012 Annual International Conference of the IEEE Engineering in Medicine and Biology Society, San Diego, CA, USA, 28 August–1 September 2012; pp. 5757–5760. [Google Scholar] [CrossRef]
- Xu, Y.; Dandan, W.; Hua, F. Underwater acoustic source localization method based on TDOA with particle filtering. In Proceedings of the 26th Chinese Control and Decision Conference (2014 CCDC), Changsha, China, 31 May–2 June 2014; pp. 4634–4637. [Google Scholar] [CrossRef]
- Goh, S.T.; Zekavat, S.A.; Pahlavan, K. DOA-based endoscopy capsule localization and orientation estimation via unscented Kalman filter. IEEE Sen. J. 2014, 14, 3819–3829. [Google Scholar] [CrossRef]
- Umashankar, K.; Taflove, A.; Rao, S. Electromagnetic scattering by arbitrary shaped three-dimensional homogeneous lossy dielectric objects. IEEE Trans. Antennas Propag. 1986, 34, 758–766. [Google Scholar] [CrossRef]
- Wang, J. A Study on Noninvative Measurement of Dielectric Properties and Electromagnetic Wave Absorption of Biological Tissue. Ph.D. Thesis, Tohoku University, Sendai, Japan, 1991. [Google Scholar]
- Richmond, J. Scattering by a dielectric cylinder of arbitrary cross section shape. IEEE Trans. Antennas Propag. 1965, 13, 334–341. [Google Scholar] [CrossRef]
- Chew, W.C.; Wang, Y.M. Reconstruction of two-dimensional permittivity distribution using the distorted Born iterative method. IEEE Trans. Med. Imaging 1990, 9, 218–225. [Google Scholar] [CrossRef] [PubMed]
- Kobayashi, H.; Anzai, D.; Wang, J. Em imaging-based capsule endoscope localization with peak-formed incident electric fields. In Proceedings of the 13th EAI International Conference on Body Area Networks, Oulu, Finland, 2–3 October 2018; Springer: Berlin/Heidelberg, Germany, 2020. [Google Scholar] [CrossRef]
- Schmid & Partner Engineering AG. SEMCAD & Matterhorn. Available online: https://speag.swiss/products/semcad/overview/ (accessed on 8 January 2024).
- Chavannes, N.; Fortunato, C.; Ofli, E.; Kuster, N. SEMCAD X matterhorn: A novel approach to achieve realism in highly complex environments. In Proceedings of the 2015 9th European Conference on Antennas and Propagation (EuCAP), Lisbon, Portugal, 13–17 April 2015; IEEE: Piscataway, NJ, USA, 2015; pp. 1–2. [Google Scholar]
- Taflove, A.; Hagness, S.; Piket-May, M. Computational Electrodynamics: The Finite-Difference Time-Domain Method; Artech House: Norwood, MA, USA, 2005. [Google Scholar] [CrossRef]
- Teixeira, F.L.; Sarris, C.; Zhang, Y.; Na, D.Y.; Berenger, J.P.; Su, Y.; Okoniewski, M.; Chew, W.C.; Backman, V.; Simpson, J.J. Finite-difference time-domain methods. Nat. Rev. Methods Prim. 2023, 3, 75. [Google Scholar] [CrossRef]
- Sugimoto, S.I.; Takei, A.; Ogino, M. Finite element analysis with tens of billions of degrees of freedom in a high-frequency electromagnetic field. Mech. Eng. Lett. 2017, 3, 16-00667. [Google Scholar] [CrossRef]
- Yu, W. Electromagnetic Simulation Techniques Based on the FDTD Method; John Wiley & Sons: Hoboken, NJ, USA, 2009; Volume 221. [Google Scholar]
- Gaffar, M.; Jiao, D. An explicit and unconditionally stable FDTD method for electromagnetic analysis. IEEE Trans. Microw. Theory Tech. 2014, 62, 2538–2550. [Google Scholar] [CrossRef]
- Cheng, Y.; Chen, G.; Wang, X.H.; Yang, S. Investigation of numerical dispersion with time step of the FDTD methods: Avoiding erroneous conclusions. IET Microwaves, Antennas Propag. 2021, 15, 691–703. [Google Scholar] [CrossRef]
- Onishi, T.; Uebayashi, S. Biological tissue-equivalent phantoms usable in broadband frequency range. NTT DoCoMo Tech. J. 2006, 7, 61–65. [Google Scholar]
- Kletsov, A.; Chernokalov, A.; Khripkov, A.; Cho, J.; Druchinin, S. Microwave non-contact imaging of subcutaneous human body tissues. Healthc. Technol. Lett. 2015, 2, 108–111. [Google Scholar] [CrossRef] [PubMed]
- International Commission on Non-Ionizing Radiation Protection (ICNIRP). Guidelines for limiting exposure to electromagnetic fields (100 kHz to 300 GHz). Health Phys. 2020, 118, 483–524. [Google Scholar] [CrossRef] [PubMed]


| Frequency of Incident Wave (GHz) | 2, 3, 4, 5 | |
|---|---|---|
| Liquid phantom | Relative permittivity | 37.93 |
| Conductivity | 0.536 | |
| Glass material | Relative permittivity | 4.6 |
| Conductivity | ||
| Relative permittivity | 4 | |
| Dielectromagnetic test materials | Conductivity | 0, 10, 10,000 |
| Relative permeability | 1, 100 | |
| Sample Number | Test Material |
|---|---|
| 1 | Maghemite |
| 2 | Hematite |
| 3 | Magnetite |
| 4 | Black iron oxide treated with metaphosphate |
| 5 | Epsilon-type iron oxide |
| 6 | Anhydrous calcium hydrogen phosphate |
| 7 | Calcium carbonate |
| 8 | Titanium oxide |
| 9 | Magnesium oxide |
| 10 | Magnesium aluminate silicate |
| 11 | Magnesium silicate |
| 12 | Synthetic aluminum silicate |
| 13 | Dry aluminum hydroxide gel |
| 14 | Amber Light IRP88 |
| 15 | Amber Light IRP69 |
| 16 | Carbon microcoil (CMC) |
| Sample Number | Received Power Change [dB] | |
|---|---|---|
| 2 cm | 4 cm | |
| 1 | 36.8 | 0.7 |
| 2 | 8.6 | 0.2 |
| 3 | 19.4 | 0.7 |
| 4 | 24.5 | 2.3 |
| 5 | 4.9 | 0.9 |
| 6 | 33.7 | 1.4 |
| 7 | 12.5 | 2.6 |
| 8 | 23.3 | 2.6 |
| 9 | 29.1 | 3 |
| 10 | 25.6 | 2.3 |
| 11 | 7.6 | 3.3 |
| 12 | 4.5 | 1.2 |
| 13 | 11.3 | 2.8 |
| 14 | 15.6 | 0.2 |
| 15 | 39.3 | 0.2 |
| 16 | 12.9 | 1.6 |
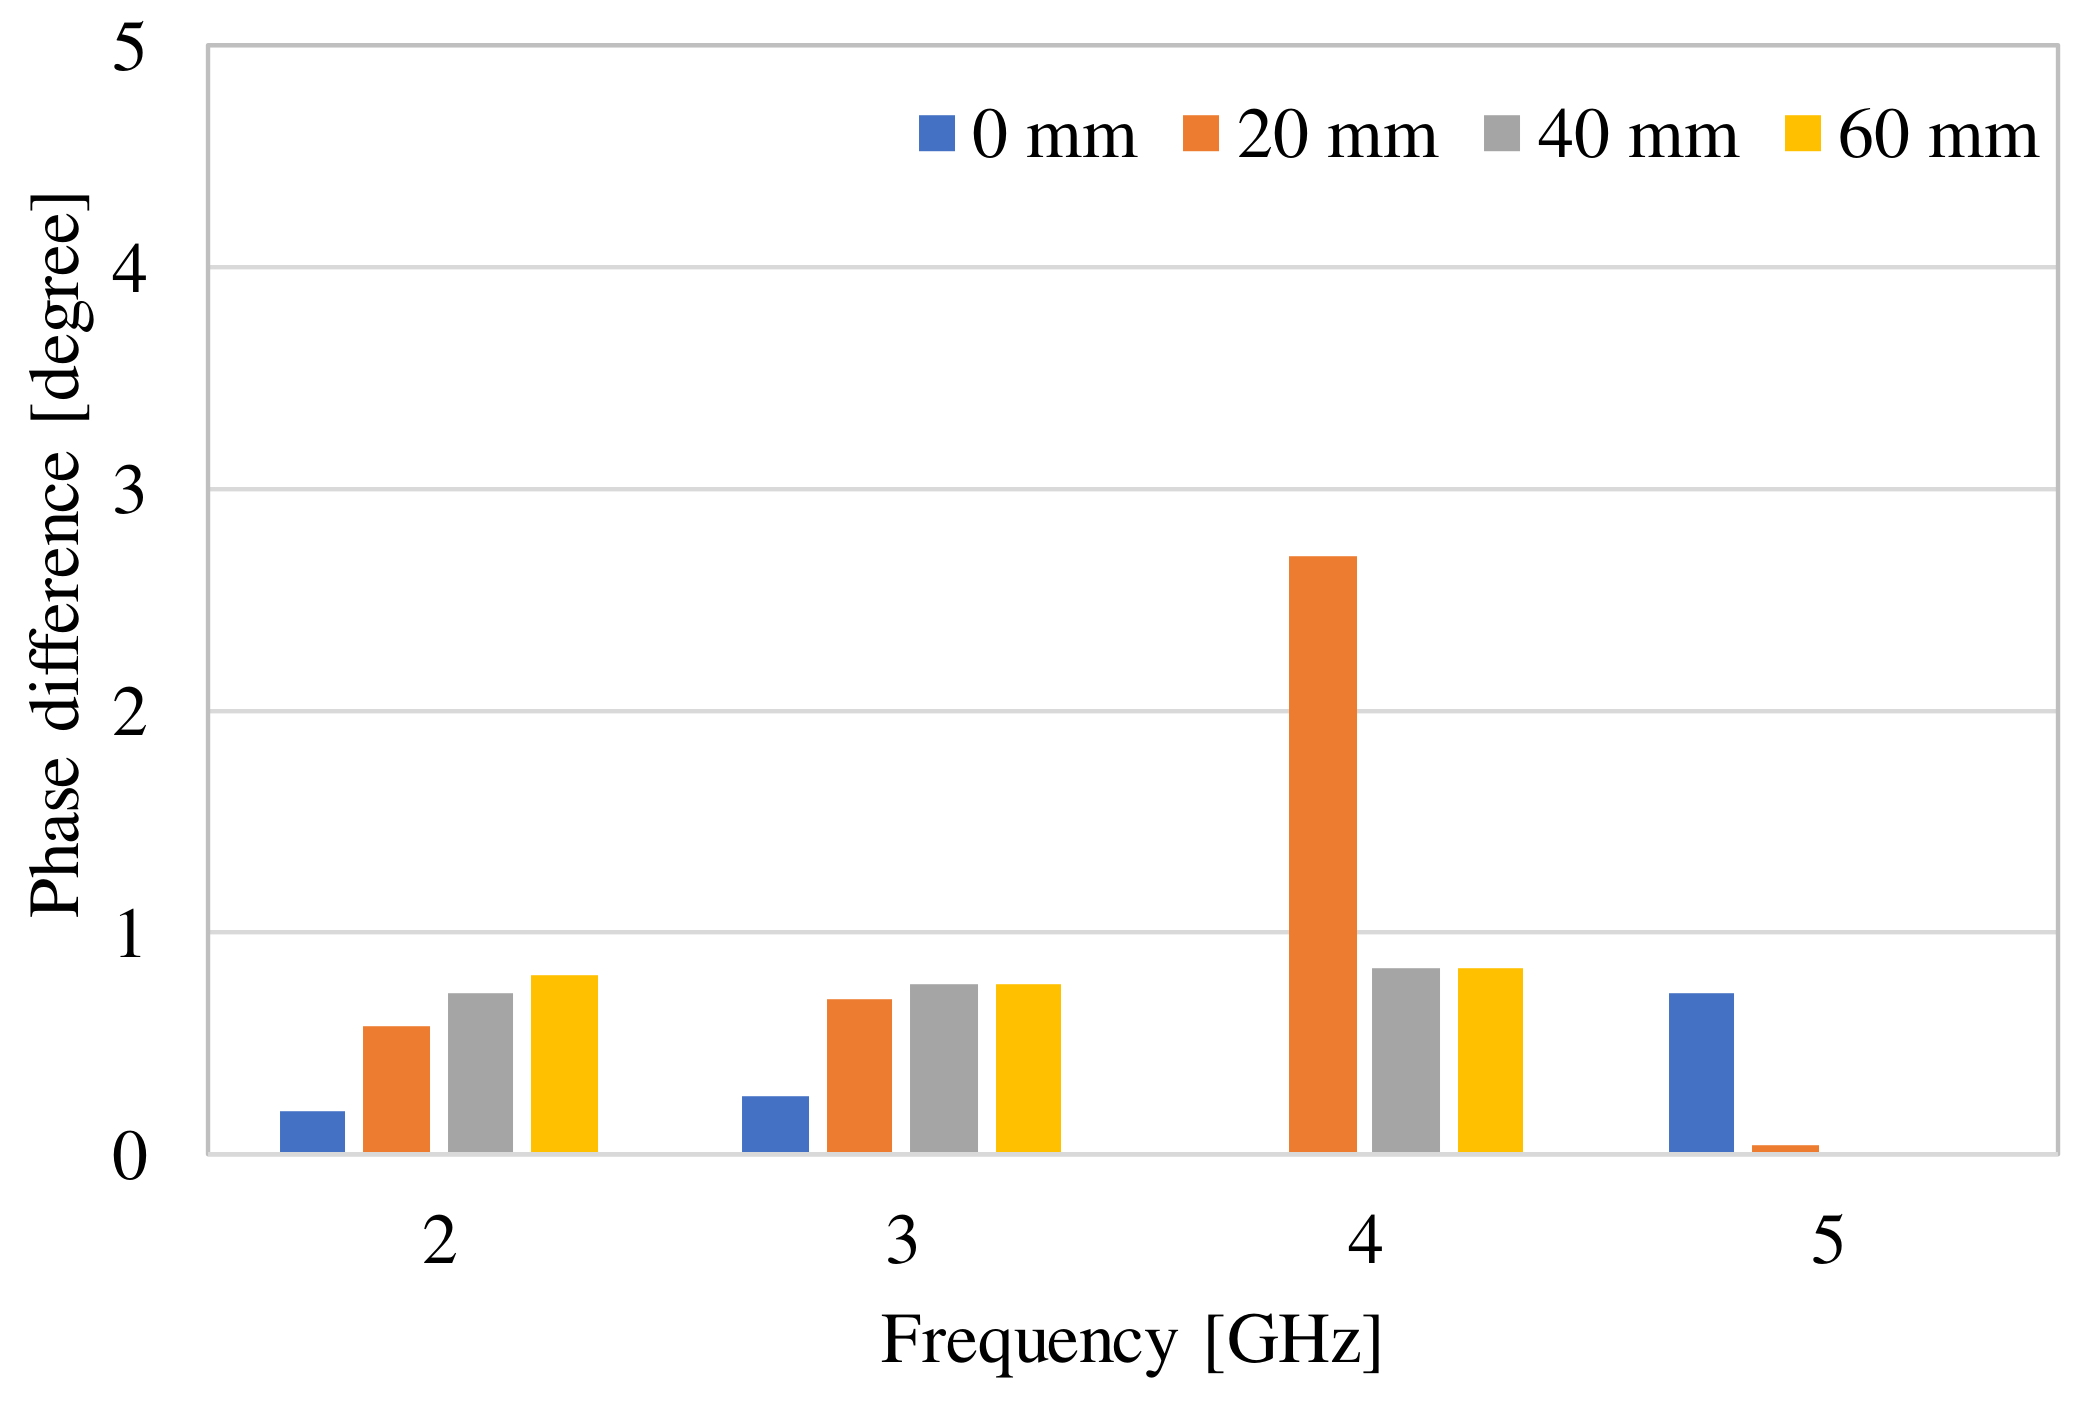
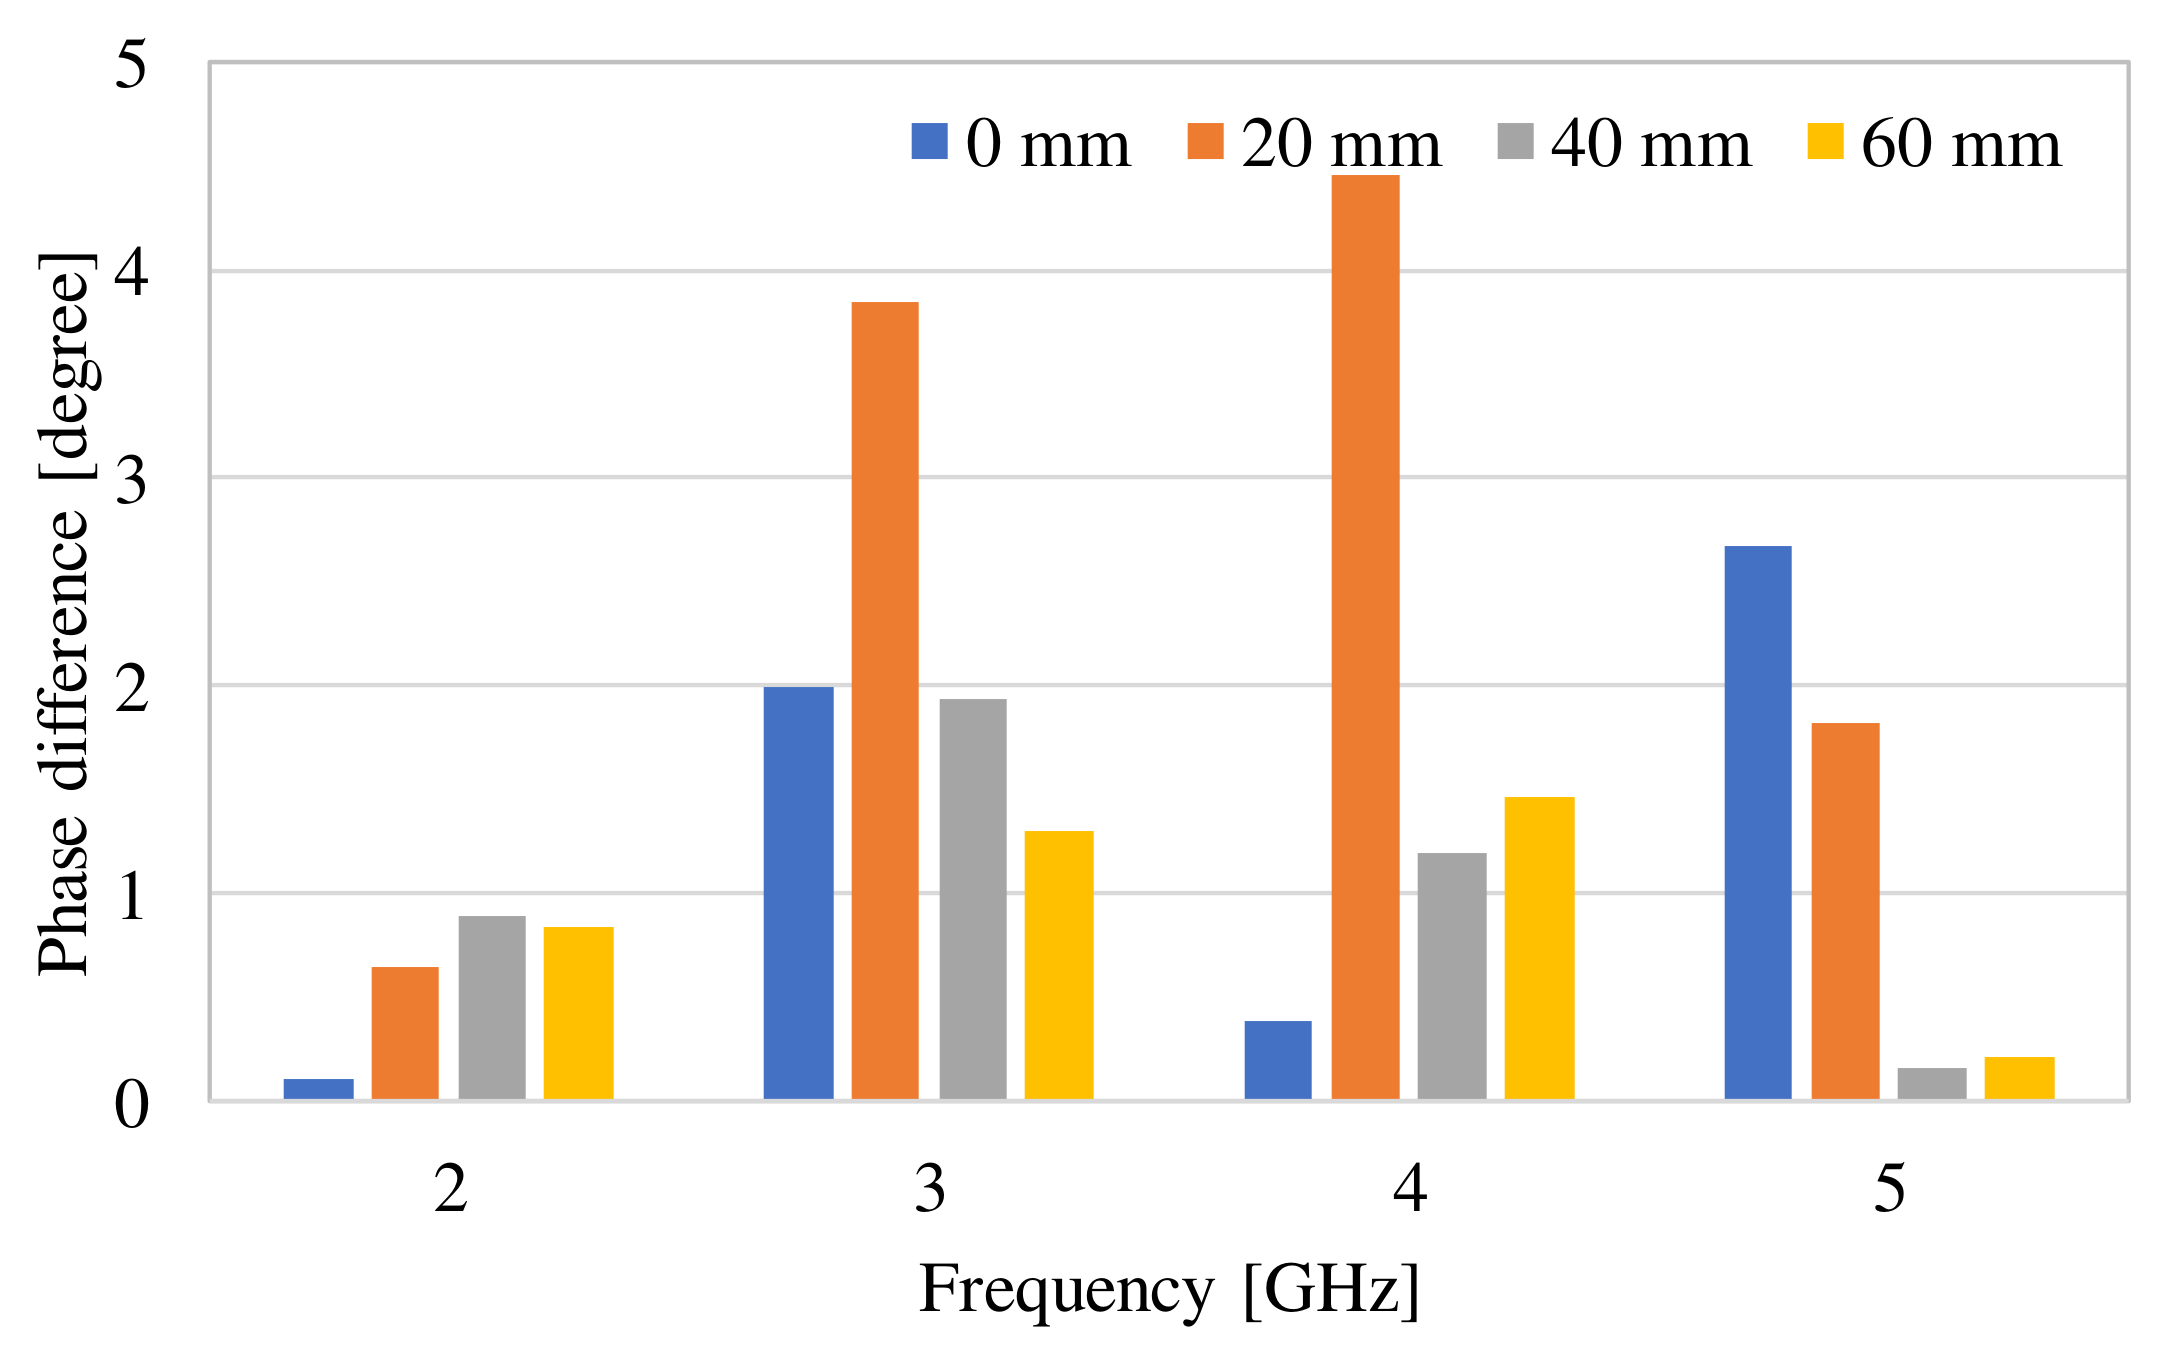
| Frequency | ||||
|---|---|---|---|---|
| 3 GHz | 4 GHz | |||
| Phase difference (degree) | Simulation | 0 mm | 0.27 | 0.01 |
| 20 mm | 0.70 | 2.70 | ||
| 40 mm | 0.76 | 0.84 | ||
| 60 mm | 0.76 | 0.84 | ||
| Measurement | 1.28 | 0.88 | ||
|
Difference between measurement and simulation (60 mm) (degree) | 0.52 | 0.04 | ||
Disclaimer/Publisher’s Note: The statements, opinions and data contained in all publications are solely those of the individual author(s) and contributor(s) and not of MDPI and/or the editor(s). MDPI and/or the editor(s) disclaim responsibility for any injury to people or property resulting from any ideas, methods, instructions or products referred to in the content. |
© 2024 by the authors. Licensee MDPI, Basel, Switzerland. This article is an open access article distributed under the terms and conditions of the Creative Commons Attribution (CC BY) license (https://creativecommons.org/licenses/by/4.0/).
Share and Cite
Hoshino, J.; Hyry, J.; Kobayashi, T.; Anzai, D. Development of a Wearable System for the Detection of Ingestible Medication Based on Electromagnetic Waves. Electronics 2024, 13, 543. https://doi.org/10.3390/electronics13030543
Hoshino J, Hyry J, Kobayashi T, Anzai D. Development of a Wearable System for the Detection of Ingestible Medication Based on Electromagnetic Waves. Electronics. 2024; 13(3):543. https://doi.org/10.3390/electronics13030543
Chicago/Turabian StyleHoshino, Junya, Jaakko Hyry, Takumi Kobayashi, and Daisuke Anzai. 2024. "Development of a Wearable System for the Detection of Ingestible Medication Based on Electromagnetic Waves" Electronics 13, no. 3: 543. https://doi.org/10.3390/electronics13030543