Abstract
Accurate carbon emission accounting for electric vehicles (EVs) is particularly important, especially for those participating in the carbon market. However, the participation of numerous EVs in vehicle-to-grid (V2G) scheduling complicates the precise accounting of individual EV emissions. This paper presents a novel approach to carbon accounting and benefits distribution for EVs. It includes a low-carbon dispatch model for a distribution system (DS), aimed at reducing total emissions through strategic EV charging scheduling. Further, an improved carbon emission flow accounting model is proposed to calculate the carbon reduction of EVs before and after low-carbon dispatch. It enables real-time carbon flow tracking during EV charging and discharging, then accurately quantifies the carbon reduction amount. Additionally, it employs the Shapley value method to ensure equitable distribution of carbon revenue, balancing low-carbon operation costs and carbon reduction contributions. A case study based on a 31-node campus distribution network demonstrated that effective scheduling of 1296 EVs can significantly reduce system carbon emissions. This method can accurately account for the carbon emissions of EVs under different charging states, and provides a balanced analysis of EV carbon reduction contributions and costs, advocating for fair revenue allocation.
1. Introduction
1.1. Motivation
Global climate change is leading to increasingly severe weather anomalies and disasters. The grave consequences of global warming are already apparent, and failing to address climate issues could lead to a greater crisis worldwide [1]. Consequently, climate change has become a focal issue for government organizations and conferences. At the 2021 United Nations Climate Change Conference (COP26), global participants and leaders discussed and determined methods to reduce greenhouse gas emissions [2]. Among these, accelerating the development of new energy in power generation and the low-carbon transformation of the transportation sector were key topics. As one of the world’s major carbon emitters, China actively promotes the adoption of electric vehicles (EVs), aiming to reduce its reliance on fossil fuels and striving to achieve a net-zero emission target [3]. Meanwhile, China is developing smart grids [4] and vehicle-to-grid (V2G) technology [5], enabling EVs to act as mobile energy storage systems, providing energy to the grid when necessary [6], thereby reducing carbon emissions in grid operations [7]. Additionally, emphasis is being placed on promoting green and sustainable corporate transformation through the establishment of carbon emission trading systems. China launched its first carbon emission trading market pilot in Shenzhen in 2013 [8] and initiated the national carbon market in 2022.
Currently, China’s carbon emission trading market covers eight major emission-intensive industries, including power, petrochemicals, steel, non-ferrous metals, and aviation [9]. The emission reduction effects of these industries have a direct impact on the national total carbon emissions, with the power and transportation sectors occupying the main carbon quotas [10]. With the launch of the national greenhouse gas voluntary emission reduction trading market in Beijing in 2024, all sectors are encouraged to participate in greenhouse gas reduction activities [11], providing opportunities for EV owners to participate in the carbon market [12]. The widespread use of EVs not only reduces direct carbon emissions from fuel but also guides owners to improve charging habits through the carbon market, reducing indirect carbon emissions from electricity use and converting carbon reduction into economic gains [13].
Despite the potential of EVs to reduce carbon emissions [14], the challenge of individual EVs participating in the carbon market remains significant. First, accurate quantification of EV emission reduction is necessary. Current certified emission reduction (CER) methodologies mainly focus on traditional internal combustion engine EVs as a benchmark, calculating EV carbon reduction based on load, travel distance, and fuel consumption [15]. There is a lack of universal methods to account for emission reductions during bidirectional charging and discharging interaction between EVs and the grid [16], making it difficult for owners to verify their carbon reduction. Moreover, for EVs to participate in the carbon market, they still need to cooperate with DS operators (DSOs). DSOs centrally account for the carbon emissions of EVs within the distribution network and distribute the total revenue to each owner, necessitating a fair and equitable revenue distribution method.
This paper aims to explore how EVs and the grid can reduce China’s carbon emissions, how to account for carbon reduction during the EV grid integration, and how to reasonably distribute the revenue obtained from EV participation in the carbon market based on the contributions to grid emission reduction.
1.2. Literature Review
With the development of the carbon emission market (CEM) and the continuous improvement of the carbon trading mechanism, especially with the relaunch of the certified emission reduction (CER) market, the variety of transactions in the carbon trading market has become more diverse. This encourages non-controlled emission enterprises and entities to actively participate in the voluntary emission reduction market, accelerating the achievement of corporate carbon neutrality goals. As a key component of low-carbon mobility, interest in the participation of EVs in the carbon market is growing. Daramola et al. [17] illustrated how electric vehicles (EVs) can be considered zero-carbon sources, utilizing vehicle-to-grid (V2G) strategies for reducing power peaks. Concurrently, they quantified both the carbon emissions from cogeneration and the contribution of EVs as energy storage components in reducing carbon emissions. Feng et al. [18] proposed a scheduling scheme where electric vehicles (EVs) are utilized as virtual energy routers (VERs) in radial microgrids, allowing EVs to alter the direction of energy flow, thereby enhancing grid flexibility. By employing a flexibility model for EV-based VERs and forecasted reference demand, the supply and demand in the microgrid are optimized, aiming to minimize generation costs for a day and maximize consumer utility. V2G technology enables carbon reduction for electric vehicles. In real-time operation, execution efficiency and computational speed become critical issues. Shang et al. [19] developed a cyber–physical collaborative model that implements hierarchical scheduling for V2G in a distributed manner. It decomposes the optimization problem into several sub-problems and employs parallel computing to accelerate the solution process.
Yao et al. [20] quantified the impact of EV participation in V2G on the total cost and carbon emissions of the power system in different regions, analyzing the potential for increased utilization of renewable energy. Wang et al. [21] proposed an optimal bidding framework to enable the regional energy internet for V2G to participate in the day-ahead market considering carbon trading. Lei et al. [22] proposes a day-ahead optimal power bidding model for DSOs, formulating optimal charging and discharging strategies for electric vehicles to reduce charging costs and utilize V2G to gain additional marginal revenue. Yang et al. [23] presented an optimized charging and discharging model for electric buses participating in the CEM and a peak-shaving auxiliary service market, aiming to minimize the daily total energy cost and load fluctuation of the grid for bus companies.
Previous research showed that by integrating and optimally scheduling EVs with the DS, it is possible to help reduce the grid’s carbon emissions. Additionally, participation in the CEM can yield carbon reduction benefits. Entities participating in the CEM market need to conduct precise carbon accounting. Currently, the focus in the electricity sector is primarily on the direct emissions from power plants. These analytical methods include statistical methods [24] and life cycle assessment (LCA) methods [25]. Electricity, as a secondary energy source, primarily generates carbon emissions during the fossil fuel combustion process in the power generation sector. Nevertheless, since power generation activities are driven by consumer demand, this implies that electricity consumers should be regarded as indirect sources of carbon emissions. Li et al. [26] introduced a method for carbon emission tracking based on electrical current tracking, transforming power flows into carbon emission flow (CEF), and rationally allocating the carbon emissions corresponding to system network losses. Kang et al. [27] further developed the CEF model, defined relevant concepts, and revealed the characteristics and distribution patterns of CEF. The CEF calculation model can be used to calculate the carbon footprint of power transmission and consumption, more accurately identifying the key factors of carbon emissions in the power grid. Cheng et al. [28] utilized CEF theory to trace the carbon responsibility of consumers and conducted research on the low-carbon operation of small and medium enterprises through a double-layer optimization model promoting the synergistic optimization of transmission and distribution networks. The proliferation of distributed photovoltaics (PV) has increased the complexity of corporate carbon emission accounting. In scenarios with a large number of PVs integrated into the grid, an improved CEF model can be used to account for the carbon emissions of enterprises in environments with large-scale PV grid integration [29]. Li et al. [30] proposed a method for low-carbon optimization learning and scheduling of the power system, combining carbon capture technology and CEF theory. This study’s model encompasses a comprehensive energy system including photovoltaics, wind energy, and storage, and it conducts an in-depth analysis of its carbon flow. By applying deep reinforcement learning techniques to solve the optimization model, low-carbon optimization of the system is achieved. Although previous studies analyzed methods for accounting for carbon emissions in the power system, the carbon emissions of EVs under different charging modes still require accounting and analysis.
EVs contribute to emission reduction by integrating into the electrical system and can generate income through participation in the CEM. A rational allocation method is required to distribute the carbon revenue to each EV owner. Many studies have utilized game theory to achieve benefit sharing in energy systems. Li et al. [31] introduced a vehicle-to-vehicle market mechanism that allows electric vehicle owners to establish distributed electricity markets within distribution networks, to engage in electricity trading. This mechanism aims to maximize the revenue of each electric vehicle owner while also developing a non-cooperative game model for the allocation of electric vehicle energy. Each electric vehicle owner maximizes individual revenue by selecting feasible strategies. Cong et al. [32] transformed the problem of multi-regional joint operation into an alliance game model, dividing the comprehensive energy systems of multiple regions into different alliances based on benefit sharing, promoting their cooperative operation. For the regional comprehensive energy system operation optimization model, it is necessary to consider the mutual benefits of electricity allocation. Here, multiple comprehensive energy systems can distribute alliance benefits through Nash negotiation methods to maintain the stability of the cooperative relationship [33]. Fan et al. [34] proposed a cooperative scheduling framework for multiple adjacent energy hubs and used bargaining game theory to solve the optimization problem for a fair Pareto solution. He et al. [35] comprehensively summarized the game scenarios and game models of comprehensive energy systems, covering the source side, network side, load side, and common planning and scheduling issues. Wang et al. [36] introduced the Shapley value method, applying game theory to multi-agent capacity optimization models. The traditional Shapley method can be modified according to the actual situation of the participants [37], and Yang et al. [38] introduced cost and contribution factors in its modified Shapley method. However, when addressing the strategic interactions between the system as a whole and other entities, existing studies often overlook the different participants within the system. This is particularly crucial in a distribution system (DS) with a high penetration of EVs, where it is necessary to allocate carbon reduction benefits not only for renewable energy sources and EVs collectively, but also specifically for each EV involved in the dispatch. Therefore, it is essential to consider the coordination of interests among different participants within the system and to pay attention to the energy exchange game mechanisms among users. This approach ensures a fair distribution of overall carbon reduction benefits to each participant, effectively motivating EV owners to participate in low-carbon optimization dispatch, thereby promoting the sustainability and low-carbon development of the DS.
In response to these issues, this study proposes a carbon accounting model and revenue distribution method for EVs. The model employs carbon emission flow and the Shapley value method for equitable distribution of carbon reduction contributions. The specific contributions include the following:
- Development of a low-carbon optimization model for a DS integrating EVs and photovoltaic generation. Carbon reduction for the entire grid is achieved through EV V2G scheduling, and carbon emission tracing at each node using carbon flow theory validates the effectiveness of the scheduling model, providing a theoretical basis for the allocation of carbon reduction contributions by EVs.
- Design of a carbon reduction contribution distribution mechanism based on Shapley values, offering a fair and reasonable solution for the distribution of carbon reduction benefits between EV owners and distribution system operators (DSO), based on the carbon emission tracing results of the distribution grid. Compared to the traditional Shapley value method, the improved Shapley value method is more aligned with the actual circumstances of this study’s case scenario, allowing for a more diverse and comprehensive allocation of carbon revenue.
- Validation of the proposed methods through numerical simulations of the real 31-node distribution network of Southern University of Science and Technology (SUSTech).
The remainder of this paper is organized as follows: Section 2 introduces the framework of the method proposed in this paper, describes the carbon accounting method for EV based on CEF Theory and the carbon revenue distribution model based on Shapley value; Section 3 validates the proposed theoretical model using real-case data from SUSTech campus; finally, Section 4 presents conclusions and insightful remarks.
2. Carbon Emission Accounting and Revenue Distribution Model for EV
2.1. Framework of Carbon Accounting Model
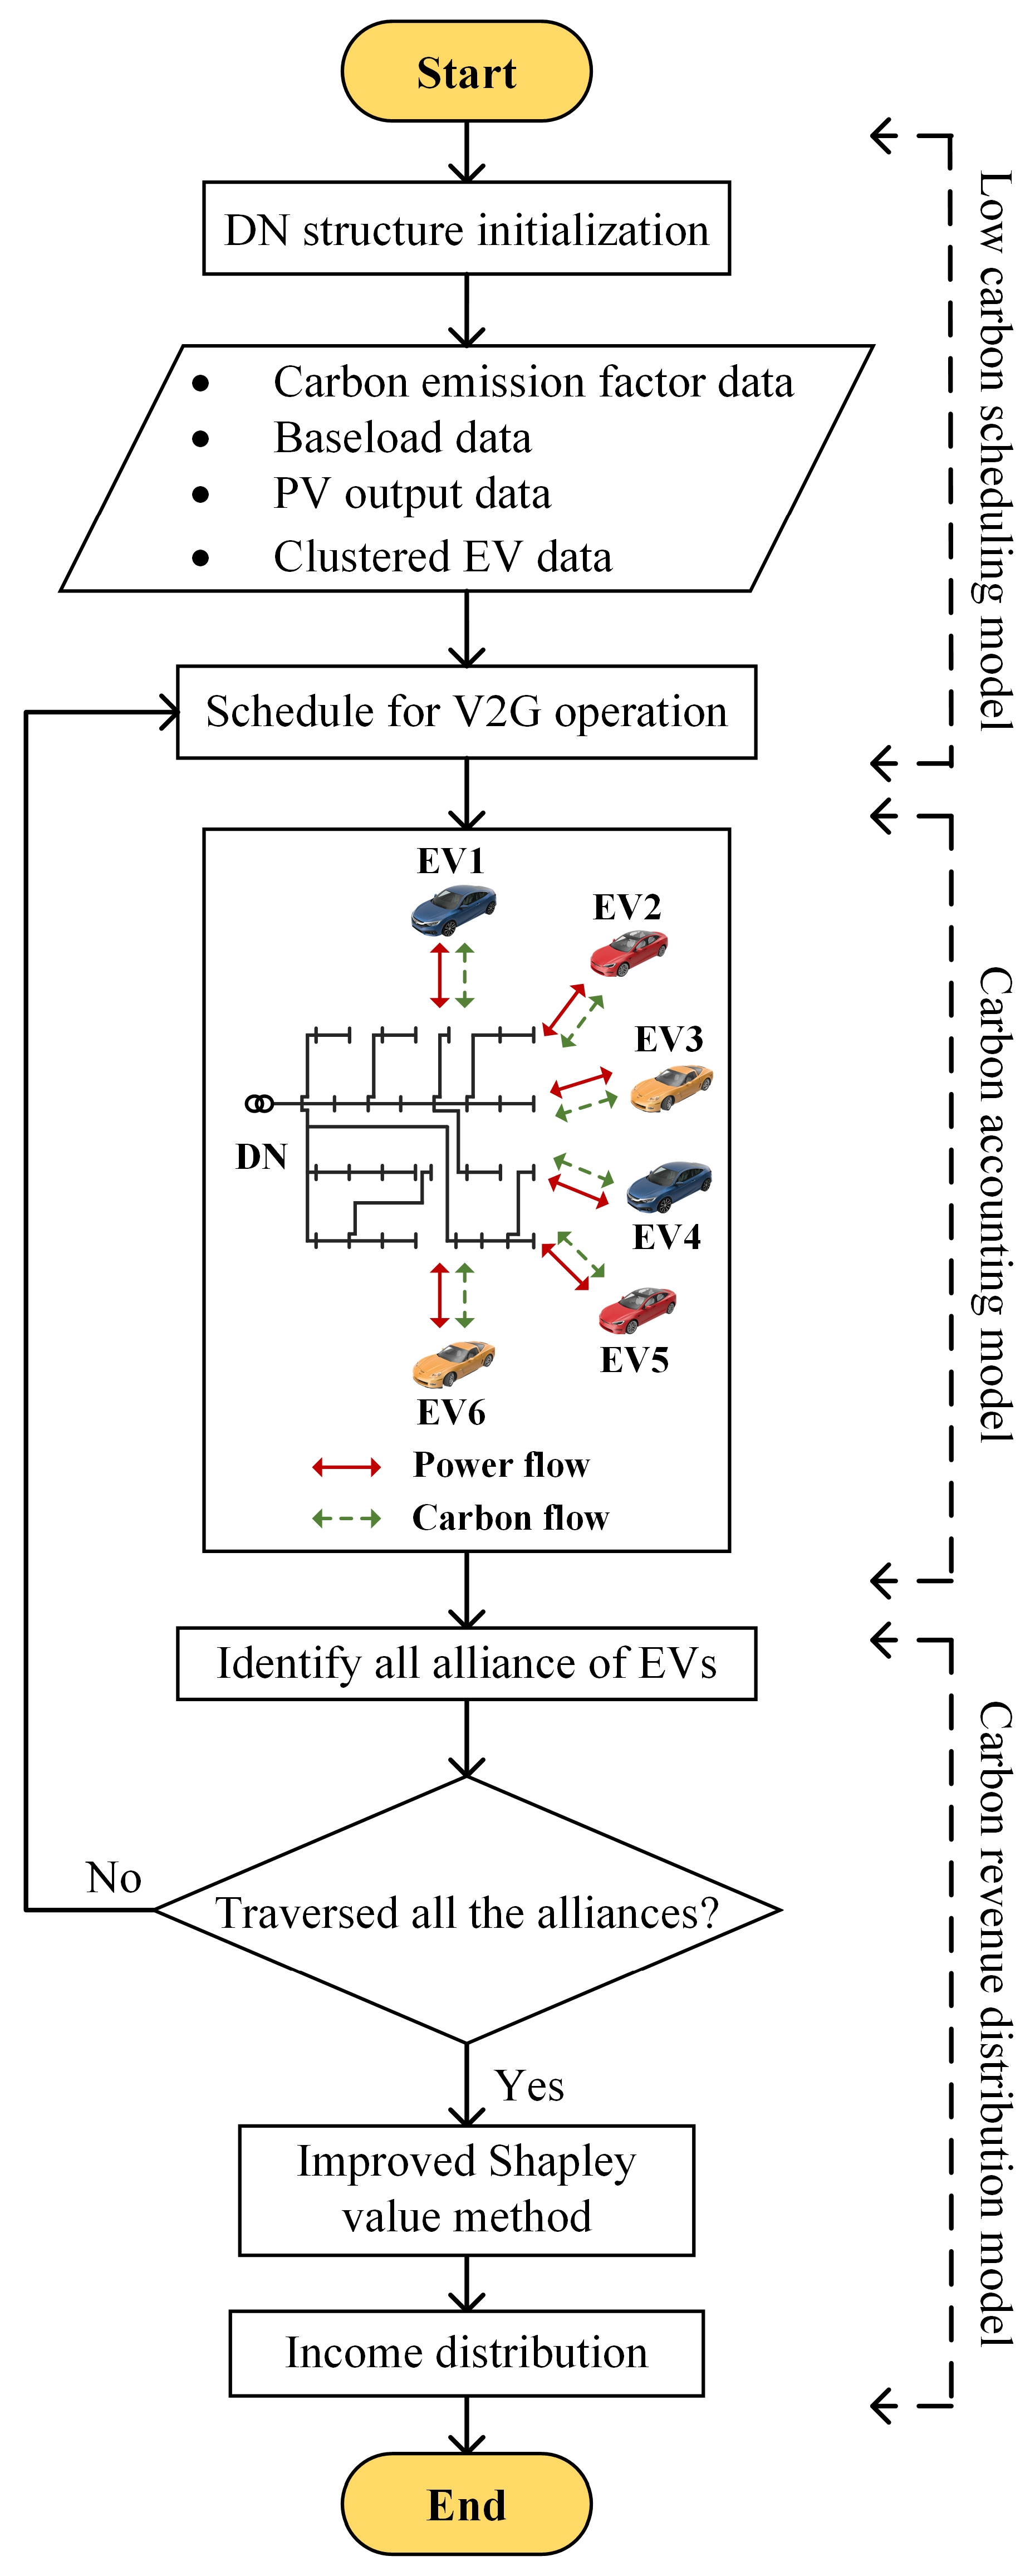
The primary objective of this study was to calculate the carbon emission reduction of EVs in the V2G mode based on power flow, and to allocate the corresponding carbon benefits by the contribution of EVs to carbon reduction in the DS. The model architecture of this paper, as illustrated in Figure 1, comprises three sub-models: the low-carbon scheduling model for DS, the V2G carbon accounting model, and the carbon revenue distribution model. Consequently, the carbon accounting and revenue distribution process is divided into three stages. First, establish the low-carbon scheduling model for the DS to minimize total system carbon emissions, and to acquire power flow data before and after optimization. Second, based on the power flow data, using the carbon accounting model calculate the carbon intensity (CI) at each node of the DS before and after optimization, and account for the carbon emission reduction of the DS and EVs. Finally, allocate carbon reduction revenue to EVs based on their contribution to carbon reduction, through the carbon revenue distribution model. Detailed descriptions of these three stages are presented in the following subsections.

Figure 1.
Framework of the proposed carbon accounting and revenue distribution method.
2.2. Low Carbon Scheduling Model for DS
The primary objective of the scheduling model in this paper was to explore the carbon emission reduction potential of V2G technology within the DS. Considering the timelines of CI on the grid side, the model aims to minimize the overall carbon emissions of the DS. Through the V2G technology for EVs, charging and discharging strategies are formulated based on the charging needs, charging power, and fluctuating CI. The model evaluates the carbon emission reduction achieved through the application of V2G technology in the DS, by comparing it with the carbon emissions from the EVs without scheduling. The following assumptions are made for the model:
- To analyze the impact of EVs on the carbon emission reduction of the DS separately, it is necessary to ensure that other base loads within the DS do not affect the experimental results. Therefore, the variability of basic loads is not considered, and all basic loads are assumed to remain constant throughout the analysis process.
- To facilitate reasonable scheduling of EVs, all EV owners within the campus have entered into charging and discharging agreements, allowing the DSO to access EV information. This centralized management of EVs enables individualized charging and discharging scheduling for each EV, thereby achieving the low-carbon optimization goal while meeting the charging needs of EV owners.
The scheduling model aims to minimize the total carbon emissions over T periods, with the objective function in Equation (1):
where, CE represents the total carbon emissions of the distribution network system over continuous T periods; denotes the active power at the bus node during the period t; CEFt represents the carbon emission factor of the main grid flowing into the distribution network bus node during period t.
The constraints of power flow are described in Equations (2) and (3):
where, N and L respectively denote the sets of nodes and lines in the DS; δj and ηj represent the sets of branch ends and head nodes; Pjk and Qjk denote the active and reactive power from node j to node k, while Pj and Qj, respectively, denote the active and reactive power at node j; Iij represents the current from node i to node j; rij and xij represent the resistance and reactance in line ij; Ui and Uj denote the voltage magnitudes at nodes i and j, respectively.
Equation (5) limits the apparent power for each branch. Equation (6) ensures that the voltage at node j does not exceed the maximum and minimum values. Similarly, Equation (7) ensures that the current in branch ij does not exceed its limit:
where, Umin and Umax represent the minimum and maximum voltage magnitudes at nodes i and j respectively, and Imax represents the maximum allowable current in line ij.
Equations (8) and (9) represent the charging and discharging constraints of EVs:
wherein, and denote the charging and discharging power of EVs at node j during time period t, respectively; and represent the charging and discharging power of the m-th EV at node j within time period t; and represent the minimum and maximum SoC of the m-th EV, respectively.
2.3. V2G Carbon Accounting Model
In the power industry, carbon dioxide emissions primarily originate from the carbon source side, while the demand and driving forces behind carbon emissions are on the load side. As the carbon emissions in power systems are intertwined with power flow, it is necessary to combine carbon emission flow with power flow, thereby facilitating the traceability of carbon emissions in the power system. The carbon accounting model can calculate carbon emissions at various stages of energy production, transportation, and consumption. Presently, the computational methods for carbon emission flow theory have gradually matured [39], allowing for the calculation of carbon emission flow at each node for different periods based on power flow. The following is a brief description of the concepts and calculations involved in carbon emission flow theory.
The carbon emission flow rate (CEFR) indicates the carbon emissions corresponding to the power flow through a network node or branch per unit time. It is denoted as R and is measured in t/h, as shown in Equation (13):
where, F represents the inflow of carbon emissions.
CI refers to the amount of carbon emissions per unit of electricity. It is denoted as ρ and is measured in t/(MW·h), as shown in Equation (14):
wherein, P represents the active power flow corresponding to the branch. The BCI should be equal to the carbon potential of the first node into which the branch flows.
Node carbon intensity (NCI) represents the carbon emissions equivalent to the generation side caused by the consumption of a unit of electricity at a node. The NCI for node n is expressed as Equation (15):
where, N+ represents the set of all branches with active power flow entering node n; i denotes the branch number.
Due to the fluctuations in the power grid’s CEF with changes in the load conditions of the electric power system, V2G can produce additional emission reductions compared to conventional EV charging by utilizing EVs in conjunction with low carbon scheduling.
To measure accurately and reasonably the carbon emissions of EVs in V2G scheduling, we analyzed both the charging () and discharging () states of EVs separately.
Carbon emission flow during the EV charging process was represented as Equations (16)–(18):
where, Q0 and C0, respectively, represent the remaining SoC and carbon emission of the EV; and , respectively, represent the SoC and carbon emission of the EV after the charging period t; denotes the power of EV during the charging period t; represents the NCI of the grid during time period t; indicates the NCI of the EV during period t.
The carbon flow during the EV discharging process is shown in Equations (19) and (20):
wherein, and , respectively, represent the SoC and carbon flow of the EV after the discharging period t; denotes the power of the EV during the discharging period t. The NCI of the EV during the discharging period t remains unchanged. η represents the discharging efficiency of EVs.
Over N periods, the carbon emissions of the EV through V2G scheduling is as shown in Equation (21):
By integrating the V2G carbon accounting model, it can be extended to calculate the dynamic NCI at each node of the DS. Figure 2 displays a schematic diagram of a campus DS with power flow and carbon emission flow. The DS includes office buildings and research buildings as base loads, distributed photovoltaic panels representing renewable energy sources, and EV charging stations with V2G technology.
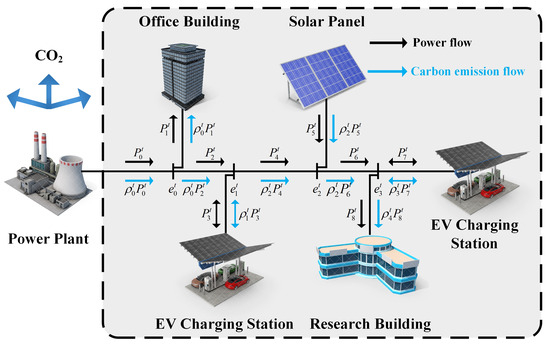
Figure 2.
Carbon emission flow model.
The NCI of node i is determined by the sum of the carbon emission from the power plant and upstream nodes. For a DS with N nodes, among which the K nodes are the injection points of the generator, and with the network topology being known, assuming that the losses in the distribution network are negligible, the NCI at any node is defined as Equation (22):
where, PB is an N dimensional branch power flow distribution matrix, describing the distribution of active power flow in the branches of the electrical system; PG is a K × N dimensional generator injection power distribution matrix, describing the connection relationship of the generator and the active power injected into the system; ρB is an N dimensional vector of branch carbon emission intensity; ρG is a K dimensional vector of generator carbon emission intensity; γN is an N dimensional unit row vector.
According to the definition of the node active power flux matrix, the NCI is influenced only by the inflow, while the outflow from the node does not affect the NCI. Therefore, Equation (23) can be derived:
wherein, PN represents the N dimensional node active power flux matrix.
From the two aforementioned equations, we can derive Equation (24):
Expanding the above equations to encompass the entire system’s dimensions and upon rearranging, we obtain Equation (25) for calculating the CNI for all nodes in the system:
2.4. Carbon Revenue Distribution Model
After scheduling the charging process of EVs, the carbon emissions of the DS decreased. For EVs, their initial CI determines their carbon reduction performance in the V2G process. The CI upon leaving the grid will affect the carbon emissions of the next charging process. Therefore, a method is needed to reasonably quantify the carbon value corresponding to the CI of EVs, thereby forming a comprehensive method for distributing carbon reduction.
The fluctuation of CI is caused by the electricity charged. Charging with low-carbon electricity can reduce the CI of EVs, but the EVs need to pay for the environmental costs associated with this low-carbon electricity. Equation (26) defines the low-carbon cost that the EVs should bear:
wherein, Ecost represents the low-carbon cost corresponding to the change in CI before and after EV charging; and represent the CI of the EVs before and after charging, respectively; Q0 and QN, respectively, denote the SoC of the EVs when connecting to and disconnecting from the grid; S represents the price of carbon.
In actual operation, EVs participating in V2G scheduling within a DS can be viewed as a coalition. EVs in this coalition work together to generate carbon reduction benefits for the system. Therefore, a method that comprehensively considers both the carbon reduction contributions and low-carbon costs of EVs is needed to distribute reasonable benefits among the members of the coalition. This can be achieved through the application of Shapley value theory, a concept originating from cooperative game theory [40]. It offers a fair solution for distributing benefits by basing the distribution on each participant’s marginal contribution to the collective action, ensuring fairness in the allocation of benefits. In the context of our research, the Shapley value is used to quantify the marginal contribution of each EV to the system’s emission reduction, combining carbon reduction amounts and low-carbon costs, and accordingly distributing the emission reduction benefits.
The calculation of the Shapley value is based on all possible coalitions of participants, assessing the marginal change in total payoff when each participant joins an existing coalition. Suppose in a cooperative project, all participants are represented by the set N, and each subset has a definite total payoff . Then, for each participant a, the Shapley value is defined as Equation (27):
wherein, S is any subset of participants not including participant a; is the total payoff when the participants in subset S cooperate; is the total payoff when subset S cooperates with participant a; is the number of elements in subset S; n is the total number of participants; is the factorial of the number of elements in subset S; is the factorial of the number of remaining participants excluding subset S and participant a.
The refined Shapley value model integrates carbon reduction revenue with low-carbon costs. Equation (28) implies that the carbon reduction benefits through the coalition will be distributed among the EVs in the coalition:
where, refers to the marginal contribution of costs when participant EVa joins the coalition, which is the low-carbon cost that should be borne by the participant.
3. Case Study
3.1. DS Structure
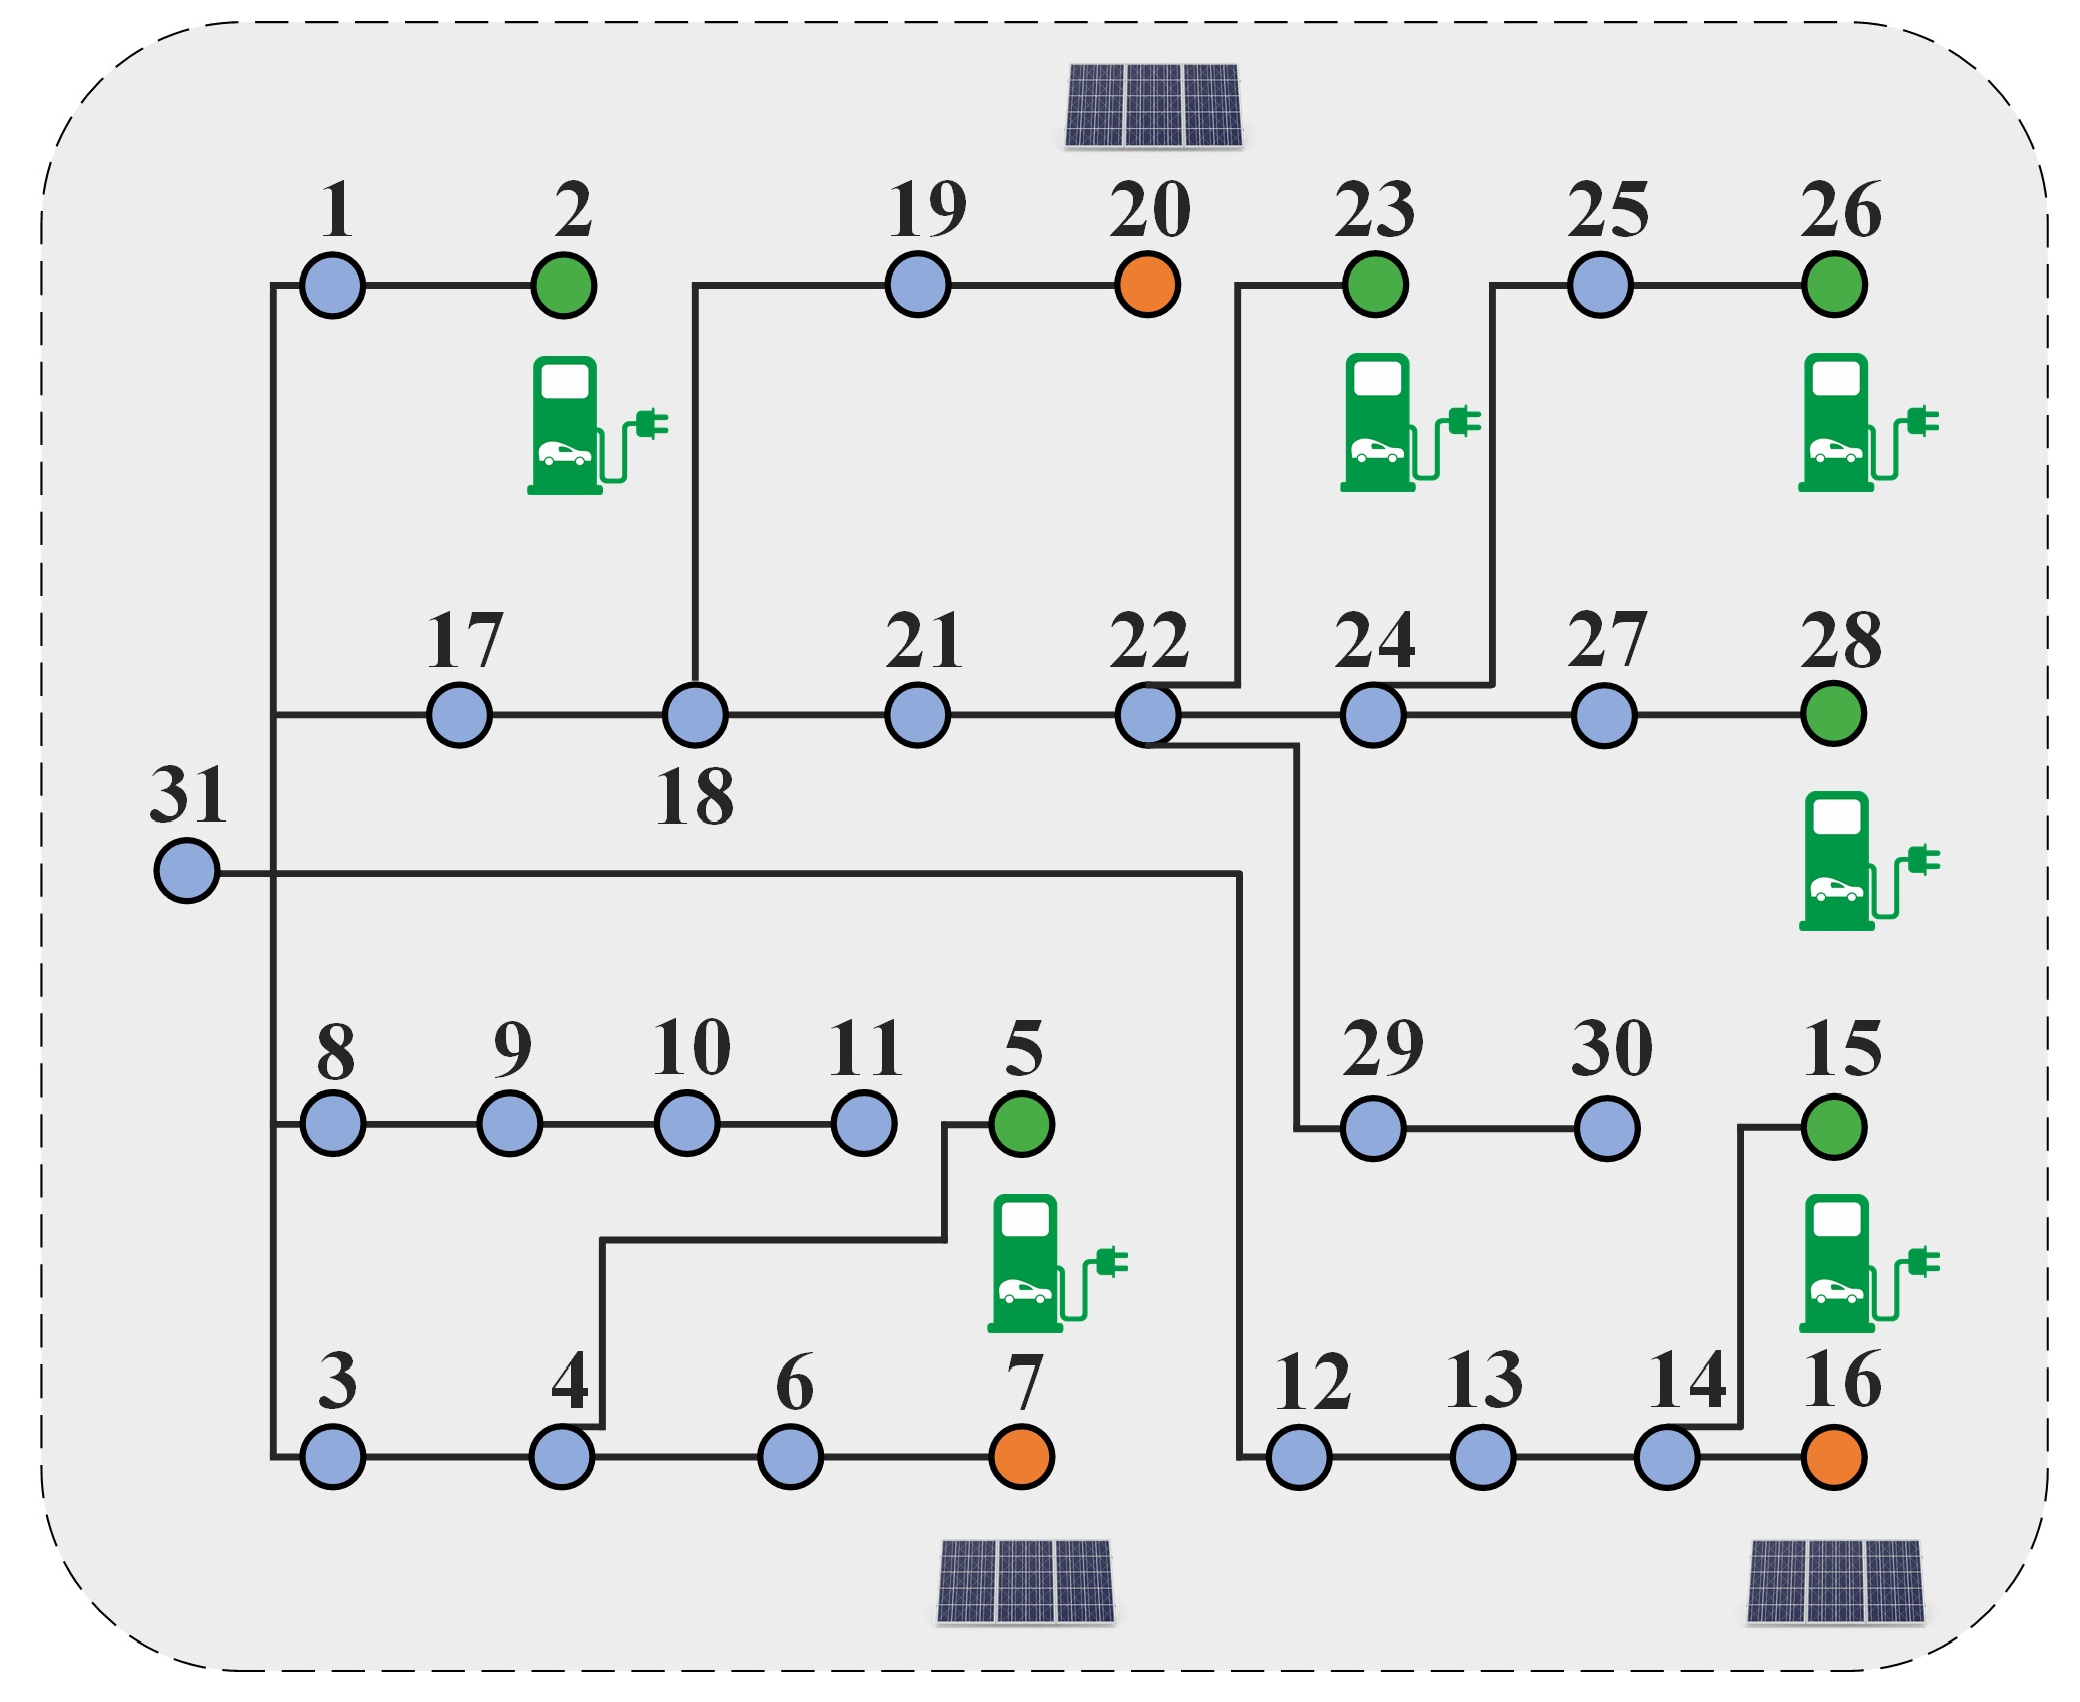
The DS discussed in this paper is based on the SUSTech campus. This DS has 31 nodes and 30 branches, where node 31 is a balance node connected to the Guangdong Provincial Power Grid through a 110 kV/10 kV transformer. Private EV charging stations are distributed at nodes 2, 5, 15, 23, 26, and 28. When the EVs connected to these charging stations are in the discharging state under the V2G mode, these nodes can be considered as power source nodes. At nodes 7, 16, and 20, there are three sets of PV panels installed, which can generate electricity using solar energy and supply it to the DS. The specific structure of the DS is shown in Figure 3.
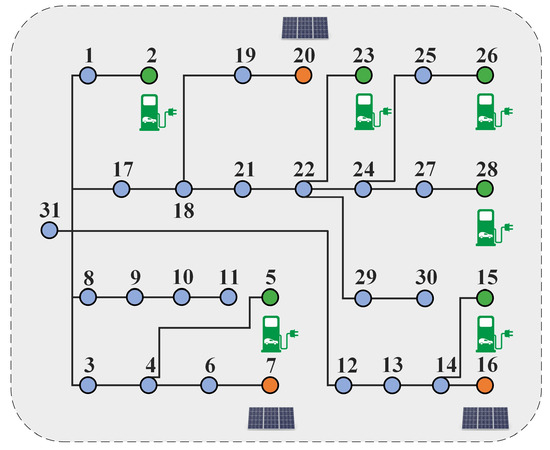
Figure 3.
DS Structure of SUSTech.
3.2. Data Preparation
3.2.1. EV Data
In this study, the data on EVs were collected through the SCP system within the Southern University of Science and Technology campus. The research focused on campus electric buses and private EVs, totaling 2000 EVs. The data gathered by SCP includes the initial state of charge, maximum battery capacity, maximum charging power, and times of connecting to and disconnecting from the grid. Based on real-world charging scenarios, when owners urgently need to use their EVs, they choose fast-charging stations, which significantly reduces charging time. However, if the owner opts for slow charging and the connection time to the grid exceeds 2 h, it can be assumed that the EV has the potential to participate in V2G scheduling. Therefore, to better facilitate interaction between EVs and the power grid, data from 704 EVs with grid connection times less than 2 h were excluded. Electric buses, compared to private EVs, have larger battery capacities. Based on battery capacity, electric buses were categorized as one data class. Using the K-means algorithm [41], private EVs were clustered based on battery capacity and grid connection time, classifying them into five groups. Hence, private EVs were grouped into six categories in total. Table 1 shows the specific data for these six types of EV.

Table 1.
EV clustered data.
3.2.2. PV Data
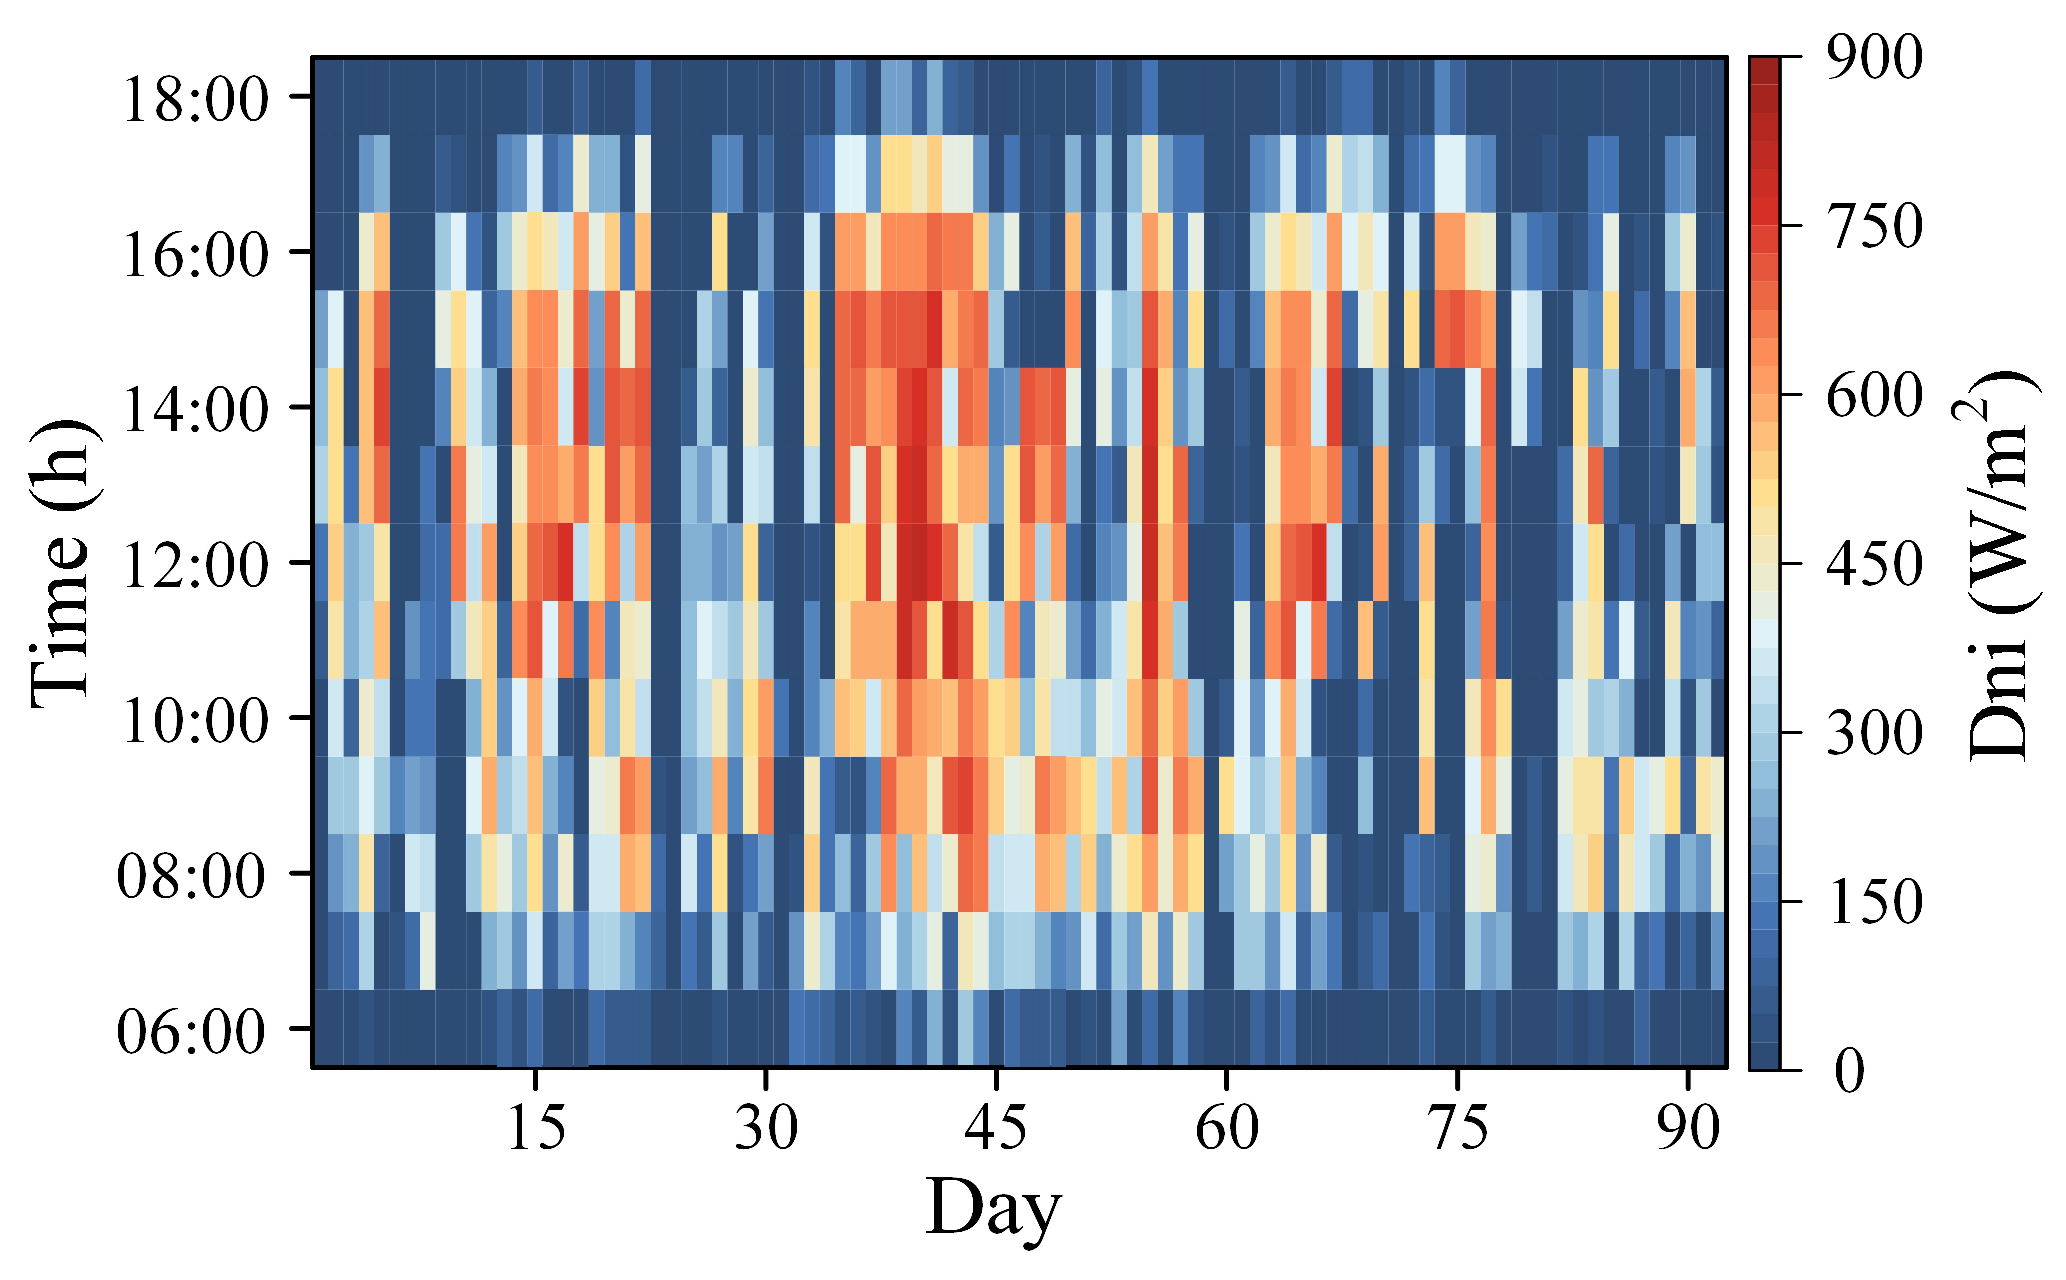
In this study, real solar irradiance records were obtained from the global climate database [42], selecting genuine solar irradiance data for the summer months (June to August) at the Southern University of Science and Technology. The data sampling interval was 60 min. Figure 4 shows the distribution of solar irradiance during the summer of 2023 on the Southern University of Science and Technology campus, with the peak irradiance occurring between 11:00 AM and 1:00 PM. The level of solar irradiance in July was higher than in June. Due to a higher frequency of rainy days in August, there were some days without any significant solar irradiance throughout the entire day, resulting in the average irradiance for August being lower than that in June and July.
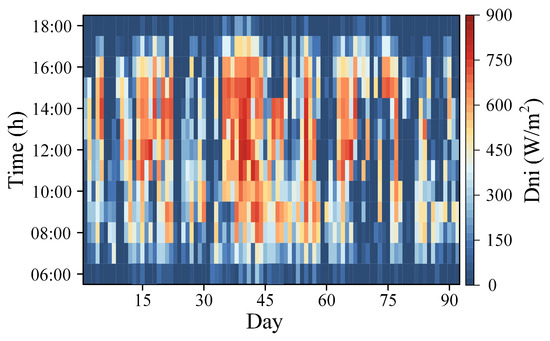
Figure 4.
Solar irradiance profile of the SUSTech campus for June to August in 2023.
For PV output, the focus of this study is on three sets of rooftop photovoltaic panels located at nodes 7, 16, and 20, respectively, each set consisting of panels that individually cover an area of 50 square meters. Equation (29) calculates the maximum PV output [43]:
where, represents the maximum photovoltaic output; Dmax is the maximum solar irradiance; Spv is the area of each rooftop photovoltaic panel in the campus, and ηpv is the conversion efficiency of the photovoltaic panels. In this study, ηpv is set to 20% [44].
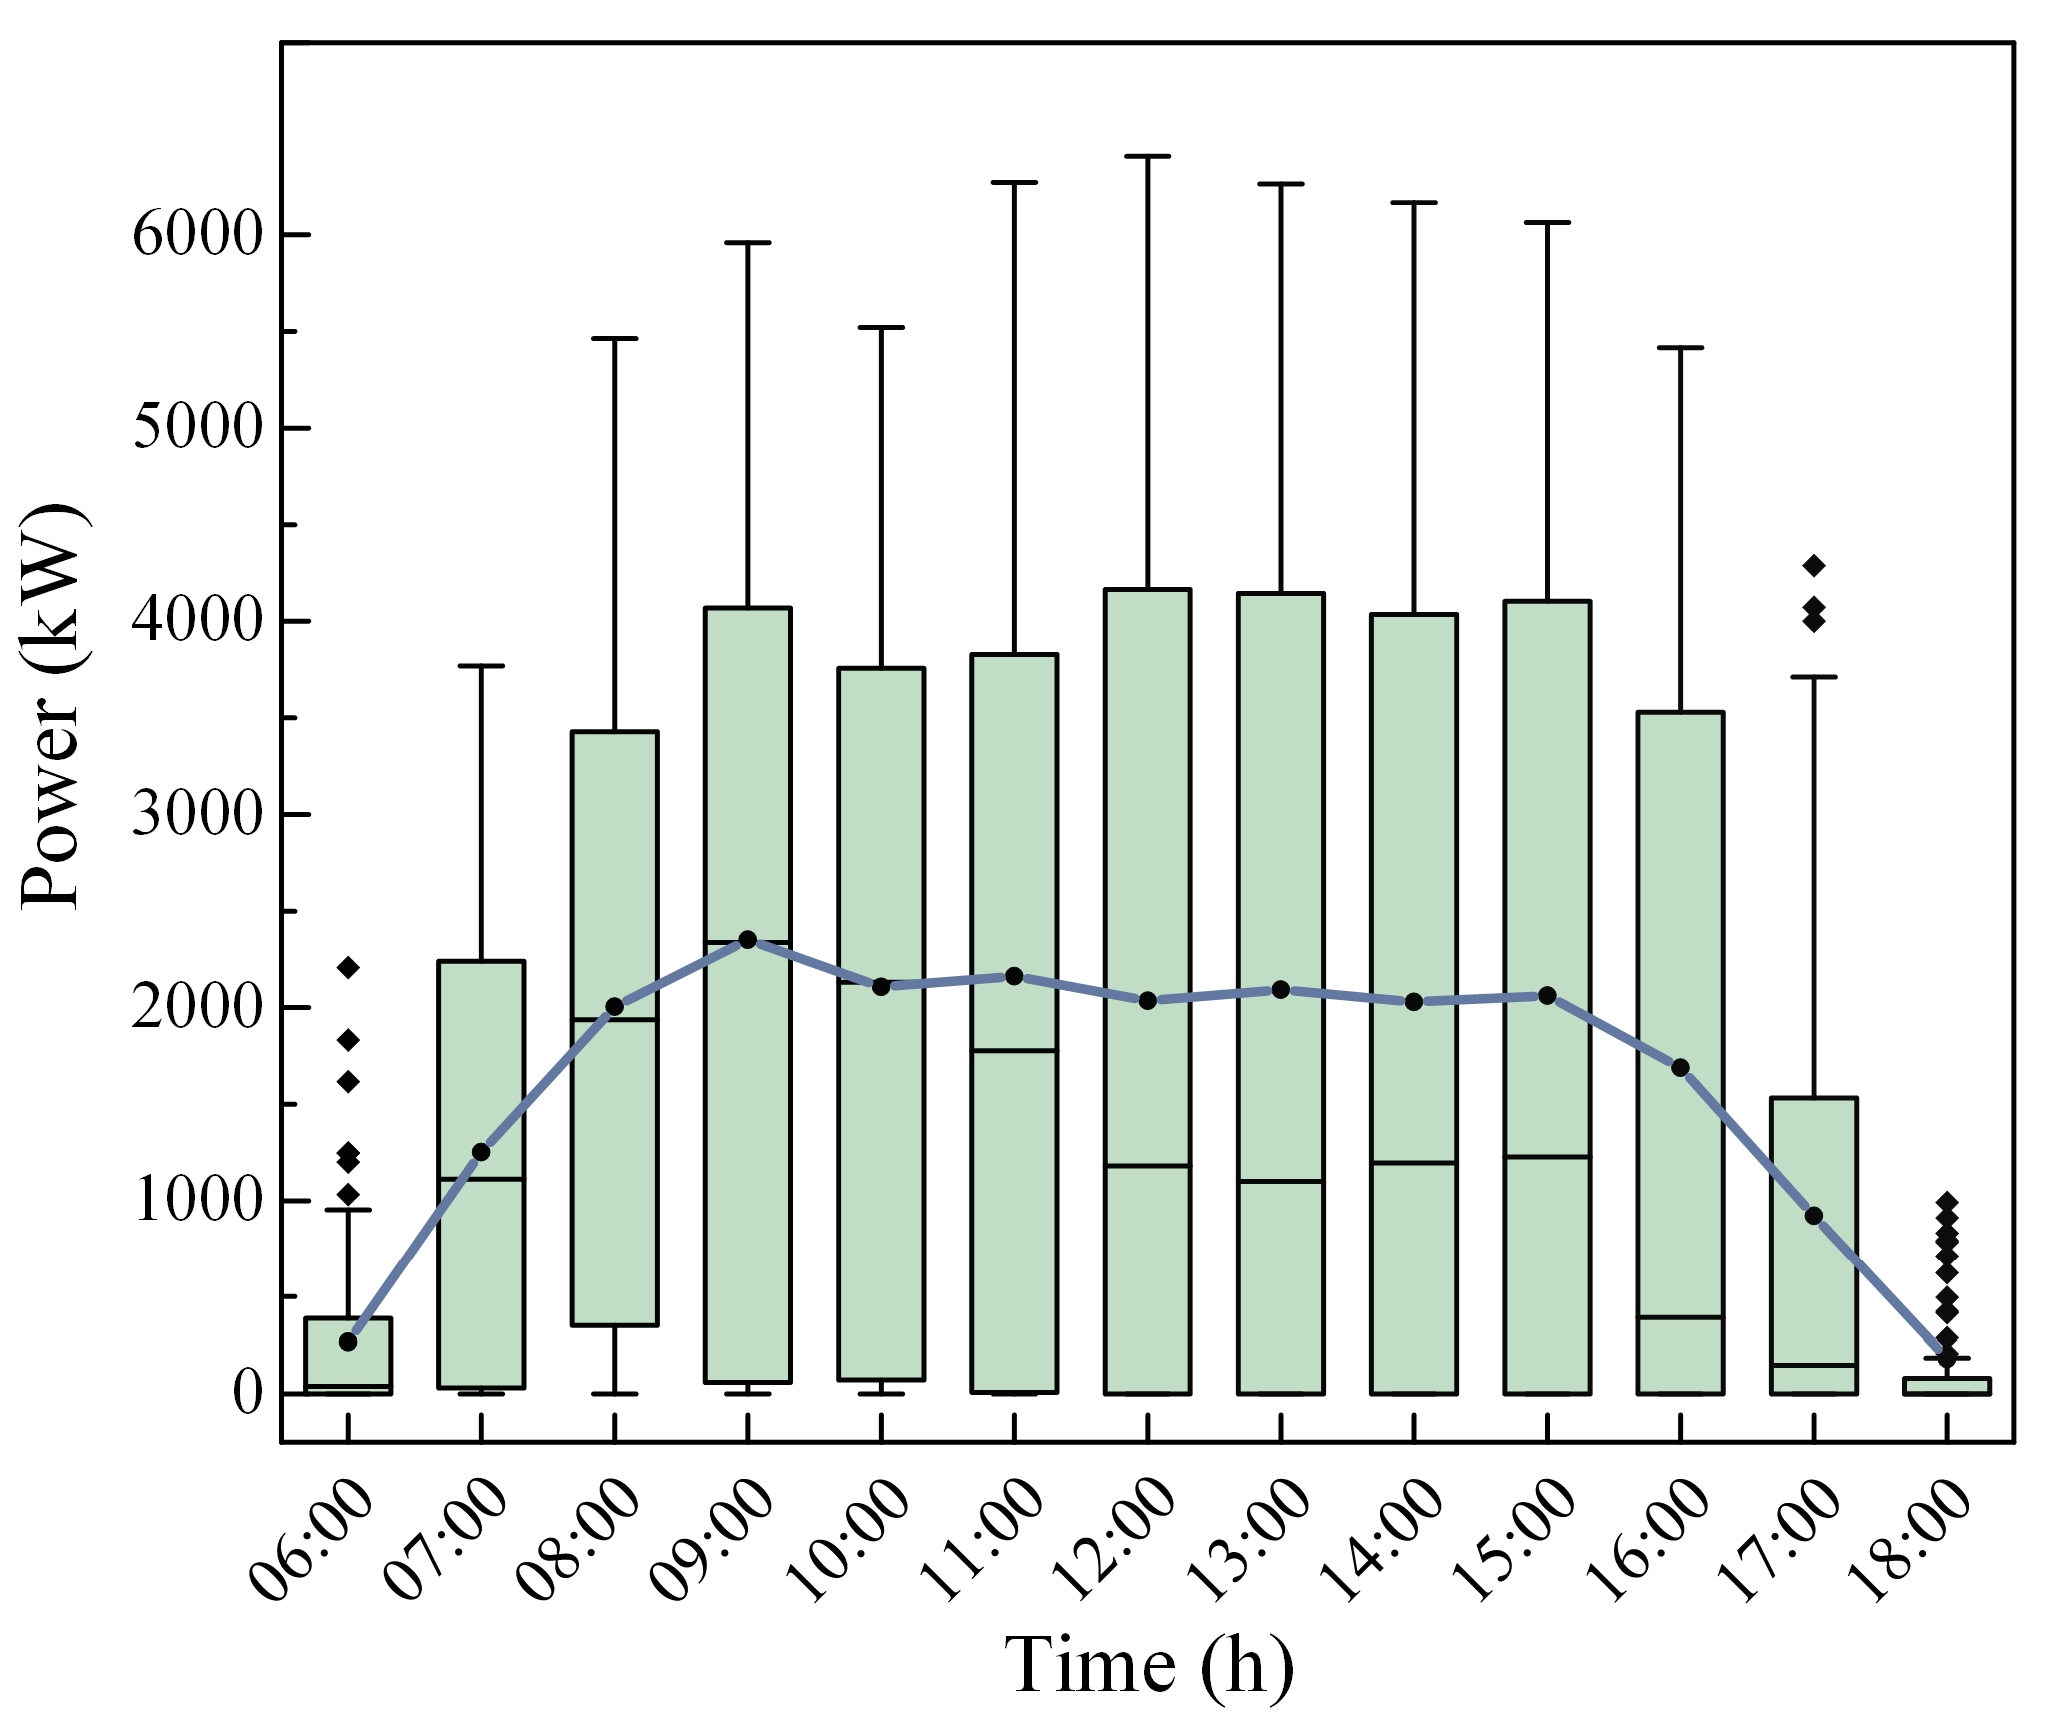
Based on the actual solar irradiance data of the SUSTech campus, the hourly photovoltaic power generation distribution was obtained. By taking the average power generation for each time period [45], a typical day’s photovoltaic power generation profile for the summer was established, as shown in Figure 5.
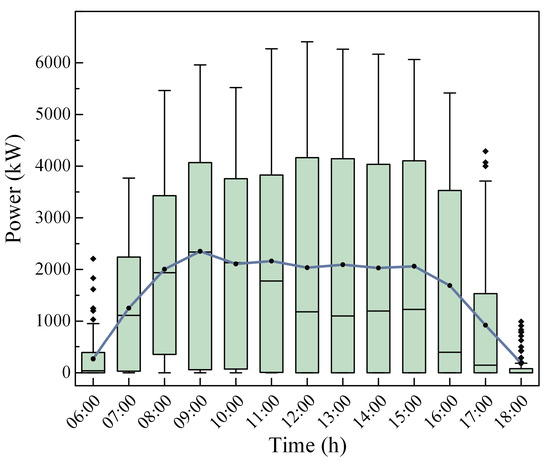
Figure 5.
Power of PV for June to August in 2023.
3.2.3. CEF Data
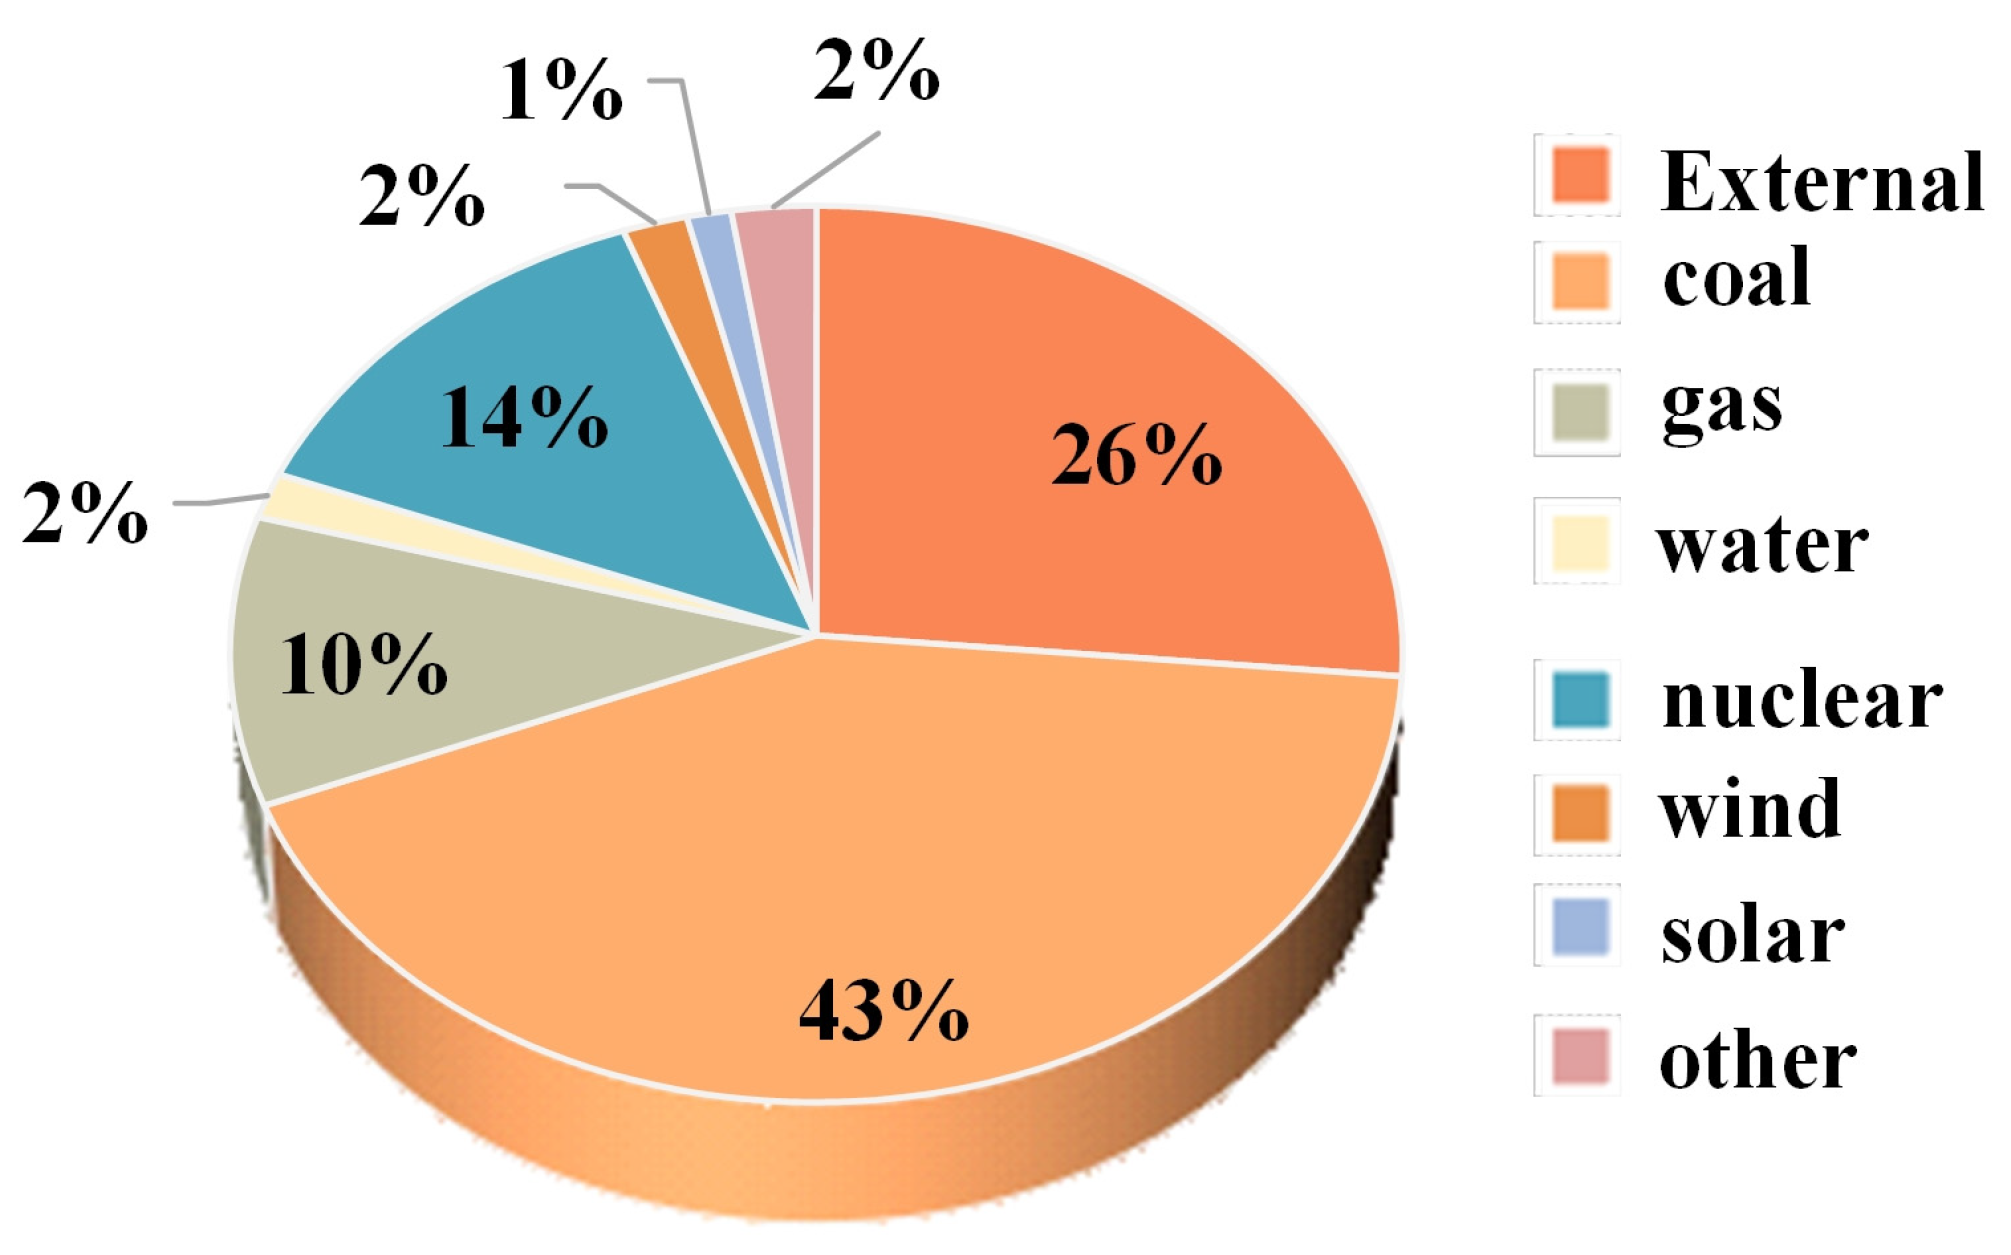
The CEF of the grid is an indicator measuring the amount of carbon dioxide emissions per unit of electricity generated during the power generation process. The fluctuation of the CEF is primarily influenced by the method of power generation; the distribution of power sources in Guangdong Province for the year 2021 is depicted in Figure 6 [45].

Figure 6.
Distribution of power sources in Guangdong in 2021.
Different power generation technologies utilize various energy sources and have differing efficiencies in converting these energies into electricity, resulting in varying amounts of carbon dioxide emissions. The carbon emission factors for each type of power generation method are presented in Table 2 [46]. By analyzing the typical weekday load situation in Guangdong Province in 2021, the carbon emission factor data for the power grid over 24 h can be calculated.
Table 2.
CEF and distribution ratio of each subject.
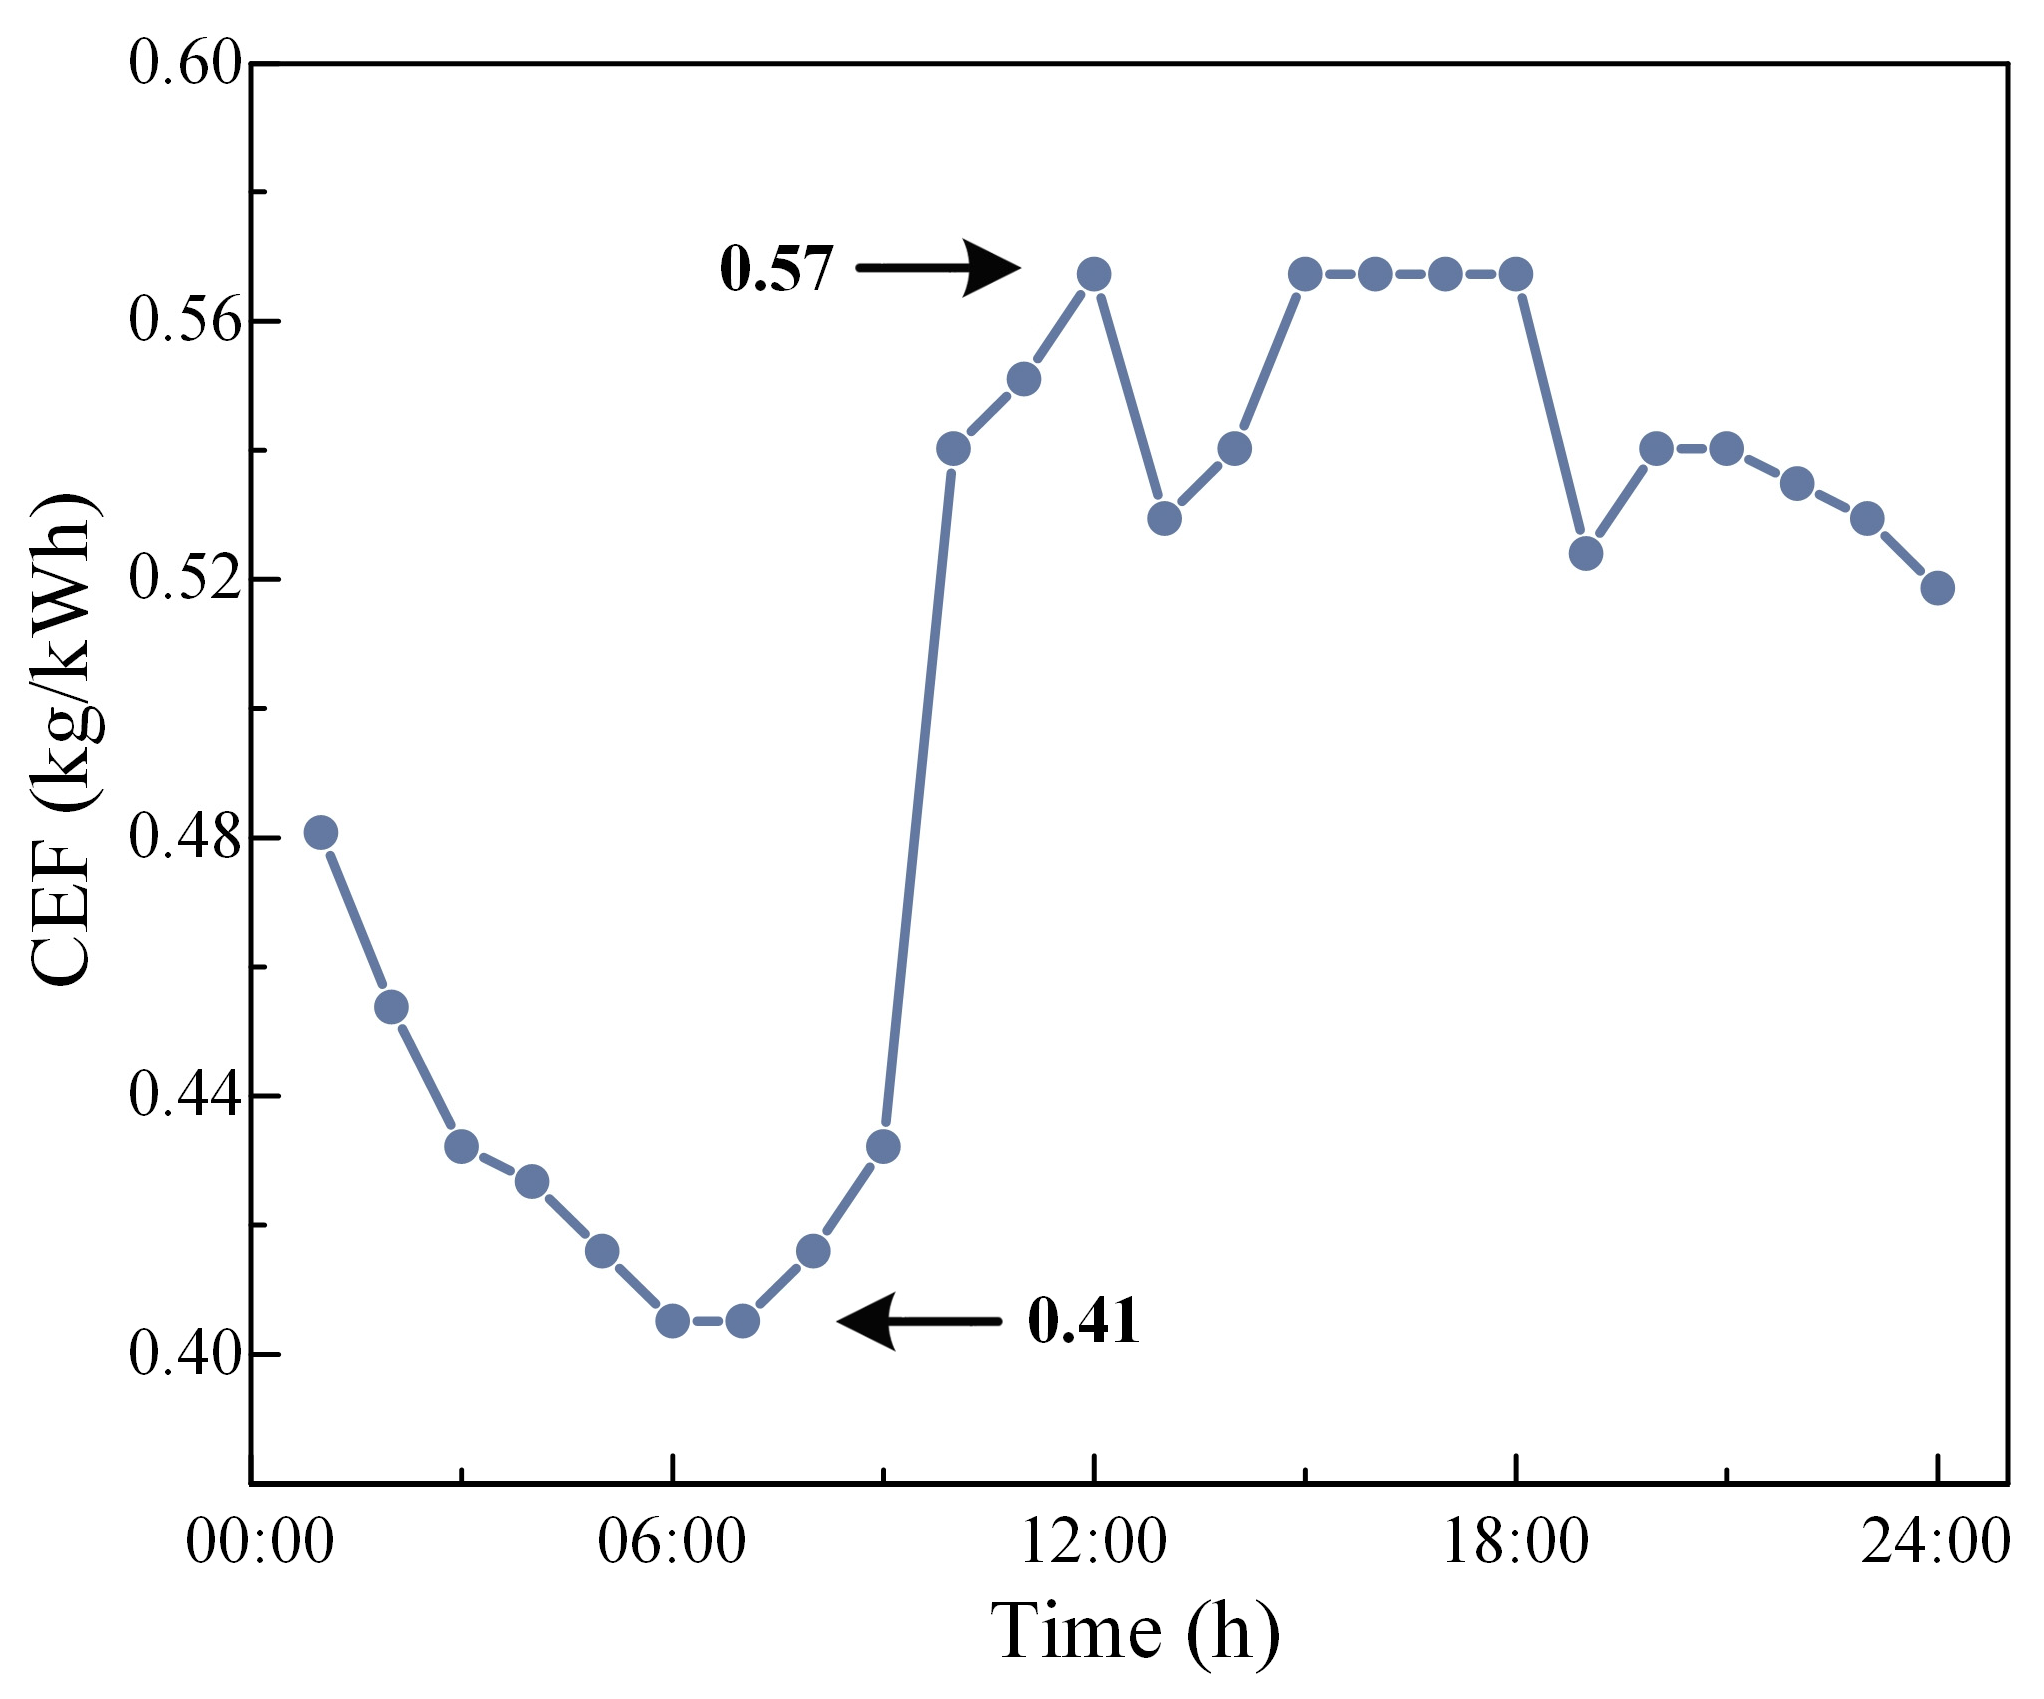
According to the variation of the grid CEF presented in Figure 7, it is observed that within 24 h, the carbon emission intensity is lower between 1:00 AM and 9:00 AM, reaching its lowest value of 0.41 kg CO2/kWh between 6:00 AM and 7:00 AM. The carbon emission intensity is higher between 10:00 AM and midnight, with the peak carbon emission intensity of 0.57 kg CO2/kWh occurring at 12:00 PM and between 3:00 PM and 6:00 PM.
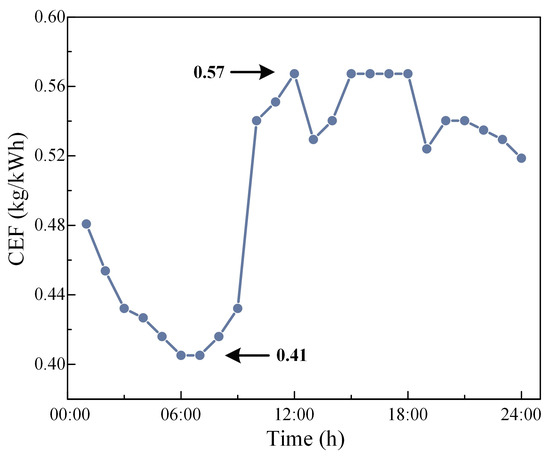
Figure 7.
CEF of grid.
3.3. Analysis of Low Carbon Scheduling Result
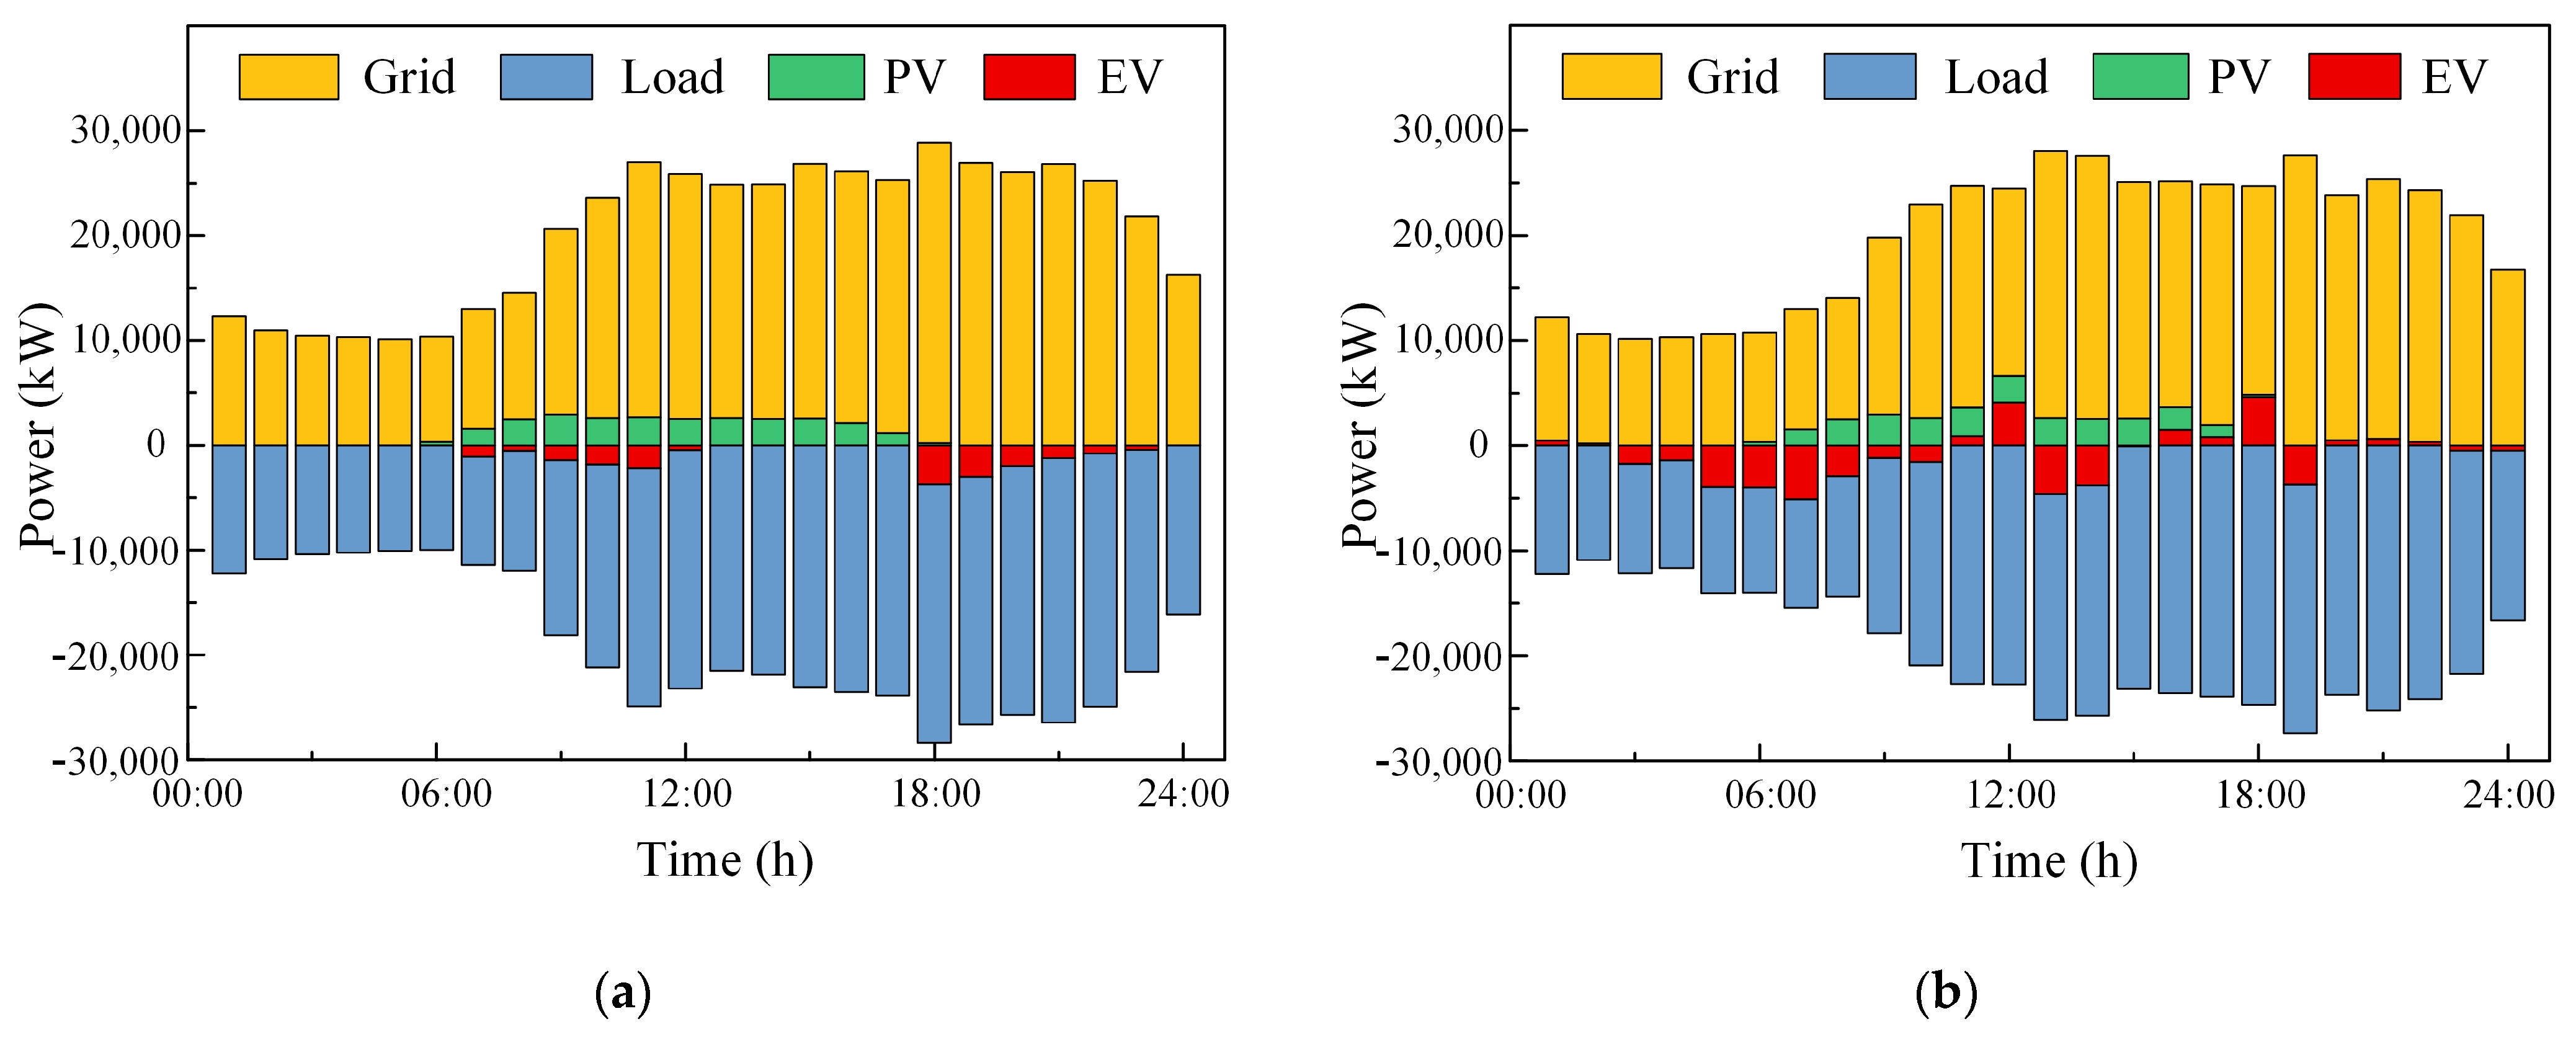
Figure 8 illustrates the power balance of the campus distribution network before and after low-carbon scheduling, taking into account the DS composed of the public power grid, the campus base load, the PV, and EV components. According to the optimization results, the charging and discharging strategy of EVs mainly depends on the carbon emission intensity of the power grid. As shown in Figure 8b, after optimization, EVs concentrate most of their charging needs between 3:00 AM and 9:00 AM, a period when the grid’s carbon emission intensity is relatively low. During times of highest carbon emission intensity, EVs discharge to the grid, reducing the base load demand for high CI electricity from the grid, thereby decreasing the carbon emissions from electricity use in the DS.
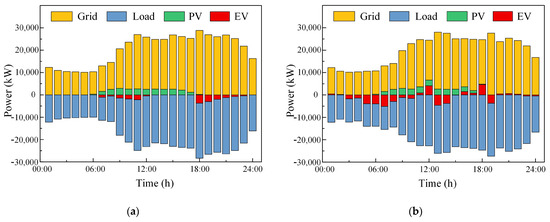
Figure 8.
Power balance of DS. (a) Before scheduling; (b) after scheduling.
3.4. Analysis of Carbon Accounting Result
To account for the carbon emissions of the DS, it is necessary to trace the carbon flow between nodes at each time period. In this study, the nodes in the DS are categorized into load nodes and generator nodes. Generator nodes inject carbon flow into the system, and load nodes consume carbon flow. Therefore, the sum of inject-carbon flow is equal to the sum of load-carbon flow. The status of EV nodes varies at different times, necessitating an analysis of the carbon flow distribution for each period. Table 3 and Table 4 show the CI and CEFR of the distribution network at the 6th and 12th time periods, respectively.
Table 3.
Carbon emission flow rate of DS in 6:00.
Table 4.
Carbon emission flow rate of DS in 12:00.
At 6:00 AM, EV1 and EV2 are connected to the grid, and being considered as loads, the carbon flow injection at this period is from the PV and node31. The system’s carbon emissions totals 7716.04 kg CO2. At 12:00 PM, EV1 and EV2 are not connected to the grid, while EV3, EV4, EV5, and EV6 discharge to the grid, thus being considered as generator. The system’s carbon emission is 12,219.62 kg CO2.
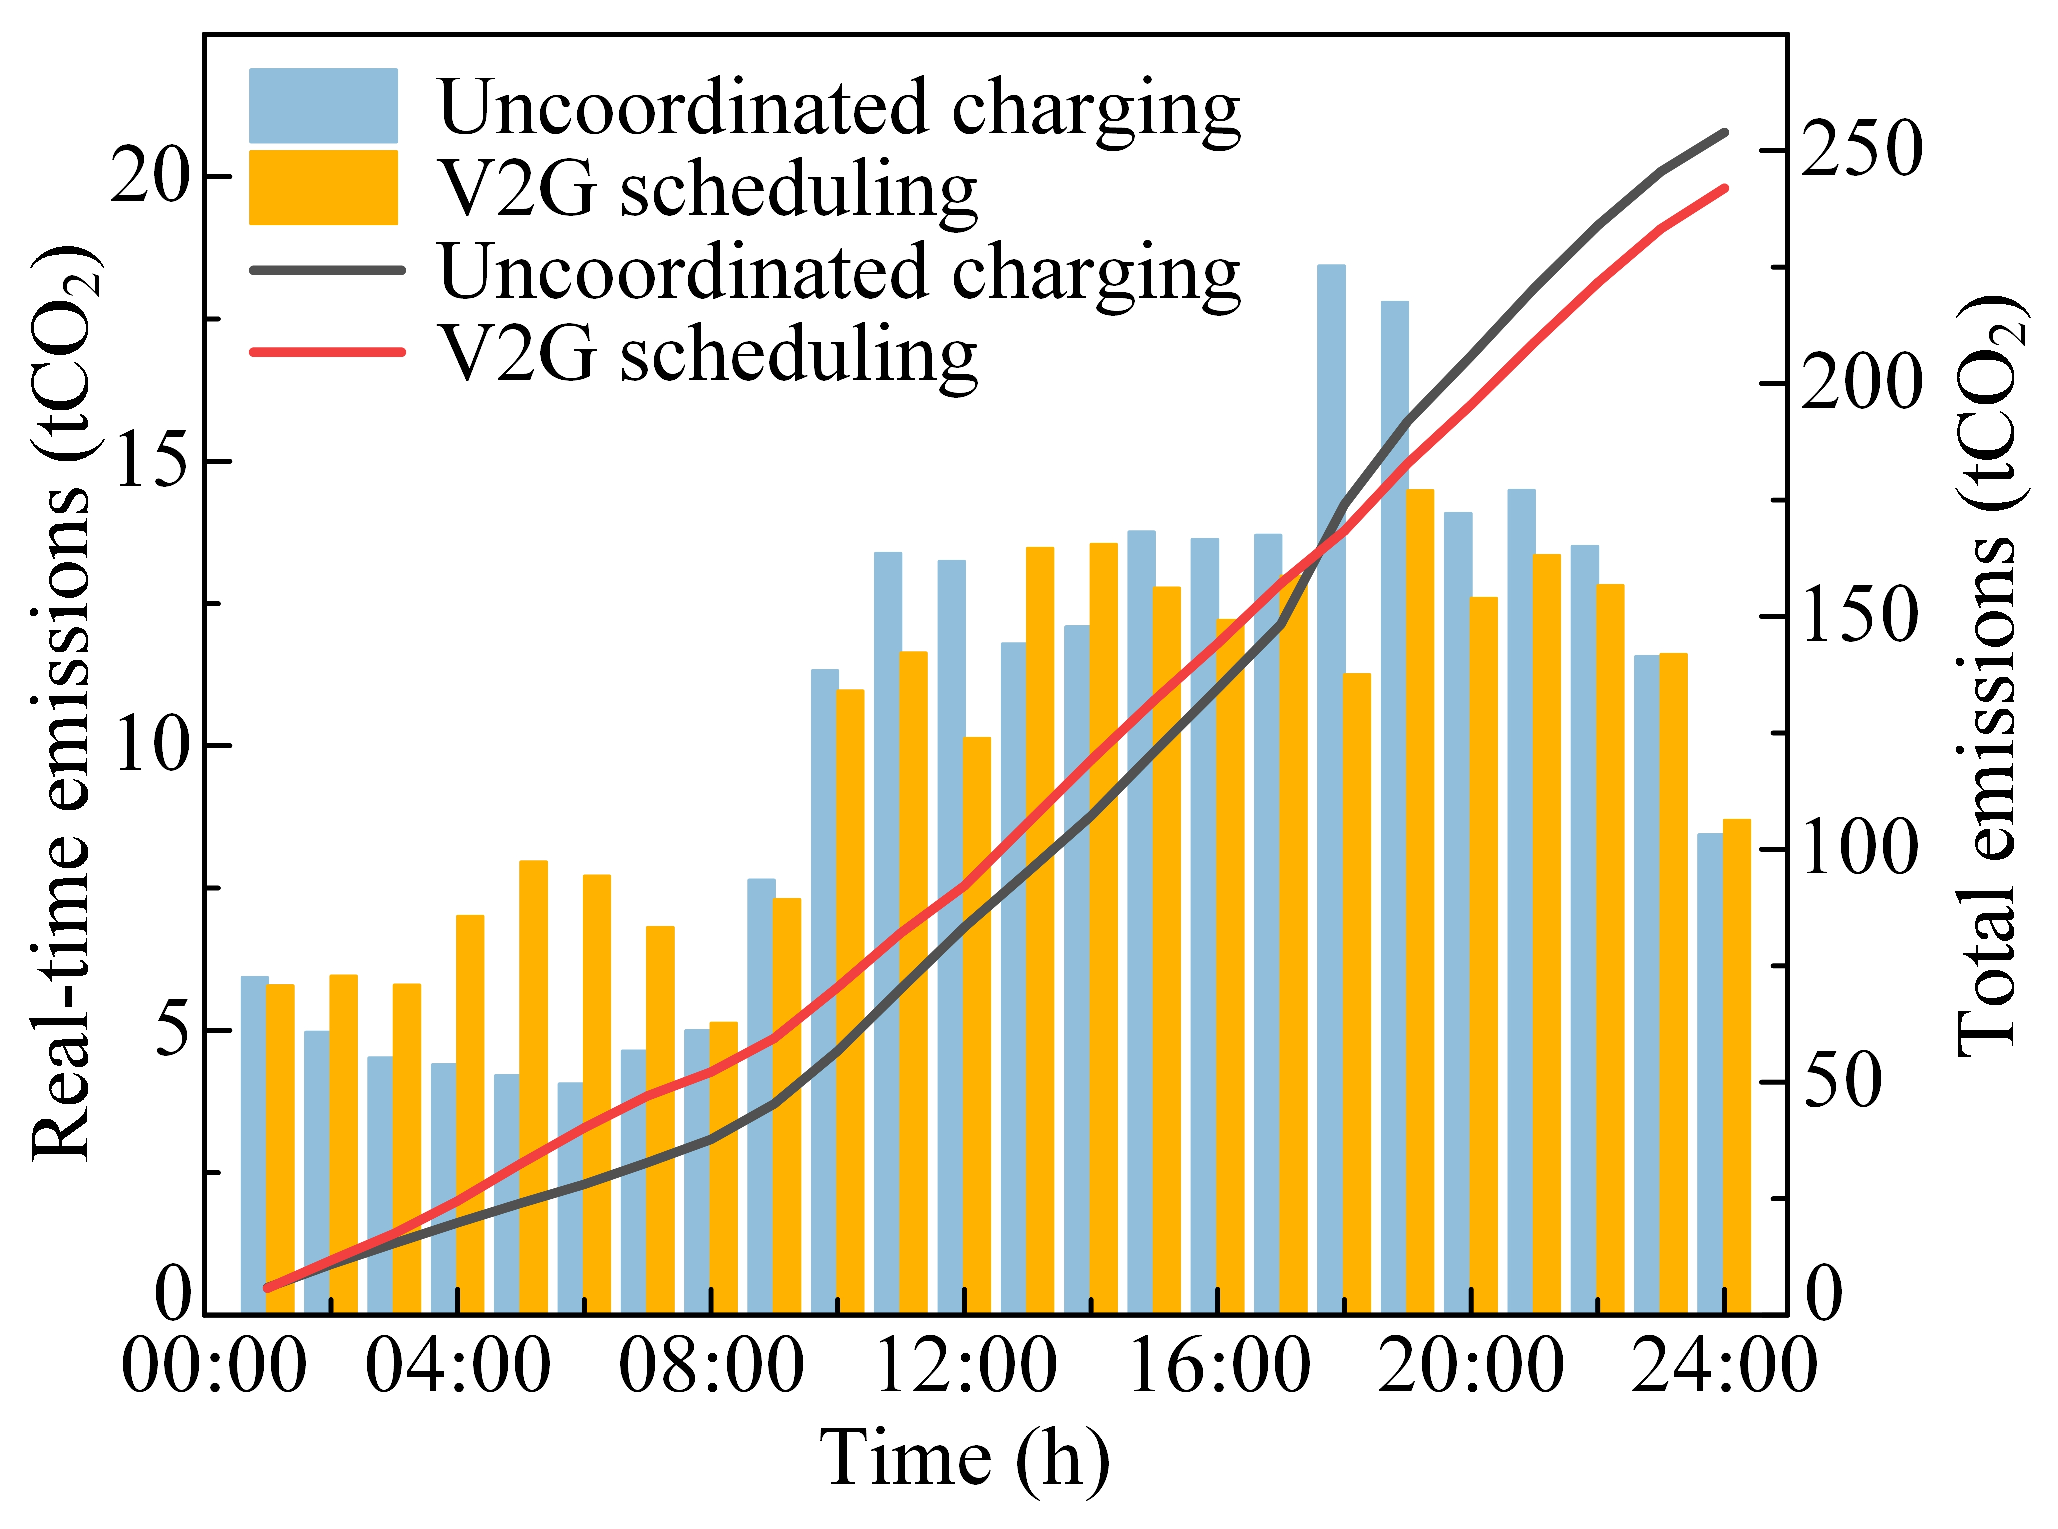
The CEFR distribution in the DS allows for the calculation of the hourly system carbon emissions and the cumulative carbon emissions within 24 h. Figure 9 displays the real-time carbon emissions and the carbon emission variation curve for the DS before and after low-carbon scheduling. The results indicate that over the course of a day, the DS with low-carbon scheduling reduced carbon emissions by 12,034.45 kg CO2 compared to the system without low-carbon scheduling.

Figure 9.
Total carbon emission and real time carbon emission of DS before and after scheduling.
During the period from 0:00 to 9:00, the carbon emission factor of the grid is relatively low. However, from 10:00 to 23:00, the carbon emission factor is higher, leading to higher system carbon emissions. During peak periods of carbon emission factor, the system’s hourly carbon emissions after low-carbon scheduling are generally lower than those of the unscheduled system. The largest difference occurs at 18:00, where the carbon emissions of the system after low-carbon scheduling are reduced by 6888.49 kg CO2. For periods with lower carbon emission factor, the hourly carbon emissions of the system after low-carbon scheduling are generally higher than those of the unscheduled system. The largest difference occurs at 5:00, where the carbon emissions of the system after low-carbon scheduling are 3751.68 kg CO2 higher than the unscheduled system.
Therefore, from the perspective of the DS, it can be observed that EVs, through V2G scheduling, reduce the carbon emissions of the system during periods of high carbon emission factor. They shift charging demands periods of low-carbon electricity, effectively utilizing the fluctuating nature of grid carbon emission factor. This smoothens the carbon emission variation curve of the DS and reduces the total carbon emissions of the system within 24 h.
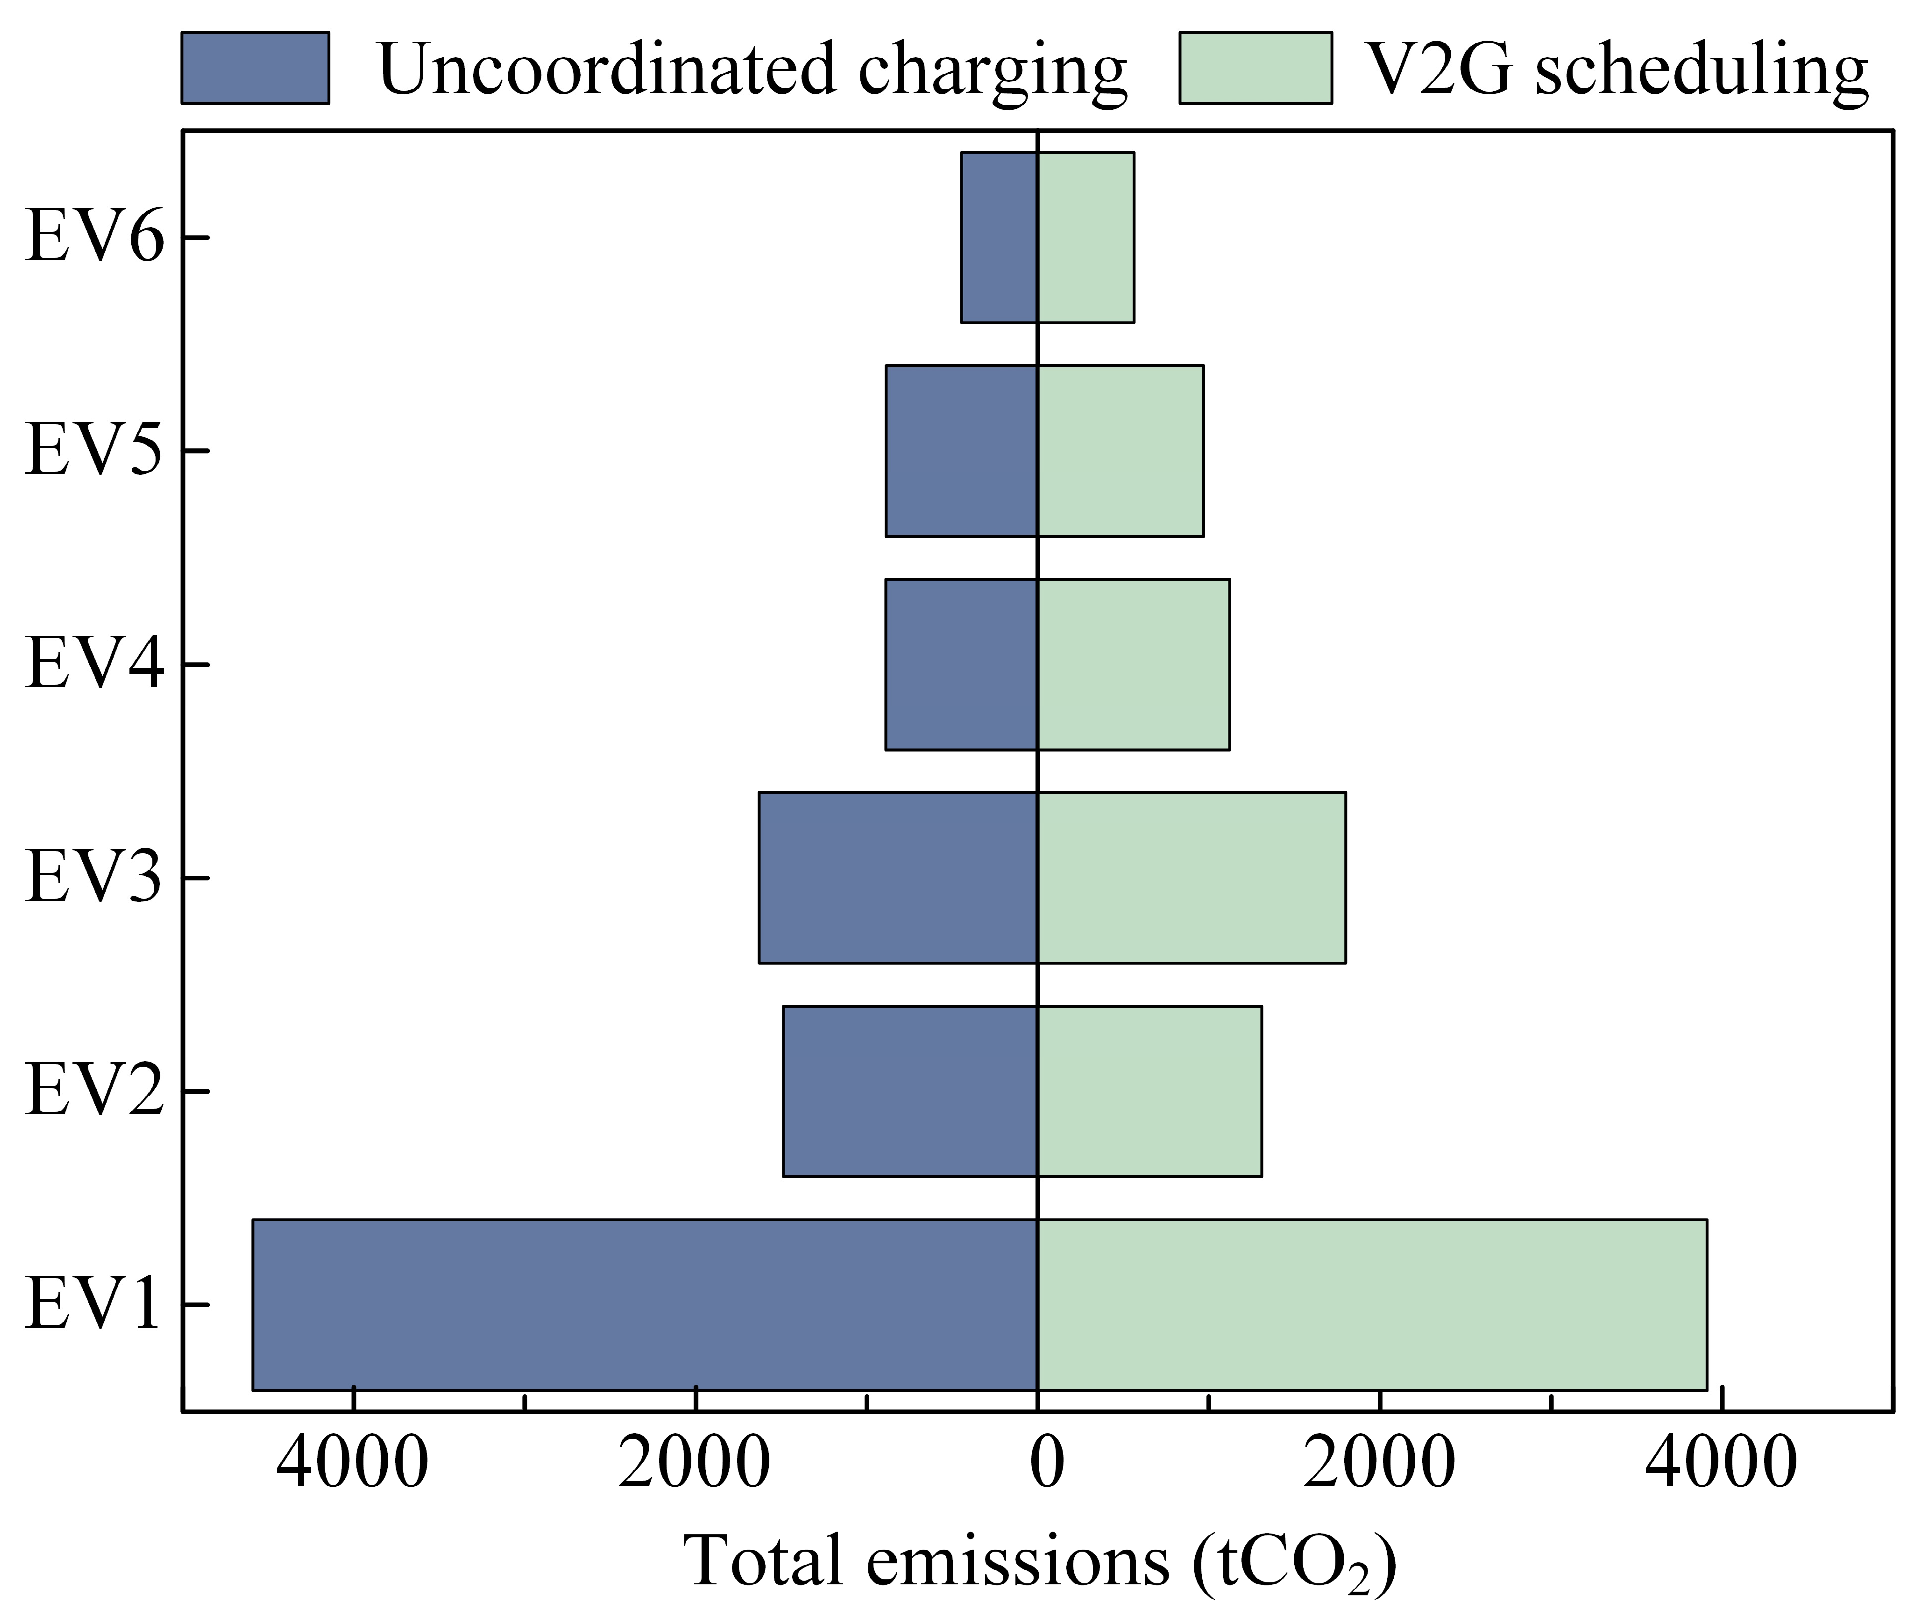
For EVs, V2G scheduling not only reduces the carbon emissions of the DS but also has an impact on the carbon emissions of EVs themselves. Figure 10 compares the carbon emissions of six different EVs before and after low-carbon scheduling. Among them, EV1 and EV2 showed reductions of 680.90 kg CO2 and 179.72 kg CO2, respectively, after optimization scheduling. However, EV3, EV4, EV5, and EV6 did not show emission reductions. This variation is attributed to factors such as the timing of EV connection to the grid, their charging demands, and changes in their own CI.

Figure 10.
Total carbon emission of EV1, EV2, EV3, EV4, EV5, and EV6 before and after scheduling.
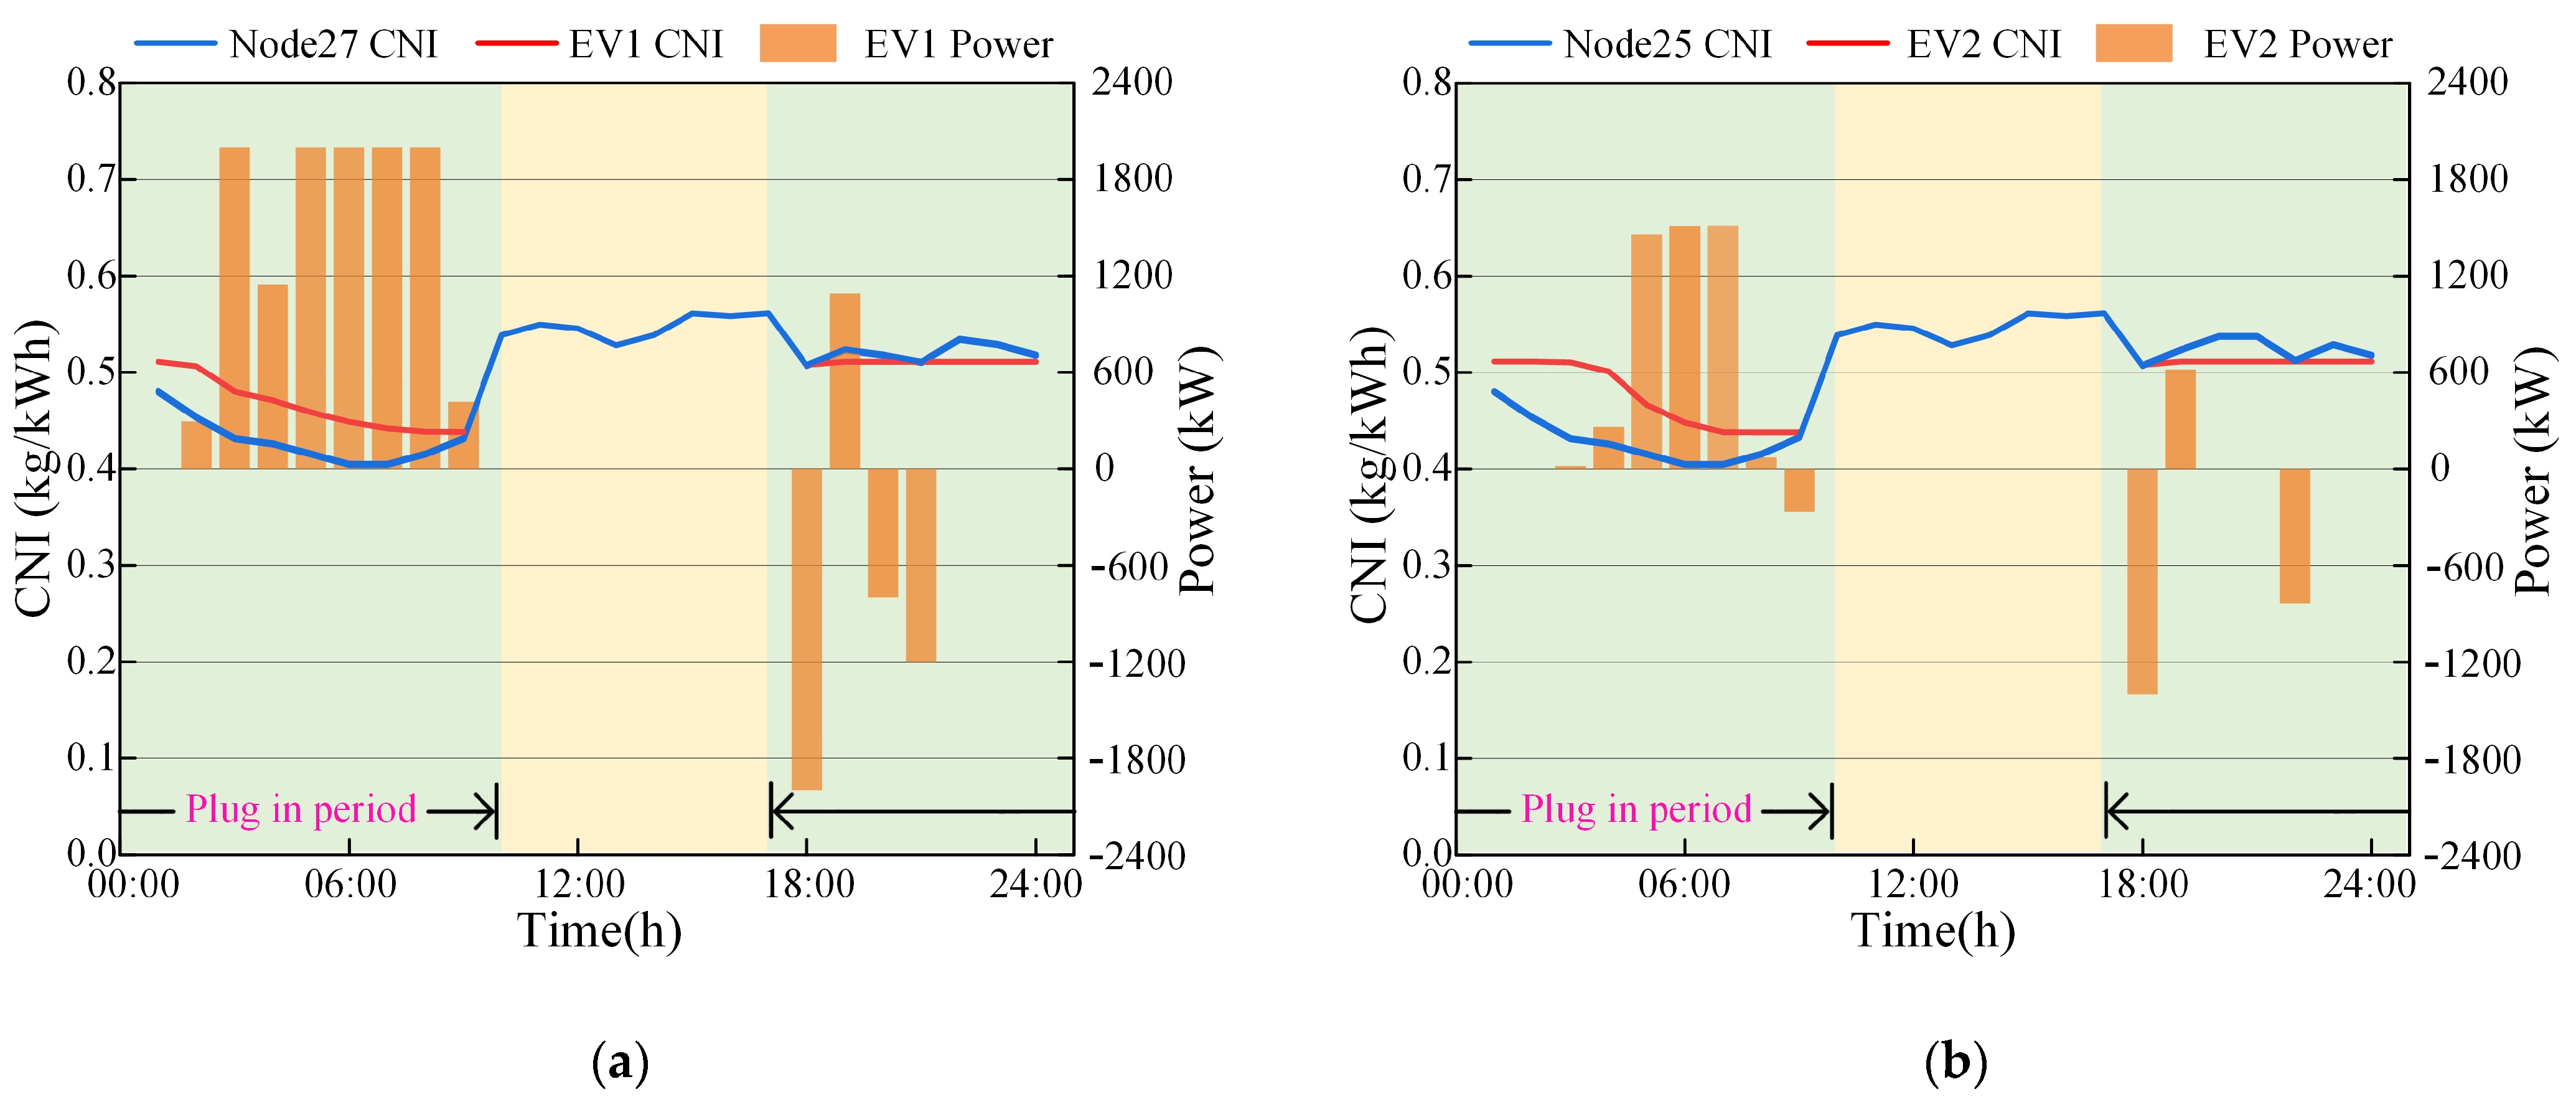
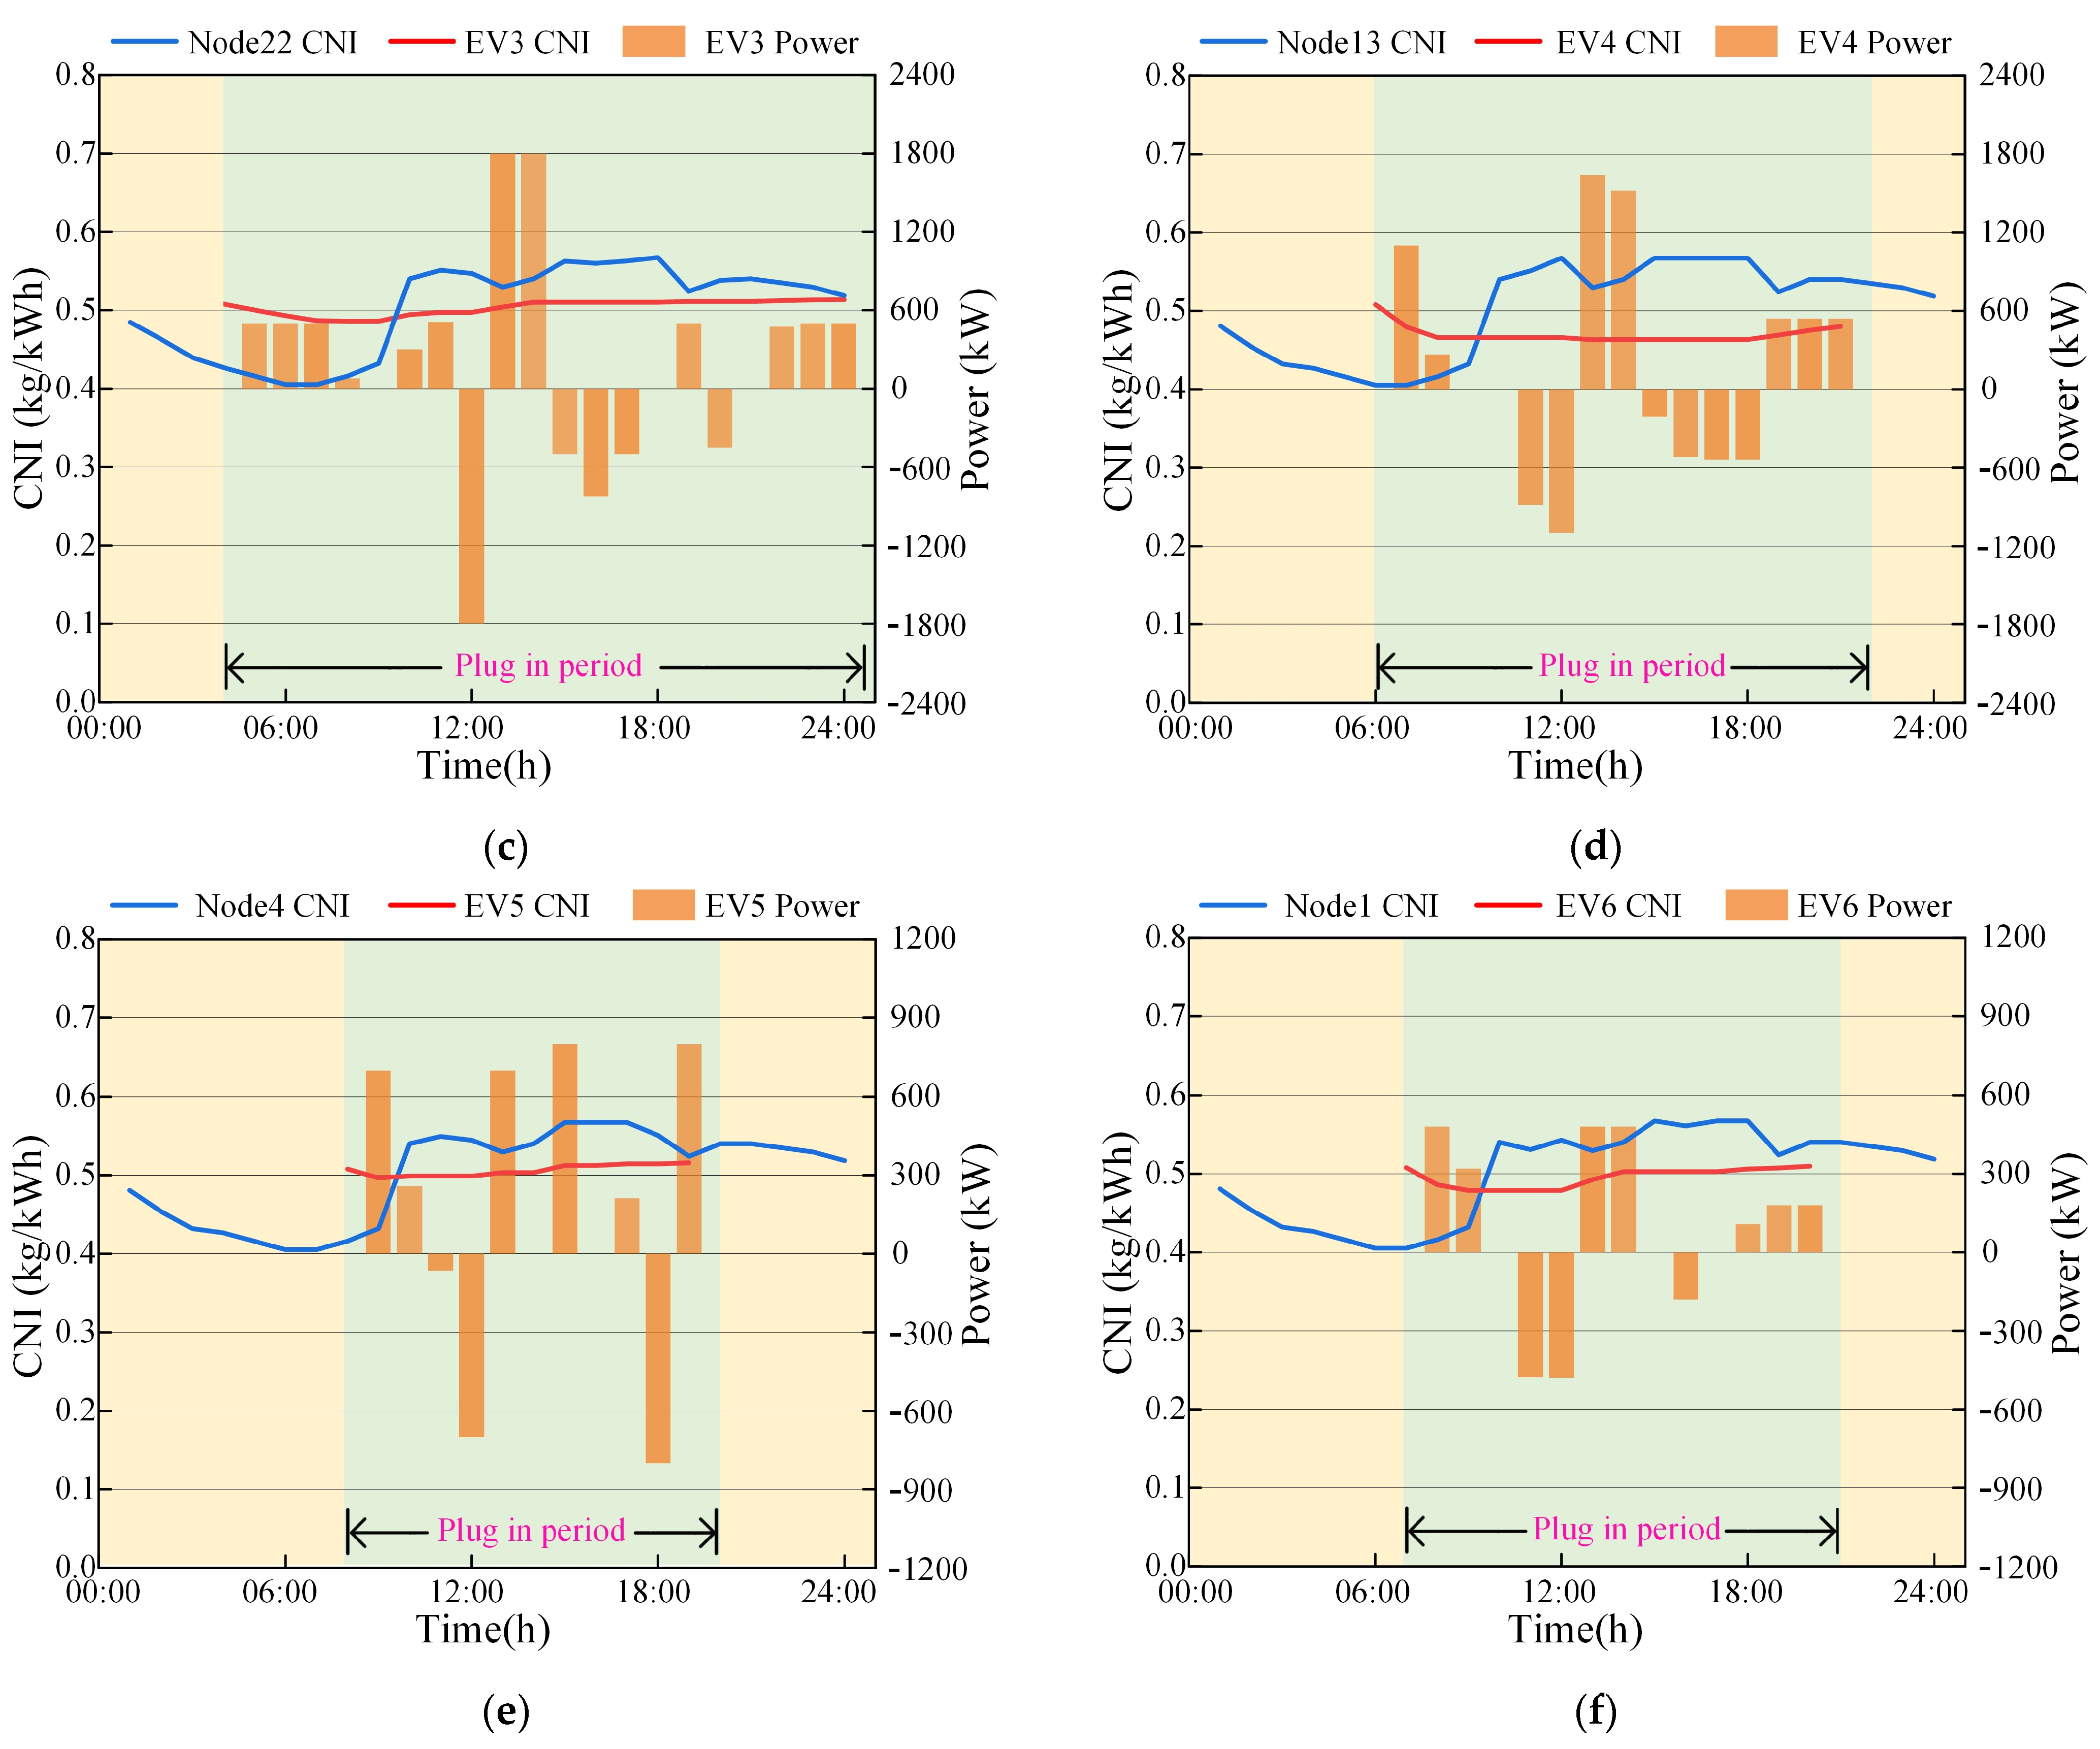
Figure 11 illustrates the real-time variations in the CI of six types of EVs as well as the NCI of upstream nodes, to analyze the relationship between EV carbon emissions and CI. Figure 11a,b depicts the changes in CI and their charging/discharging power for EV1 and EV2. During the 18:00–22:00 period, the CI of EVs is lower than the NCI of upstream nodes, and both EV1 and EV2 discharge to the grid to reduce the carbon emissions of the upstream node’s base load. From 1:00 to 9:00, the NCI of upstream nodes is lower than that of EVs, and both EV1 and EV2 primarily charge during this period to reduce the carbon emissions associated with EV charging. Additionally, the CI of EVs gradually decreases during the charging process, reaching values of 0.4383 kg CO2/kWh and 0.4379 kg CO2/kWh when leaving the grid, showing a reduction compared to when they were connected. EV3, EV4, EV5, and EV6 connect to the grid during periods of high carbon emission factor, as shown in Figure 11c–f. When the NCI of upstream nodes is high, these EVs discharge to the grid to reduce the system’s carbon emissions. Conversely, when the NCI of upstream nodes is low, the EVs charge to reduce the carbon emissions associated with EV charging. Compared to when they first connect to the grid, the CI of EV3, EV5, and EV6 have all increased, while the EV4 upstream nodes have PV power injection during the 7:00–8:00 and 13:00–14:00 periods, reducing the NCI between upstream nodes and EV4. However, due to EV4 discharging low-carbon power to the system’s base load, it reduces the system’s carbon emissions.
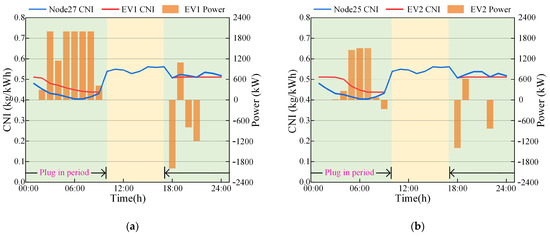
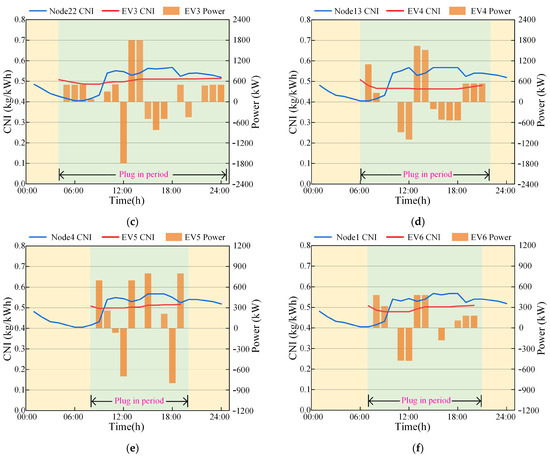
Figure 11.
Real-time NCI and charging power of (a) EV1, (b) EV2, (c) EV3, (d) EV4, (e) EV5, and (f) EV6.
To meet charging demands, high CI power is charged during 19:00–21:00. Consequently, although the CI of EV4 has decreased compared to pre-optimization, its carbon emissions have still increased. From this, we can infer that the CI of EVs can indirectly reflect the carbon emissions during the EV charging process. However, to accurately account for EV carbon reduction contribution to the distribution network, it is necessary to consider the combined effects of changes in the carbon reduction of DS and CI of EVs.
3.5. Result of Revenue Distribution
To ensure the long-term and stable participation of EV owners in low-carbon dispatch and to allocate profits reasonably, the average carbon price in the 2022 Chinese carbon market, which is 58.07 RMB/t CO2 [47], was used in this study to calculate the carbon cost and carbon reduction revenue for EVs. Based on the improved Shapley model, Table 5 shows the carbon reduction amount V(S), low carbon cost C(S), and carbon reduction revenue (φ) for each EV alliance combination.
Table 5.
Cost and carbon reduction revenue allocation in all possible alliance combinations.
In most cases, cooperative operation results in higher carbon reduction revenue compared to independent operation. Taking EV1 and EV2 as an example, when EV1 and EV2 operate independently, the EV1 carbon reduction revenue is RMB 60.2, and the EV2 carbon contribution is RMB 187.0. However, when EV1 and EV2 operate together, the alliance’s overall carbon reduction revenue is RMB 299.3. This means that compared to operating independently, cooperative operation results in an additional RMB 52.1 of carbon reduction revenue for the system, primarily due to a reduction in carbon costs by RMB 94.4. In such cases, EV1 and EV2 are more inclined to cooperate. When EVs form a large alliance, the system’s low carbon cost decreases by 83%, and the total revenue increases by 82.8%.
Based on the allocation results shown in Table 6, the analysis reveals that EV1 has a high carbon reduction contribution, and its CI when leaving the grid has a significant decrease compared to when it connects to the grid. Therefore, it incurs a higher low-carbon cost. The carbon reduction revenue allocation for EV1 is RMB 103.02. EV2 also has a high carbon reduction contribution, and the CI of EV2 when leaving the grid is the lowest, implying that it incurs the highest low-carbon cost. After allocation, EV2 receives a carbon reduction revenue of RMB 219.41.
Table 6.
CI and Distribution ratio of each subject.
For EV3, EV4, EV5, and EV6, considering the carbon reduction contributions and the low carbon costs incurred by these four entities, the revenue allocation based on the improved Shapley value is as follows: RMB 15.03, RMB 15.97, RMB 9.13, and RMB 13.11, respectively.
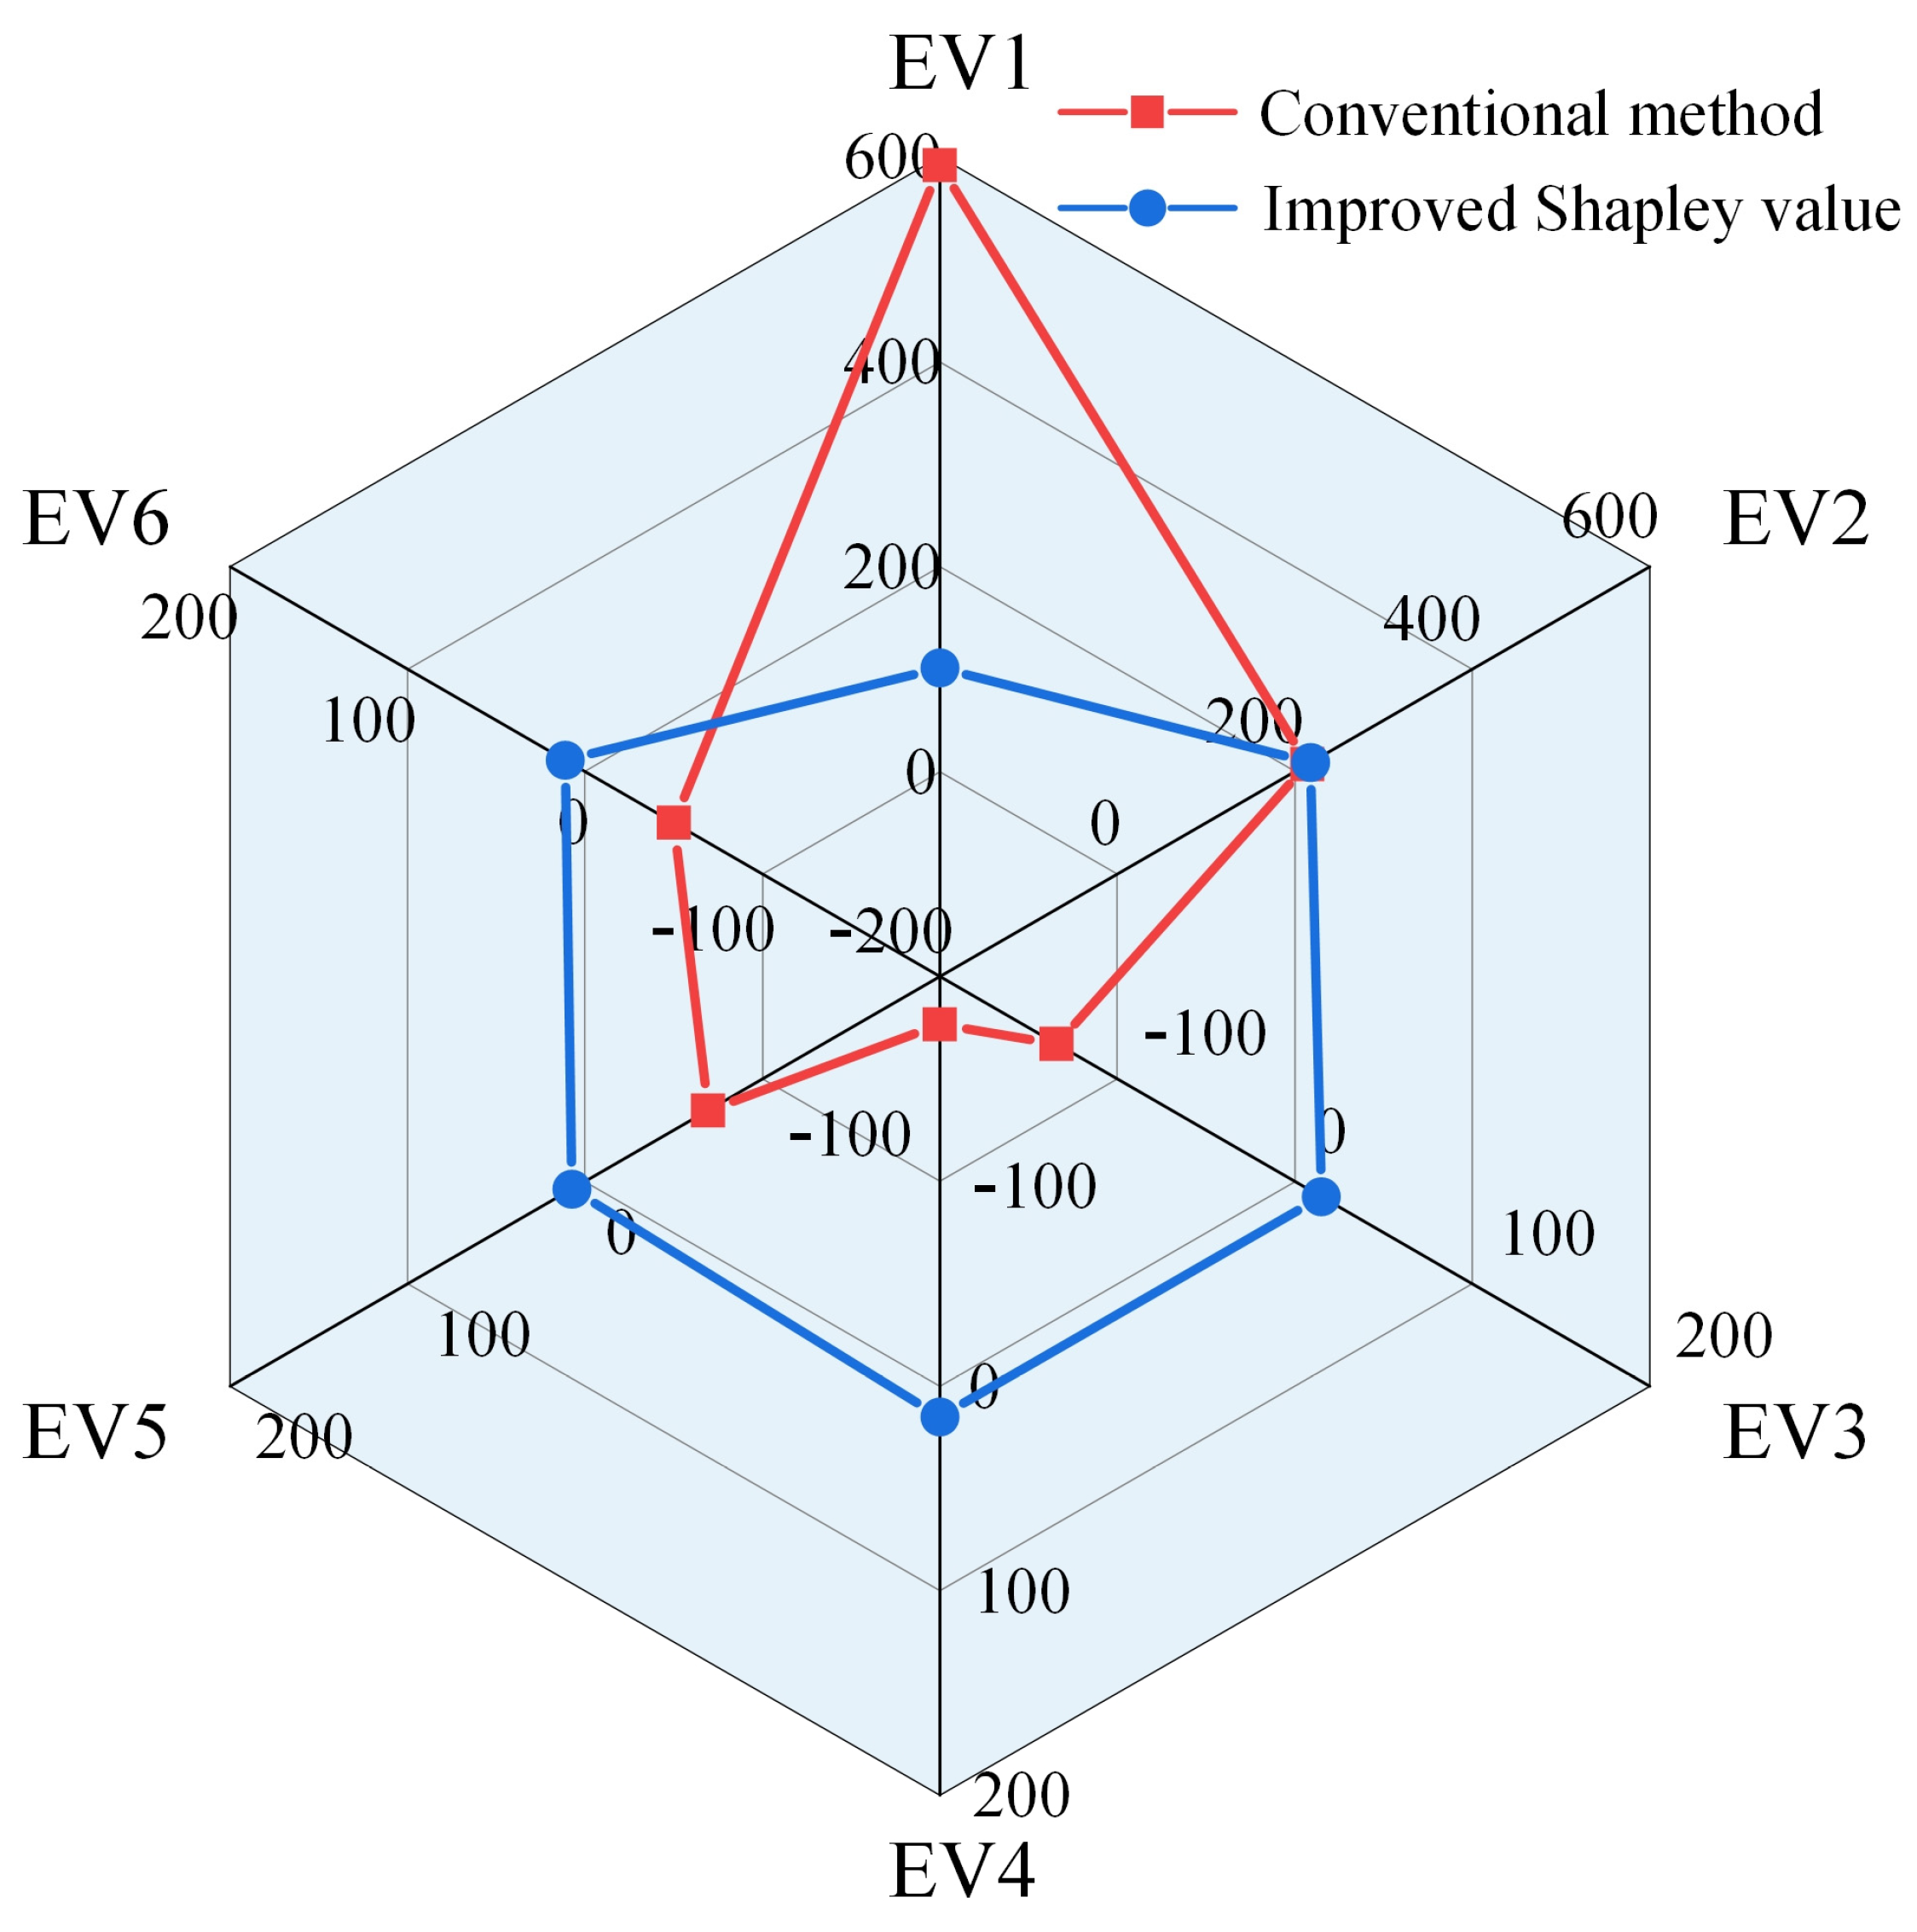
The comparison between the conventional allocation method and the improved Shapley value method proposed in this paper is shown in Figure 12. Under the conventional allocation method, EVs that charge overnight have longer grid connection times, and their time period includes the grid load valley period with lower carbon emissions. EV1 and EV2 use V2G scheduling to utilize low-carbon electricity to meet their charging needs, significantly reducing their carbon emissions. They can also provide power to the base load during high carbon emission factor periods in the distribution grid, resulting in higher carbon reduction. On the other hand, EV3, EV4, EV5, and EV6 connect to the grid during peak load periods with higher carbon emissions. Their V2G scheduling capabilities are limited, making it difficult to reduce their own carbon emissions while satisfying their charging needs. The improved Shapley value allocation method takes into account both the carbon reduction of EVs and the corresponding low carbon costs associated with changes in carbon emissions. It provides a more comprehensive evaluation of the carbon reduction contributions of different entities in the operating system, leading to a more reasonable carbon reduction revenue distribution.
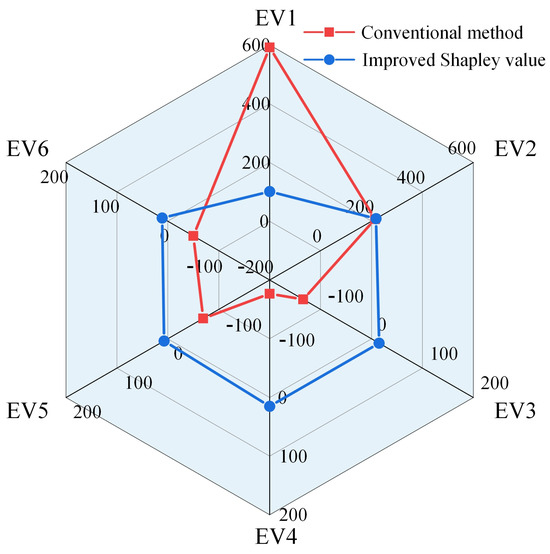
Figure 12.
Revenue distribution results.
4. Conclusions
This paper proposes a method for optimizing EV charging and carbon revenue distribution. Initially, it constructs a carbon accounting model for the DS using carbon flow theory, analyzing the carbon flow in EVs under V2G modes and tracing the carbon emissions within the distribution network. Subsequently, aiming to minimize system carbon emissions, the study establishes a low-carbon optimization model for the DS. This model considers constraints such as energy supply and demand balance, flow constraints, and EV charging and discharging constraints. It explores the carbon reduction potential of V2G by comparing system carbon emissions under different EV charging modes. Furthermore, the paper develops an improved Shapley value revenue allocation model based on the carbon reduction contributions of EVs through V2G. This model allocates carbon revenues to EVs proportionally. The effectiveness of the proposed method is validated through numerical simulations on a real 31-node distribution network at the Southern University of Science and Technology. The proposed carbon accounting model is capable of calculating carbon emissions for EVs in different charging states and tracing the impact of carbon flow during charging and discharging on both the CI of EVs and the overall carbon emissions of the distribution network. The established low-carbon optimization model for the DS can assist in reducing carbon emissions by 4.12%. However, while EV1 and EV2 reduce their carbon emissions by 14.8% and 12.1% respectively, the carbon emissions of other EVs increase, which is not equitable for EV owners participating in the scheduling. This may reduce their willingness to participate in such programs. By analyzing the impact of CI on EV carbon emissions and the system’s carbon emissions, introducing low-carbon costs into the allocation criteria, and employing the improved Shapley value method, a multi-dimensional benefit allocation is achieved. The allocation ratios for the six EVs are 27%, 58%, 4%, 4%, 2%, and 3%, respectively. Compared to allocation methods that do not consider the CI of EVs, this approach provides a more reasonable allocation of benefits, balancing contributions from individual EVs and alliances. Within the context of China’s low-carbon transition, this study provides valuable insights into low-carbon scheduling for DSs and carbon accounting for EV charging, emphasizing the necessity of further incentives to reduce carbon emissions. It explores the potential of EVs to enhance the economic viability of the CEM in future scenarios. The methodology proposed can be generalized to other EV distribution network integration scenarios, encouraging more EV owners to participate in low-carbon scheduling of the DS by offering verifiable carbon reduction data and benefits.
This research also has limitations. The current charging scenarios are somewhat simplistic and do not fully integrate EVs with the CEM. Further studies should broaden to encompass a wider array of charging scenarios, thereby enhancing the applicability of the carbon accounting model and carbon revenue distribution methods. Moreover, further research into carbon trading market mechanisms is needed, empowering EV owners to participate in carbon markets, leveraging carbon trading to maximize owners’ carbon revenues, promoting the democratization of the energy system, and aiding the achievement of a sustainable and equitable low-carbon transition. Consequently, additional research is required to validate our findings and to further explore the extensive impact of EVs on the power system and society.
Author Contributions
Conceptualization, B.Y. and L.J.; methodology, B.Y. and X.L.; software, B.Y. and X.L.; validation, B.Y. and X.L.; formal analysis, B.Y. and L.J.; investigation, B.Y. and X.L.; resources, B.Y. and X.L.; data curation, X.L.; writing—original draft preparation, B.Y.; writing—review and editing, B.Y. and X.L.; visualization, B.Y.; supervision, L.J., Z.S. and X.L.; project administration, L.J.; funding acquisition, L.J. All authors have read and agreed to the published version of the manuscript.
Funding
This work was supported in part by the Science and Technology Innovation Committee of Shenzhen under Project JCYJ20220530113008019.
Informed Consent Statement
Informed consent was obtained from all subjects involved in the study.
Data Availability Statement
Study data are available upon request from the corresponding author.
Conflicts of Interest
The authors declare no conflict of interest.
References
- Ren, B.; Jia, Y.; Li, Q.; Wang, D.; Tang, W.; Zhang, S. Robust Wind Power Ramp Control Strategy Considering Wind Power Uncertainty. Electronics 2024, 13, 211. [Google Scholar] [CrossRef]
- Tzeremes, P.; Dogan, E.; Alavijeh, N.K. Analyzing the nexus between energy transition, environment and ICT: A step towards COP26 targets. J. Environ. Manag. 2023, 326, 116598. [Google Scholar] [CrossRef]
- Bayram, I.S.; Galloway, S.; Burt, G. A probabilistic capacity planning methodology for plug-in electric vehicle charging lots with on-site energy storage systems. J. Energy Storage 2020, 32, 101730. [Google Scholar] [CrossRef]
- Tuballa, M.L.; Abundo, M.L. A review of the development of Smart Grid technologies. Renew. Sustain. Energy Rev. 2016, 59, 710–725. [Google Scholar] [CrossRef]
- Kuang, Y.; Chen, Y.; Hu, M.; Yang, D. Influence analysis of driver behavior and building category on economic performance of electric vehicle to grid and building integration. Appl. Energy 2017, 207, 427–437. [Google Scholar] [CrossRef]
- Arango Castellanos, J.D.; Dhanasekaran Velayutha Rajan, H.; Rohde, A.-K.; Denhof, D.; Freitag, M. Design and simulation of a control algorithm for peak-load shaving using vehicle to grid technology. SN Appl. Sci. 2019, 1, 951. [Google Scholar] [CrossRef]
- Liu, T.; Liu, J.; Li, Y.; Li, Y. Balancing the Water–Carbon Trade-Off: Development of a Bi-Level Source–Grid–Load Synergistic Optimization Model for Multi-Regional Electric Power System. Electronics 2024, 13, 516. [Google Scholar] [CrossRef]
- Sun, X.; Fang, W.; Gao, X.; An, H.; Liu, S.; Wu, T. Complex causalities between the carbon market and the stock markets for energy intensive industries in China. Int. Rev. Econ. Financ. 2022, 78, 404–417. [Google Scholar] [CrossRef]
- Lei, X.; Yu, H.; Yu, B.; Shao, Z.; Jian, L. Bridging electricity market and carbon emission market through electric vehicles: Optimal bidding strategy for distribution system operators to explore economic feasibility in China’s low-carbon transitions. Sustain. Cities Soc. 2023, 94, 104557. [Google Scholar] [CrossRef]
- Electricity and Carbon Market Annual Report. 2021. Available online: https://news.bjx.com.cn/html/20220418/1218397.shtml (accessed on 2 February 2024).
- National Voluntary Greenhouse Gas Emission Reduction Trading Market Launched. 2024. Available online: http://www.jjckb.cn/2024-01/23/c_1310761594.htm (accessed on 2 February 2024).
- Lei, X.; Yu, H.; Shao, Z.; Jian, L. Optimal bidding and coordinating strategy for maximal marginal revenue due to V2G operation: Distribution system operator as a key player in China’s uncertain electricity markets. Energy 2023, 283, 128354. [Google Scholar] [CrossRef]
- Zahoor, A.; Yu, Y.; Zhang, H.; Nihed, B.; Afrane, S.; Peng, S.; Sápi, A.; Lin, C.J.; Mao, G. Can the new energy vehicles (NEVs) and power battery industry help China to meet the carbon neutrality goal before 2060? J. Environ. Manag. 2023, 336, 117663. [Google Scholar] [CrossRef] [PubMed]
- Challa, R.; Kamath, D.; Anctil, A. Well-to-wheel greenhouse gas emissions of electric versus combustion vehicles from 2018 to 2030 in the US. J. Environ. Manag. 2022, 308, 114592. [Google Scholar] [CrossRef]
- Tiwari, S.; Daryanto, Y.; Wee, H.M. Sustainable inventory management with deteriorating and imperfect quality items considering carbon emission. J. Clean. Prod. 2018, 192, 281–292. [Google Scholar] [CrossRef]
- Ghosh, A. Possibilities and challenges for the inclusion of the electric vehicle (EV) to reduce the carbon footprint in the transport sector: A review. Energies 2020, 13, 2602. [Google Scholar] [CrossRef]
- Daramola, A.S.; Ahmadi, S.E.; Marzband, M.; Ikpehai, A. A cost-effective and ecological stochastic optimization for integration of distributed energy resources in energy networks considering vehicle-to-grid and combined heat and power technologies. J. Energy Storage 2023, 57, 106203. [Google Scholar] [CrossRef]
- Feng, K.; Liu, Y.; Dong, Z.; Huang, R.; Liu, C. Day-Ahead Scheduling for EV-Based Virtual Energy Routers in Radial Microgrids. In Proceedings of the IECON 2023-49th Annual Conference of the IEEE Industrial Electronics Society, Singapore, 16–19 October 2023; pp. 1–5. [Google Scholar]
- Shang, Y.; Yu, H.; Niu, S.; Shao, Z.; Jian, L. Cyber-physical co-modeling and optimal energy dispatching within internet of smart charging points for vehicle-to-grid operation. Appl. Energy 2021, 303, 117595. [Google Scholar] [CrossRef]
- Yao, X.; Fan, Y.; Zhao, F.; Ma, S.-C. Economic and climate benefits of vehicle-to-grid for low-carbon transitions of power systems: A case study of China’s 2030 renewable energy target. J. Clean. Prod. 2022, 330, 129833. [Google Scholar] [CrossRef]
- Wang, J.; Wu, Z.; Du, E.; Zhou, M.; Li, G.; Zhang, Y.; Yu, L. Constructing a V2G-enabled regional energy internet for cost-efficient carbon trading. CSEE J. Power Energy Syst. 2020, 6, 31–40. [Google Scholar]
- Lei, X.; Shang, Y.; Shao, Z.; Jia, Y.; Jian, L. Grid integration of electric vehicles for optimal marginal revenue of distribution system operator in spot market. Energy Rep. 2022, 8, 1061–1068. [Google Scholar] [CrossRef]
- Yang, S.-X.; Wang, X.-F.; Ning, W.-Q.; Jia, X.-f. An optimization model for charging and discharging battery-exchange buses: Consider carbon emission quota and peak-shaving auxiliary service market. Sustain. Cities Soc. 2021, 68, 102780. [Google Scholar] [CrossRef]
- Wang, C.; Lu, Z.; Qiao, Y. A consideration of the wind power benefits in day-ahead scheduling of wind-coal intensive power systems. IEEE Trans. Power Syst. 2012, 28, 236–245. [Google Scholar] [CrossRef]
- Weisser, D. A guide to life-cycle greenhouse gas (GHG) emissions from electric supply technologies. Energy 2007, 32, 1543–1559. [Google Scholar] [CrossRef]
- Li, B.; Song, Y.; Hu, Z. Carbon flow tracing method for assessment of demand side carbon emissions obligation. IEEE Trans. Sustain. Energy 2013, 4, 1100–1107. [Google Scholar] [CrossRef]
- Kang, C.; Zhou, T.; Chen, Q.; Wang, J.; Sun, Y.; Xia, Q.; Yan, H. Carbon emission flow from generation to demand: A network-based model. IEEE Trans. Smart Grid 2015, 6, 2386–2394. [Google Scholar] [CrossRef]
- Cheng, Y.; Zhang, N.; Zhang, B.; Kang, C.; Xi, W.; Feng, M. Low-carbon operation of multiple energy systems based on energy-carbon integrated prices. IEEE Trans. Smart Grid 2019, 11, 1307–1318. [Google Scholar] [CrossRef]
- Yang, C.; Liang, G.; Liu, J.; Liu, G.; Yang, H.; Zhao, J.; Dong, Z. A non-intrusive carbon emission accounting method for industrial corporations from the perspective of modern power systems. Appl. Energy 2023, 350, 121712. [Google Scholar] [CrossRef]
- Li, J.; He, X.; Li, W.; Zhang, M.; Wu, J. Low-carbon optimal learning scheduling of the power system based on carbon capture system and carbon emission flow theory. Electr. Power Syst. Res. 2023, 218, 109215. [Google Scholar] [CrossRef]
- Li, Z.; Lei, X.; Shang, Y.; Jia, Y.; Jian, L. A genuine V2V market mechanism aiming for maximum revenue of each EV owner based on non-cooperative game model. J. Clean. Prod. 2023, 414, 137586. [Google Scholar] [CrossRef]
- Cong, H.; Wang, X.; Jiang, C. Robust coalitional game theoretic optimisation for cooperative energy hubs with correlated wind power. IET Renew. Power Gener. 2019, 13, 2391–2399. [Google Scholar] [CrossRef]
- Geng, Q.; Hu, Y.; He, J.; Zhou, Y.; Zhao, W. Optimal operation of integrated community energy system based on Nash bargaining. J. Electr. Power Constr. 2020, 41, 114–125. [Google Scholar]
- Fan, S.; Li, Z.; Wang, J.; Piao, L.; Ai, Q. Cooperative economic scheduling for multiple energy hubs: A bargaining game theoretic perspective. IEEE Access 2018, 6, 27777–27789. [Google Scholar] [CrossRef]
- He, J.; Li, Y.; Li, H.; Tong, H.; Yuan, Z.; Yang, X.; Huang, W. Application of game theory in integrated energy system systems: A review. IEEE Access 2020, 8, 93380–93397. [Google Scholar] [CrossRef]
- Wang, H.; Zhang, C.; Li, K.; Ma, X. Game theory-based multi-agent capacity optimization for integrated energy systems with compressed air energy storage. Energy 2021, 221, 119777. [Google Scholar] [CrossRef]
- Fang, F.; Yu, S.; Liu, M. An improved Shapley value-based profit allocation method for CHP-VPP. Energy 2020, 213, 118805. [Google Scholar] [CrossRef]
- Yang, S.; Tan, Z.; Zhao, R.; De, G.; Li, H.; Ju, L. Operation optimization and income distribution model of park integrated energy system with power-to-gas technology and energy storage. J. Clean. Prod. 2020, 247, 119090. [Google Scholar] [CrossRef]
- Kang, C.; Zhou, T.; Chen, Q.; Xu, Q.; Xia, Q.; Ji, Z. Carbon emission flow in networks. Sci. Rep. 2012, 2, 479. [Google Scholar] [CrossRef] [PubMed]
- Zhang, K.; Guo, X.; Han, S.; Sun, L. Capacity Planning of Power-to-gas Devices Considering Reaction Heat Recovery and Cooperative Game. Power Syst. Technol. 2021, 45, 2801–2810. [Google Scholar]
- Rezaeimozafar, M.; Eskandari, M.; Savkin, A.V. A self-optimizing scheduling model for large-scale EV fleets in microgrids. IEEE Trans. Ind. Inform. 2021, 17, 8177–8188. [Google Scholar] [CrossRef]
- Solar Irradiance Data. 2023. Available online: https://solcast.com/ (accessed on 2 February 2024).
- Shang, Y.; Liu, M.; Shao, Z.; Jian, L. Internet of smart charging points with photovoltaic Integration: A high-efficiency scheme enabling optimal dispatching between electric vehicles and power grids. Appl. Energy 2020, 278, 115640. [Google Scholar] [CrossRef]
- Sampaio, P.G.V.; González, M.O.A. Photovoltaic solar energy: Conceptual framework. Renew. Sustain. Energy Rev. 2017, 74, 590–601. [Google Scholar] [CrossRef]
- Guangdong Power Exchange Center. Electricity Price Data for Guangdong. 2021. Available online: https://pm.gd.csg.cn/views/index.html (accessed on 2 February 2024).
- Tranberg, B.; Corradi, O.; Lajoie, B.; Gibon, T.; Staffell, I.; Andresen, G.B. Real-time carbon accounting method for the European electricity markets. Energy Strategy Rev. 2019, 26, 100367. [Google Scholar] [CrossRef]
- China’s Carbon Market to Slow in 2023 as Energy Security, Economy Take Priority. 2023. Available online: https://www.spglobal.com/commodityinsights/en/market-insights/latest-news/energy-transition/011223-chinas-carbon-market-to-slow-in-2023-as-energy-security-economy-take-priority (accessed on 2 February 2024).

Disclaimer/Publisher’s Note: The statements, opinions and data contained in all publications are solely those of the individual author(s) and contributor(s) and not of MDPI and/or the editor(s). MDPI and/or the editor(s) disclaim responsibility for any injury to people or property resulting from any ideas, methods, instructions or products referred to in the content. |
© 2024 by the authors. Licensee MDPI, Basel, Switzerland. This article is an open access article distributed under the terms and conditions of the Creative Commons Attribution (CC BY) license (https://creativecommons.org/licenses/by/4.0/).