Article

Enhancing Safety in IoT Systems: A Model-Based Assessment of a Smart Irrigation System Using Fault Tree Analysis

1
School of Computer Science, AI, and Electronics, University of Bradford, Bradford BD7 1DP, UK
2
Department of Computer Science and Engineering, Military Institute of Science and Technology, Dhaka 1216, Bangladesh
*
Author to whom correspondence should be addressed.
Electronics 2024, 13(6), 1156; https://doi.org/10.3390/electronics13061156
Submission received: 22 February 2024 / Revised: 16 March 2024 / Accepted: 19 March 2024 / Published: 21 March 2024
(This article belongs to the Collection Electronics for Agriculture)

Abstract

:
The agricultural industry has the potential to undergo a revolutionary transformation with the use of Internet of Things (IoT) technology. Crop monitoring can be improved, waste reduced, and efficiency increased. However, there are risks associated with system failures that can lead to significant losses and food insecurity. Therefore, a proactive approach is necessary to ensure the effective safety assessment of new IoT systems before deployment. It is crucial to identify potential causes of failure and their severity from the conceptual design phase of the IoT system within smart agricultural ecosystems. This will help prevent such risks and ensure the safety of the system. This study examines the failure behaviour of IoT-based Smart Irrigation Systems (SIS) to identify potential causes of failure. This study proposes a comprehensive Model-Based Safety Analysis (MBSA) framework to model the failure behaviour of SIS and generate analysable safety artefacts of the system using System Modelling Language (SysML). The MBSA approach provides meticulousness to the analysis, supports model reuse, and makes the development of a Fault Tree Analysis (FTA) model easier, thereby reducing the inherent limitations of informal system analysis. The FTA model identifies component failures and their propagation, providing a detailed understanding of how individual component failures can lead to the overall failure of the SIS. This study offers valuable insights into the interconnectedness of various component failures by evaluating the SIS failure behaviour through the FTA model. This study generates multiple minimal cut sets, which provide actionable insights into designing dependable IoT-based SIS. This analysis identifies potential weak points in the design and provides a foundation for safety risk mitigation strategies. This study emphasises the significance of a systematic and model-driven approach to improving the dependability of IoT systems in agriculture, ensuring sustainable and safe implementation.

1. Introduction

Agriculture plays a crucial role in providing sustenance and employment opportunities to millions of people around the world. As the global population continues to grow exponentially, there is an increasing demand for food production. Unfortunately, the amount of cultivable land is limited and is rapidly dwindling due to urbanisation and environmental degradation [1,2]. Therefore, there is a pressing need to improve crop yields to meet the growing demand for food. Modern farming techniques can optimise every aspect of the crop production process, from planting to harvesting. Precision agriculture, Solar Insecticidal Lamp Internet of Things (SIL-IoTs), and many other innovative ideas leverage technology to achieve this optimisation [3,4,5]. By prioritising sustainable and efficient farming practices, it is possible to ensure that agriculture remains a viable source of sustenance and employment for generations to come. Through efficient implementation of these smart techniques, farmers can increase their yield and improve the efficiency of their operations.
The escalating worldwide water crisis is a significant worry, given the rising population and the need for fresh water. To tackle this problem, embracing sustainable water usage practices is imperative, particularly in agriculture, where water is a crucial resource. A viable solution is the adoption of Smart Irrigation Systems (SIS), which can track pertinent factors and regulate physical devices like water pumps to minimise water wastage by irrigating only when required [6,7]. Furthermore, sustainable farming practices can enhance soil health, reduce greenhouse gas emissions, and promote biodiversity [3]. Such approaches can also improve the overall quality of the produce and increase the economic sustainability of farming operations.
The integration of IoT, edge computing, and AI has transformed the landscape of farming practices [8]. However, with these innovative approaches come new challenges, such as increased complexity, system safety, reliability, trustworthiness, and vulnerability [9,10]. To ensure the dependability of these systems, it is essential to understand their composition and inner workings and potential failures that may arise during operation. This proactive understanding of the system and its behaviour will help to mitigate risks from the design time and optimise the efficiency of such systems. In the case of large-scale smart farming, the failure of these systems can have devastating consequences on nature, people, agricultural production, and finances. Therefore, conducting a credible failure analysis of IoT-based technology during the conceptual design phase is crucial to ensure the development of safe and reliable IoT-based agricultural systems. While in this study we focus on the qualitative failure analysis of the IoT system, a recent overview of physical security and safety issues in IoT can be found in [11].
Failure analysis methods are indispensable in safety-critical domains, encompassing diverse sectors like aviation, automobiles, and industrial control systems [12]. Among these methods, Fault Tree Analysis (FTA) stands out as a widely acknowledged and highly effective technique for analysing failures in safety-critical systems [13]. By employing graphical models, FTA provides a systematic representation of the logical connections between failures and their root causes, offering valuable insights into potential vulnerabilities and areas for improvement in complex systems.
The structured and methodical FTA method is an effective approach for identifying potential system failures, assessing risks, and developing strategies to prevent them during system design [13,14,15]. This approach is particularly useful in examining failures across a range of systems, including smart agriculture [13,14,15,16,17,18]. By utilising a visual and deductive approach, the FTA method identifies potential safety risks, predictive failure of the system, critical failure scenarios, and the shortest path to system failure [17,18]. The FTA process involves understanding system functions and components, identifying possible failure modes, determining the root cause of failures, and proposing corrective actions to address them [19]. The FTA method remains a well-established approach for assessing the safety and reliability of agricultural systems, contributing to improved performance and enhanced productivity. Therefore, incorporating the FTA method into the iterative design process of smart agricultural systems ensures that safety considerations evolve with the system design, promoting ongoing improvement and cultivating a proactive risk management culture within the agricultural industry.
Despite the wide adoption of the FTA model as a safety analysis method, the reliance on FT has some inherent limitations, such as being a manual process, not supporting reusability, being prone to human errors, and becoming cumbersome when the failure behaviour becomes complicated [13,20]. Model-driven approaches are being adopted from the functional system design domain to the safety analysis environment to overcome these challenges and keep up with the latest advancements in the overall system design approach. In the model-driven environment, the Model-Based Systems Engineering (MBSE) approach is rich with various system models and diagrams, which can effectively model system architecture, and through their extension, model failure behaviour that can be viable for Model-Based Safety Analysis (MBSA) [21].
Recent studies in the safety analysis domain are now proposing the utilisation of MBSA approaches for the generation of the FTA process to simplify design trade-offs, increase IoT design flexibility, and reduce cost and time-to-market constraints [22,23,24,25,26,27,28,29,30,31]. This study utilises the use of the MBSA paradigm to create an FTA model of an IoT-based SIS in a SysML environment for a viable safety assessment. It is worth noting that although IoT-based agricultural systems are gaining more trust from the public, the MBSA approach of safety analysis is not being used as much in the intelligent agricultural domain as it is in other safety-critical domains. However, the failure of monitoring systems in agriculture can have a significant impact on food security and result in enormous financial loss.
This article presents a novel MBSA approach for safety analysis of an IoT-based SIS. The framework leverages IoT-based SIS and focuses on the conceptual design phase to identify potential failure behaviours of the system. It generates detailed failure models for the system and its components, formalising them through MBSA-generated FTA diagrams. The method’s granular flexibility enables a better understanding of how individual component failures can cause system-wide safety problems, thereby improving system dependability and failure risk mitigation. The framework’s efficacy is demonstrated through a case study of IoT-based SIS. This approach represents a significant step towards proactive and comprehensive failure analysis in innovative agricultural ecosystems, aligning technological advancements with the goal of system analysis approaches. The article is divided into sections to provide a comprehensive overview of the IoT’s role in smart agriculture. It begins with an introduction and then moves on to Section 2, which provides a comprehensive overview of IoT’s role in smart agriculture. This is followed by a review of manual safety analysis methods in Section 3, and MBSA methods are covered in Section 4. Furthermore, Section 5 then describes the proposed framework in detail and demonstrates its application in a case study, which can be found in Section 6. This article concludes with Section 7, summarising the key points discussed and suggesting potential areas for future research.

2. Applications of IoT in Smart Agriculture

This section provides a detailed overview of how IoT technology is leveraged to promote sustainable and intelligent farming practices. From monitoring soil moisture levels to tracking livestock, the IoT has revolutionised how agriculture is managed and optimised for greater productivity and efficiency.

2.1. Smart Irrigation System

Freshwater scarcity is a critical global challenge that we must address, as only 2.5 % of Earth’s water supply is freshwater, with a mere 31.3 % available for human use, with the rest being in the form of glaciers or ice caps [32,33]. Agriculture consumes a vast amount of this resource, and as the demand for food increases, it is essential to manage water resources efficiently [34].
IoT technology offers a promising solution. By combining sensor networks, smart tech, and the Internet, we can measure critical parameters like soil moisture and temperature to enable real-time data analysis for accurate irrigation control [35]. With the integration of microcontrollers and wireless communication, IoT tech can facilitate the development of automated irrigation systems that conserve up to 90 % of water compared with traditional methods [36]. Several studies have proposed the use of an integrated sensor/actuator node network to measure various physical parameters such as soil moisture, air temperature, humidity, water level, water flow, and luminous intensity [37,38]. Leveraging smart Internet-based technology can help optimise water usage and improve crop yield, contributing to long-term resource sustainability. By incorporating IoT tech in agriculture, a comprehensive solution to freshwater scarcity can be provided, leading to better water conservation and benefiting farmers, consumers, and the environment.

2.2. Pest Control and Plant Disease Monitoring

The agricultural industry has experienced significant changes due to the IoT, particularly in pest control and plant disease monitoring [39]. Farmers can now utilise advanced deep learning methods to identify pests, diseases, weeds, and yield and assess soil suitability for different crops. With the help of image processing, machine learning, and Logistic Decision Regression (LDR), researchers have achieved impressive accuracy rates in detecting pests and plant diseases, leading to better crop management practices and improved yields [39,40,41].
Smart agriculture has been introduced which utilises an IoT architecture that employs deep learning techniques to detect insects, diseases, weeds, and soil nutrients and predict crop yield with greater accuracy. This has revolutionised the industry, as sensor data have improved the accuracy and reliability of disease detection through innovative data analysis methods. Recently, there has been a surge of interest in using convolutional neural networks (CNNs) for image analysis, which have the potential to further enhance the accuracy and speed of disease detection. CNNs effectively identify plant diseases, pests, and nutrient deficiencies and predict crop yield [42,43]. Integrating IoT with advanced deep learning methods has transformed the agricultural industry, paving the way for innovative solutions to old problems. More farmers are expected to embrace this technology in the coming years, leading to increased productivity and better crop management practices.

2.3. Use of Drones and Harvesting Robots

The agricultural industry has significantly transformed since the introduction of drones and IoT devices. These advanced technologies have revolutionised traditional cultivation methods by reducing physical strain and streamlining the process [44]. The introduction of intelligent agricultural systems has paved the way for implementing innovative methods to monitor soil conditions, spray pesticides and fertilisers, and transmit sensor data for analysis [45].
Drones have emerged as one of the most promising tools in agriculture. With high-resolution cameras, they can capture images of crops from an aerial view, providing farmers with an accurate measurement of crop damage caused by pests or weather, especially in challenging terrain [46]. They can also monitor crop growth and identify areas that require fertilisation or irrigation. In addition to drones, agricultural robots integrated with IoT devices and sensors are used for various tasks such as seedling, harvesting, weed detection, and pest control. These robots are designed to operate autonomously and can be programmed to perform specific tasks with precision and accuracy. Moreover, they can collect and transmit data in real time, enabling farmers to make informed decisions and take corrective actions quickly. Developed nations are adopting these technologies to enhance agricultural efficiency while minimising costs and time [47,48]. Implementing IoT devices and drones in agriculture can potentially increase crop yields, reduce labour costs, and minimise the use of harmful chemicals [49]. Therefore, integrating these advanced technologies in the agricultural industry is a significant step towards creating a sustainable future for the world.

2.4. Vertical Farming and Smart Greenhouse

Vertical Farming (VF) has emerged as a modern agricultural technique wherein crops are grown on vertically inclined surfaces, predominantly in high-rise buildings. This innovative practice has gained immense popularity in recent years, owing to its ability to offer several advantages beyond food security. As per Kalantari et al. [50], VF has the potential to revamp urban design and architecture, augment food safety and security, and reduce environmental pollution.
With the rapid advancement of digital technologies, IoT devices, artificial intelligence, and other cutting-edge technologies are increasingly being incorporated into VF. According to Siregar et al. [51], IoT devices and AI are being employed to monitor and control VF environments, and researchers such as those found in [52,53,54] have proposed methodologies that integrate sensors and IoT techniques for smart VF. Additionally, Kaur et al. [55,56] demonstrated how hydroponic VF could be carried out using IoT-based sensors with minimal water and soil usage. By harnessing these innovative ideas, VF has the potential to enhance crop yields while minimising resource usage, making it an attractive option for sustainable agriculture.
Apart from IoT and machine learning, studies also explore using artificial intelligence to build smart greenhouses. For instance, Maraveas and Chrysanthos [57] conducted a detailed review of AI’s use in building smart greenhouses and explored methods to optimise their usability. Also, Gracia et al. [58] reviewed the usage of Artificial Neural Networks (ANNs) in greenhouse technology and proposed models to integrate IoT devices and ML for innovative agriculture development. Therefore, integrating cutting-edge technologies like IoT and AI in VF has immense potential to transform crop growth, enhance food security, and reduce environmental impact.

2.5. Tracking and Monitoring Livestock

Precision Livestock Farming (PLF) is a modern approach that utilises IoT technologies to provide farmers with advanced tools for monitoring cattle behaviour, diagnosing diseases, managing their welfare, and improving overall management [59,60]. In recent years, significant progress has been made in developing web and mobile applications that use sensors and IoT devices to monitor livestock behaviour and environmental factors. Researchers have identified key technologies that have proven effective in PLF, including Radio Frequency Identification (RFID), Global Positioning Satellite (GPS), Digital Twin technology, and AI [60,61]. These technologies have improved data collection and analysis efficiency, enabling farmers to make informed decisions about their livestock.
Furthermore, researchers have proposed efficient methods for monitoring cattle behaviour and environmental factors using indoor Ultra-WideBand (UWB) location data, accelerometer data, and automatic monitoring systems based on sensors. These methods allow farmers to monitor their cattle more accurately and in real time, improving the overall health and well-being of the animals. Additionally, smart geofencing methods that rely on IoT and General Packet Radio Service (GPRS) have been suggested for remote monitoring and controlling cattle, making it easier for farmers to monitor their livestock from a distance [61]. Other methods for herd location monitoring using Bluetooth and GPS have also been proposed, making it easier for farmers to track the location of their animals and ensure their safety and security. IoT technologies in PLF have transformed the livestock industry, allowing farmers to leverage advanced tools and technologies to manage their livestock more efficiently and effectively [62]. With continued advancements in this field, we can expect to see even more innovative solutions that will further improve the quality of life for livestock and enhance sustainability.

2.6. Effects of Sensor-Based IoT Device Failures in Smart Agriculture

As the demand for sustainable and efficient agricultural production grows, farmers are increasingly adopting smart farming practices that rely on IoT technology. However, these practices come with risks. If the sensor-based IoT devices used in agriculture fail, it can have severe consequences for the entire system. The impact can range from environmental pollution to decreased crop yields or even famine. In the long run, these hazards can also damage soil health and fertility, crop disease control, supply chain management, and farmers’ trust in IoT technology. These risks can lead to economic collapse in rural areas, affecting farmers and related industries. Therefore, it is crucial to develop strategies to mitigate the risks associated with sensor-based IoT device failure in agriculture, particularly given that harsh weather conditions can make these devices prone to failure.

3. Overview of Manual Failure Analysis Methods

Failure analysis is a systematic approach to investigate and comprehend the underlying causes of failures in various systems, products, or processes [26]. The primary objective of failure analysis is to prevent similar failures from happening in the future [12]. Failure analysis is extensively employed to analyse potential safety-related issues in domains where safety is critical. It is crucial to perform appropriate failure analysis on the conceptual design of IoT-based agricultural systems to ensure the design is safe and dependable [63]. Safety and reliability analysis are the two most significant dependability attributes, and they are used extensively in many safety-critical sectors. Below is a discussion of some of the well-known failure analysis methods.

3.1. Failure Mode and Effects Analysis

Failure Mode and Effects Analysis (FMEA) is a proactive approach in safety-critical domains. It identifies and evaluates the potential failure modes of a system, assessing their impact on safety, reliability, and performance [14,64]. FMEAs are often attributed to the US military, who first utilised this technique in the late 1940s to mitigate potential failures and minimise sources of variation during munitions production [20,65]. Notably, FMEA is also used for failure analysis of smart agriculture [66]. Using FMEA, critical components and functions are identified, and failure modes are evaluated based on their severity, probability of occurrence, and detectability [67,68]. The Risk Priority Number (RPN) is calculated for each failure mode, and necessary mitigation strategies are adopted. High-RPN failure modes are prioritised through improved design, redundancy, maintenance, or additional safety measures [67].

3.2. Bayesian Network

A Bayesian Network (BN) is a sophisticated probabilistic model that is extensively utilised in various engineering domains, particularly in testing and verifying the safety properties of IoT systems. Employing a BN model aids in recognising and reducing risks by representing interdependencies and uncertainties [65]. The safety problem is defined, relevant components are identified, and probabilistic dependencies are established to achieve the utilisation of the BN model in the safety analysis. Numerical values are then assigned to calculate the probability of specific events occurring. Each variable is represented as a node, and the directed edges between nodes indicate the probabilistic dependencies between the variables [65,69,70]. The Conditional Probability Tables (CPTs) specify the probabilistic relationships for each node based on the values of its parent nodes. The Bayesian Network supports both qualitative and quantitative analysis. Qualitative analysis involves graphical representation, while quantitative analysis involves assigning numerical values to the parameters in the BN, such as conditional probabilities in CPTs, to calculate the probability of a specific event occurring or estimate the likelihood of different events [18,71].

3.3. Markov Analysis Model
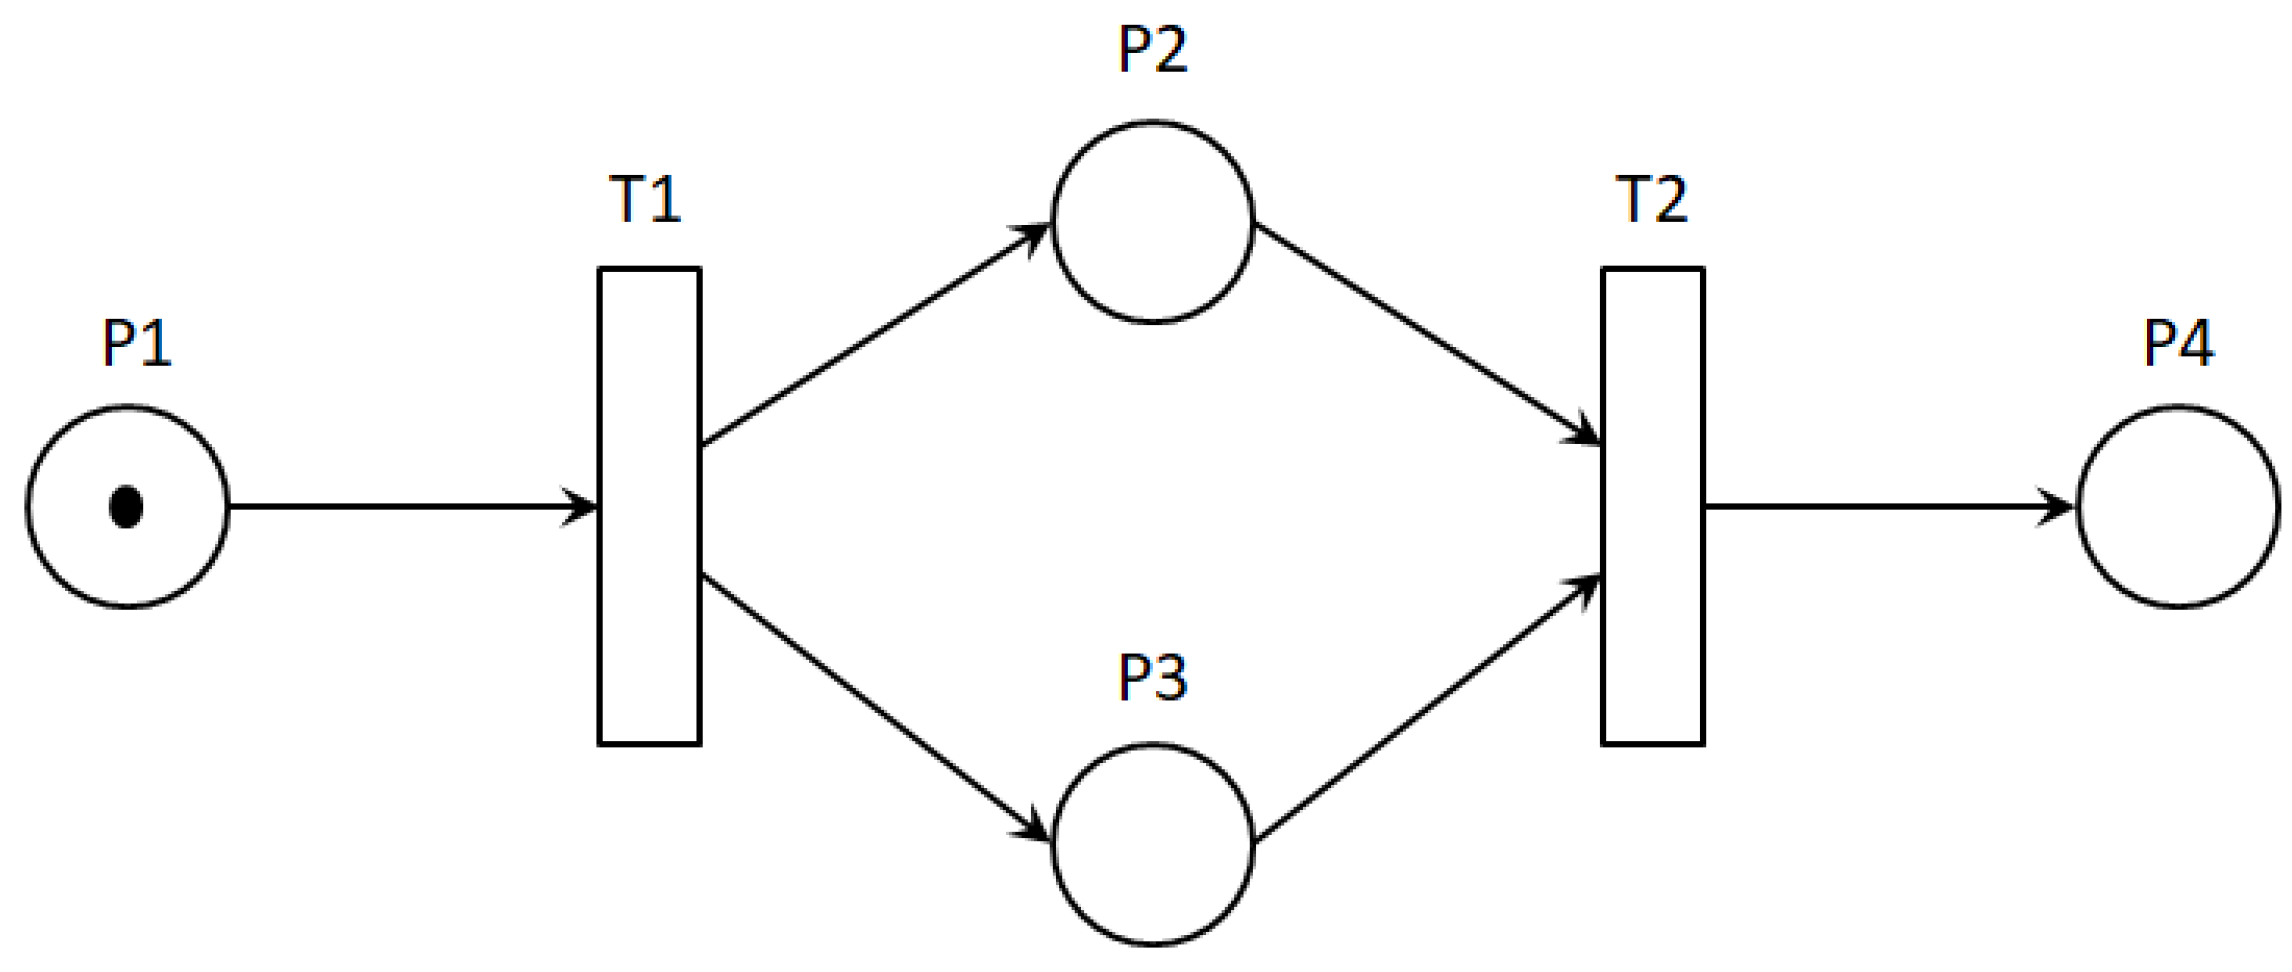
The Markov model is a mathematical framework used to study systems that change over time through a sequence of discrete states. It is beneficial for analysing systems with memoryless properties [72]. These are systems where the future state depends only on the current state and not on the sequence of states that came before it. The model assumes that a system exists in one of several discrete states at any given time and can move to another state with specific probabilities [73]. A state transition matrix that captures these transition probabilities defines the system’s behaviour. Markov models are often used to analyse the behaviour of systems based on the exponential distribution of failure. The steady-state probabilities of the model can be calculated by solving the system of linear equations defined by the model [73].

3.4. Petri Net

A Petri Net is an essential graphical and mathematical modelling approach for analysing and describing intricate, concurrent, and distributed systems. It is a highly effective method for modelling and understanding systems in which multiple entities interact asynchronously and dynamically [65]. Typically, PNs are denoted as four-tuple N = (P, T, A, K), a bipartite graph that we discuss in detail below:
  • P = { p 1 , p 2 , p 3 , , p n } is a finite set of places: Places represent states or conditions within the system. They are typically depicted as circles or ovals in a PN diagram.
  • T = { t 1 , t 2 , t 3 , , t n } is a finite set of transitions: Transitions represent events or actions that can occur within the system. These are typically depicted as rectangles in the diagram. Transitions cause changes in the system’s state by consuming tokens from input places and producing tokens in output places.
  • A ( P × T ) ( T × P ) is a finite set of arcs: Arcs (also known as edges) connect from places to transitions or transitions to places, indicating the flow of tokens between them. There are two types of arcs: Input Arcs and Output Arcs.
  • K = { 1 , 2 , 3 , } is a finite set of tokens: Tokens are small symbols or markers. Each place can hold a certain number of tokens, representing the presence or availability of resources, objects, or entities. They can move between places through transitions, following the defined flow of arcs.
The PN model follows basic rules for activating transitions based on the availability of input tokens. The behaviour of PNs is determined by the movement of tokens and interaction between transitions. Coloured, timed, and stochastic PNs are variations of PNs that address specific aspects of system modelling and analysis [65,74,75]. An example of a simple PN is shown in Figure 1.

3.5. Fault Tree Analysis

The FTA method is a systematic graphical methodology widely used in engineering, safety, and risk assessment to thoroughly analyse the causes of failures within complex systems. It originated in 1962 at Bell Phone Laboratories and was initially crafted to evaluate the failure behaviours of the launch control system of the LGM-30 Minuteman intercontinental ballistic missile (ICBM) as part of the United States’ strategic deterrent forces [20,76]. Over the years, FTA has evolved into a pivotal tool for failure analysis, finding applications in diverse domains, including industrial safety-critical systems, and gaining momentum in IoT-based applications.
FTA’s versatility is evident across various applications, spanning safety analysis in smart homes [77,78] to generic IoT systems [79,80], electric vehicles [81], industrial fire detection and prevention systems [82], industrial robots [17], self-healing industrial systems [83], and cyberphysical systems [15]. Additionally, FTA has successfully analysed the failure behaviour of smart agriculture systems [76,84], showcasing its adaptability across diverse domains.
The FTA technique systematically identifies factors contributing to system failures and assesses the probability of such failures, solidifying its position as one of the most prominent techniques for dependability analysis. Recognising its significance, the International Electrotechnical Commission (IEC) has endorsed FTA as a leading method for failure analysis [13,85,86].
In Figure 2, the FTA model employs a logical and graphical diagram to pinpoint critical components for improvement, preventing future failures. The diagram outlines the hierarchy of events and utilises logic gates such as AND, OR, and Voting gates to model different systems’ behaviour. In an AND gate, all child events must occur for the parent event, whereas in an OR gate, any single child event can activate the parent event. The Voting gate requires a specific number of events (e.g., 2 out of 3), as the diagram indicates. The green triangle symbol facilitates the breakdown of the tree into smaller components for more accessible representation.
The fault tree is constructed using a top-down approach, starting with a top event causing the overall system failure. This top event is then decomposed into intermediate events using logic gates, representing the immediate causes of the top event. The recursive breakdown continues until the analysis reaches the component level failure or root causes that cannot be further decomposed. The ultimate goal is to assess how the top event will occur in the tree, representing the system failure.
The analysis can be conducted qualitatively and quantitatively. Qualitative analysis involves obtaining Minimal Cut Sets (MCSs), the smallest combinations of root causes or basic events (BEs) leading to system failure. Identifying MCSs helps understand critical combinations of component failures or events. On the other hand, quantitative analysis uses failure rates of components or probabilities of root causes to predict system failure. Considering the type of logic gates used between events, the system failure probability can be calculated [12,20].
While FTA possesses strengths shown in Table 1, such as providing a structured approach for failure analysis, there are also acknowledged weaknesses [12,20]. These include the potential for human error in tree creation, a cumbersome process, lack of support for reusability, and inherent limitations of manual-based system analysis methods.

4. Model-Based Approach in Safety Analysis of IoT

Several approaches in MBSA have been developed to model both functional and nonfunctional properties of modern and embedded systems, including those in the IoT environment. These modern and formal methods utilise modelling languages that draw from general engineering models or domain-specific models and profiles. In contrast to manual safety analysis techniques used with informal models discussed in Section 3, MBSA approaches have been developed to automate and semiautomate the process. These computer-based approaches facilitate safety analysis and support various aspects of system design. MBSA approaches can generate compositional analysable safety artefacts based on systematic modelling of systems’ static, dynamic, and failure behavioural patterns using existing modelling languages and their extensibility mechanisms. The MBSA approaches are model-driven and can manage system complexity while performing coherent, formalised, structured, and rigorous system safety analysis. Safety analysis approaches have been developed using various modelling languages, including Unified Modelling Language (UML), SysML, and Architecture Analysis and Design Language (AADL) as well as Hierarchically Performed Hazard Origin and Propagation Studies (HiP-HOPS) [20,31,87,88]. Additionally, these models are unambiguous, based on standardisation and various automation support tools, and possess a high level of abstraction to model the heterogeneity of IoT-based systems. The proposed approach used in this study is based on the UML/SysML modelling approach.

4.1. The Unified Modelling Language

UML is a powerful modelling language that enables one to systematically visualise a system using modelling diagrams and conduct a formal analysis. It is widely used for systems and software specifications and can be customised to suit specific domains. With numerous diagrams and extensions, UML can effectively describe a system’s components, hierarchy, and states. UML diagrams are grouped into two categories: behaviour and structure [30]. Behaviour diagrams capture the system’s dynamic behaviour, while structure diagrams describe the system’s static structure. Some popular UML diagrams include activity, state machine, sequencing, timing, use case, class, and component diagrams. UML is a reliable tool for high-quality modelling of safety-critical systems and has been adopted as a standard by the Object Management Group [29].

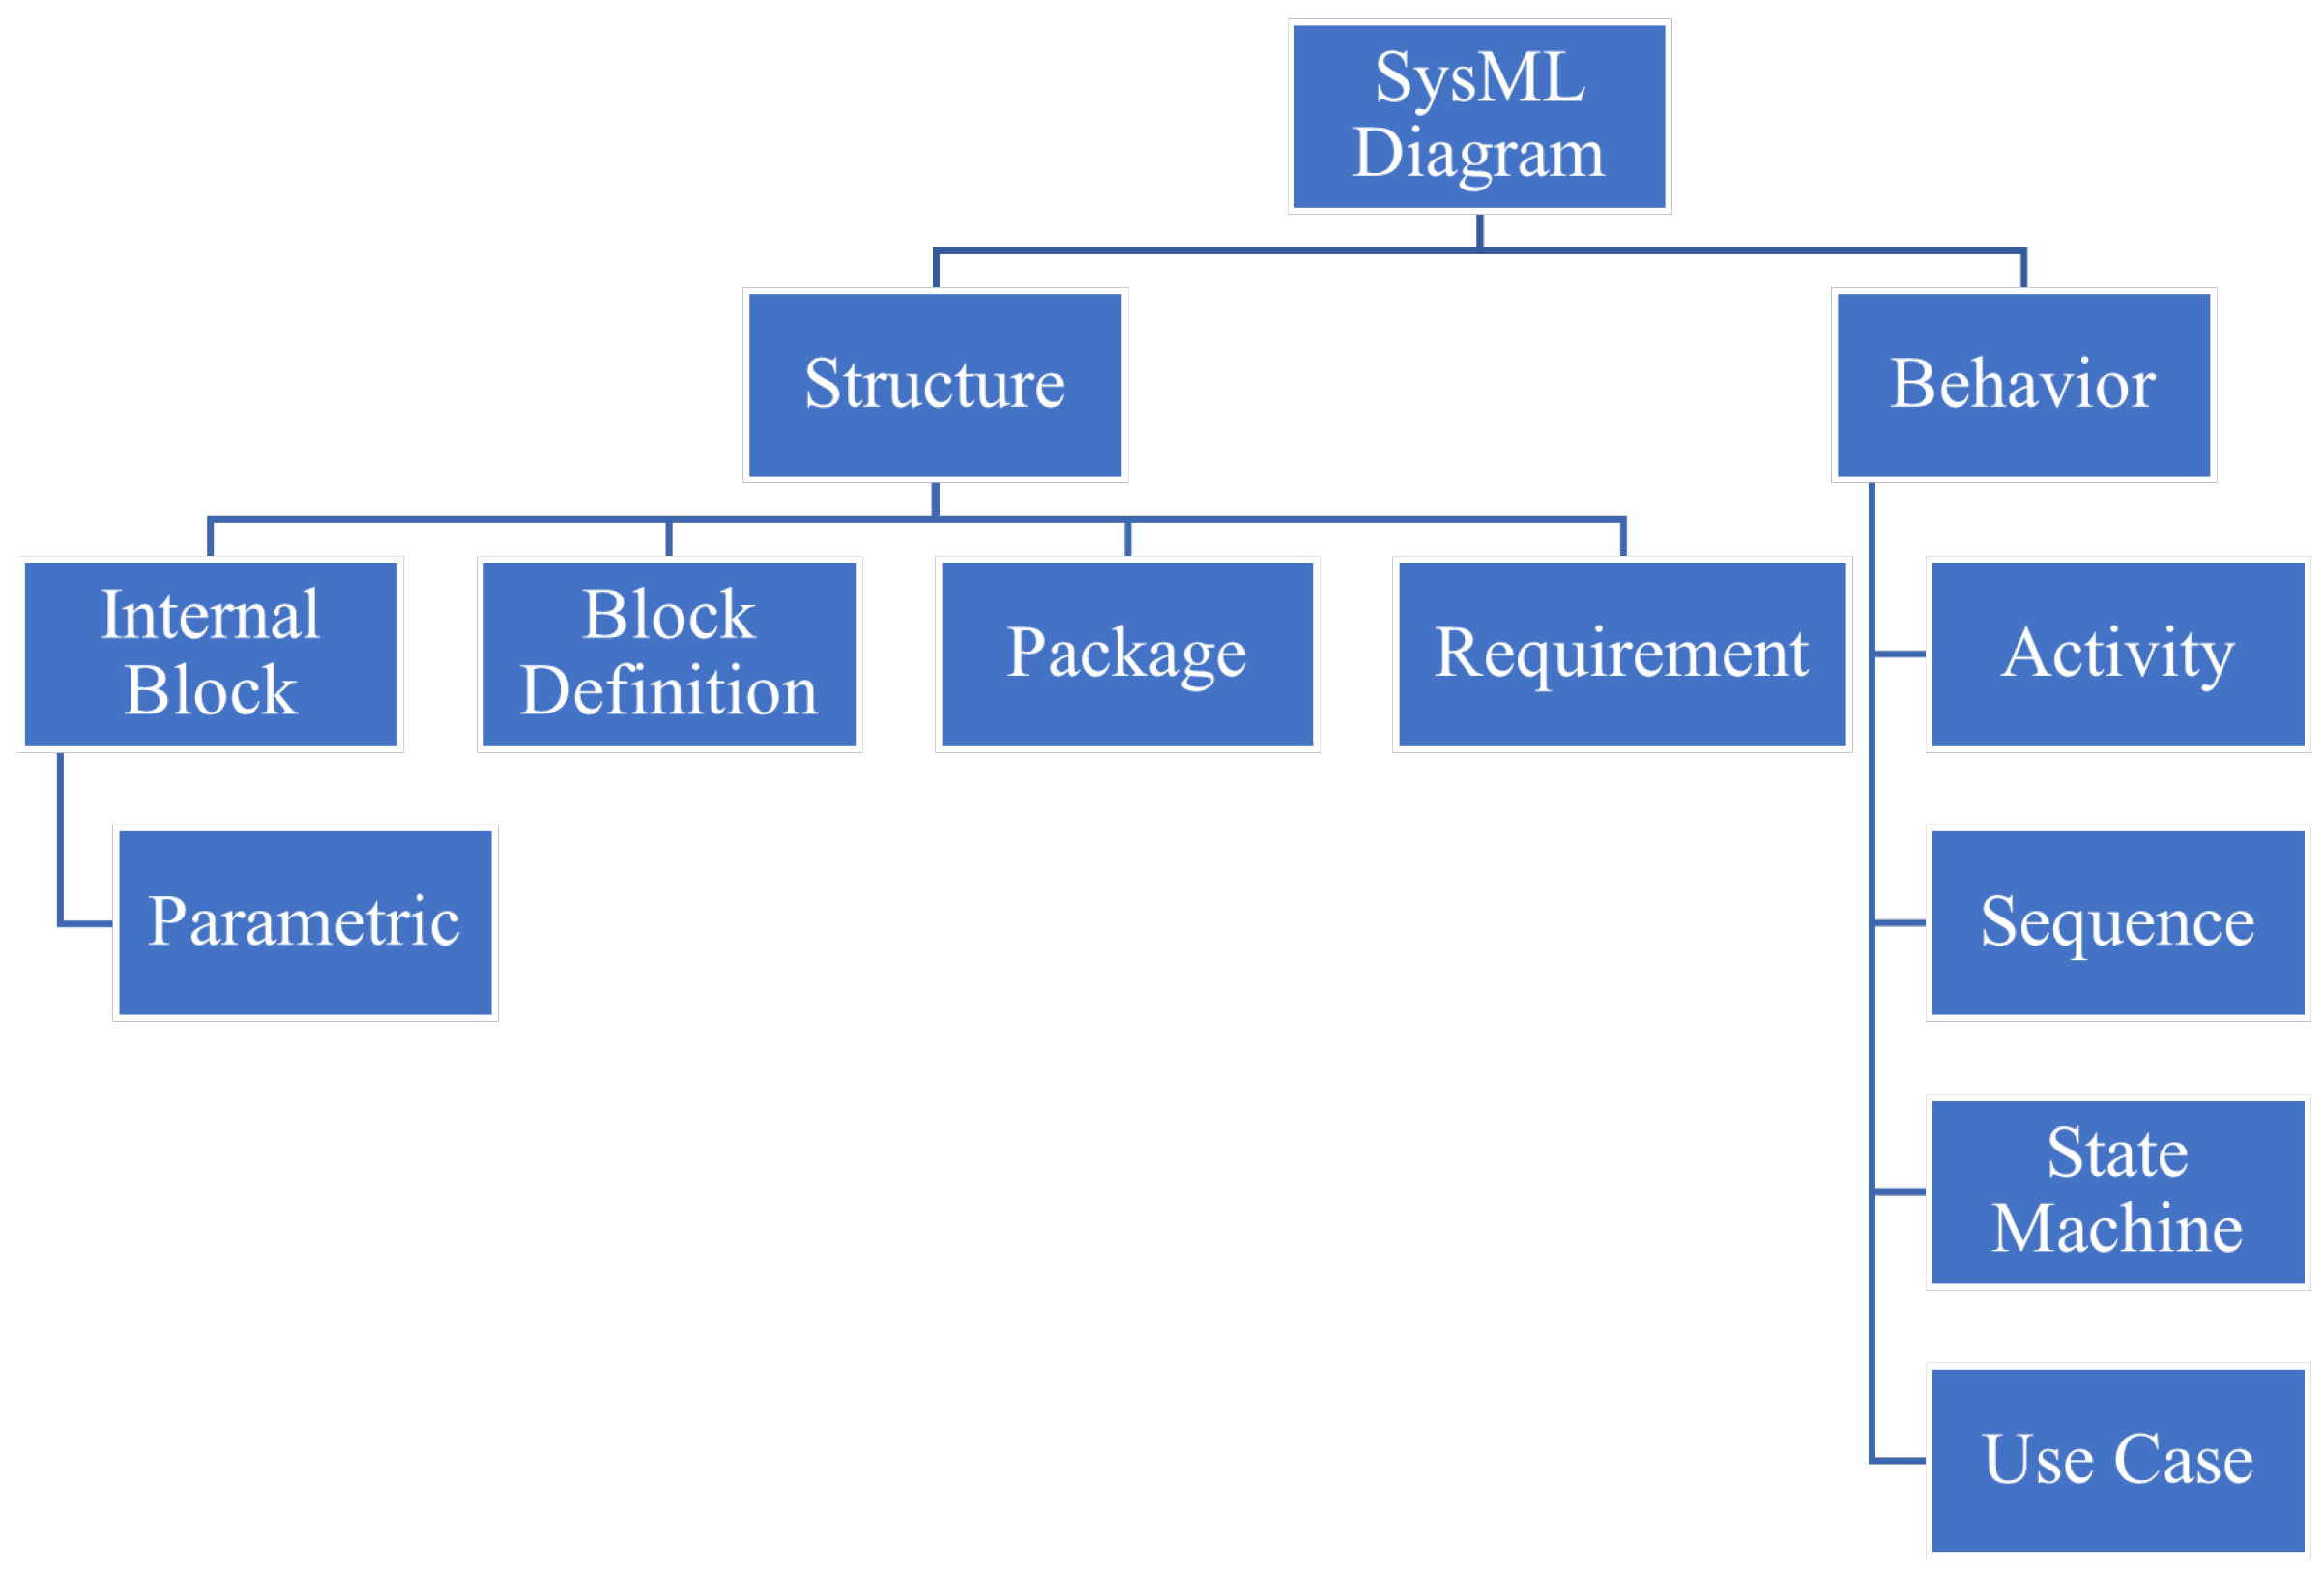
4.2. System Modelling Language

The SysML is a general-purpose graphical modelling language that was developed in 2003 on top of the UML specifically for system development, such as software, hardware interactions, and dependencies, among others [22,28]. The SysML is similar to UML; however, some diagrams in UML were removed, and others more specific to system engineering design were added. Two groups of SysML diagrams can be used to describe a system: behaviour and structure. The behaviour diagram showcases how the system operates, while the structure diagram highlights the system’s static structure. Popular SysML diagrams that are widely used include the block definition diagram (BDD), internal block diagram (IBD), parametric, and state machine diagram (SMD) [27]. A Broad List of SysML diagrams that can be used for various modelling of system features is shown in Figure 3, and a high-level description of the diagrams is provided in Table 2.
The uniqueness of both UML and SysML is their extension mechanisms, which are known as profiles. A UML/SysML profile defines an extension of the language in terms of stereotypes (concepts in the target domain) and tagged values (the attributes of the stereotypes). For instance, the UML profile for Modelling and Analysis of Real-Time and Embedded Systems (MARTE) provides an analysis framework called the Quantitative Analysis Model (GQAM), enabling performance specification in UML models.
The Dependability Analysis Modelling (DAM) is a domain-specific profile of SysML designed to address safety concerns such as safety metrics, transitions from safe to failure states, and triggers leading to those transitions. In a safety analysis based on MBSA approaches, the static structure of the system and its components are annotated with failure behaviours, and the resulting models are transformed to develop system-level failure analysis models [26]. Studies have been conducted using SysML/UML to develop FT and FMEA [28,89,90,91,92]. Various methodologies have been used for FTA generation, such as transforming the MBSA design developed in SysML using IBD and SMD to FTA artefacts based on a failure mapping pattern [25]. Other approaches have used programming languages to parse the XML model file generated from the source model and automate a formal model. Notably, the XML file of the source model was parsed in the Python language to safety analysis artefacts [93], ATLAS Transformation Language (ATL) [24], and Eclipse Modelling Framework [23]. The MBSA offers several advantages, including a composition that enables an easy understanding of the effects of altering one or more components or subsystems on the entire system’s safety assurance. Additionally, it supports reusability, reduces human errors, and facilitates iterative system design.

5. Proposed Safety Analysis Approach

The approach proposed in Figure 4 uses the MBSE method, which combines the benefits of MBSA and safety analysis models. This technique preserves the advantages of MBSA over other static FTA methods while establishing the link between the IoT system architecture and the analysis models.
The MBSA framework described in Figure 4 for modelling of an IoT-based SIS involves a systematic process, utilising SysML diagrams and software tools compatible with SysML for precise modelling of the IoT system. The open-source SysML-compatible tool Papyrus was employed to initiate the analysis, seamlessly integrating with other Eclipse-based tools. This tool creates models that accurately represent the system’s static, functional aspects, and failure behaviours.
The first step in our proposed approach involves creating diagrams that capture the static architecture, functional behaviour, and potential failure scenarios of the system in the SysML environment using Papyrus–Eclipse-based open-source software (Website for Papyrus tool: https://eclipse.dev/papyrus/). This includes creating SysML diagrams such as BDD, IBD, and SMD to build a comprehensive model of the IoT system’s architecture, functional structure, and failure characteristics. The created diagrams are then combined using a specific methodology, which we define in the subsequent section, to create the FTA from the models.
Notably, the failure behaviours of each component are annotated using a DAM profile, transforming the source model into a formal analysable model for safety analyses. The DAM profile defines stereotypes, tagged values, and constraints, which are applied to the SysML SMD model to accurately articulate the system’s failure behaviour. Once the DAM profile is imported, aligned with the SMD diagram, and configured with DAM stereotypes, the Papyrus software tool facilitates a seamless transition, bridging static and functional modelling for fault tree generation. The fault tree logic is specified to generate the fault tree automatically, providing the necessary input for the tool.
To ensure a high level of consistency and accuracy in our methodology, we heavily depend on Papyrus’s robust support for SysML and the DAM profile throughout our process. Alongside Papyrus, we incorporate other software tools, such as Drawio (Drawio tool website: https://app.diagrams.net/), to streamline the transition from SysML modelling to fault tree generation. Our overarching approach adheres to the MBSA framework, supports iterative system development, provides a systematic and structured method for constructing an FTA and conducts a qualitative safety analysis of the IoT-based SIS. In the subsequent section, we delve into the intricacies of this process, providing a comprehensive understanding of our methodology.

5.1. Static System Modelling

To create the system’s static architecture model, we utilised BDD to represent the system’s different compositions and hierarchical structures. We divided the system into components using predefined blocks that logically indicate the system’s hardware and software. Additionally, we defined relationships among the components and the overall system regarding dependencies, generalisations, associations, aggregation, and inheritance.

5.2. Functional Configuration Modelling

To develop the failure behaviour of an IoT system, it is crucial to have a comprehensive understanding of its internal structure. One way to achieve this is by creating an IBD representing the system’s properties and interconnections. This visualises the system’s decomposition, facilitating an understanding of how information flows between its elements. The IBD depicts the system’s internal configuration using its components, ports, and data flows. The IBD illustrates how a malfunction can propagate throughout the system by combining connectivity and flow. A well-defined internal structure and an understanding of its behaviour are fundamental to ensuring system safety and reliability. By providing a visual representation of the system’s properties, interconnections, and internal configuration in an MBSA environment, these diagrams facilitate an understanding of the system’s behaviour, identifying potential malfunctions and designing measures to mitigate them.

5.3. Failure Annotation

To effectively model the failure behaviour of a system, it is essential to understand its functional features and the nominal state of each component. This involves analysing the system’s overall function, any redundancy designed into the system, and the behavioural characteristics of individual components. It is necessary to depict how the system elements can fail, how they change from one state to another, and the conditions that cause these changes. SMDs display the different states of the components and how their state can change. Using the system’s decomposed BDD, various nominal and failure states of the system are developed, along with their corresponding transitions and triggers, as SMDs. However, more than SMDs are needed to provide all the necessary information to model the failure features of an IoT system. To address this, the SMD was extended through the use of the DAM Profile, a UML extension mechanism that models the metamodel of the system. The DAM Profile is particularly effective for failure modelling through its stereotypes, such as DaStep, which represents the failure and error states of the system. The tag value under DaStep represents the transitions and triggers of the components. Using the DAM Profile, unique stereotypes and tag values can be applied to annotate the failure of system components accurately. The Data-Intensive Computing Environment (DICE)-integrated simulation environment was employed to achieve this goal.

5.4. Component Fault Tree Generation

In the paradigm of MBSA, it is possible to convert a source MBSA model into a target safety artefact by creating links between the two. The ultimate goal is to produce an executable model to analyse the system’s safety. To achieve this, it is essential to have a comprehensive understanding of both the source and target languages. Our approach involves transforming SysML SMDs into component-based models that can be analysed to determine the contribution of each component to the overall system failure. This approach simplifies the iterative design process by enabling the replacement of components with a higher failure rate and more resilience. The resulting component-based model is generated via failure modelling, identifying potential failures and enhancing overall system safety. To create a component-level fault tree (CFT), each system component failure represented as SMDs is mapped to obtain the corresponding component tree, generating several trees that can be studied to detect possible failures.

5.5. System Fault Tree Generation

The system-level FT is a target model designed to conduct a comprehensive system failure analysis. It combines individual FTA models of system components to create a single, unified tree structure using the system’s IBD. The IBD instances are utilised to merge the various CFTs. This allows the model to represent the relationship between components based on their configuration in the IBD. Static gates are employed to illustrate the configuration of the components better. For instance, an OR gate indicates series configurations where the system fails if any components fail. On the other hand, an AND gate is utilised for parallel configurations where the system only fails if all components fail. This level of detail allows the model to predict potential failures and their causes more accurately. At the top of the tree, the undesired event represents the overall failure of the system. Prior to that, the previous top-level undesired events in each component FTs are intermediate events. This detailed approach allows for a more thorough understanding of the system’s potential points of failure and can help identify areas for improvement and optimisation.

6. Illustrative Example

To demonstrate our proposed MBSA approach, we used the IoT-based Smart Irrigation System presented in Figure 5. Using this system, a farmer can remotely monitor the status of a field and control the water pump(s) to irrigate the field whenever needed without being physically present in the field. In normal operating conditions, this system will monitor different parameters of a field, and based on the monitoring knowledge, it will decide when and for how long to irrigate the field. It uses a temperature sensor (TS) and a moisture sensor (MS) for monitoring. TS monitors the temperature of the field, and MS monitors the soil moisture. TS and MS continuously sense the respective parameters and report them to the IoT gateway/controller for further processing. The communication between the sensors and the IoT gateway takes place via a wireless medium. An Arduino board or Raspberry Pi can be considered as an IoT gateway. A battery powers the board. The IoT gateway converts the analogue signals received from the sensors to digital values and sends these values to the edge cloud server. The communication between the edge cloud server and the gateway occurs through a wireless medium.

6.1. Static System Modelling

To create a formal system composition using the MBSA approach, it is crucial to have static configuration modelling. The system’s functional components and dependencies are depicted in the BDD shown in Figure 6, with SIS as the context. Direct composition relationships and SysML relationship link symbols were utilised to represent composite blocks in the system.

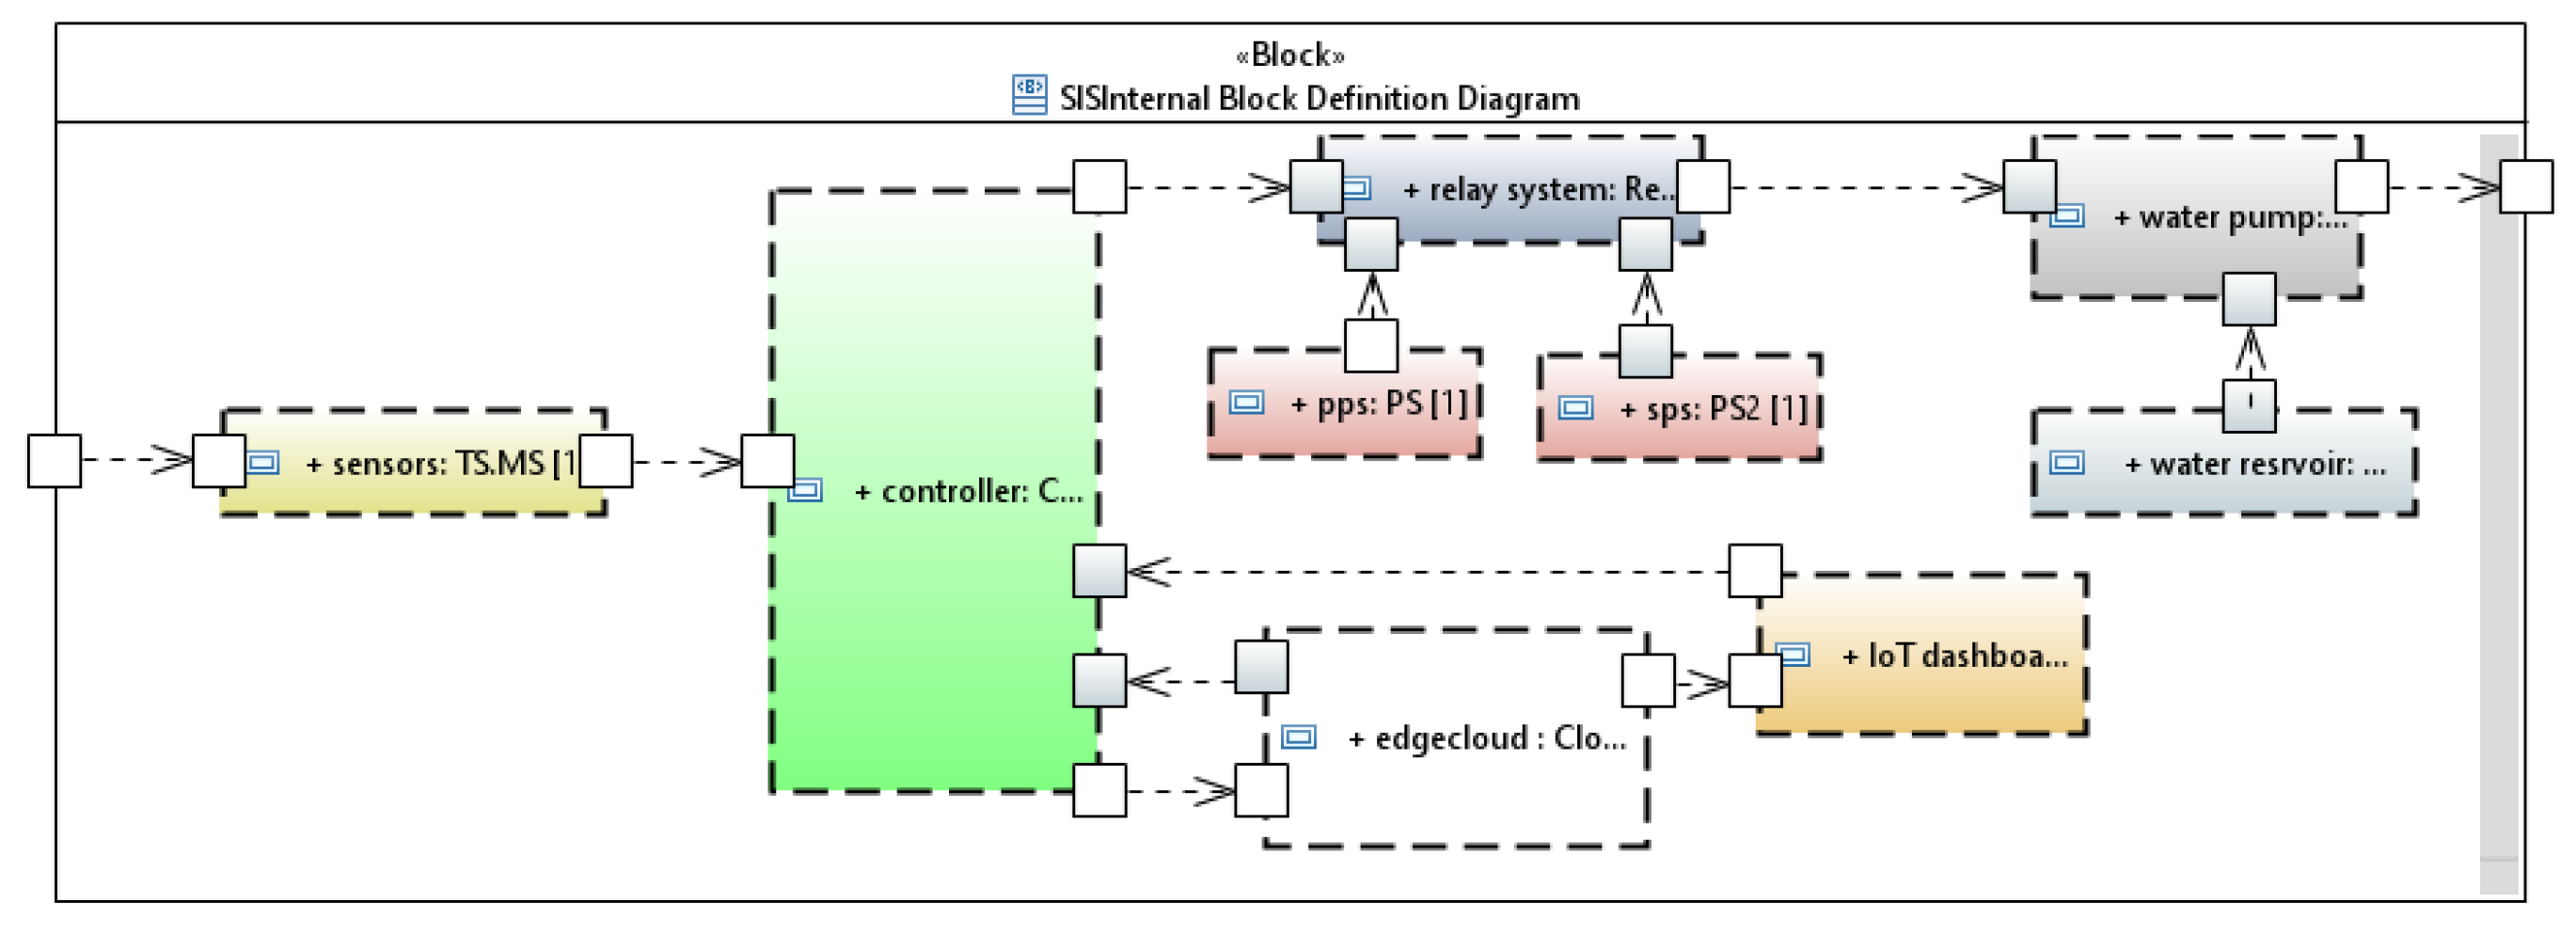
6.2. Internal Configuration System Modelling

The IBD Model of the system is crucial for effectively utilising MBSA modelling in system architecture. The SysML IBD depicts the system’s context and intricate, interdependent relationships among its components, accurately portraying data flow through ports and item flow symbols. The context blocks in SIS accurately represent interactions between different components as depicted in Figure 7.

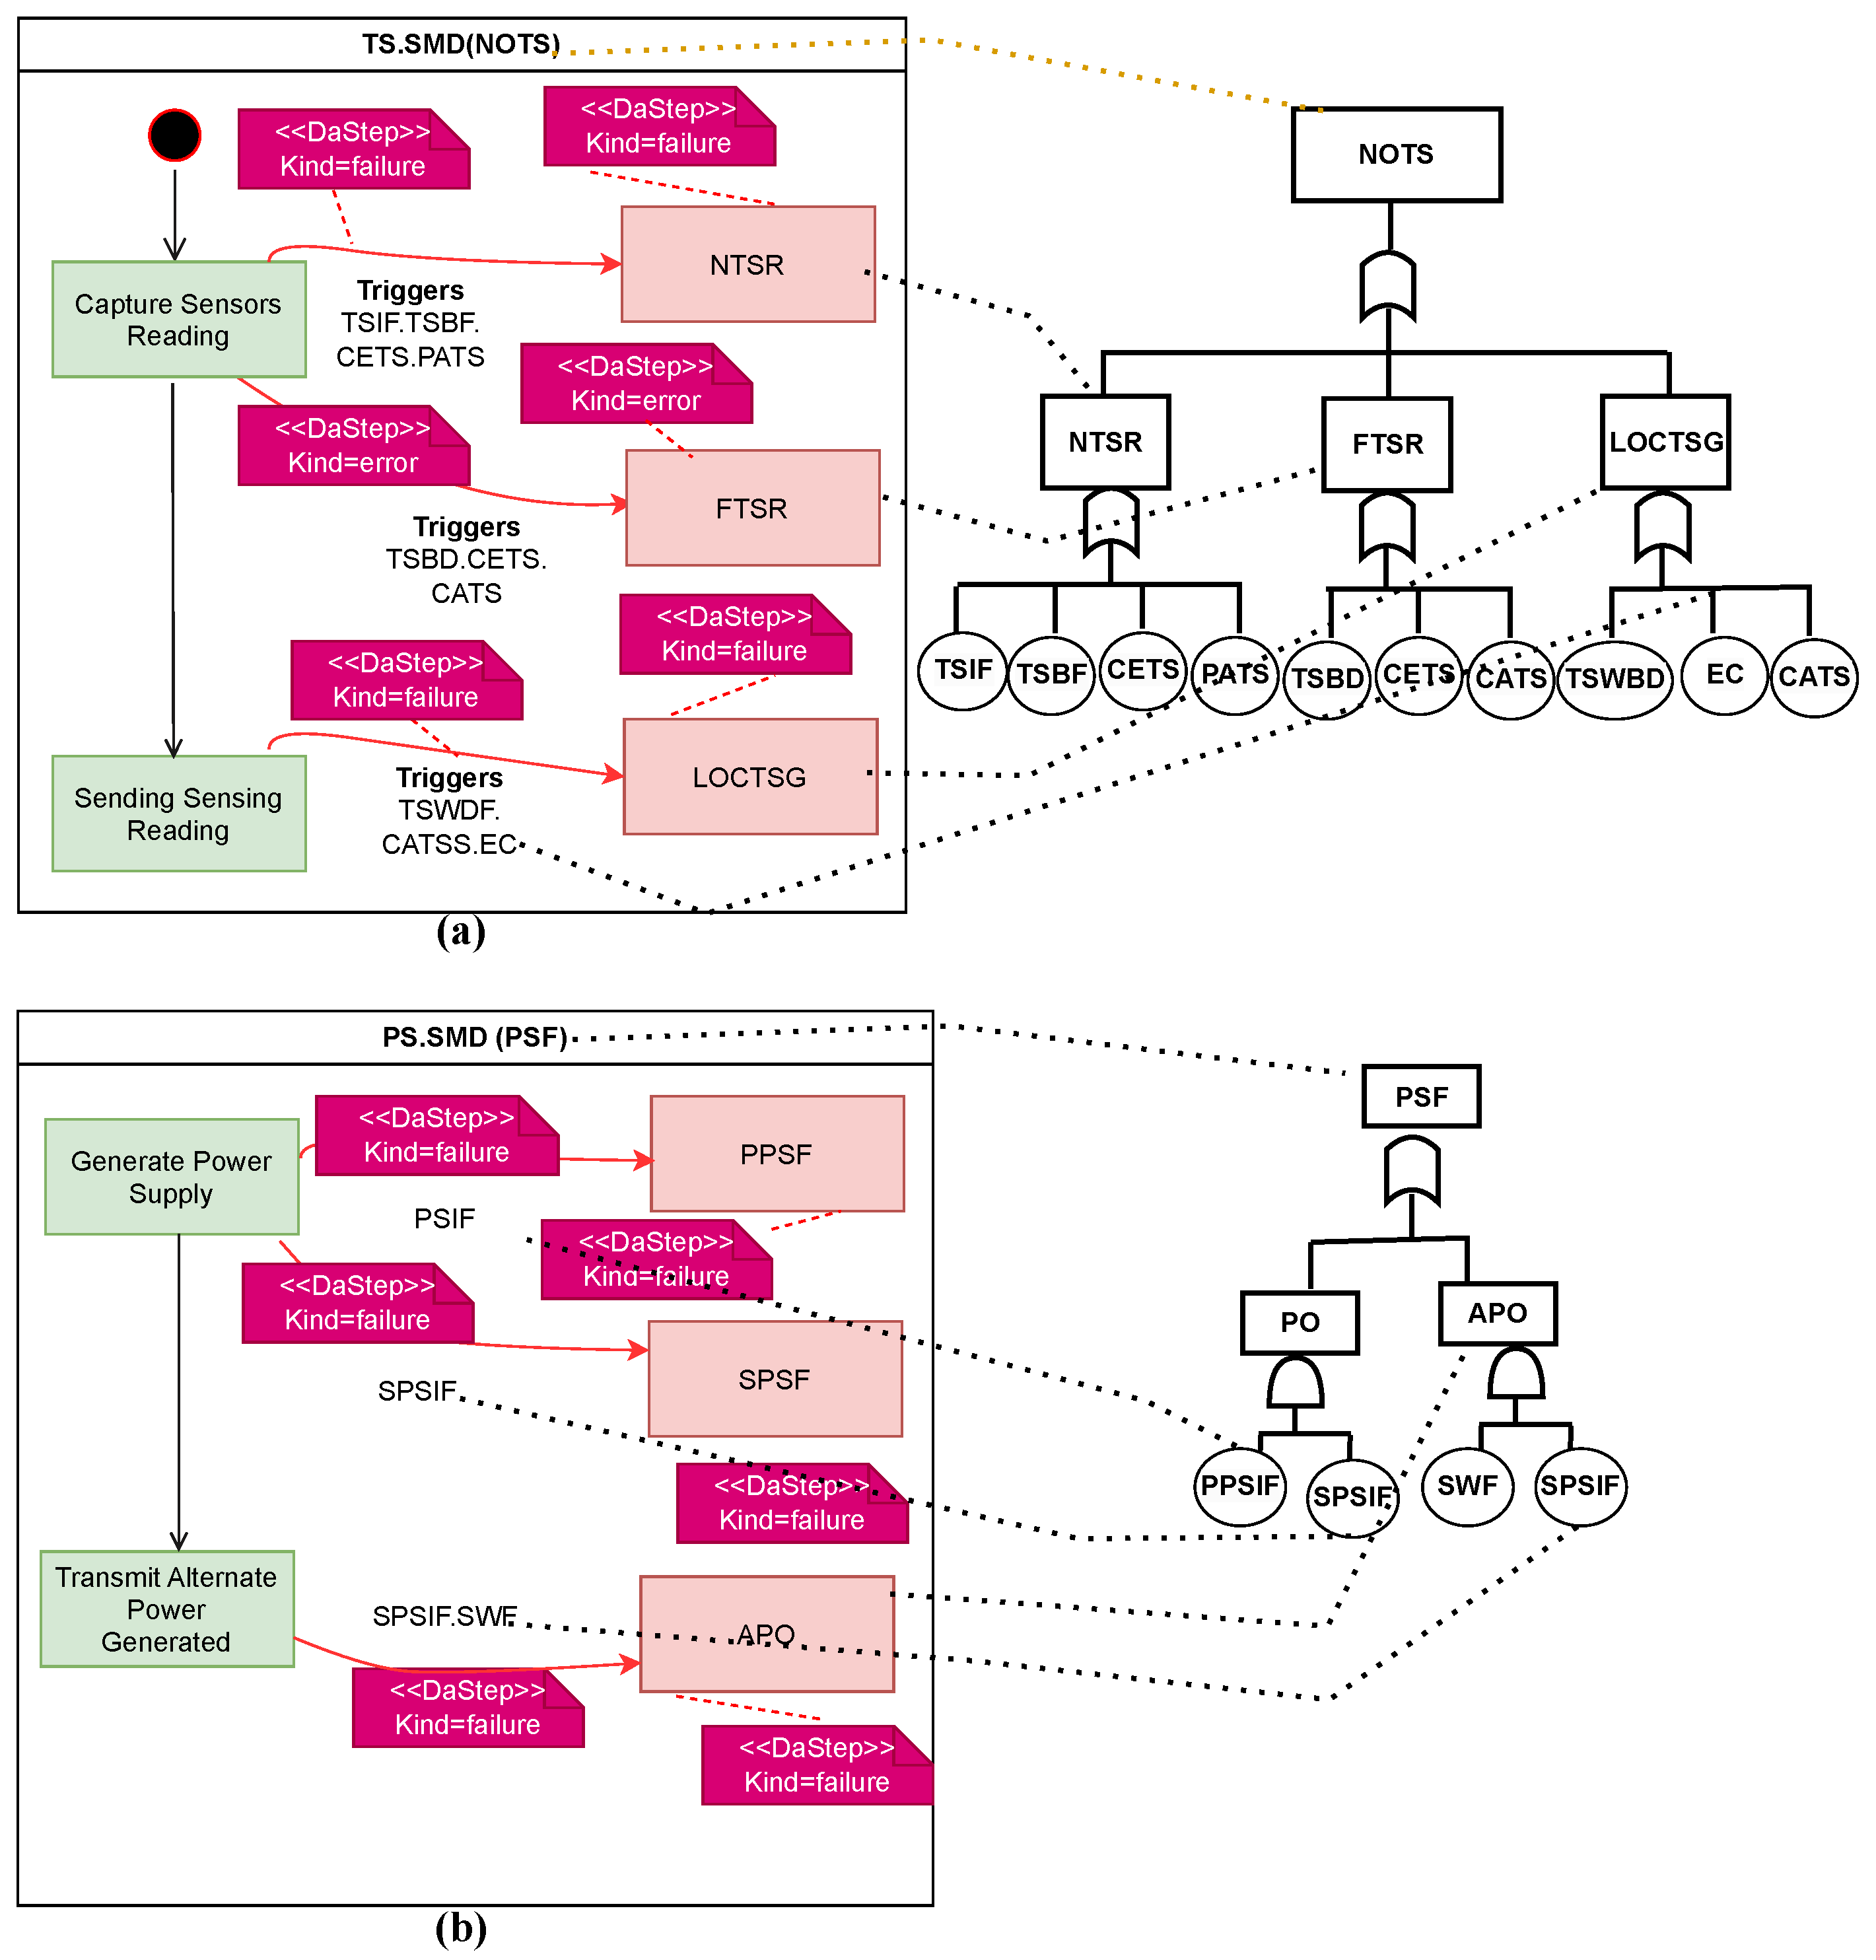
6.3. Failure Annotation Modelling of the System

In the provided Figure 8a,b, the failure annotations of two system components, namely the temperature sensor and power source, are displayed based on the SysML SMD. The metamodel was extended using the DAM Profile. In the SysML extension mechanism, DAM Stereotypes DaStep extends the SysML parent model to represent the state of failure and error in the system. The tag value under DaStep describes the transitions and triggers of the components. The nominal and failure states of the components are shown, where the failure states are represented by no output from the temperature sensor and power source failure. DAM stereotypes represent the transitions and triggers of the components to illustrate the failure and error states. The extended SMDs include failure to capture sensor readings, false sensor readings, and loss of control. The transition link indicates the triggers responsible for the state change, and various triggers are defined for other system components.

6.4. Model Transformation from MBSE Model to FT

6.4.1. Component Fault Tree Generation

To create the corresponding CFT, each system component’s one-to-one SMDs are mapped. In the CFT, the component’s overall failure is TE, while the IEs represent various functional states’ failure or error deviation. BE represents their triggers. To illustrate, the SMDs created in Figure 8a,b are mapped to their respective CFTs, as shown in Figure 9.

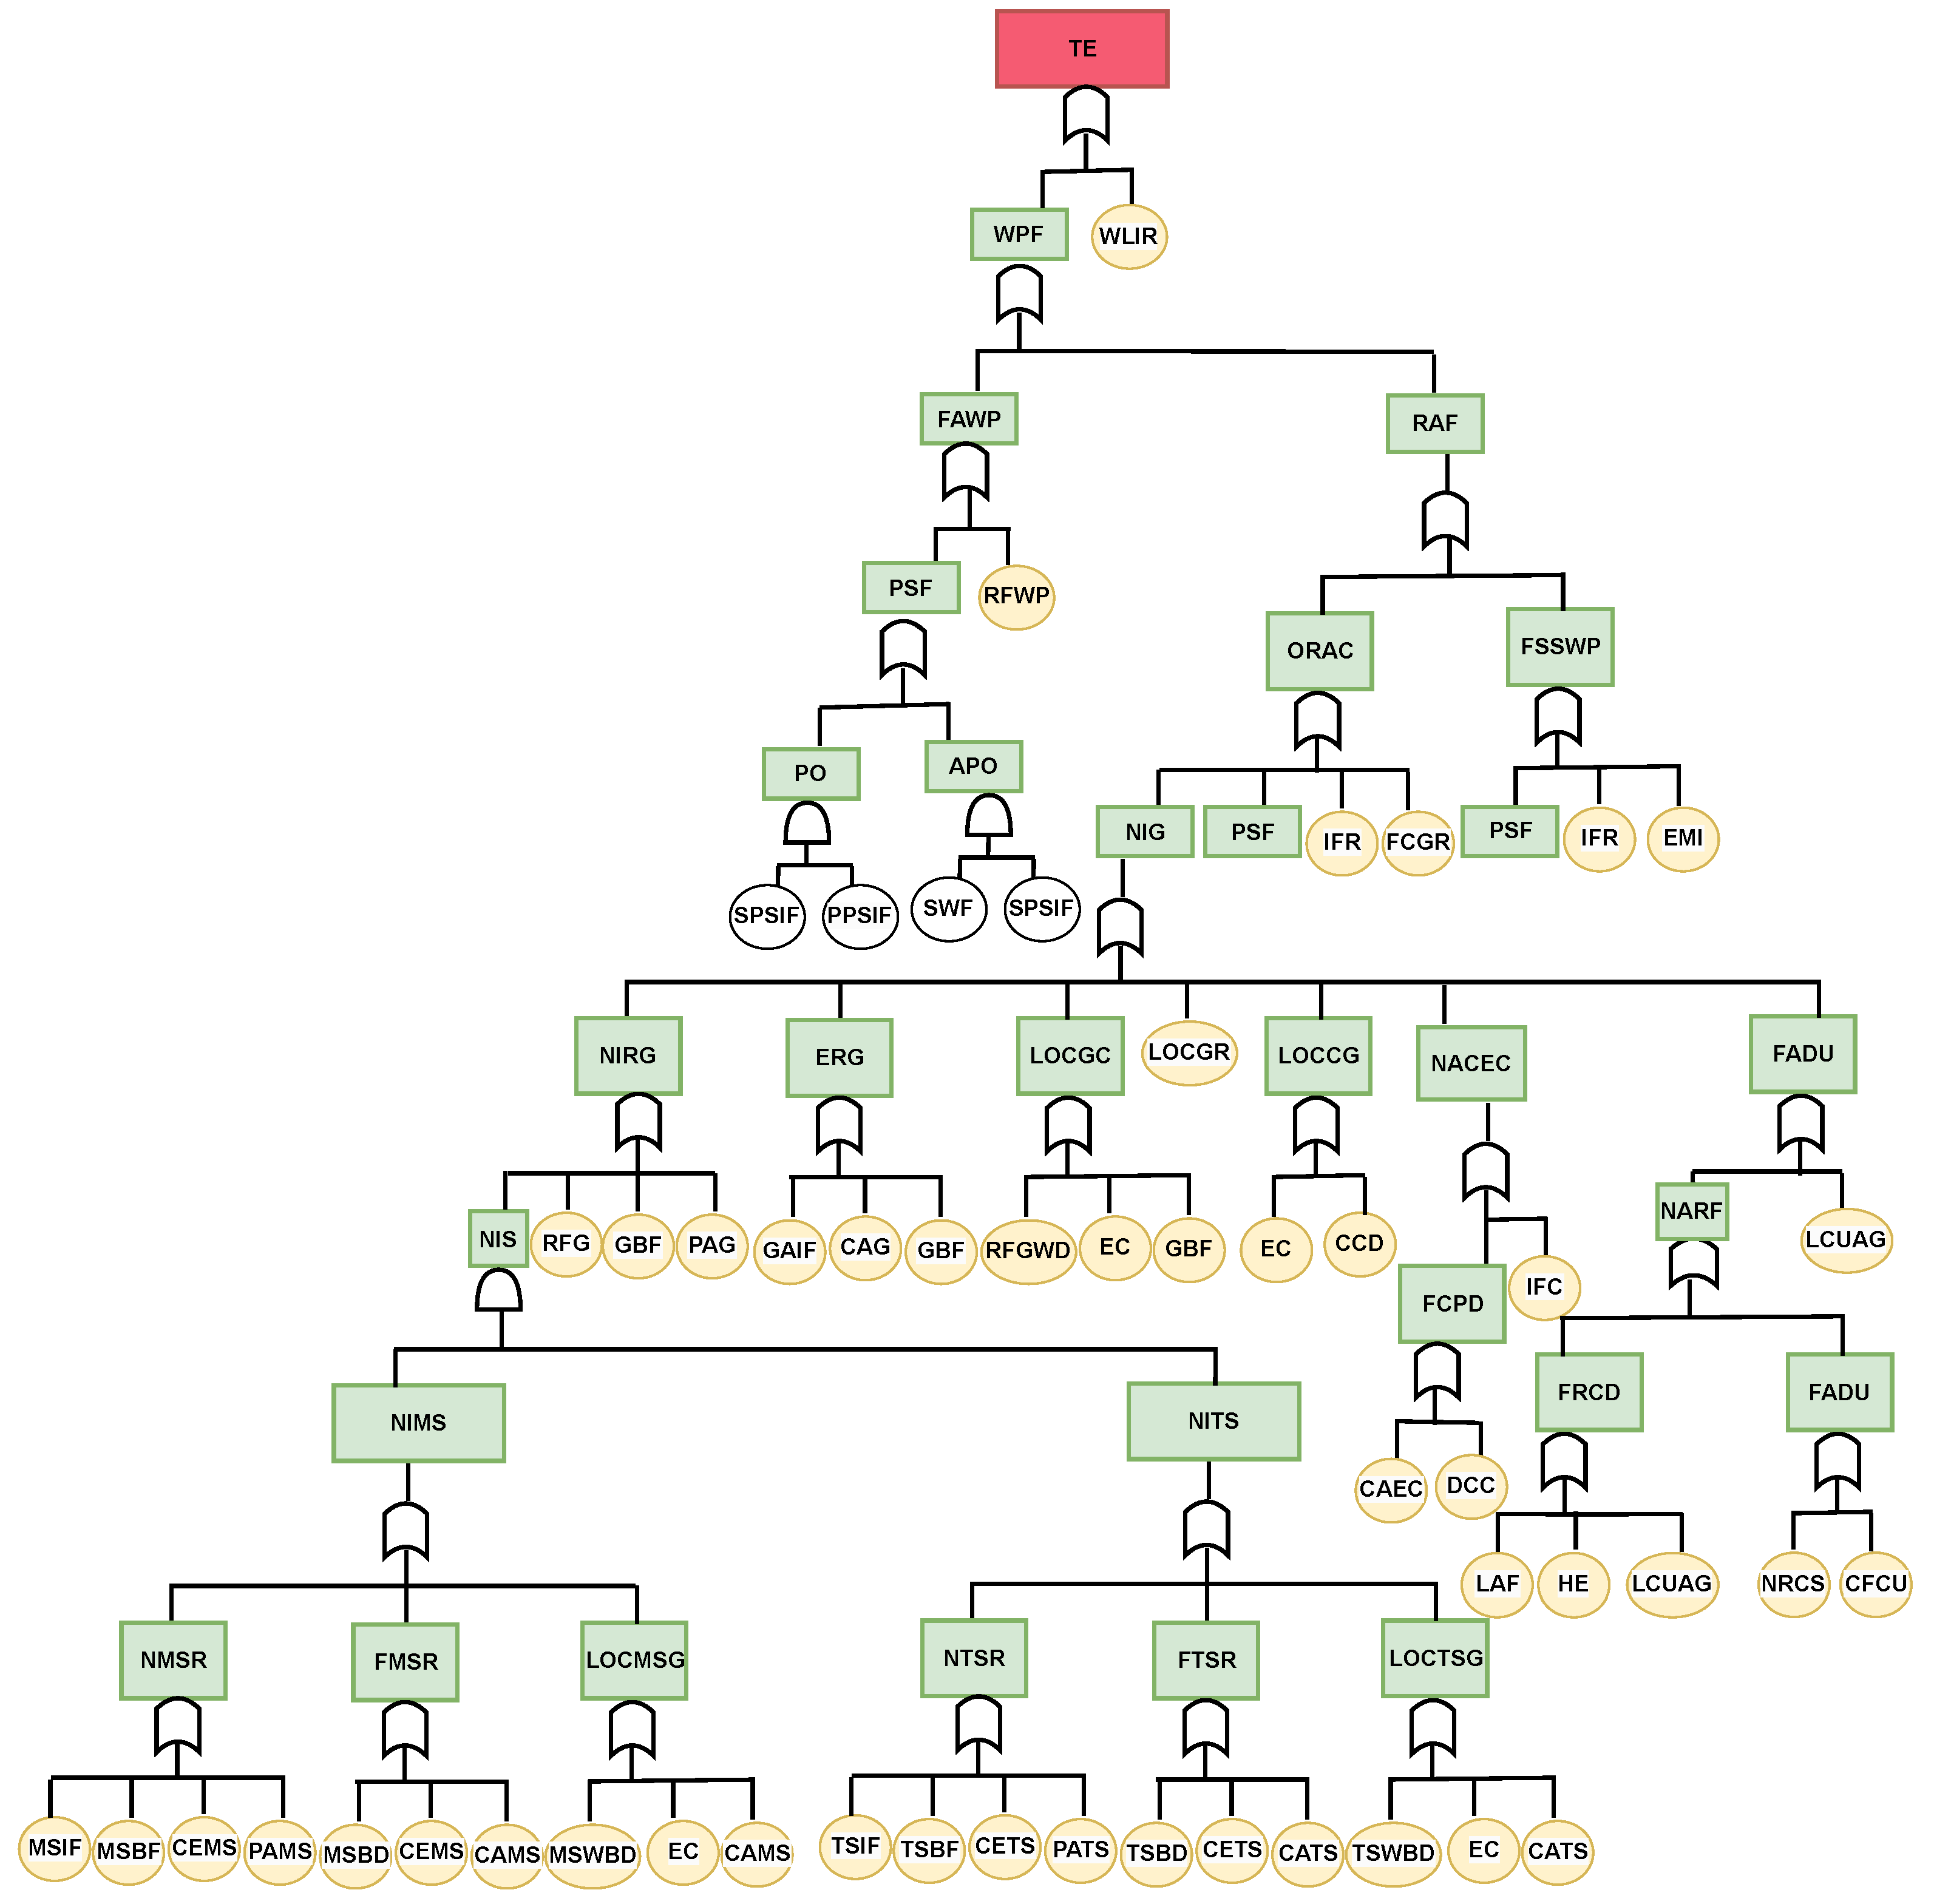
6.4.2. System Fault Tree Generation

The different components’ fault trees generated are mapped based on the instances of the components in the system’s IBD. Accordingly, the overall system FT of SIS obtained is presented in Figure 10. The TE denotes the system failure condition, which is “the failure of the system to irrigate the field when needed”. The list of BEs and IEs and their description representing various basic device failures or communication failures between devices is provided in Table A1 in Appendix A.

6.5. Qualitative Failure Analysis of the System

Depending on the role(s) of a component in the system and its interactions with other components in the system, the failure of the component can have an enormous impact on the failure of the system. Therefore, this system’s qualitative failure behaviour analysis aims to identify its potential causes. For failure behaviour analysis, we identified “the failure of the system to irrigate the field when needed” as a system failure condition. Considering this event as the top event of the fault tree, we developed the fault tree shown in Figure 10. This FT contains 19 unique basic events and the root causes that can contribute to the system failure. These root causes are either an internal failure of the devices or the failure of the communication between devices.
As seen in Figure 10, physical damage to the sensors or erroneous readings from the sensors is considered as the failure of the TS and MS, which are represented by the events TSF (temperature sensor failure) and MSF (moisture sensor failure). In the fault tree, five basic events—FCRG, FCGC, FCFC, FCTG, and FCMG—represent communication failures between system components. Note that, due to simplicity and brevity, we considered these communication failure-related events at an abstract level. This means we do not decompose these events further to show why a particular communication failure occurs. However, one can explore these events further by considering all the causes of a typical wireless communication failure. Similarly, the failure of the edge cloud is presented by the event ICS (internal failure of the edge cloud server) due to simplicity. Again, this event can be decomposed further by considering many potential causes of a cloud server failure, including hardware and software failures.
We analysed the fault tree in Figure 10 to identify the MCSs and obtained 94 MCSs; each of these MCSs can cause the system to fail. Out of these 94 MCSs, 71 MCSs are of order 2 and 23 are of order 1. The order of an MCS represents the number of basic events contributing to that MCS. If all the basic events are equally probable to occur, then the higher the order of an MCS, the lower the criticality of that MCS is. Therefore, in this example, the first-order MCSs, such as “Water level is inadequate in the reservoir (WLIR)”, “Random Failure of Water Pump (RFWP)”, “Switch Failure (SWF)”, “Internal Failure of Relay (IFR)”, “Human Error (HE)”, “Random Failure of Gateway (RFG)”, and “Gateway Battery Failure (GBF)”, are the most critical ones. Therefore, actions should be taken to reduce the likelihood of these events. For instance, for the events related to communication failure, multiple communication media can be considered, so that if one medium fails, another can be used for successful communication.

7. Conclusions

The integration of IoT technology into agriculture heralds a transformative era, albeit one fraught with challenges, particularly in areas of the dependability and trustworthiness of these systems to operate as expected over their mission time. Understanding the intricacies of individual component failures and their systemic impact is pivotal for ensuring the robust performance of agricultural IoT systems. As the agricultural landscape evolves, researchers are at the forefront of developing sophisticated analysis and verification frameworks essential for fostering intelligent systems contributing to long-term food sustainability.
This study serves as a testament to the effectiveness of the MBSA approach in dissecting the failure behaviour of an abstract IoT-based Smart Irrigation System. Leveraging a model-driven methodology, the investigation not only illuminated the nuances of system failure but also showcased the MBSA approach’s merits—characterised by meticulousness, error reduction, model reuse, and adaptability to iterative processes. The fault tree generated through this approach systematically identified component failures as basic events, delineating their interconnected pathways leading to system failure. This granular analysis empowers stakeholders to pinpoint the root causes of system failure and implement remedial measures crucial for maintaining operational integrity.
While the present study concentrated on qualitative analysis, future investigations hold promise in transitioning to quantitative assessments by incorporating components’ failure rates or probabilities and considering various failure distributions over time. Furthermore, the MBSA approach’s inherent flexibility opens avenues for including additional complex failure conditions, such as “unnecessary irrigation” or “insufficient irrigation duration”, demonstrating its ease of adaptation for diverse failure analyses.
In the evolving landscape of agricultural technology, security considerations emerge as a paramount concern. Acknowledging the potential vulnerabilities to safety failures induced by malevolent attacks, future research endeavours should delve into fortifying the system against security threats and malicious operations. As we navigate the ever-expanding realm of IoT in agriculture, a continuous commitment to robust analysis, adaptability, and security considerations will undoubtedly shape the future of sustainable and resilient smart farming systems.
Lastly, the proposed approach requires scalability, which can be achieved using a dynamic FTA. This tool is useful for modelling complex systems’ time- and function-dependent failure behaviour. By incorporating a dynamic FTA, we will be able to gain a more accurate understanding of how a system behaves over time and how different functions and components interact. This information can optimise framework performance, reduce risks, and improve the system’s overall dependability.

Author Contributions

Background, A.A. and M.M.R.; proposed methodology, S.K., I.G., A.A. and M.M.R.; writing—original draft preparation, A.A. and M.M.R.; writing—review and editing, S.K. and I.G.; problem space and formalisation, S.K. and I.G.; supervision, I.G. and S.K.; project administration, S.K. All authors have read and agreed to the published version of the manuscript.

Funding

This research received no external funding.

Data Availability Statement

Data are contained within the article.

Conflicts of Interest

The authors declare no conflicts of interest.

Appendix A. Data Associated with the Fault Tree of Figure

Table A1. Description of Events in the Fault Tree of Figure 10.
IDDescription
TEFailure of the Irrigation System
TSTemperature Sensor
MSMoisture Sensor
UAUser IoT Mobile Application
SGSmart Gateway
ECEdge Cloud Server
WRWater Reservoir
RSRelay System
PSPower Source
WPWater Pump
NOMSNo Output (or Wrong Reading) from MS
NOTSNo Output (or Wrong Reading) from TS
NARFNo action is recommended by the farmer
NOGNo Output from the Smart Gateway
NODCNo Output Data by the Cloud
FSWFFailure to Supply Water to the Farm
RAFRelay Activation Failure
PSFPower Supply Failure
WPFWater Pump Failure
NTSRNo Reading from Temperature Sensor
FTSRFalse Reading from Temperature Sensor
LOCTSGLoss of Communication Temperature Sensor to Gateway
NMSRNo Reading from Moisture Sensor
FMSRFalse Reading from Moisture Sensor
LOCMSGLoss of Communication Moisture Sensor to Gateway
TSIFTemperature Sensor Internal Failure
TSBFTemperature Sensor Battery Failure
CETSCalibration Error Temperature Sensor
CATSCyberattack on Temperature Sensor
TSBDTemperature Sensor Battery Depletion (Low Battery)
TSWDFTemperature Sensor Wireless Device Failure
CATSSCyberattack on Temperature Sensor sent Signal
ECEnvironment Condition
MSIFMoisture Sensor Internal Failure
MSBFMoisture Sensor Battery Failure
CEMSCalibration Error Moisture Sensor
CAMSCyberattack on Moisture Sensor
MSBDMoisture Sensor Battery Depletion (Low Battery)
MSWDFMoisture Sensor Wireless Device Failure
CAMSSCyberattack on Moisture Sensor sent Signal
FRCDFailure to Receive Cloud Data
NRCSNo Command Received by the IoT Gateway from the Edge Cloud Server
LAFLack of Action by the Farmer
HEHuman Error
LCUAGLoss of Communication User Application to Gateway
NIRGNo Sensing Input Received by the Gateway
ERGErroneous Reading from the Gateway
LOCGCLoss of Communication Gateway to Cloud
LOCCGLoss of Communication Cloud to Gateway
FADUFailure to Accept Actuation Data From the User
LOCGRLoss of Communication Gateway to Relay System
NITSNo Input from Temperature Sensor
NIMSNo Input from Moisture Sensor
RFGRandom Failure of Gateway
GBFGateway Battery Failure
PAGPhysical Attack on Gateway
GIFGateway Internal Failure (Hardware Failure)
CAGCyberattack on Gateway Node
GAIFGateway Application Internal Failure (Runtime Error)
GBFGateway Battery Failure
RFGWDRandom Failure Gateway Wireless Device
CCDCorrupted Cloud Data
NACECNo Activation Command from the Cloud
LCUAGLoss of Communication User Application to Gateway
LCGRSLoss of Communication Gateway to Relay System
CACDCyberattack on Cloud Data
LOCGCLoss of Communication Gateway to Cloud
NIRGNo Input Received from the Gateway
IFCInternal Failure of Cloud Server
CAECCyberattack on Edge Cloud (DoS)
DCCData Corruption on the Cloud Server
CACPDCyberattack on the Cloud Processed Data
LOCCGLoss of Communication Cloud to Gateway
NIGNo Input from the Gateway
IFRInternal Failure of Relay
PSFPower System Failure
EMIElectromagnetic Interference on the Relay System
PPSIFPrimary Power System Failure
SPSIFSecondary Power System Failure
APOAlternative Power Source Outage
RFWPRandom Failure of Water Pump
WLIRWater Level is Inadequate in the Reservoir
SWFSwitch Failure
NGDNo Data from the Gateway

References

  1. Bangladesh Bureau of Statistics (BBS). Agriculture Census 2019: Structure of Agricultural Holdings and Livestock & Fisheries, National Series Volume-1; BBS, Statistics and Informatics Division, Ministry of Planning, Government of the People’s Republic of Bangladesh: Dhaka, Bangladesh, 2022.
  2. Ayaz, M.; Ammad-Uddin, M.; Sharif, Z.; Mansour, A.; Aggoune, E.H.M. Internet-of-Things (IoT)-based smart agriculture: Toward making the fields talk. IEEE Access 2019, 7, 129551–129583. [Google Scholar] [CrossRef]
  3. Gondchawar, N.; Kawitkar, R. IoT based smart agriculture. Int. J. Adv. Res. Comput. Commun. Eng. 2016, 5, 838–842. [Google Scholar]
  4. Sushanth, G.; Sujatha, S. IOT based smart agriculture system. In Proceedings of the 2018 International Conference on Wireless Communications, Signal Processing and Networking (WiSPNET), Chennai, India, 22–24 March 2018; IEEE: Toulouse, France, 2018; pp. 1–4. [Google Scholar]
  5. Yang, X.; Shu, L.; Li, K.; Nurellari, E.; Huo, Z.; Zhang, Y. A Lightweight Fault-Detection Scheme for Resource-Constrained Solar Insecticidal Lamp IoTs. Sensors 2023, 23, 6672. [Google Scholar] [CrossRef] [PubMed]
  6. Shahzadi, R.; Tausif, M.; Ferzund, J.; Suryani, M.A. Internet of things based expert system for smart agriculture. Int. J. Adv. Comput. Sci. Appl. 2016, 7, 341–350. [Google Scholar] [CrossRef]
  7. Saraf, S.B.; Gawali, D.H. IoT based smart irrigation monitoring and controlling system. In Proceedings of the 2017 2nd IEEE International Conference on Recent Trends in Electronics, Information & Communication Technology (RTEICT), Bangalore, India, 19–20 May 2017; IEEE: Toulouse, France, 2017; pp. 815–819. [Google Scholar]
  8. Khanna, A.; Kaur, S. Evolution of Internet of Things (IoT) and its significant impact in the field of Precision Agriculture. Comput. Electron. Agric. 2019, 157, 218–231. [Google Scholar] [CrossRef]
  9. Huang, K.; Shu, L.; Li, K.; Chen, Y.; Zhu, Y.; Valluru, R. Sustainable and Intelligent Phytoprotection in Photovoltaic Agriculture: New Challenges and Opportunities. Electronics 2023, 12, 1221. [Google Scholar] [CrossRef]
  10. Ferrag, M.A.; Shu, L.; Yang, X.; Derhab, A.; Maglaras, L. Security and privacy for green IoT-based agriculture: Review, blockchain solutions, and challenges. IEEE Access 2020, 8, 32031–32053. [Google Scholar] [CrossRef]
  11. Yang, X.; Shu, L.; Liu, Y.; Hancke, G.P.; Ferrag, M.A.; Huang, K. Physical security and safety of IoT equipment: A survey of recent advances and opportunities. IEEE Trans. Ind. Inform. 2022, 18, 4319–4330. [Google Scholar] [CrossRef]
  12. Abdulhamid, A.; Kabir, S.; Ghafir, I.; Lei, C. Dependability of the Internet of Things: Current Status and Challenges. In Proceedings of the 2022 International Conference on Electrical, Computer, Communications and Mechatronics Engineering (ICECCME), Maldives, Maldives, 16–18 November 2022; IEEE: Toulouse, France, 2022; pp. 1–6. [Google Scholar]
  13. Kabir, S. An overview of fault tree analysis and its application in model based dependability analysis. Expert Syst. Appl. 2017, 77, 114–135. [Google Scholar] [CrossRef]
  14. Relkar, A.S. Risk analysis of equipment failure through failure mode and effect analysis and fault tree analysis. J. Fail. Anal. Prev. 2021, 21, 793–805. [Google Scholar] [CrossRef]
  15. Niloofar, P.; Lazarova-Molnar, S. Fusion of data and expert knowledge for fault tree reliability analysis of cyber-physical systems. In Proceedings of the 2021 5th International Conference on System Reliability and Safety (ICSRS), Palermo, Italy, 24–26 November 2021; IEEE: Toulouse, France, 2021; pp. 92–97. [Google Scholar]
  16. Yang, X.; Shu, L.; Li, K.; Huo, Z.; Shu, S.; Nurellari, E. Silos: An intelligent fault detection scheme for solar insecticidal lamp iot with improved energy efficiency. IEEE Internet Things J. 2022, 10, 920–939. [Google Scholar] [CrossRef]
  17. Fazlollahtabar, H.; Niaki, S.T.A. Fault tree analysis for reliability evaluation of an advanced complex manufacturing system. J. Adv. Manuf. Syst. 2018, 17, 107–118. [Google Scholar] [CrossRef]
  18. Kabir, S.; Taleb-Berrouane, M.; Papadopoulos, Y. Dynamic reliability assessment of flare systems by combining fault tree analysis and Bayesian networks. Energy Sources Part A Recover. Util. Environ. Eff. 2023, 45, 4305–4322. [Google Scholar] [CrossRef]
  19. Abdulhamid, A.; Kabir, S.; Ghafir, I.; Lei, C. Developing Dependable IoT Systems: Safety Perspective. In Proceedings of the UNIfied Conference of DAMAS, IncoME and TEPEN Conferences, Huddersfield, UK, 29 August–1 September 2023; Springer: Cham, Switzerland, 2023; pp. 1–6. [Google Scholar]
  20. Abdulhamid, A.; Kabir, S.; Ghafir, I.; Lei, C. An Overview of Safety and Security Analysis Frameworks for the Internet of Things. Electronics 2023, 12, 3086. [Google Scholar] [CrossRef]
  21. Kabir, S.; Papadopoulos, Y.; Walker, M.; Parker, D.; Aizpurua, J.I.; Lampe, J.; Rüde, E. A model-based extension to HiP-HOPS for dynamic fault propagation studies. In Proceedings of the Model-Based Safety and Assessment, Trento, Italy, 11–13 September 2017; Bozzano, M., Papadopoulos, Y., Eds.; Springer: Cham, Switzerland, 2017; pp. 163–178. [Google Scholar]
  22. Alshboul, B.; Petriu, D.C. Automatic derivation of fault tree models from SysML models for safety analysis. J. Softw. Eng. Appl. 2018, 11, 204–222. [Google Scholar] [CrossRef]
  23. Feiler, P.; Delange, J. Automated fault tree analysis from aadl models. ACM SIGAda Ada Lett. 2017, 36, 39–46. [Google Scholar] [CrossRef]
  24. Sebastián, G.; Tesoriero, R.; Gallud, J.A. Automatic code generation for language-learning applications. IEEE Lat. Am. Trans. 2020, 18, 1433–1440. [Google Scholar] [CrossRef]
  25. Shboul, B.A.; Petriu, D.C. Pattern-based transformation of SysML models into fault tree models. In Proceedings of the 29th Annual International Conference on Computer Science and Software Engineering, Toronto, ON, Canada, 4–6 November 2019; pp. 214–223. [Google Scholar]
  26. Sharvia, S.; Kabir, S.; Walker, M.; Papadopoulos, Y. Model-based dependability analysis: State-of-the-art, challenges, and future outlook. Softw. Qual. Assur. 2016, 2016, 251–278. [Google Scholar]
  27. Roudier, Y.; Apvrille, L. SysML-Sec: A model driven approach for designing safe and secure systems. In Proceedings of the 2015 3rd International Conference on Model-Driven Engineering and Software Development (MODELSWARD), Angers, France, 9–11 February 2015; IEEE: Toulouse, France, 2015; pp. 655–664. [Google Scholar]
  28. de Andrade Melani, A.H.; de Souza, G.F.M. Obtaining fault trees through SysML diagrams: A MBSE approach for reliability analysis. In Proceedings of the 2020 Annual Reliability and Maintainability Symposium (RAMS), Palm Springs, CA, USA, 27–30 January 2020; IEEE: Toulouse, France, 2020; pp. 1–5. [Google Scholar]
  29. Vyas, P.; Mittal, R. Hazard analysis of Unified Modelling Language sequence and state charts using software fault tree analysis. Int. J. Crit. Comput.-Based Syst. 2013, 4, 173–197. [Google Scholar] [CrossRef]
  30. Jürjens, J. Developing safety-critical systems with UML. In Proceedings of the «UML» 2003-The Unified Modeling Language. Modeling Languages and Applications: 6th International Conference, San Francisco, CA, USA, 20–24 October 2003; Proceedings 6. Springer: Berlin/Heidelberg, Germany, 2003; pp. 360–372. [Google Scholar]
  31. Papadopoulos, Y.; McDermid, J.A. Hierarchically performed hazard origin and propagation studies. In Proceedings of the International Conference on Computer Safety, Reliability, and Security, Toulouse, France, 27–29 September 1999; Springer: Berlin/Heidelberg, Germany, 1999; pp. 139–152. [Google Scholar]
  32. Cisco. What Percent of Earth Is Water? 2014. Available online: https://phys.org/news/2014-12-percent-earth.html (accessed on 25 October 2023).
  33. Water Science School. Ice, Snow, and Glaciers and the Water Cycle. 2019. Available online: https://www.usgs.gov/special-topics/water-science-school/science/ice-snow-and-glaciers-and-water-cycle (accessed on 25 October 2023).
  34. Wang, E.; Attard, S.; Linton, A.; McGlinchey, M.; Xiang, W.; Philippa, B.; Everingham, Y. Development of a closed-loop irrigation system for sugarcane farms using the Internet of Things. Comput. Electron. Agric. 2020, 172, 105376. [Google Scholar] [CrossRef]
  35. Dahane, A.; Kechar, B.; Benameur, R. Precision Agriculture: Automated Irrigation Management Platform Using Wireless Sensor Networks. In Precision Agriculture Technologies for Food Security and Sustainability; IGI Global: Hershey, PA, USA, 2021; pp. 150–165. [Google Scholar]
  36. Kumar Jayam, Y.; Tunuguntla, V.; Sreehari, J.; Harinarayanan, S. Smart Plant Managing System using IoT. In Proceedings of the 2020 4th International Conference on Trends in Electronics and Informatics (ICOEI) (48184), Tirunelveli, India, 15–17 June 2020; IEEE: Toulouse, France, 2020; pp. 271–277. [Google Scholar]
  37. Dahane, A.; Benameur, R.; Kechar, B.; Benyamina, A. An IoT based smart farming system using machine learning. In Proceedings of the 2020 International Symposium on Networks, Computers and Communications (ISNCC), Montreal, QC, Canada, 20–22 October 2020; IEEE: Toulouse, France, 2020; pp. 1–6. [Google Scholar]
  38. Gutiérrez, J.; Villa-Medina, J.F.; Nieto-Garibay, A.; Porta-Gándara, M.Á. Automated irrigation system using a wireless sensor network and GPRS module. IEEE Trans. Instrum. Meas. 2013, 63, 166–176. [Google Scholar] [CrossRef]
  39. Saranya, T.; Deisy, C.; Sridevi, S.; Anbananthen, K.S.M. A comparative study of deep learning and Internet of Things for precision agriculture. Eng. Appl. Artif. Intell. 2023, 122, 106034. [Google Scholar] [CrossRef]
  40. Ale, L.; Sheta, A.; Li, L.; Wang, Y.; Zhang, N. Deep learning based plant disease detection for smart agriculture. In Proceedings of the 2019 IEEE Globecom Workshops (GC Wkshps), Waikoloa, HI, USA, 9–13 December 2019; IEEE: Toulouse, France, 2019; pp. 1–6. [Google Scholar]
  41. Taneja, N.; Garg, N.; Gupta, S.; Kaushal, R. Comparative Analysis of Convolutional Neural Network Techniques for Plant Disease Detection. In Proceedings of the 2023 4th International Conference for Emerging Technology (INCET), Belgaum, India, 26–28 May 2023; IEEE: Toulouse, France, 2023; pp. 1–4. [Google Scholar]
  42. Mahlein, A.K. Plant disease detection by imaging sensors–parallels and specific demands for precision agriculture and plant phenotyping. Plant Dis. 2016, 100, 241–251. [Google Scholar] [CrossRef]
  43. Mishra, R.; Singh, D. Convolutional Neural Network Method for Effective Plant Disease Prediction. In Proceedings of the 2023 IEEE International Conference on Integrated Circuits and Communication Systems (ICICACS), Raichur, India, 24–25 February 2023; IEEE: Toulouse, France, 2023; pp. 1–5. [Google Scholar]
  44. Al-Shareeda, M.A.; Manickam, S.; Saare, M.A. Intelligent Drone-based IoT Technology for Smart Agriculture System. In Proceedings of the 2022 International Conference on Data Science and Intelligent Computing (ICDSIC), Karbala, Iraq, 1–2 November 2022; IEEE: Toulouse, France, 2022; pp. 41–45. [Google Scholar]
  45. Maslekar, N.; Kulkarni, K.P.; Chakravarthy, A.K. Application of unmanned aerial vehicles (UAVs) for pest surveillance, monitoring and management. In Innovative Pest Management Approaches for the 21st Century: Harnessing Automated Unmanned Technologies; Springer: Singapore, 2020; pp. 27–45. [Google Scholar]
  46. Dutta, J.; Dutta, J.; Gogoi, S. Smart farming: An opportunity for efficient monitoring and detection of pests and diseases. J. Entomol. Zool. Stud 2020, 8, 2352–2359. [Google Scholar]
  47. Cicioğlu, M.; Çalhan, A. Smart agriculture with internet of things in cornfields. Comput. Electr. Eng. 2021, 90, 106982. [Google Scholar] [CrossRef]
  48. Darwin, B.; Dharmaraj, P.; Prince, S.; Popescu, D.E.; Hemanth, D.J. Recognition of bloom/yield in crop images using deep learning models for smart agriculture: A review. Agronomy 2021, 11, 646. [Google Scholar] [CrossRef]
  49. Kootstra, G.; Wang, X.; Blok, P.M.; Hemming, J.; Van Henten, E. Selective harvesting robotics: Current research, trends, and future directions. Curr. Robot. Rep. 2021, 2, 95–104. [Google Scholar] [CrossRef]
  50. Kalantari, F.; Tahir, O.M.; Joni, R.A.; Fatemi, E. Opportunities and challenges in sustainability of vertical farming: A review. J. Landsc. Ecol. 2018, 11, 35–60. [Google Scholar] [CrossRef]
  51. Siregar, R.R.A.; Seminar, K.B.; Wahjuni, S.; Santosa, E. Vertical farming perspectives in support of precision agriculture using artificial intelligence: A review. Computers 2022, 11, 135. [Google Scholar] [CrossRef]
  52. Abhay, V.S.; Fahida, V.H.; Reshma, T.R.; Sajan, C.K.; Shelly, S. IoT-Based Home Vertical Farming. In Intelligent Systems, Technologies and Applications; Paprzycki, M., Thampi, S.M., Mitra, S., Trajkovic, L., El-Alfy, E.S.M., Eds.; Springer: Singapore, 2021; pp. 151–160. [Google Scholar]
  53. Kundu, K.; Sharma, S.; Bhardwaj, B.; Muddineni, R.; Rai, A. Design & Development of IoT based Vertical Farming Monitoring System. In Proceedings of the 2023 International Conference on Artificial Intelligence and Smart Communication (AISC), Greater Noida, India, 27–29 January 2023; IEEE: Toulouse, France, 2023; pp. 1018–1021. [Google Scholar]
  54. Putri, R.E.; Wibowo, M.; Ardli, J.; Andasuryani, A. Monitoring and controlling of vertical farming system using Internet of Things (IoT). In Proceedings of the AIP Conference Proceedings, Padang, Indonesia, 3–4 November 2021; AIP Publishing: New York, NY, USA, 2023. [Google Scholar]
  55. Kaur, G.; Upadhyaya, P.; Chawla, P. Comparative analysis of IoT-based controlled environment and uncontrolled environment plant growth monitoring system for hydroponic indoor vertical farm. Environ. Res. 2023, 222, 115313. [Google Scholar] [CrossRef]
  56. Kaur, G.; Upadhyaya, P.; Chawla, P. Iot based mobile application for monitoring of hydroponic vertical farming. In Proceedings of the 2022 10th International Conference on Reliability, Infocom Technologies and Optimization (Trends and Future Directions) (ICRITO), Noida, India, 13–14 October 2022; IEEE: Toulouse, France, 2022; pp. 1–4. [Google Scholar]
  57. Maraveas, C. Incorporating artificial intelligence technology in smart greenhouses: Current State of the Art. Appl. Sci. 2022, 13, 14. [Google Scholar] [CrossRef]
  58. Escamilla-García, A.; Soto-Zarazúa, G.M.; Toledano-Ayala, M.; Rivas-Araiza, E.; Gastélum-Barrios, A. Applications of artificial neural networks in greenhouse technology and overview for smart agriculture development. Appl. Sci. 2020, 10, 3835. [Google Scholar] [CrossRef]
  59. Kagan, C.R.; Arnold, D.P.; Cappelleri, D.J.; Keske, C.M.; Turner, K.T. Special report: The Internet of Things for Precision Agriculture (IoT4Ag). Comput. Electron. Agric. 2022, 196, 106742. [Google Scholar] [CrossRef]
  60. Mishra, S.; Sharma, S.K. Advanced contribution of IoT in agricultural production for the development of smart livestock environments. Internet Things 2023, 22, 100724. [Google Scholar] [CrossRef]
  61. Benaissa, S.; Tuyttens, F.; Plets, D.; Martens, L.; Vandaele, L.; Joseph, W.; Sonck, B. Improved cattle behaviour monitoring by combining Ultra-Wideband location and accelerometer data. Animal 2023, 17, 100730. [Google Scholar] [CrossRef]
  62. Ilyas, Q.M.; Ahmad, M. Smart farming: An enhanced pursuit of sustainable remote livestock tracking and geofencing using IoT and GPRS. Wirel. Commun. Mob. Comput. 2020, 2020, 1–12. [Google Scholar] [CrossRef]
  63. Xu, X.; Du, Z.; Bai, Z.; Wang, S.; Wang, C.; Li, D. Fault diagnosis method of dissolved oxygen sensor electrolyte loss based on impedance measurement. Comput. Electron. Agric. 2023, 212, 108123. [Google Scholar] [CrossRef]
  64. Jenab, K.; Pineau, J. Failure mode and effect analysis on safety critical components of space travel. Manag. Sci. Lett. 2015, 5, 669–678. [Google Scholar] [CrossRef]
  65. Kabir, S.; Papadopoulos, Y. Applications of Bayesian networks and Petri nets in safety, reliability, and risk assessments: A review. Saf. Sci. 2019, 115, 154–175. [Google Scholar] [CrossRef]
  66. Patrizi, G.; Bartolini, A.; Ciani, L.; Catelani, M. Failure analysis of a smart sensor node for precision agriculture. In Proceedings of the 18th IMEKO TC10 Conference, Warsaw, Poland, 16–27 September 2022; pp. 26–31. [Google Scholar]
  67. Wang, Y.; Zhang, R.; Zhang, X.; Zhang, Y. Privacy Risk Assessment of Smart Home System Based on a STPA–FMEA Method. Sensors 2023, 23, 4664. [Google Scholar] [CrossRef]
  68. Korsunovs, A.; Doikin, A.; Campean, F.; Kabir, S.; Hernandez, E.; Taggart, D.; Parker, S.; Mills, G. Towards a Model-Based Systems Engineering Approach for Robotic Manufacturing Process Modelling with Automatic FMEA Generation. Proc. Des. Soc. 2022, 2, 1905–1914. [Google Scholar] [CrossRef]
  69. Abdulhamid, A.; Kabir, S.; Ghafir, I.; Lei, C. Reliability Assessment of IoT-enabled Systems using Fault Trees and Bayesian Networks. In Proceedings of the 5th International Conference on Advances in Distributed Computing and Machine Learning (ICADCML), Amaravati, India, 5–6 June 2024; pp. 1–10. [Google Scholar]
  70. Pearl, J. Probabilistic Reasoning in Intelligent Systems: Networks of Plausible Inference; Morgan Kaufmann: San Francisco, CA, USA, 1988. [Google Scholar]
  71. Xiao, Q.; Li, Y.; Luo, F.; Liu, H. Analysis and assessment of risks to public safety from unmanned aerial vehicles using fault tree analysis and Bayesian network. Technol. Soc. 2023, 73, 102229. [Google Scholar] [CrossRef]
  72. Kabir, S.; Aslansefat, K.; Sorokos, I.; Papadopoulos, Y.; Konur, S. A hybrid modular approach for dynamic fault tree analysis. IEEE Access 2020, 8, 97175–97188. [Google Scholar] [CrossRef]
  73. Kou, L.; Chu, B.; Chen, Y.; Qin, Y. An Automatic Partition Time-Varying Markov Model for Reliability Evaluation. Appl. Sci. 2022, 12, 5933. [Google Scholar] [CrossRef]
  74. Reisig, W. Petri Nets: An Introduction; Springer Science & Business Media: New York, NY, USA, 2012; Volume 4. [Google Scholar]
  75. Zurawski, R.; Zhou, M. Petri nets and industrial applications: A tutorial. IEEE Trans. Ind. Electron. 1994, 41, 567–583. [Google Scholar] [CrossRef]
  76. Kabir, S.; Azad, T.; Walker, M.; Gheraibia, Y. Reliability analysis of automated pond oxygen management system. In Proceedings of the 2015 18th International Conference on Computer and Information Technology (ICCIT), Dhaka, Bangladesh, 21–23 December 2015; IEEE: Toulouse, France, 2015; pp. 144–149. [Google Scholar]
  77. Wongvises, C.; Khurat, A.; Fall, D.; Kashihara, S. Fault tree analysis-based risk quantification of smart homes. In Proceedings of the 2nd International Conference on Information Technology (INCIT), Nakhonpathom, Thailand, 2–3 November 2017; IEEE: Toulouse, France, 2017; pp. 1–6. [Google Scholar]
  78. Wang, C.; Liu, Q.; Xing, L.; Guan, Q.; Yang, C.; Yu, M. Reliability analysis of smart home sensor systems subject to competing failures. Reliab. Eng. Syst. Saf. 2022, 221, 108327. [Google Scholar] [CrossRef]
  79. Silva, I.; Leandro, R.; Macedo, D.; Guedes, L.A. A dependability evaluation tool for the Internet of Things. Comput. Electr. Eng. 2013, 39, 2005–2018. [Google Scholar] [CrossRef]
  80. Silva, D.; Heideker, A.; Zyrianoff, I.D.; Kleinschmidt, J.H.; Roffia, L.; Soininen, J.P.; Kamienski, C.A. A management architecture for IoT smart solutions: Design and implementation. J. Netw. Syst. Manag. 2022, 30, 35. [Google Scholar] [CrossRef]
  81. Gao, D.X.; Hou, J.J.; Liang, K.; Yang, Q. Fault diagnosis system for electric vehicle charging devices based on fault tree analysis. In Proceedings of the 2018 37th Chinese Control Conference (CCC), Wuhan, China, 25–27 July 2018; IEEE: Toulouse, France, 2018; pp. 5055–5059. [Google Scholar]
  82. Rahman, M.M.; Abdulhamid, A.; Kabir, S. Qualitative Failure Analysis of IoT-enabled Industrial Fire Detection and Prevention System. In Proceedings of the 26th International Conference on Computer and Information Technology (ICCIT), Cox’s Bazar, Bangladesh, 13–15 December 2023; IEEE: Toulouse, France, 2023; pp. 1–6. [Google Scholar]
  83. Dai, W.; Riliskis, L.; Wang, P.; Vyatkin, V.; Guan, X. A cloud-based decision support system for self-healing in distributed automation systems using fault tree analysis. IEEE Trans. Ind. Informatics 2018, 14, 989–1000. [Google Scholar] [CrossRef]
  84. Chen, Y.; Zhen, Z.; Yu, H.; Xu, J. Application of fault tree analysis and fuzzy neural networks to fault diagnosis in the internet of things (IoT) for aquaculture. Sensors 2017, 17, 153. [Google Scholar] [CrossRef]
  85. Ruijters, E.; Stoelinga, M. Fault tree analysis: A survey of the state-of-the-art in modeling, analysis and tools. Comput. Sci. Rev. 2015, 15, 29–62. [Google Scholar] [CrossRef]
  86. Bell, R. Introduction and Revision of IEC 61508. In Proceedings of the Advances in Systems Safety: Proceedings of the Nineteenth Safety-Critical Systems Symposium, Southampton, UK, 8–10 February 2011; Springer: Berlin/Heidelberg, Germany, 2010; pp. 273–291. [Google Scholar]
  87. Kaiser, B.; Liggesmeyer, P.; Mäckel, O. A New Component Concept for Fault Trees. In Proceedings of the 8th Australian Workshop on Safety Critical Systems and Software (SCS’03), Canberra, ACT, Australia, 9–10 October 2003; Volume 33, pp. 37–46. [Google Scholar]
  88. Papadopoulos, Y.; Walker, M.; Parker, D.; Sharvia, S.; Bottaci, L.; Kabir, S.; Azevedo, L.; Sorokos, I. A synthesis of logic and bio-inspired techniques in the design of dependable systems. Annu. Rev. Control 2016, 41, 170–182. [Google Scholar] [CrossRef]
  89. Nordmann, A.; Munk, P. Lessons learned from model-based safety assessment with SysML and component fault trees. In Proceedings of the 21th ACM/IEEE International Conference on Model Driven Engineering Languages and Systems, Copenhagen, Denmark, 14–19 October 2018; pp. 134–143. [Google Scholar]
  90. Kabir, S.; Walker, M.; Papadopoulos, Y. Dynamic system safety analysis in HiP-HOPS with Petri nets and Bayesian networks. Saf. Sci. 2018, 105, 55–70. [Google Scholar] [CrossRef]
  91. Mian, Z.; Bottaci, L.; Papadopoulos, Y.; Biehl, M. System dependability modelling and analysis using AADL and HiP-HOPS. IFAC Proc. Vol. 2012, 45, 1647–1652. [Google Scholar] [CrossRef]
  92. Wang, H.; Zhong, D.; Zhao, T.; Ren, F. Integrating model checking with SysML in complex system safety analysis. IEEE Access 2019, 7, 16561–16571. [Google Scholar] [CrossRef]
  93. Mhenni, F.; Nguyen, N.; Choley, J.Y. SafeSysE: A safety analysis integration in systems engineering approach. IEEE Syst. J. 2016, 12, 161–172. [Google Scholar] [CrossRef]
Figure 1. Example of a Petri Net model.
Electronics 13 01156 g001
Figure 2. Example of a fault tree.
Electronics 13 01156 g002
Figure 3. SysML Diagrams.
Electronics 13 01156 g003
Figure 4. Proposed MBSA framework.
Electronics 13 01156 g004
Figure 5. Architecture of an IoT-based Smart Irrigation System.
Electronics 13 01156 g005
Figure 6. Block definition diagram model of an IoT-based Smart Irrigation System.
Electronics 13 01156 g006
Figure 7. Internal block diagram model of an IoT-based Smart Irrigation System.
Electronics 13 01156 g007
Figure 8. Example of failure annotation, (a) failure annotation of a temperature sensor and (b) failure annotation of a power source.
Electronics 13 01156 g008
Figure 9. Mapping of component state machine diagram to component fault tree for (a) a temperature sensor and (b) a power source.
Electronics 13 01156 g009
Figure 10. Fault tree generated for IoT-enabled SIS.
Electronics 13 01156 g010
Table 1. Strengths of Fault Tree Analysis Approach.
SerStrengthsDescription
1.Systematic ApproachFTA provides a structured and systematic method for analysing potential failures in a system and helps to identify the root causes of failures in a logical manner.
2.Visual RepresentationIt uses a tree-like structure that helps visualise the relationships between different events and their contributions to system failure.
3.Facilitates CommunicationThe graphical nature of FTA facilitates communication among stakeholders, making it easier to convey complex system failure scenarios and their implications.
4.Root Cause AnalysisFTA helps identify system failure’s root causes.
5.Identifying Critical PathsFTA helps to identify critical paths or combinations of events that may lead to system failure.
6.Quantitative and Qualitative AnalysisFTA can be used for both qualitative analysis (identifying failure paths) and quantitative analysis (estimating probabilities of failure events).
7.Early Detection of IssuesPotential issues and vulnerabilities can be identified during the design phase, allowing for proactive risk mitigation.
8.Continuous ImprovementFTA can be applied iterative throughout the design and operational phases, allowing for continuous improvement in system reliability by addressing identified vulnerabilities.
9.Supports Risk ManagementIt is widely used in risk assessment to evaluate the likelihood and consequences of potential system failures.
10.Facilitates Decision MakingFTA supports decision-making processes related to system design, maintenance, and risk mitigation.
11.VersatilityFTA can be applied to various systems, including engineering systems, industrial processes, and complex projects.
12.Integration with Other MethodsFTA can be integrated with other analysis methods, such as FMEA, to provide a more comprehensive understanding of system reliability and safety.
Table 2. Overview of some of the Notable UML/SysML Diagrams.
SerSysML DiagramsFeatures/Functions
1.Activity DiagramIllustrates the system’s behaviour, control flow, object flow, decision, and end process.
2.State Machine DiagramModel the various states of a system and the transitions between them. They can represent single or parallel states, including initial, idle, active, and standby.
3.Sequence DiagramModel sequencing or order of the system’s operations.
4.Timing DiagramRepresents the hierarchy of timings in which a system executes actions.
5.Use Case DiagramModel how users (actors) can use the system or corroborate with one another.
6.Class DiagramSoftware or hardware model classes, each with a name and attributes, depict the structure of the system design in terms of classes and constraints.
7.Block Definition DiagramPresent the structure and hierarchy of a system block (software/hardware) through classes and constraints. Describe generalisation (inheritance between classes), aggregation, and dependencies.
8.Internal Block DiagramModel the internal structure of a system and how components block exchange information.
9.Component DiagramModel components in the system and their interface (how they can be connected).
10.Parametric DiagramModel parametric constraints between blocks.
11.Requirement DiagramModel system operation requirements and the interrelationships between its various elements.
12.Package DiagramModel is organised into packages, views, and viewpoints.
Disclaimer/Publisher’s Note: The statements, opinions and data contained in all publications are solely those of the individual author(s) and contributor(s) and not of MDPI and/or the editor(s). MDPI and/or the editor(s) disclaim responsibility for any injury to people or property resulting from any ideas, methods, instructions or products referred to in the content.

