
Data-Driven Controller for Drivers’ Steering-Wheel Operating Behaviour in Haptic Assistive Driving System

Abstract
:1. Introduction
2. Relevant Works
2.1. Artificial Neural Network Model for Driving Behaviours
2.2. Optimising PID Controllers Using GA
3. Proposed Data-Driven Controller
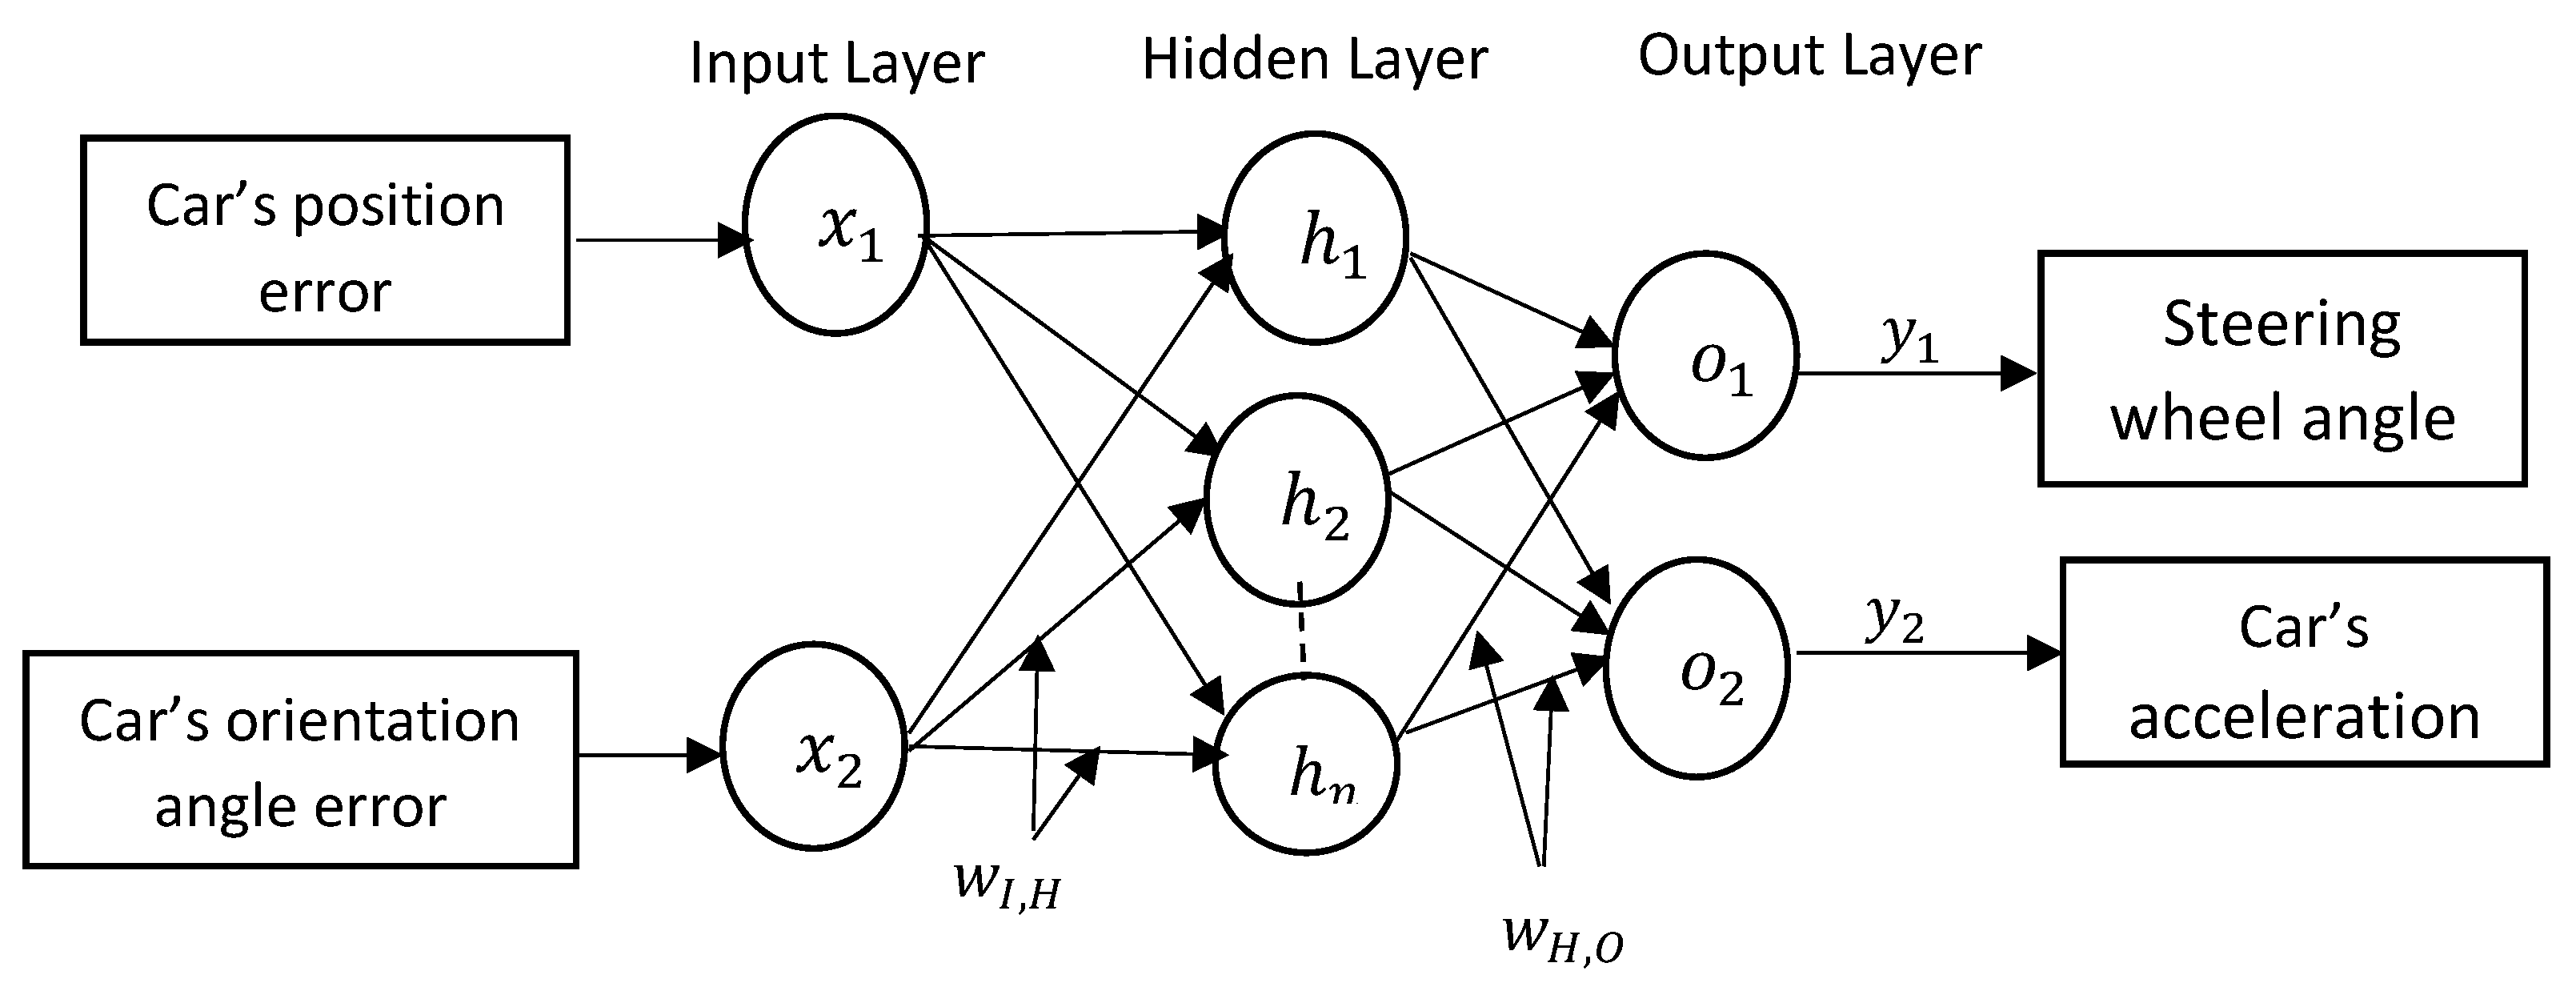
3.1. Modelling Driving Behaviour Using BPNN
3.1.1. Data
- Input and output data
- Training, validating and testing data
3.1.2. Data Processing: Normalised and Denormalised Data
- Z-score normalisation technique
- Denormalisation technique
3.2. GA-PID Structure for Controller Design
Genetic Algorithm
- Fitness Function
- Selection
- Cross-over
- Mutation
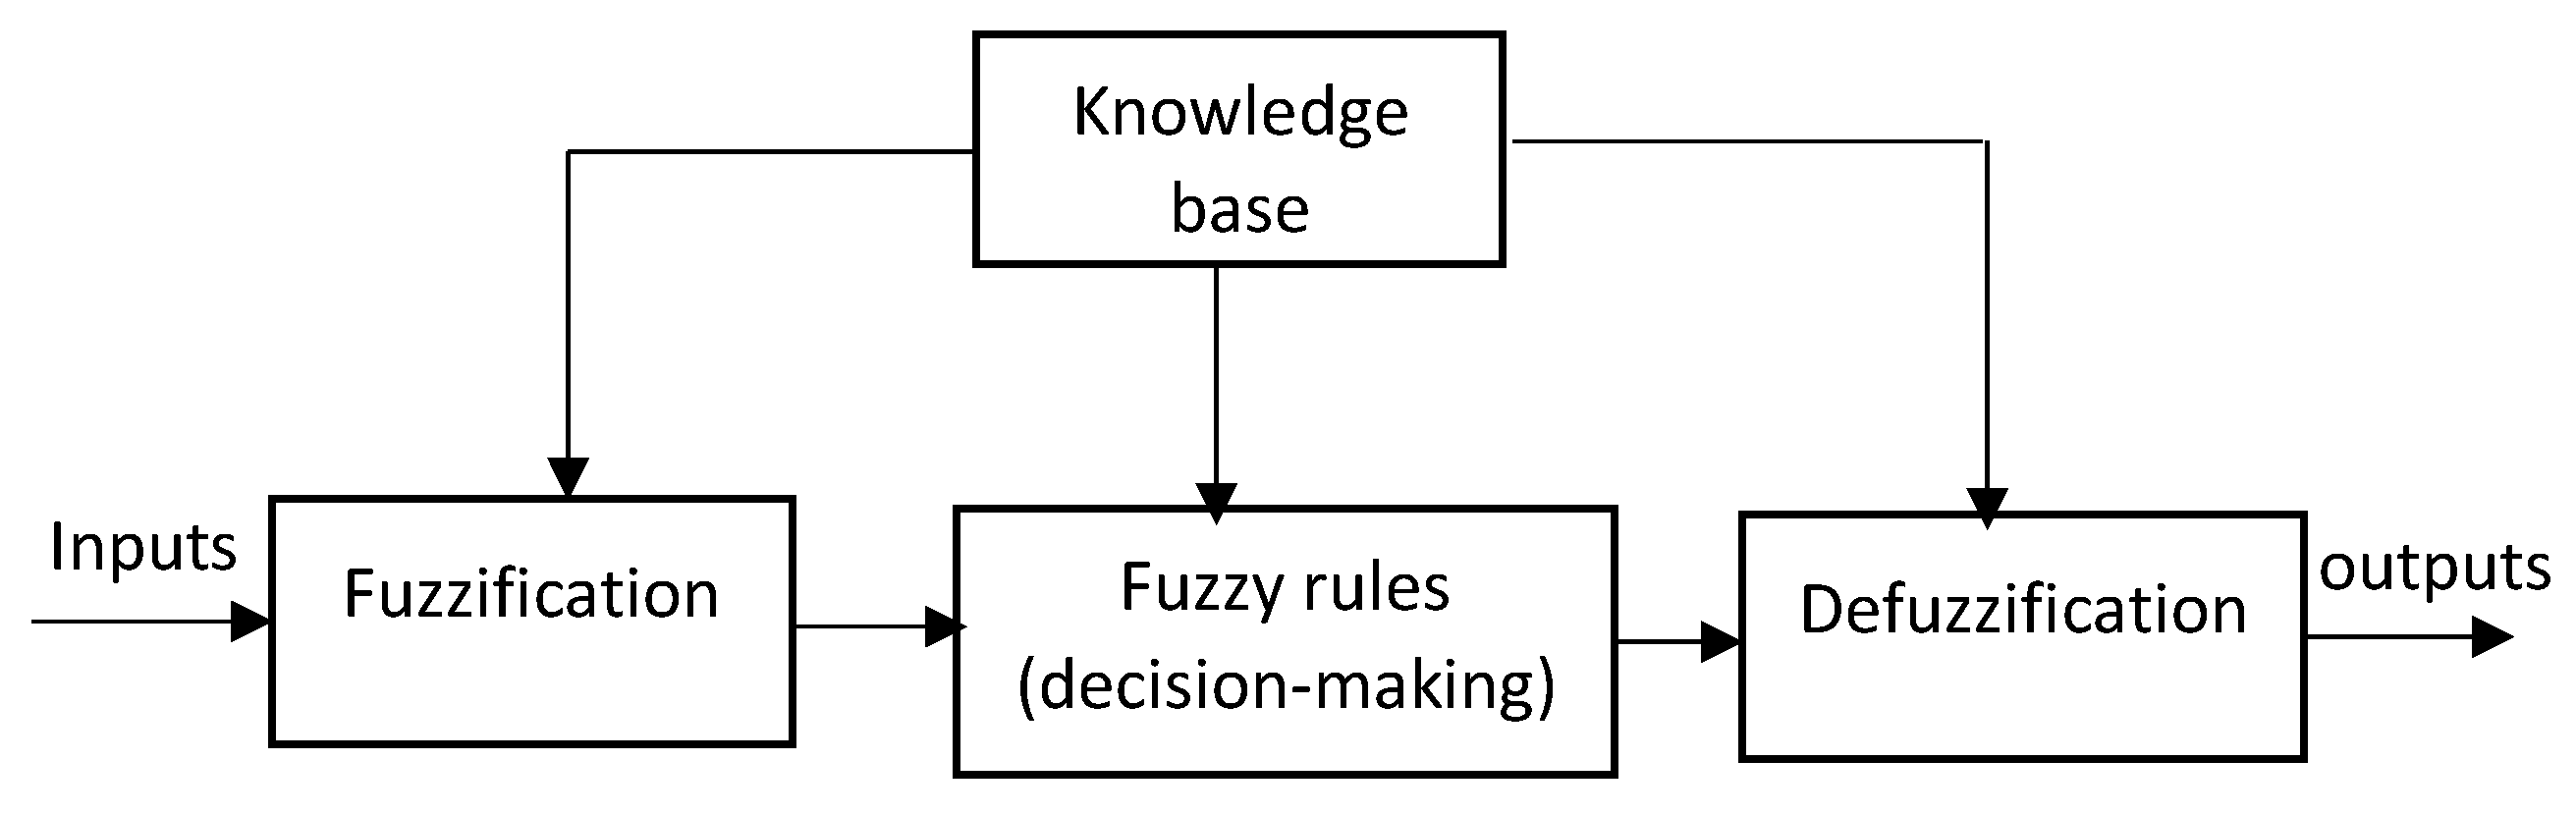
3.3. Fuzzy-PID Controller
3.3.1. Fuzzification
3.3.2. Fuzzy Rule Base
3.3.3. Defuzzification
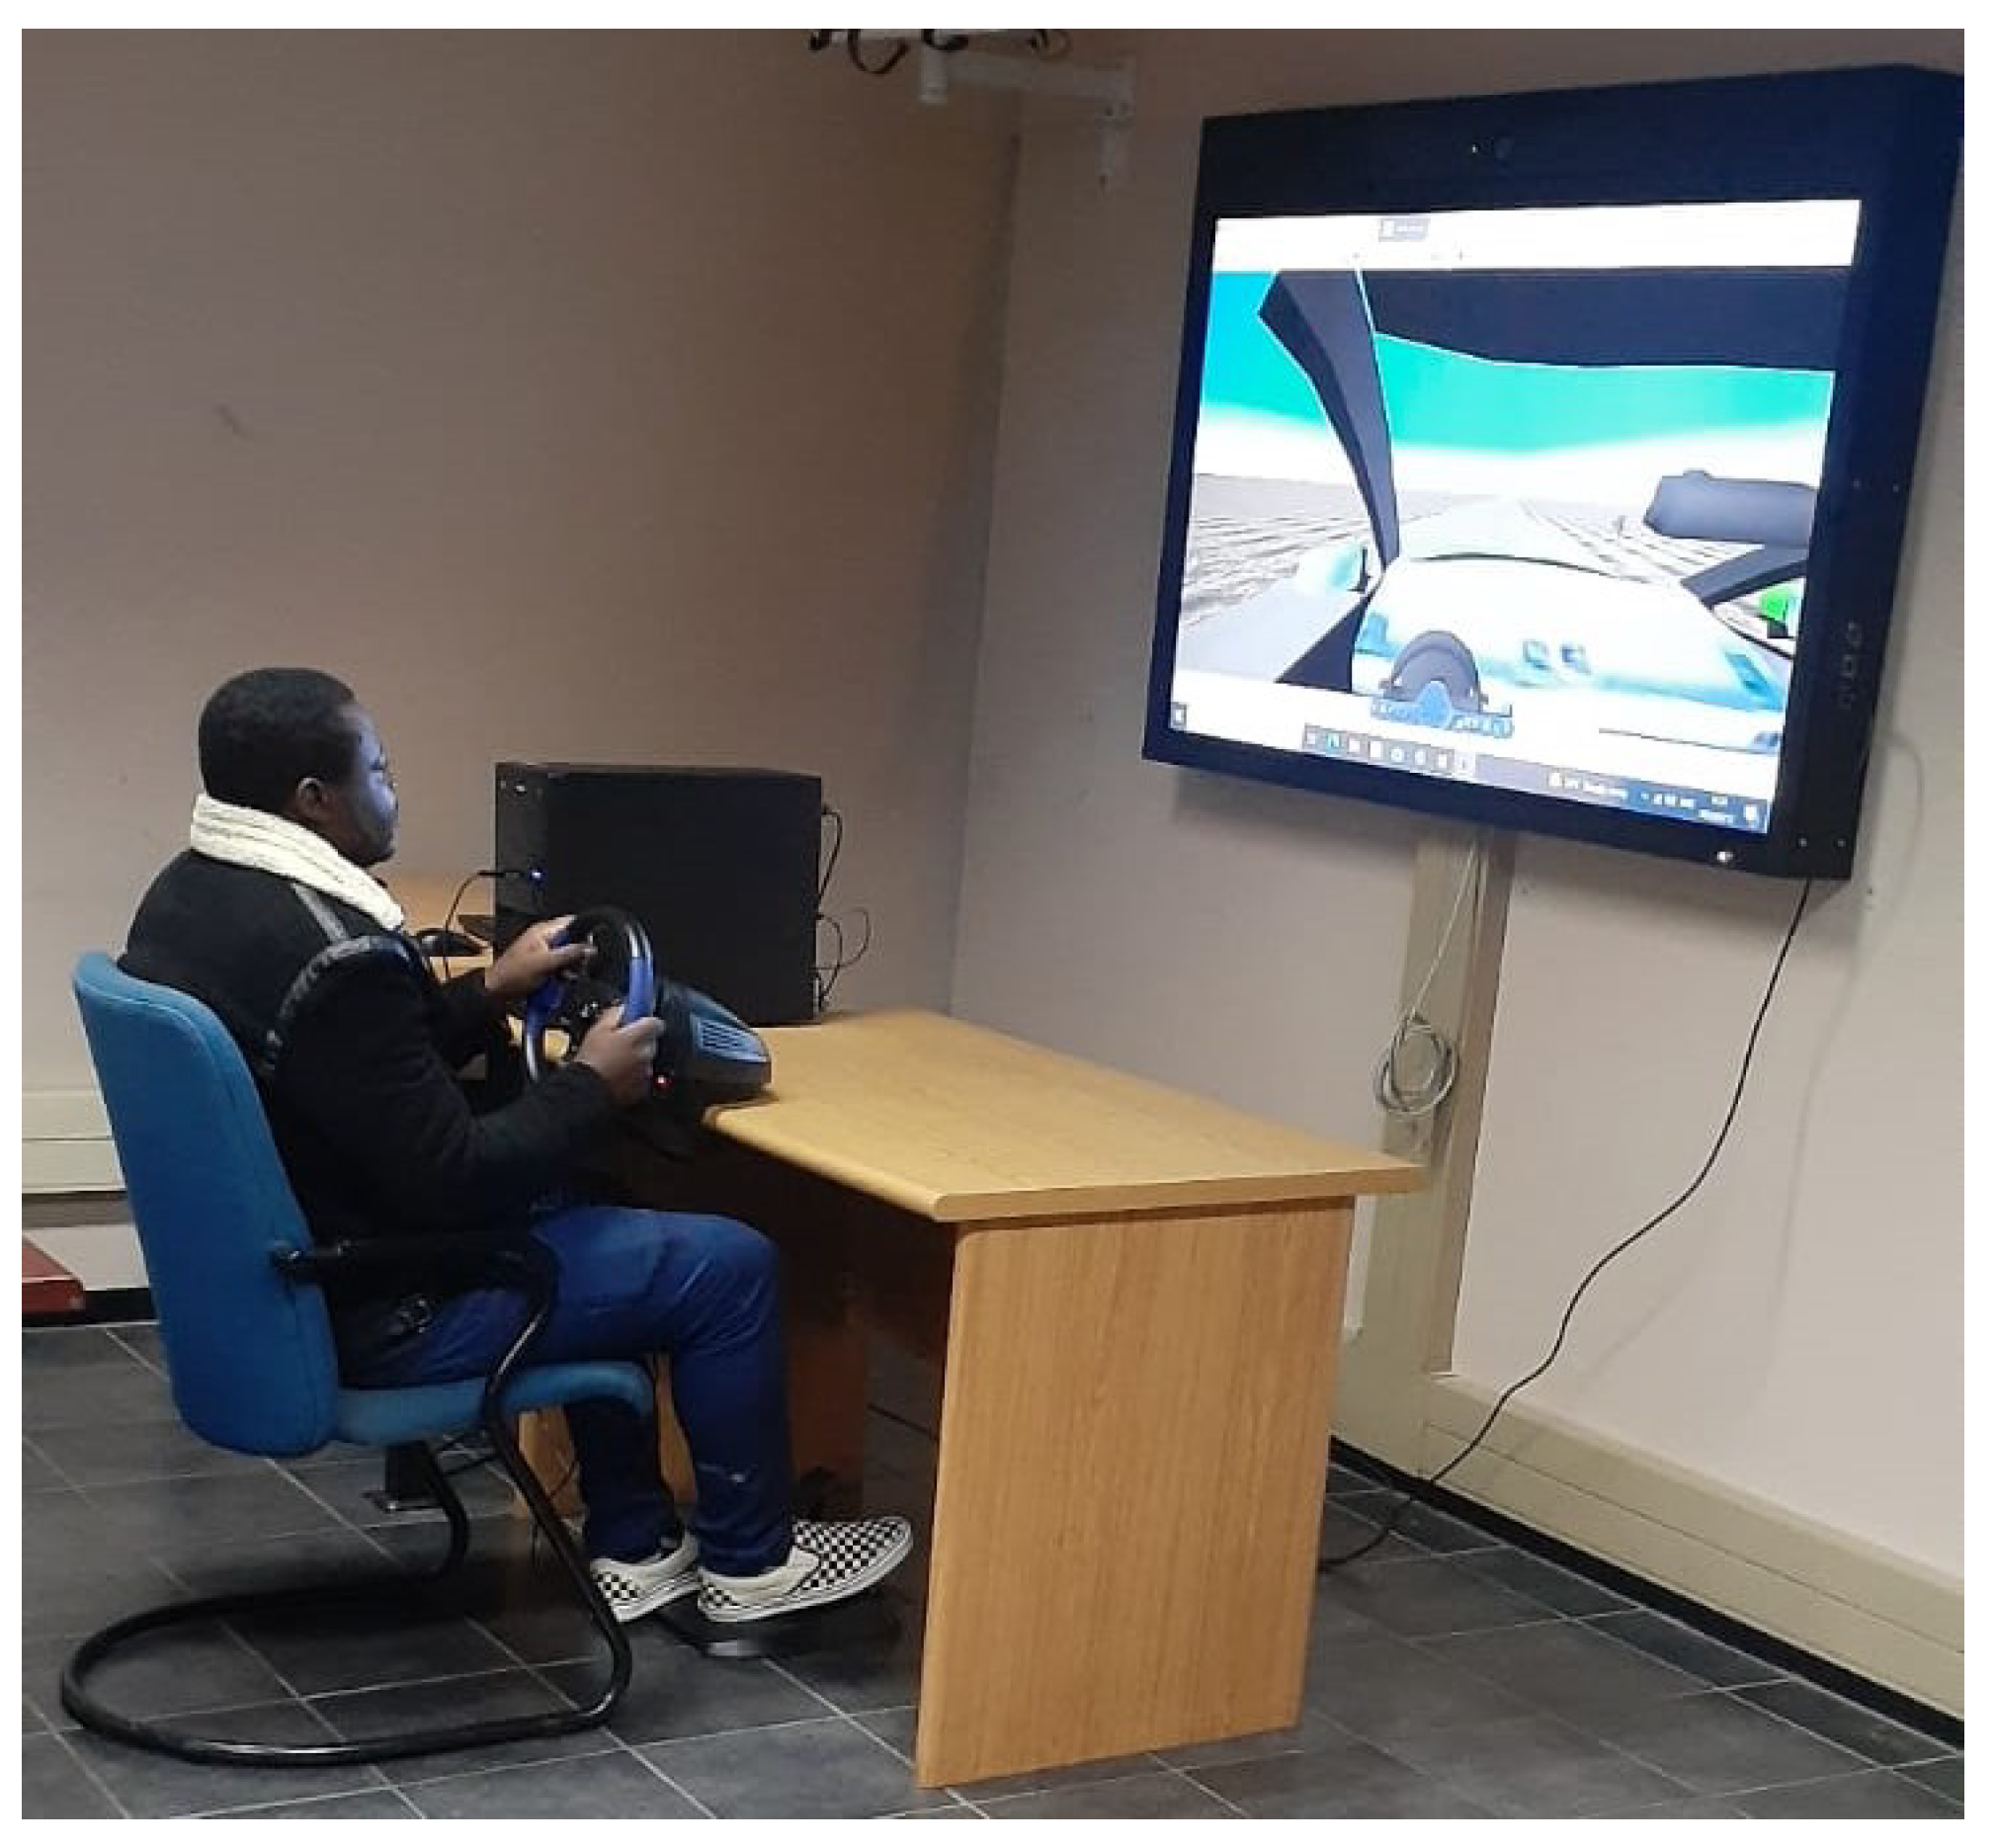
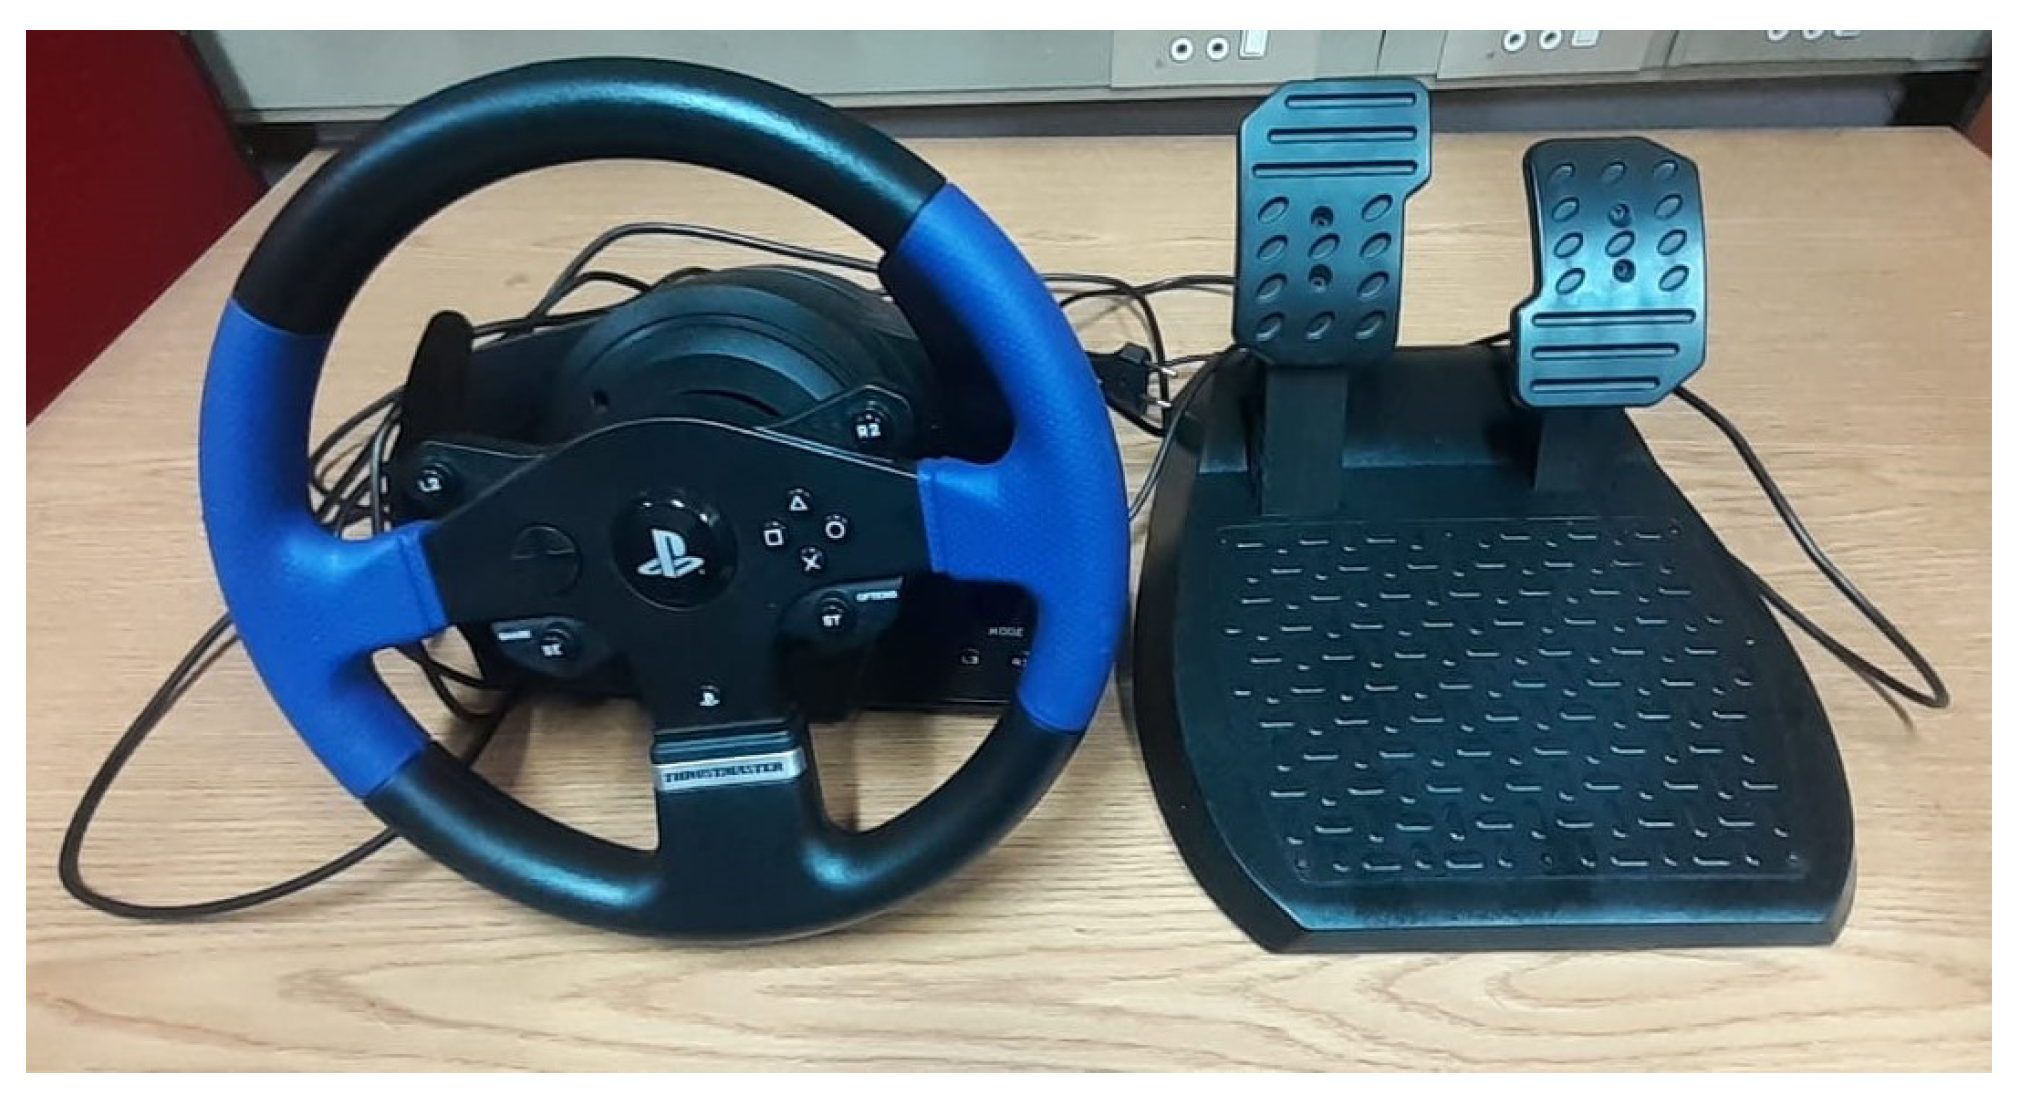
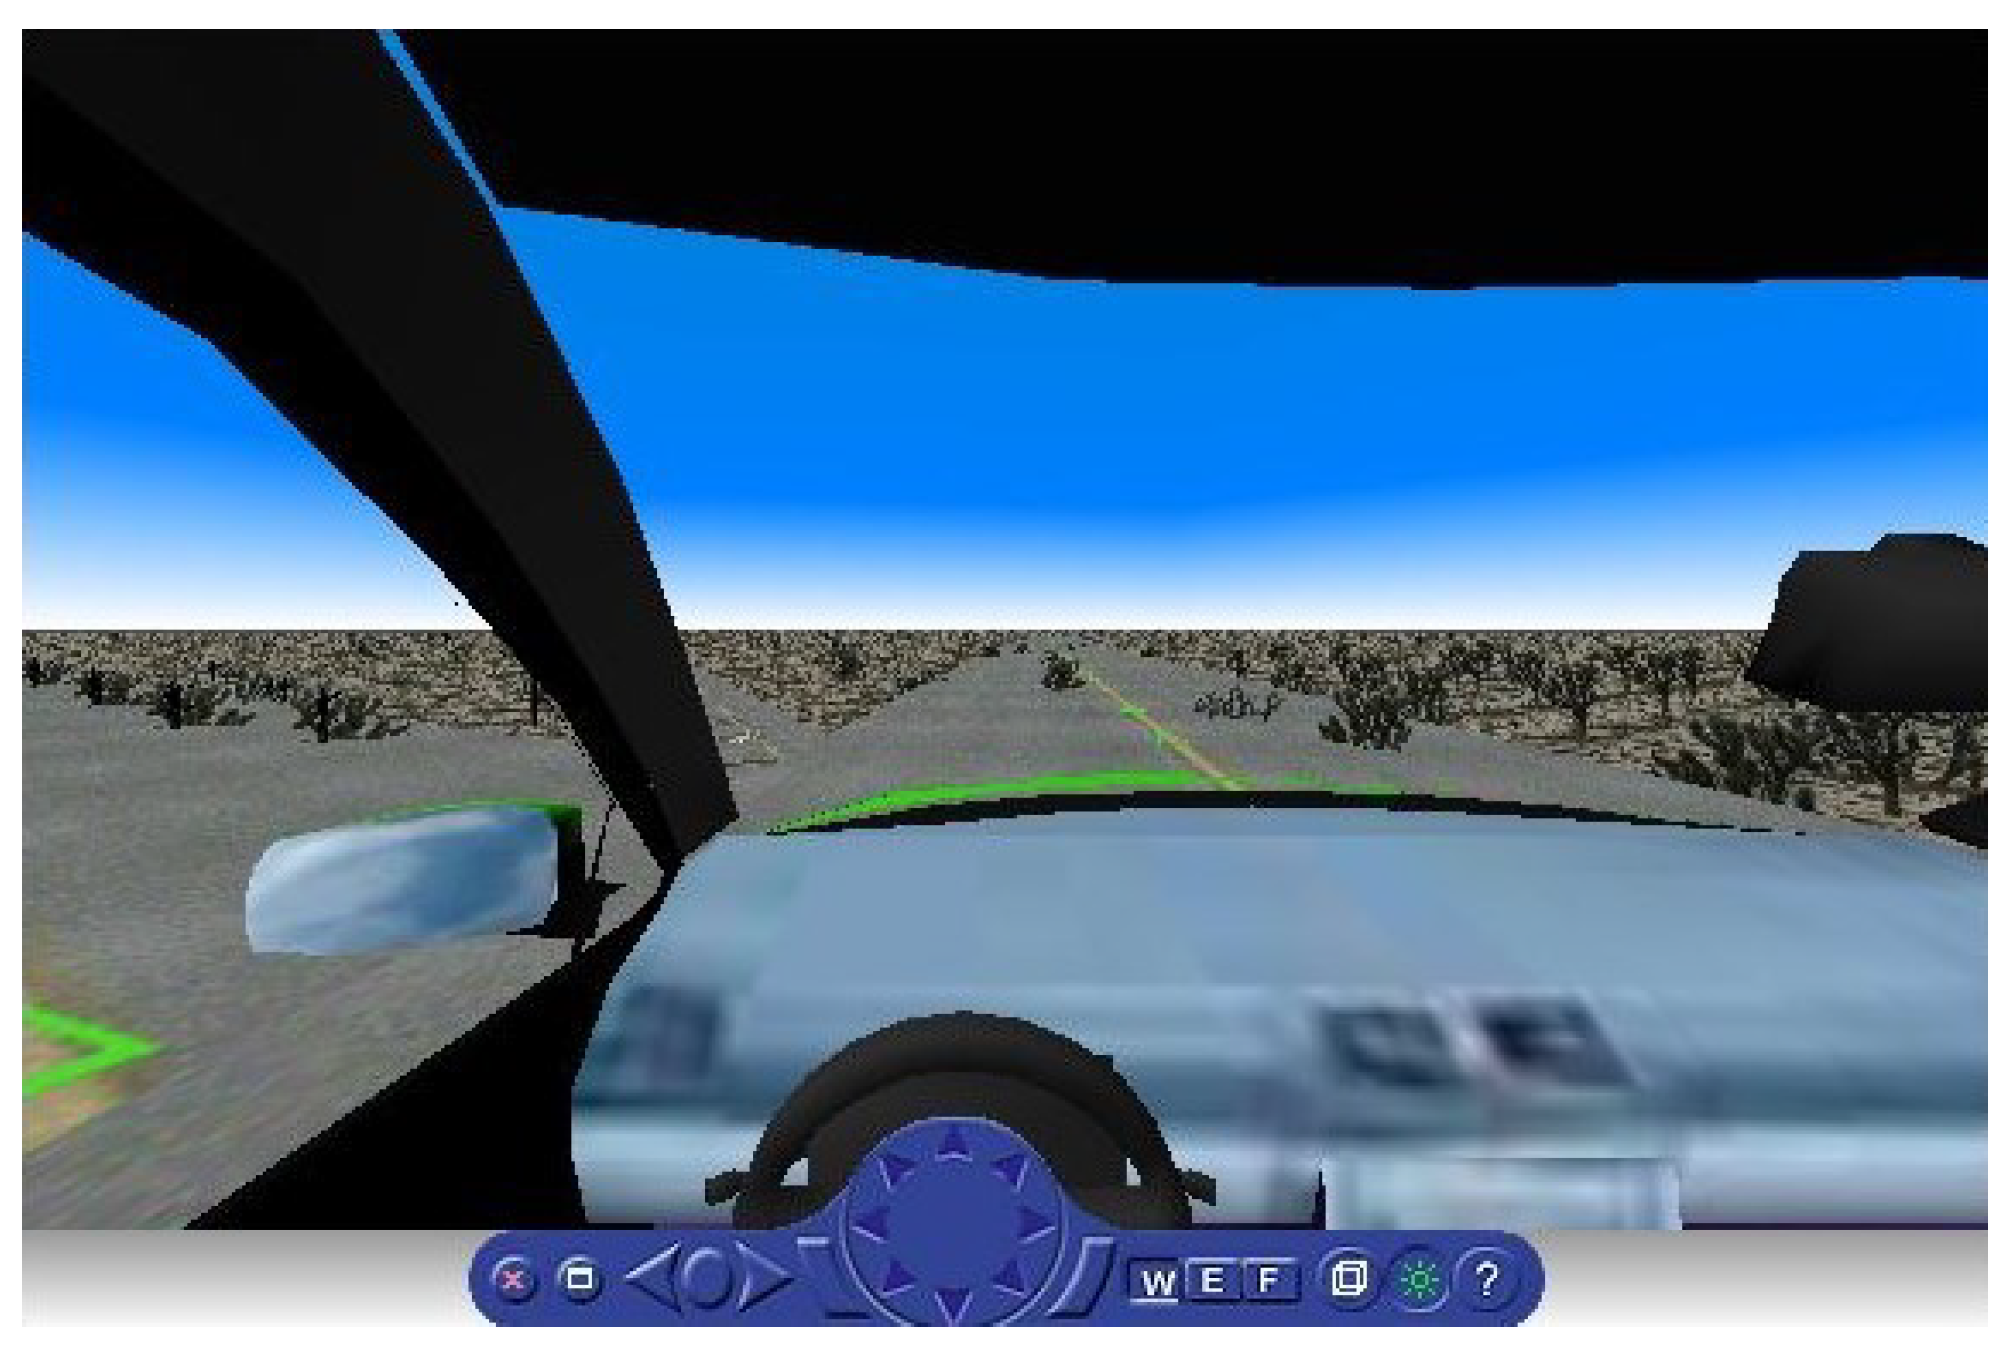
4. Experiment Set up and Driving Simulator
4.1. Driving Simulator
4.2. Computation Resources
5. Simulation and Results
5.1. Driving Behaviour Using BPNN
5.1.1. Offline GA-PID Parameter Results
5.1.2. ITAE for Car’s Position Based on GA-PID Controller
5.1.3. ITAE for Car’s Orientation Based on GA-PID Controller
5.2. Applied Fuzzy-PID
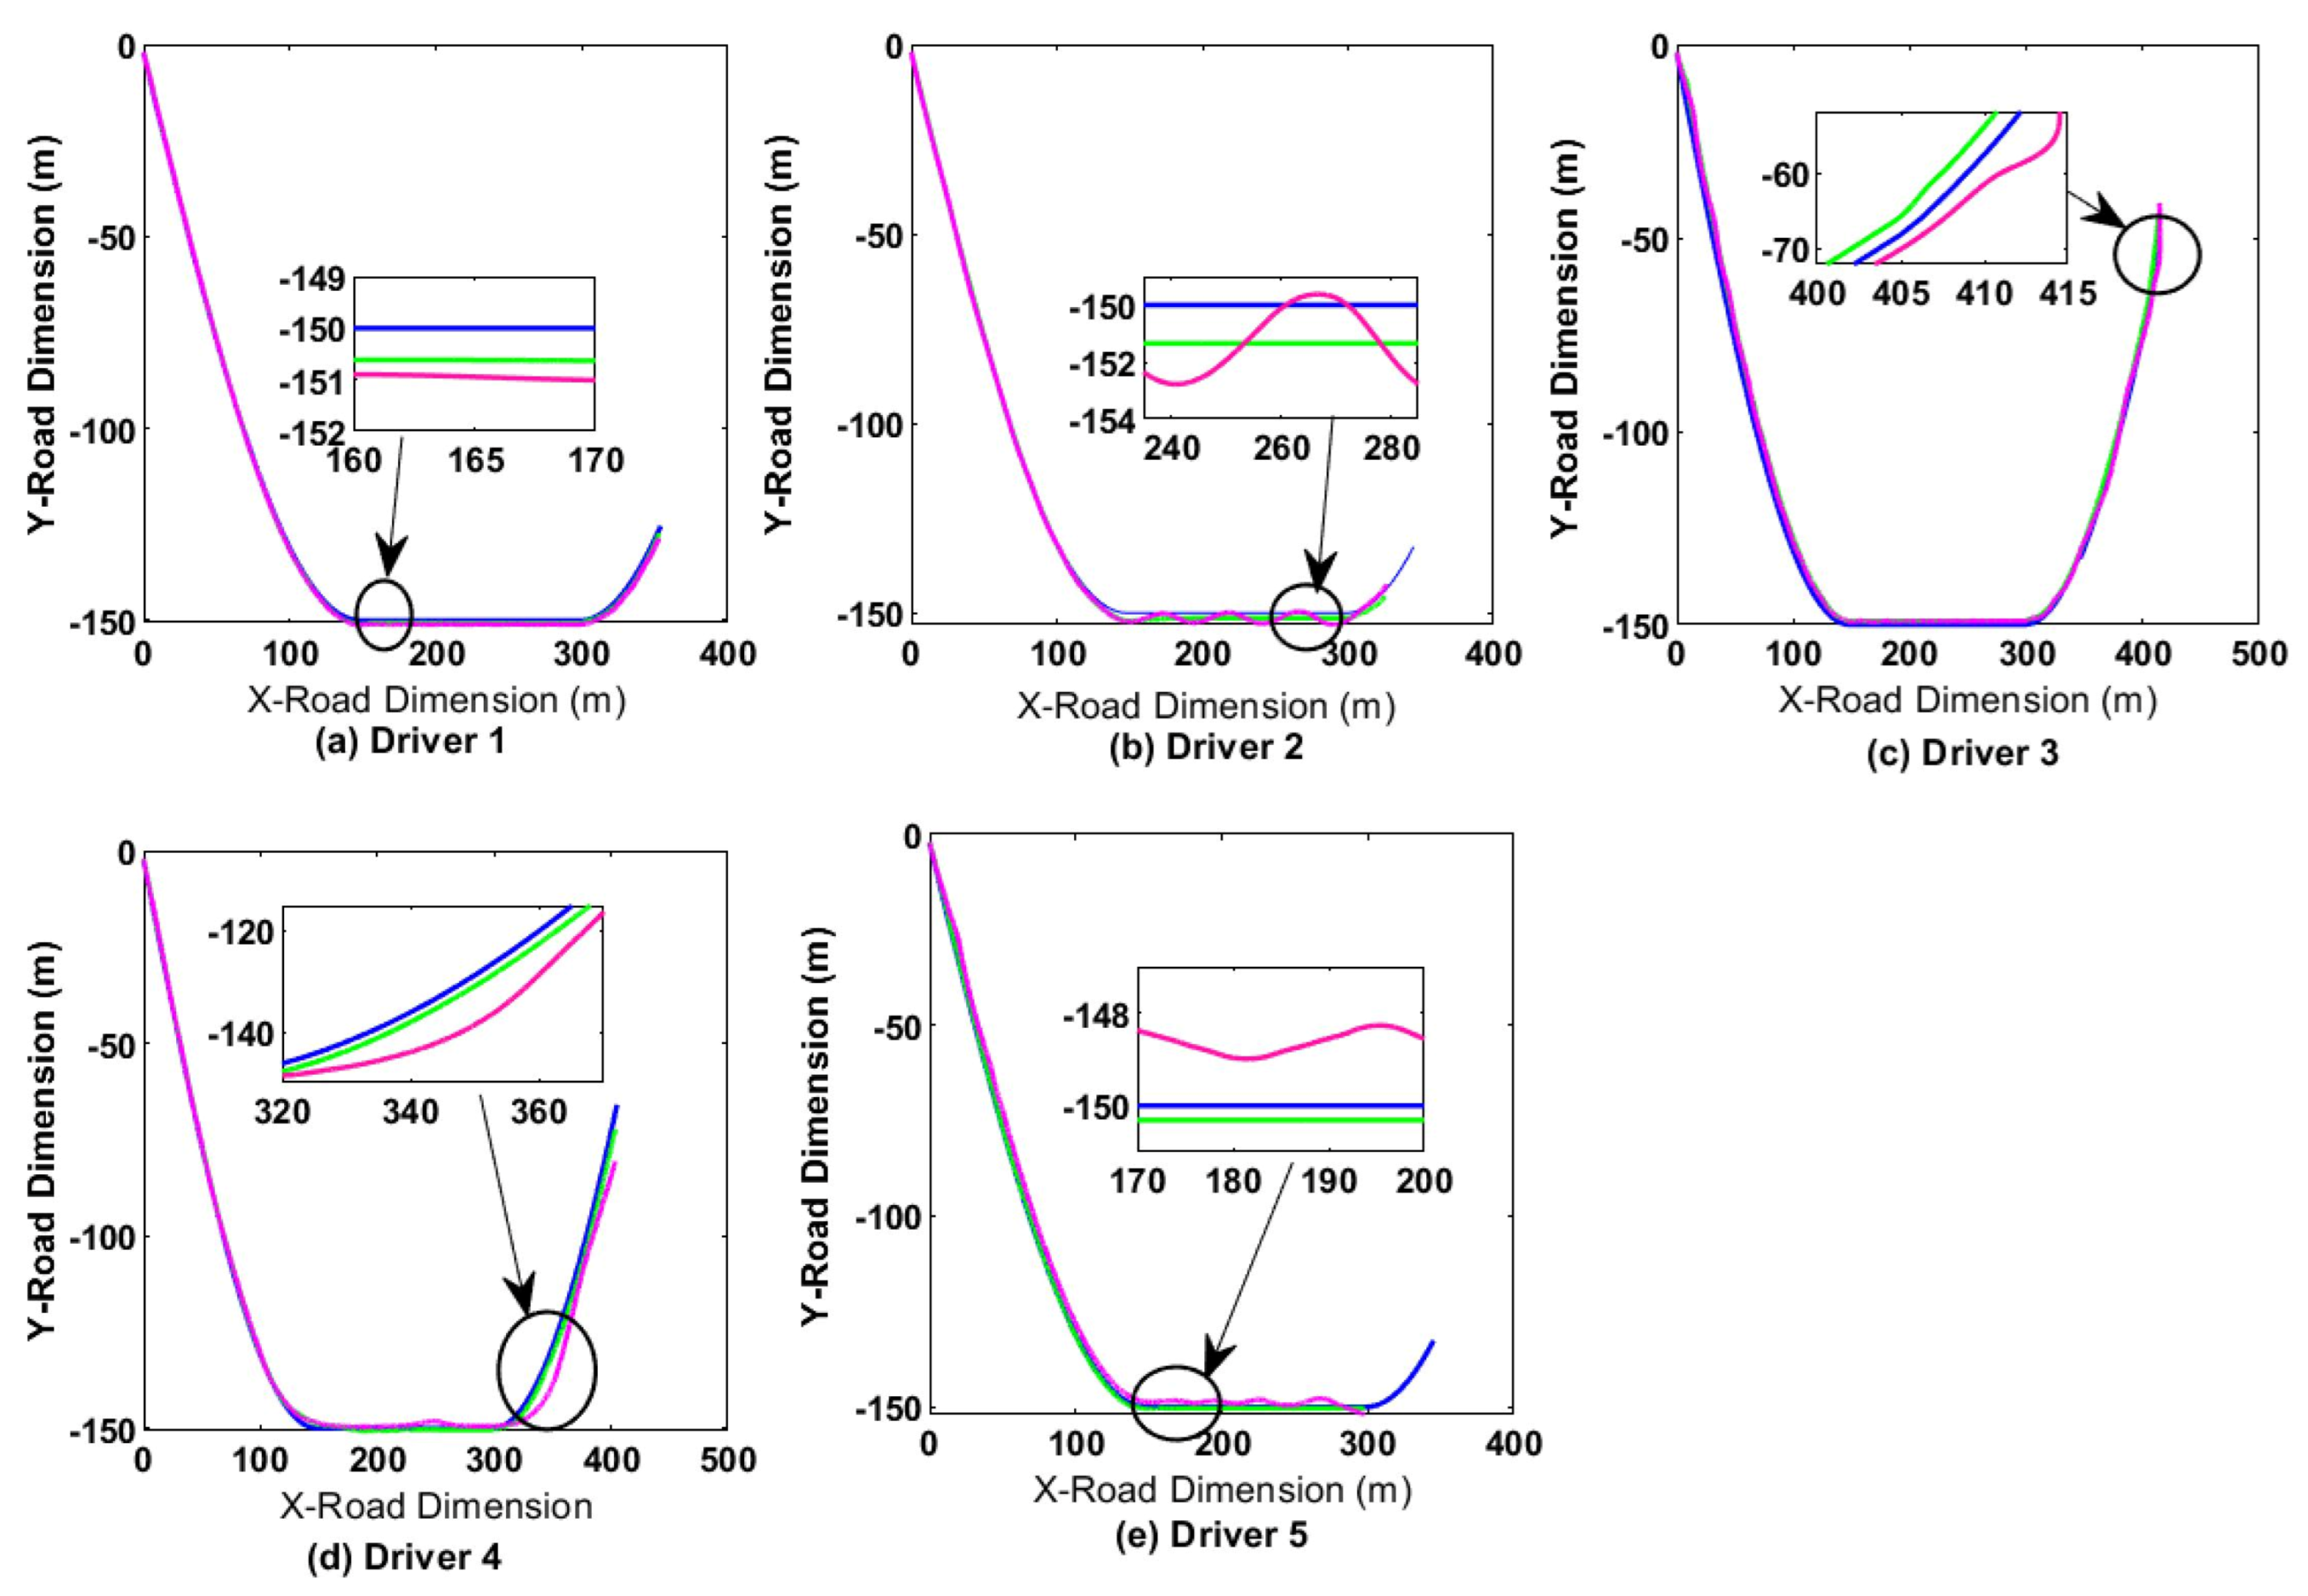
5.3. Driving Results
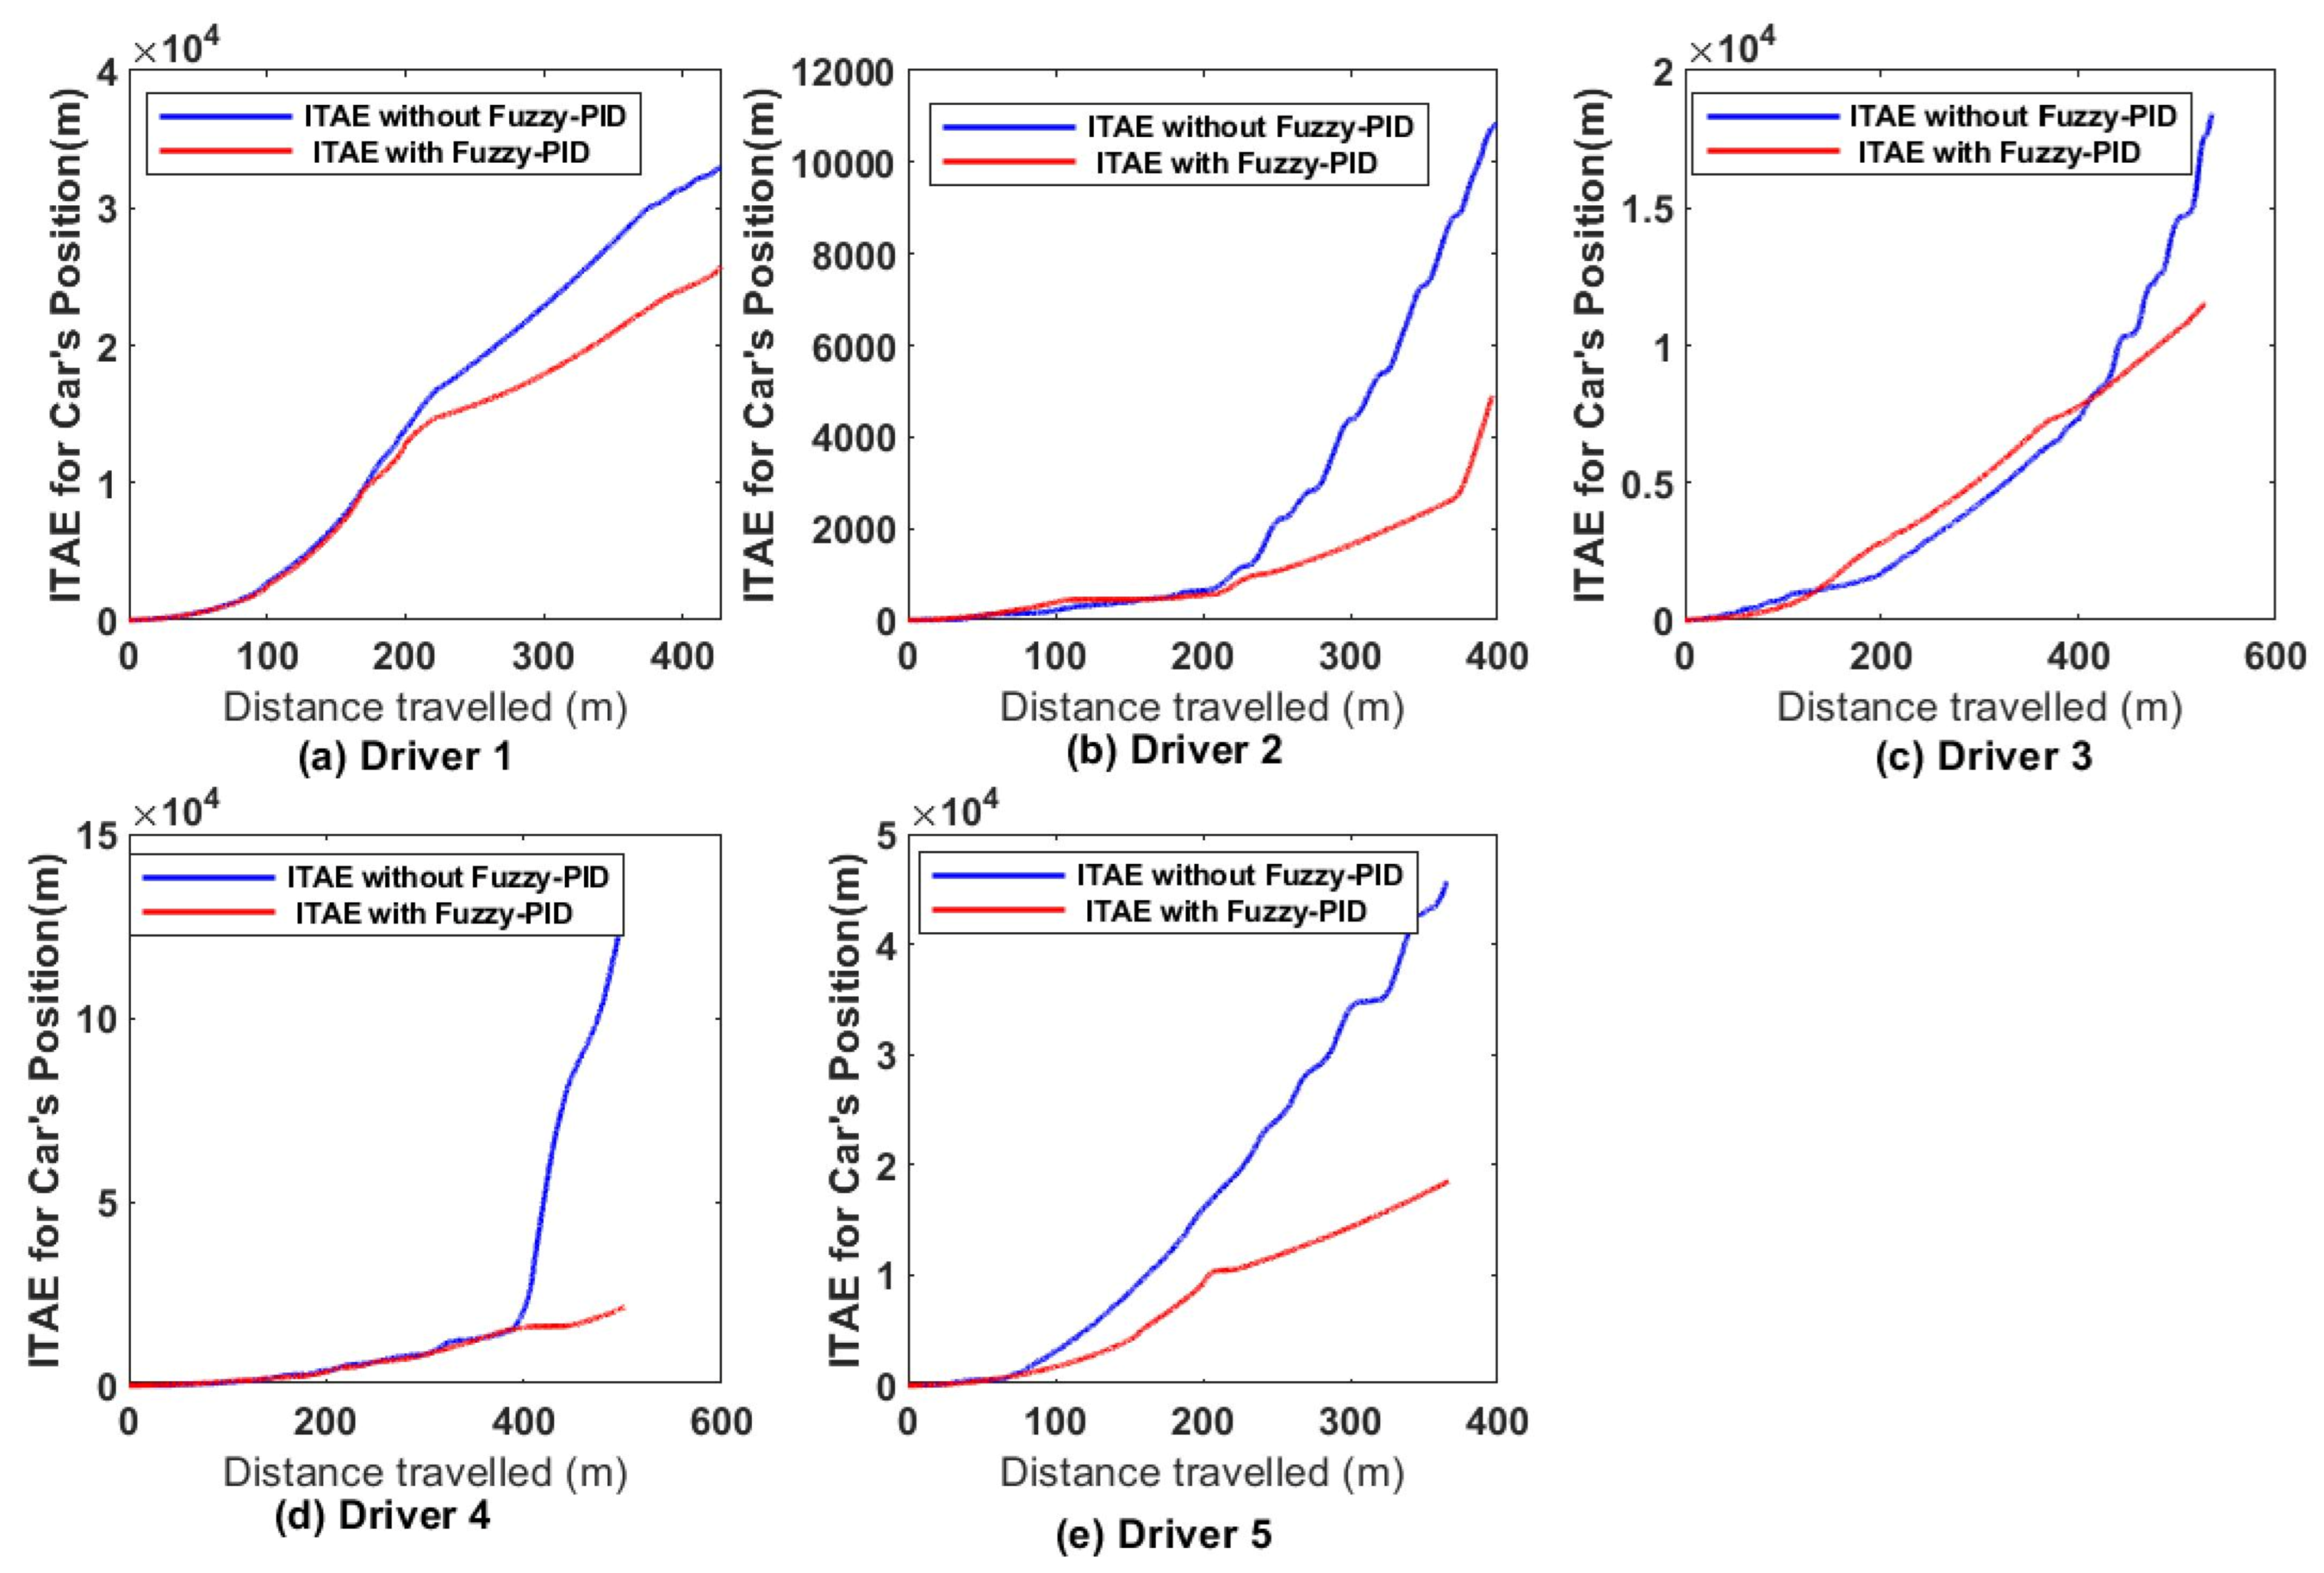
5.4. Integral Time Absolute Error (ITAE) for Car Position
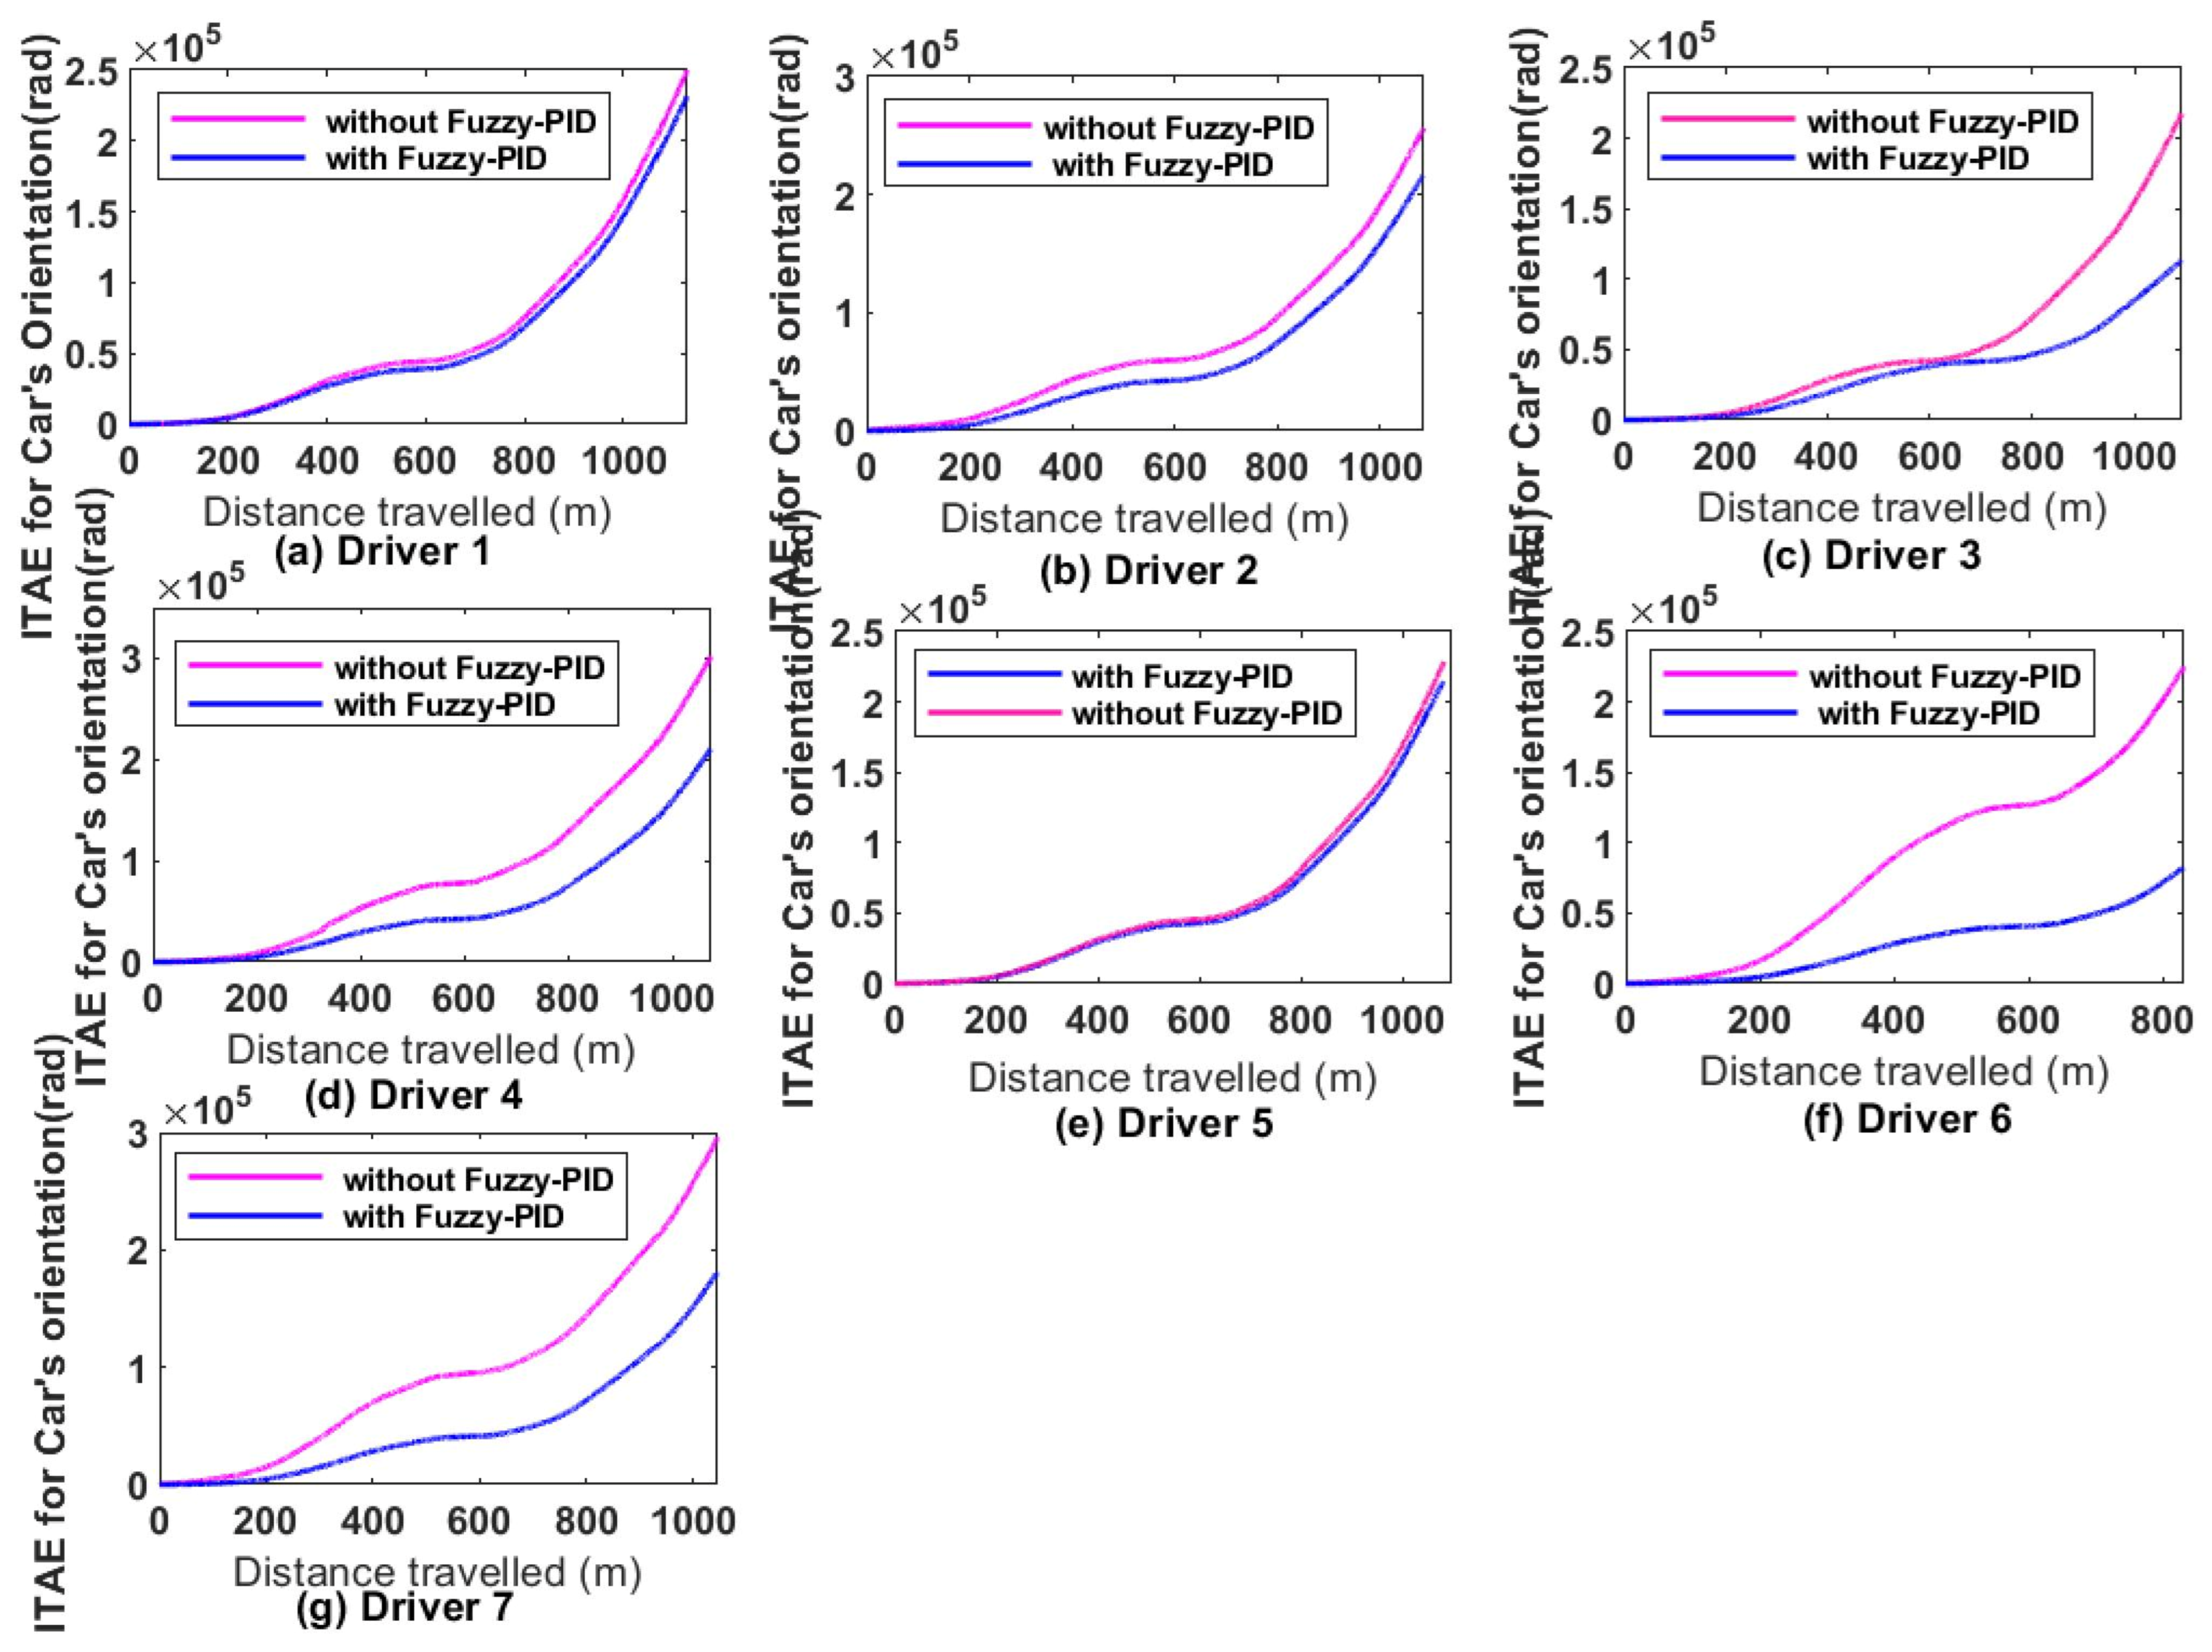
5.5. Integral Time Absolute Error (ITAE) for Car Orientation
5.6. Haptic Feedback Torque
5.7. Performance Analysis between the Proposed Controller and the GA-PID
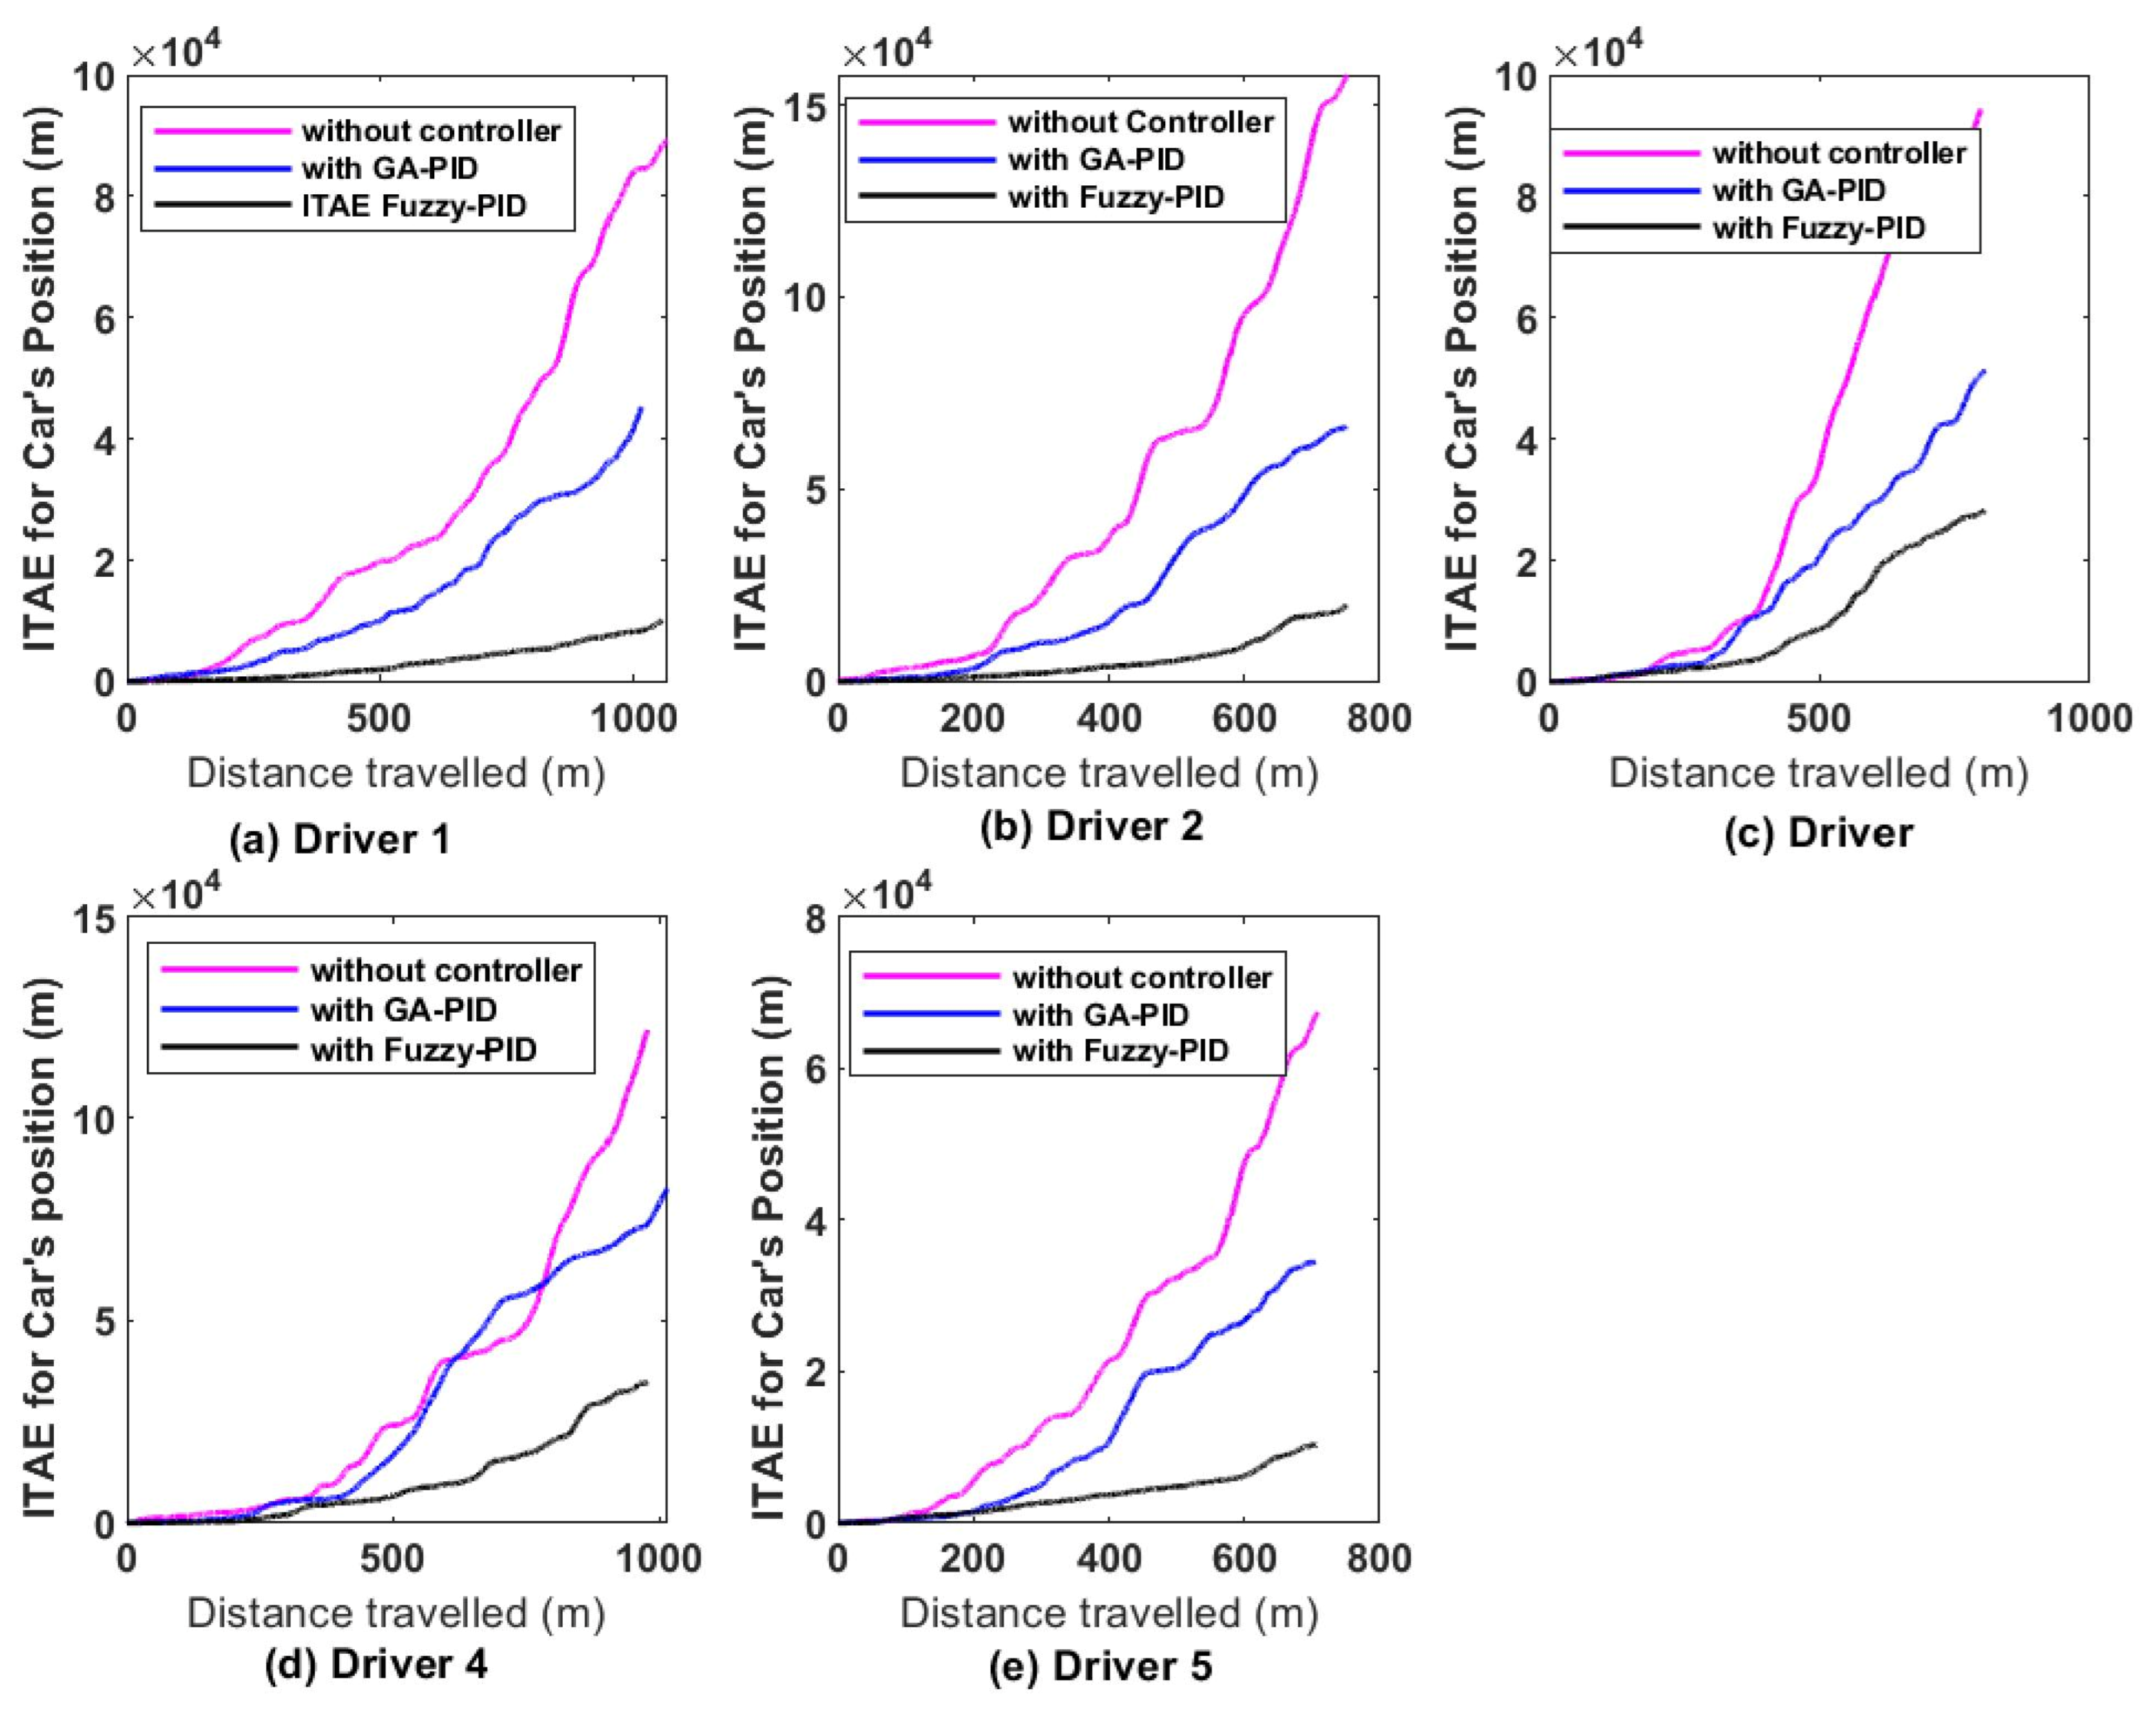
5.7.1. ITAE between the Proposed Controller and the GA-PID for Car Position
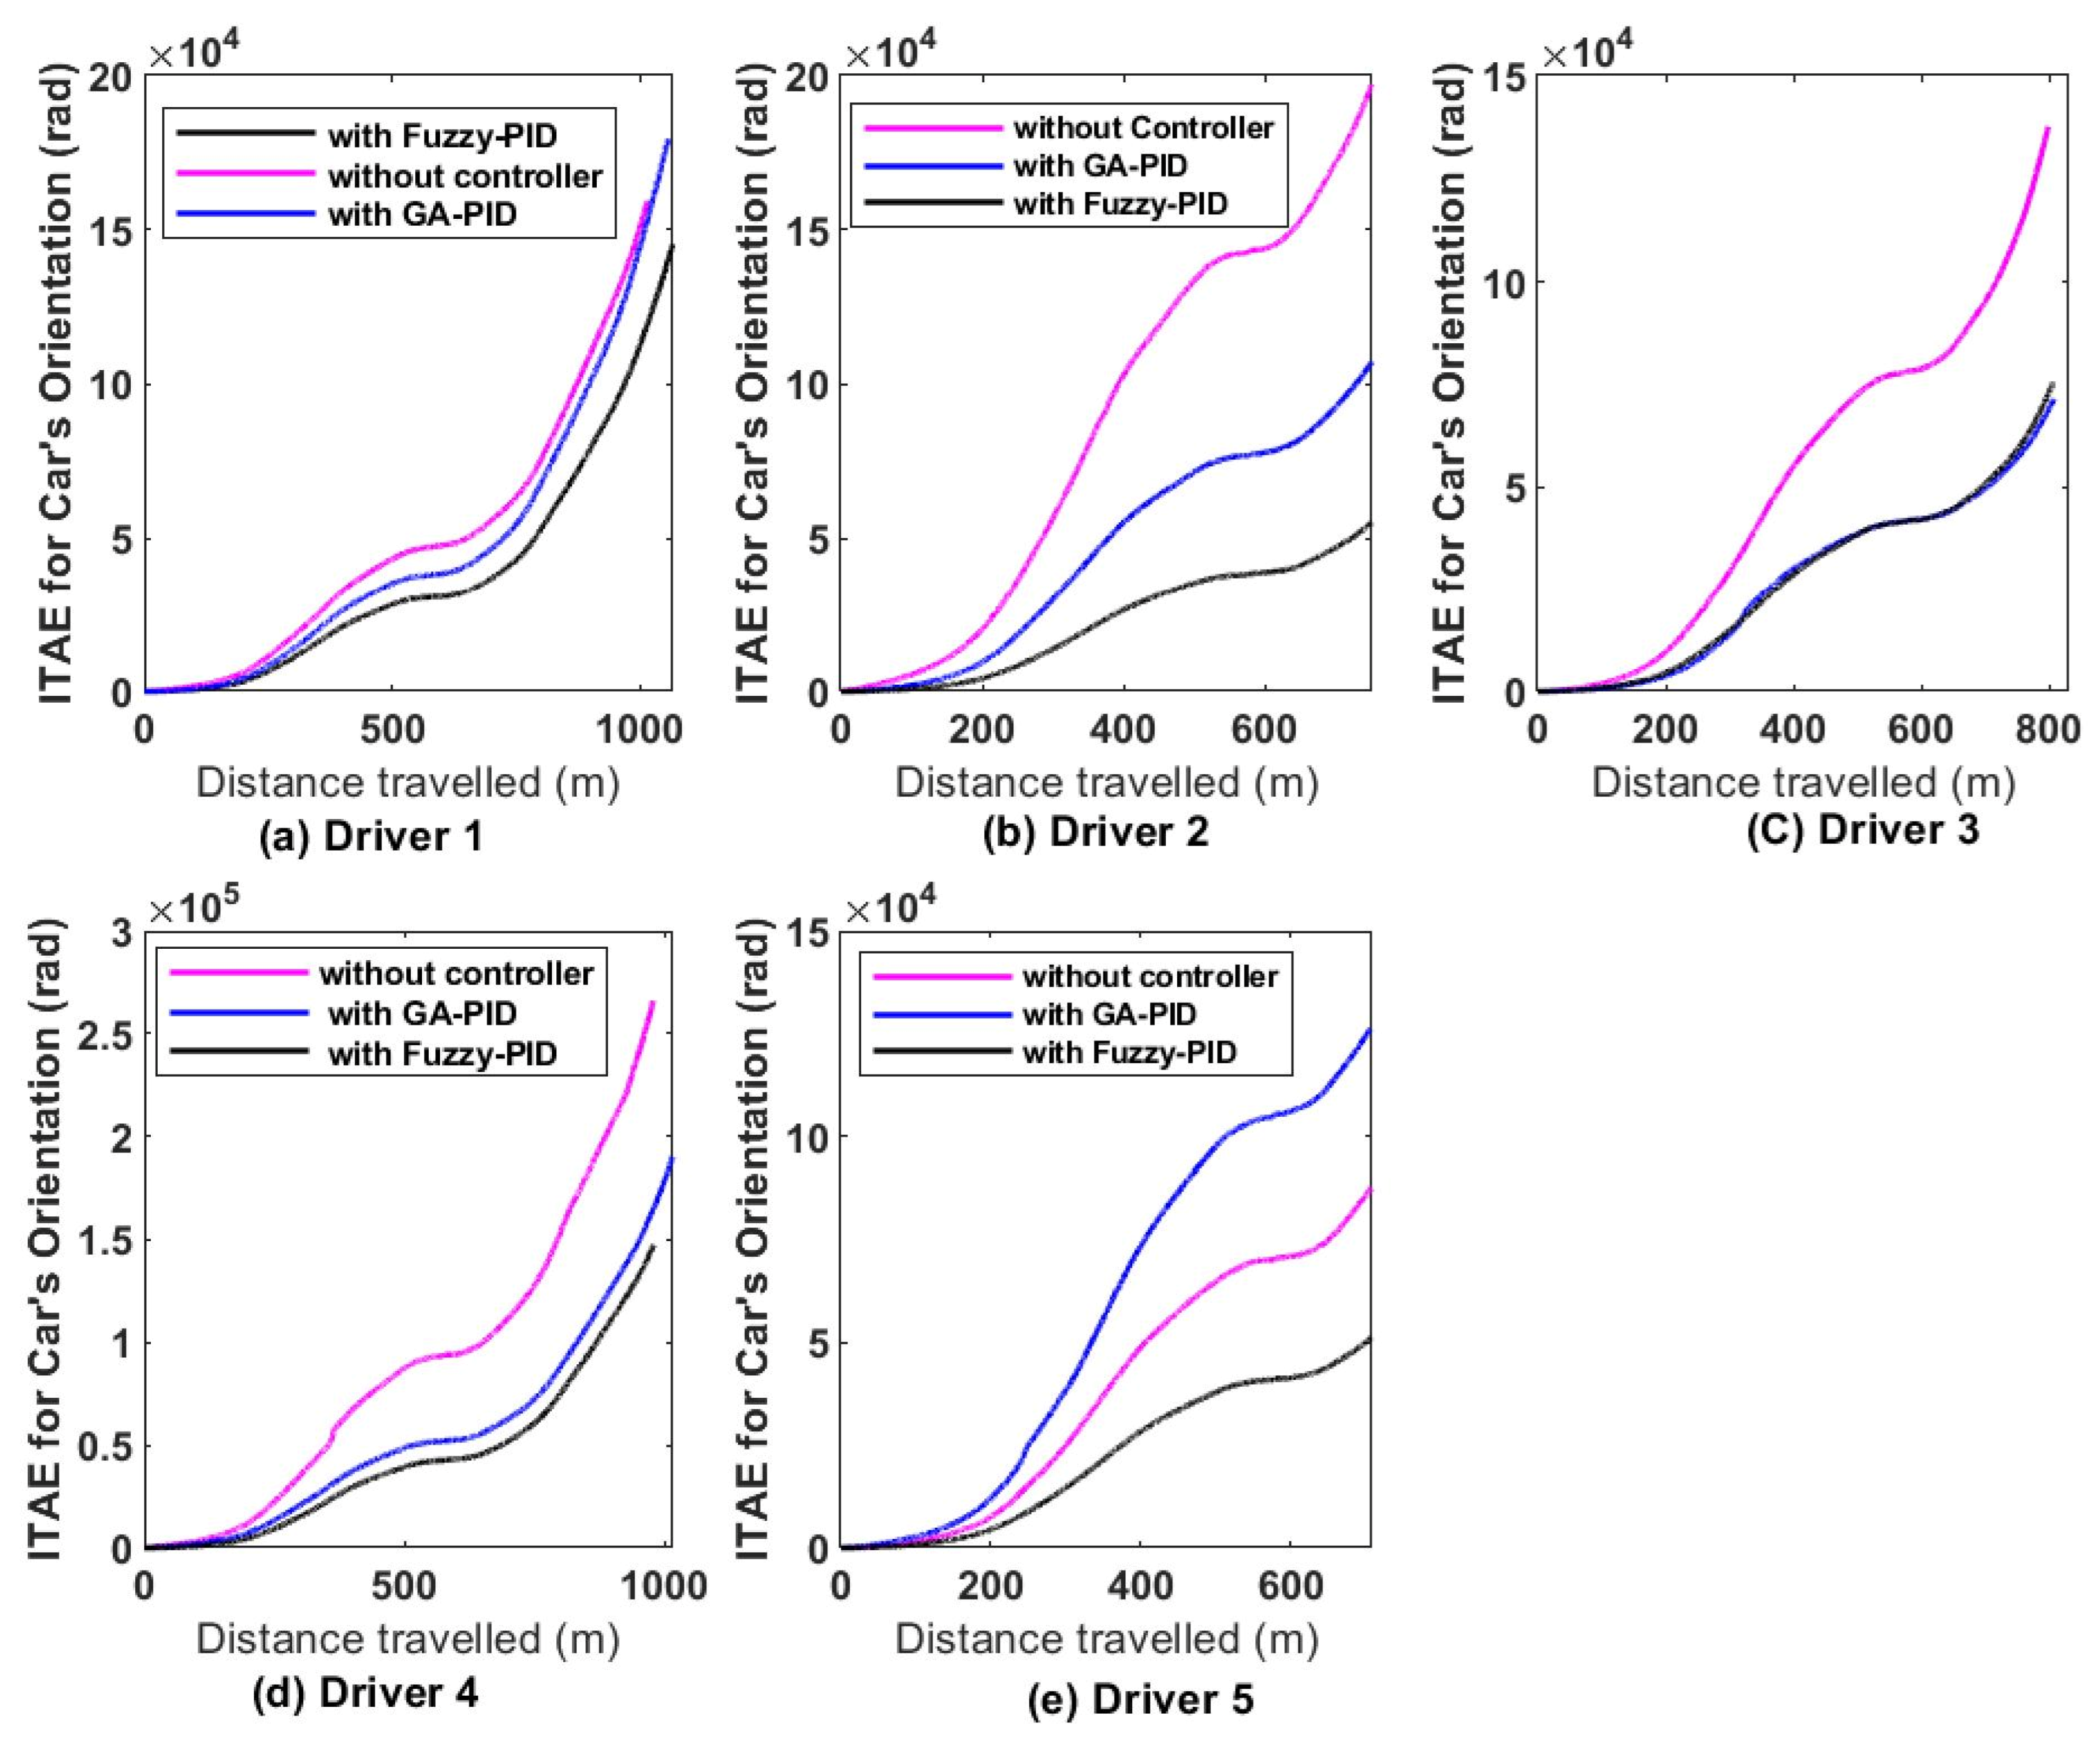
5.7.2. ITAE between the Proposed Controller and the GA-PID for Car Orientation
5.7.3. Haptic Feedback Torque with the Proposed Controller and the GA-PID
6. Discussion
6.1. Human Driving Behaviour Model Based on BPNN Performance Analysis
6.2. GA-PID Controller with BPNN Model Performance Examination Due to the ITAE Criterion
6.3. Robustness and Transparency Analysis of Fuzzy-PID Controller Due to the ITAE Performance Criteria
6.4. Fuzzy-PID Controller Performance on Haptic Feedback Torque
6.5. Performance Comparison between the Proposed Controller and the GA-PID Controller
7. Conclusions
Author Contributions
Funding
Institutional Review Board Statement
Informed Consent Statement
Data Availability Statement
Acknowledgments
Conflicts of Interest
References
- Wang, Y.; Hu, J.; Wang, F.A.; Dong, H.; Yan, Y.; Ren, Y.; Yin, G. Tire road friction coefficient estimation: Review and research perspectives. Mechatronics 2022, 35, 6. [Google Scholar] [CrossRef]
- SHua, J.; Li, L.; Ning, P.; Schwebel, D.C.; He, J.; Rao, Z.; Hu, G. Road traffic death coding quality in the WHO Mortality Database. Bull. World Health Organ. 2023, 101, 637. [Google Scholar]
- Hammad, H.M.; Ashraf, M.; Abbas, F.; Bakhat, H.F.; Qaisrani, S.A.; Mubeen, M.; Fahad, S.; Awais, M. Environmental factors affecting the frequency of road traffic accidents: A case study of sub-urban area of Pakistan. Environ. Sci. Pollut. Res. 2019, 26, 11674–11685. [Google Scholar] [CrossRef]
- SEboli, L.; Mazzulla, G.; Pungillo, G. How drivers’ characteristics can affect driving style. Ransportation Res. Procedia 2017, 27, 945–952. [Google Scholar]
- Wang, Y.; Zhang, W. Analysis of roadway and environmental factors affecting traffic crash severities. Transp. Res. Procedia 2017, 25, 2119–2125. [Google Scholar] [CrossRef]
- Manan, M.M.A.; Várhelyi, A.; Çelik, A.K.; Hashim, H.H. Road characteristics and environment factors associated with motorcycle fatal crashes in Malaysia. IATSS Res. 2018, 42, 207–220. [Google Scholar] [CrossRef]
- Das, A.; Ahmed, M.M.; Ghasemzadeh, A. Using trajectory-level SHRP2 naturalistic driving data for investigating driver lane-keeping ability in fog: An association rules mining approach. Accid. Anal. Prev. 2019, 129, 250–262. [Google Scholar] [CrossRef] [PubMed]
- Rolison, J.J.; Regev, S.; Moutari, S.; Feeney, A. What are the factors that contribute to road accidents? An assessment of law enforcement views, ordinary drivers’ opinions, and road accident records. Accid. Anal. Prev. 2018, 115, 11–24. [Google Scholar] [CrossRef] [PubMed]
- Issa, Y. Effect of driver’s personal characteristics on traffic accidents in Tabuk city in Saudi Arabia. J. Transp. Lit. 2016, 10, 25–29. [Google Scholar] [CrossRef]
- Jost, G.; Allsop, R.; Ceci, A. Ranking EU Progress on Car Occupant Safety; European Transport Safety Council (ETSC): Brussels, Belgium, 2014. [Google Scholar]
- Bian, Y.; Ding, J.; Hu, M.; Xu, Q.; Wang, J.; Li, K. An advanced lane-keeping assistance system with switchable assistance modes. IEEE Trans. Intell. Transp. Syst. 2019, 65, 4379–4392. [Google Scholar] [CrossRef]
- Kim, W.; Son, Y.S.; Chung, C.C.; Kim, W.; Son, Y.S.; Chung, C.C. Torque-overlay-based robust steering wheel angle control of electrical power steering for a lane-keeping system of automated vehicles. IEEE Trans. Veh. Technol. 2015, 21, 385–396. [Google Scholar] [CrossRef]
- Utriainen, R.; Pöllänen, M.; Liimatainen, H. The safety potential of lane-keeping assistance and possible actions to improve the potential. IEEE Trans. Intell. Veh. 2020, 5, 556–564. [Google Scholar] [CrossRef]
- Logan, D.B.; Young, K.; Allen, T.; Horberry, T. Safety Benefits of Cooperative ITS and Automated Driving in Australia and New Zealand; Austroads: Sydney, Australia, 2017. [Google Scholar]
- Abbink, D.A.; Mulder, M.; Boer, E.R. Haptic shared control: Smoothly shifting control authority? Cogn. Technol. Work 2012, 14, 19–28. [Google Scholar] [CrossRef]
- Telpaz, A.; Rhindress, B.; Zelman, I.; Tsimhoni, O. Using a vibrotactile seat for facilitating the handover of control during automated driving. Int. J. Mob. Hum. Comput. Interact. (IJMHCI) 2017, 9, 17–33. [Google Scholar] [CrossRef]
- Griffith, M.; Akkem, R.; Maheshwari, J.; Seacrist, T.; Arbogast, K.B.; Graci, V. The effect of a startle-based warning, age, sex, and secondary task on takeover actions in critical autonomous driving scenarios. Front. Bioeng. Biotechnol. 2023, 11, 1147606. [Google Scholar] [CrossRef] [PubMed]
- Yan, Z.; Yang, K.; Wang, Z.; Yang, B.; Kaizuka, T.; Nakano, K. Intention-based lane changing and lane keeping haptic guidance steering system. IEEE Trans. Intell. Veh. 2020, 6, 622–633. [Google Scholar] [CrossRef]
- Saleh, L.; Chevrel, P.; Mars, F.; Lafay, J.F.; Claveau, F. Human-like cybernetic driver model for lane keeping. IFAC Proc. Vol. 2011, 44, 4368–4373. [Google Scholar] [CrossRef]
- Lee, H.; Kim, H.; Choi, S. Driving skill modeling using neural networks for performance-based haptic assistance. IEEE Trans. Hum.-Mach. Syst. 2021, 51, 198–210. [Google Scholar] [CrossRef]
- Xu, F.X.; Feng, S.Y.; Nacpil, E.J.C.; Wang, Z.; Wang, G.Q.; Zhou, C. Modeling Lateral Control Behaviors of Distracted Drivers for Haptic-Shared Steering System. IEEE Trans. Intell. Transp. Syst. 2023, 24, 14772–14782. [Google Scholar] [CrossRef]
- Mars, F. Driving around bends with manipulated eye-steering coordination. J. Vis. 2008, 8, 10. [Google Scholar] [CrossRef] [PubMed]
- Kamat, S. Model Predictive Control Approaches for Lane Keeping of Vehicle. IFAC-PapersOnLine 2020, 53, 176–182. [Google Scholar] [CrossRef]
- Kamat, S. Lane keeping of vehicle using model predictive control. In Proceedings of the 2019 IEEE 5th International Conference for Convergence in Technology (I2CT), Pune, India, 29–31 March 2019; pp. 1–6. [Google Scholar]
- Bujarbaruah, M.; Zhang, X.; Tseng, H.E.; Borrelli, F. Adaptive MPC for autonomous lane keeping. arXiv 2018, arXiv:1806.04335. [Google Scholar]
- Sentouh, C.; Chevrel, P.; Mars, F.; Claveau, F. A sensorimotor driver model for steering control. In Proceedings of the 2009 IEEE International Conference on Systems, Man and Cybernetics, San Antonio, TX, USA, 11–14 October 2009; pp. 2462–2467. [Google Scholar]
- Keen, S.D.; Cole, D.J. Bias-free identification of a linear model predictive steering controller from measured driver steering behavior. IEEE Trans. Syst. Man Cybern. Part B Cybern. 2012, 42, 434–443. [Google Scholar] [CrossRef] [PubMed]
- Prokop, G. Modeling human vehicle driving by model predictive online Optimization. Veh. Syst. Dyn. 2001, 35, 19–53. [Google Scholar] [CrossRef]
- Guo, H.; Ji, Y.; Qu, T.; Chen, H. Understanding and modeling the human driver behavior based on mpc. In Proceedings of the 7th IFAC Symposium on Advances in Automotive Control the International Federation of Automatic Control, Tokyo, Japan, 4–7 September 2013; pp. 133–138. [Google Scholar]
- Qu, T.; Chen, H.; Cong, Y.; Yu, Z. Modeling the driver behavior based on model predictive control. Proceedings of International Conference on Advanced Vehicle Technologies and Integration, Changchun, China, 16–19 July 2012. [Google Scholar]
- Qu, T.; Chen, H.; Ji, Y.; Guo, H.; Cao, D. Modeling driver steering control based on stochastic model predictive control. In Proceedings of the 2013 IEEE International Conference on Systems, Man, and Cybernetics, Manchester, UK, 13–16 October 2013; pp. 3704–3709. [Google Scholar]
- Hassan, M.K.; Amiri, A.; Marhaban, H.; Juraiza, A. Optimal tuning of fractional-order PID controller for electric power-assisted steering (EPAS) system using particle swarm optimization (PSO). Control Eng. Robot. Ind. Autom. Malays. Soc. Autom. Control Eng. (MACE) 2022, 371, 169–182. [Google Scholar]
- Menhour, L.; Lechner, D.; Charara, A. Vehicle steering control based on robust control for high lateral accelerations: Experimental evaluation. In Proceedings of the 13th International IEEE Conference on Intelligent Transportation Systems, Funchal, Portugal, 19–22 September 2010; pp. 587–592. [Google Scholar]
- Niu, Z.; Sun, Y. Control modeling for accelerator leg of robot driver. In Proceedings of the 2009 International Asia Conference on Informatics in Control, Automation and Robotics, Bangkok, Thailand, 1–2 February 2009; pp. 170–174. [Google Scholar]
- Dan, X.; Chi, Y.-B.; Huang, K.-Q.; Yuan, J.-Z. Controlling strategy research on active front steering system. In Proceedings of the 2011 International Conference on Consumer Electronics, Communications and Networks (CECNet), Xianning, China, 16–18 April 2011; pp. 4871–4874. [Google Scholar]
- Ercan, Z.; Carvalho, A.; Gokasan, M.; Borrelli, F. Modeling, identification, and predictive control of a driver steering assistance system. IEEE Trans.-Hum. Syst. 2017, 47, 700–710. [Google Scholar] [CrossRef]
- Lazcano, A.M.R.; Niu, T.; Akutain, X.C.; Cole, D.; Shyrokau, B. Mpc-based haptic shared steering system: A driver modelling approach for symbiotic driving. IEEE/ASME Trans. Mechatron. 2021, 26, 1201–1211. [Google Scholar] [CrossRef]
- Efremov, D.; Hanis, T.; Klauco, M. Haptic driver guidance for lateral driving envelope protection using model predictive control. In Proceedings of the 2020 IEEE Intelligent Vehicles Symposium (IV), Las Vegas, NV, USA, 19 October–13 November 2020; pp. 1992–1997. [Google Scholar]
- Li, Y.; Sun, D.; Zhao, M.; Chen, J.; Liu, Z.; Cheng, S.; Chen, T. MPC-based switched driving model for human vehicle co-piloting considering human factors. Transp. Res. Part C Emerg. Technol. 2020, 115, 102612. [Google Scholar] [CrossRef]
- Rezapour, M.; Ksaibati, K. Contributory factors to the severity of single-vehicle rollover crashes on a mountainous area, generalized additive model. Int. J. Inj. Control Saf. Promot. 2022, 29, 281–288. [Google Scholar] [CrossRef]
- Viadero-Monasterio, F.; Nguyen, A.T.; Lauber, J.; Boada, M.J.L.; Boada, B.L. Event-triggered robust path tracking control considering roll stability under network-induced delays for autonomous vehicles. IEEE Trans. Intell. Transp. Syst. 2023, 24, 14743–14756. [Google Scholar] [CrossRef]
- Viadero-Monasterio, F.; García, J.; Meléndez-Useros, M.; Jiménez-Salas, M.; Boada, B.L.; López Boada, M.J. Simultaneous Estimation of Vehicle Sideslip and Roll Angles Using an Event-Triggered-Based IoT Architecture. Machines 2024, 12, 53. [Google Scholar] [CrossRef]
- Arslan, M.S.; Sever, M. Vehicle stability enhancement and rollover prevention by a nonlinear predictive control method. Trans. Inst. Meas. Control. 2019, 41, 2135–2149. [Google Scholar] [CrossRef]
- Ruslan, F.A.; Zakaria, N.K.; Adnan, R. Flood modelling using artificial neural network. In Proceedings of the 2013 IEEE 4th Control and System Graduate Research Colloquium, Shah Alam, Malaysia, 19–20 August 2013; pp. 116–120. [Google Scholar]
- Wang, Y.; Yin, G.; Li, Y.; Ullah, S.; Zhuang, W.; Wang, J.; Zhang, N.; Geng, K. Self-learning control for coordinated collision avoidance of automated vehicles. Proc. Inst. Mech. Eng. Part D J. Automob. Eng. 2021, 235, 1149–1163. [Google Scholar] [CrossRef]
- Jia, S.; Hui, F.; Li, S.; Zhao, X.; Khattak, A.J. Long short-term memory and convolutional neural network for abnormal driving behaviour recognition. IET Intell. Transp. Systems. 2020, 14, 306–312. [Google Scholar] [CrossRef]
- Peng, J.; Guo, Y.; Fu, R.; Yuan, W.; Wang, C. Multi-parameter prediction of drivers’ lane-changing behaviour with neural network model. Appl. Ergon. 2015, 50, 207–217. [Google Scholar] [CrossRef]
- Bing, Z.; Meschede, C.; Chen, G.; Knoll, A.; Huang, K. Indirect and direct training of spiking neural networks for end-to-end control of a lane-keeping vehicle. Neural Netw. 2020, 121, 21–36. [Google Scholar] [CrossRef]
- Liu, S.; Müller, S. Reliability of Deep Neural Networks for an End-to-End Imitation Learning-Based Lane Keeping. IEEE Trans. Intell. Transp. Syst. 2023, 24, 13768–13786. [Google Scholar] [CrossRef]
- Zheng, J.; Suzuki, K.; Fujita, M. Predicting driver’s lane-changing decisions using a neural network model. Simul. Model. Pract. Theory 2014, 42, 73–83. [Google Scholar] [CrossRef]
- Amin, S. Backpropagation–artificial neural network (BP-ANN): Understanding gender characteristics of older driver accidents in west midlands of United Kingdom. Saf. Sci. 2020, 122, 104539. [Google Scholar] [CrossRef]
- Buscema, M. Back propagation neural networks. Subst. Use Misuse 1998, 33, 73–83. [Google Scholar] [CrossRef]
- Korkmaz, M.; Aydoğdu, Ö.; Doğan, H. Design and performance comparison of variable parameter nonlinear PID controller and genetic algorithm based PID controller. In Proceedings of the 2012 International Symposium on Innovations in Intelligent Systems and Applications, Trabzon, Turkey, 2–4 July 2012; pp. 1–5. [Google Scholar]
- Budiman, E.; Widians, J.A.; Wati, M.; Puspitasari, N. Normalized Data Technique Performance for Covid-19 Social Assistance Decision Making-case: Student’s internet data social assistance during learning from home due COVID-19. In Proceedings of the 2020 3rd International Conference on Information and Communications Technology (ICOIACT), Yogyakarta, Indonesia, 24–25 November 2020; pp. 493–498. [Google Scholar]
- Al-Faiz, M.Z.; Ibrahim, A.A.; Hadi, S.M. The effect of Z-Score standardization (normalization) on binary input due the speed of learning in back-propagation neural network. Iraqi J. Inf. Commun. Technol. 2018, 1, 42–48. [Google Scholar] [CrossRef]
- Nishat, M.M.; Faisal, F.; Evan, A.J.; Rahaman, M.M.; Sifat, M.S.; Rabbi, H.F. Development of genetic algorithm (ga) based optimized PID controller for stability analysis of DC-DC buck converter. J. Power Energy Eng. 2020, 8, 8. [Google Scholar] [CrossRef]
- Yuan, X.; Elhoseny, M.; El-Minir, H.K.; Riad, A.M. A genetic algorithm-based, dynamic clustering method towards improved WSN longevity. J. Netw. Syst. Manag. 2017, 25, 21–46. [Google Scholar] [CrossRef]
- Hiassat, A.; Diabat, A.; Rahwan, I. A genetic algorithm approach for location-inventory-routing problem with perishable products. J. Manuf. Syst. 2017, 42, 93–103. [Google Scholar] [CrossRef]
- Jayachitra, A.; Vinodha, R. Genetic algorithm based PID controller tuning approach for continuous stirred tank reactor. Adv. Artif. Intell. 2015, 9, 9. [Google Scholar] [CrossRef]
- Meena, D.C.; Devanshu, A. Genetic algorithm tuned PID controller for process control. In Proceedings of the 2017 International Conference on Inventive Systems and Control (ICISC), Coimbatore, India, 19–20 January 2017; pp. 1–6. [Google Scholar]
- Kumar, R.; Kumar, M. Improvement power system stability using unified power flow controller based on hybrid fuzzy logic-PID tuning in smib system. In Proceedings of the 2015 International Conference on Green Computing and Internet of Things (ICGCIoT), Greater Noida, India, 8–10 October 2015; pp. 815–819. [Google Scholar]
- Yakout, A.H.; Kotb, H.; Hasanien, H.M.; Aboras, K.M. Optimal fuzzy PIDF load frequency controller for hybrid microgrid system using marine predator algorithm. IEEE Access 2021, 9, 54220–54232. [Google Scholar] [CrossRef]
- Chakraverty, S.; Sahoo, D.M.; Mahato, N.R.; Chakraverty, S.; Sahoo, D.M.; Mahato, N.R. Defuzzification. In Concepts of Soft Computing: Fuzzy and ANN with Programming; Springer: Singapore, 2019; pp. 117–127. [Google Scholar]
- Chen, G.; Pham, T.T. Introduction to Fuzzy Sets, Fuzzy Logic, and Fuzzy Control Systems; CRC Press: Boca Raton, FL, USA, 2000. [Google Scholar]


| Input Variable | Output Variable | ||||
|---|---|---|---|---|---|
| ep | eo | Speed | Kp | Ki | Kd |
| L | M | H | KpH | KiL | KdL |
| L | H | H | KpH | KiL | KdL |
| L | VH | H | KpVH | KiM | KdVL |
| M | M | H | VL | VL | H |
| M | VH | H | VL | VL | H |
| H | M | M | VH | M | VL |
| L | M | L | M | H | VH |
| H | M | L | VH | VL | M |
| H | H | L | VH | VL | M |
| L | l | H | M | H | VH |
| BPN Performances | Driver 1 | Driver 2 | Driver 3 | Driver 4 | Driver 5 |
|---|---|---|---|---|---|
| MSE | 0.14049 | 0.2452 | 0.19276 | 0.15823 | 0.37388 |
| Epochs | 523 | 181 | 100 | 233 | 221 |
| Regression | 0.93 | 0.869 | 0.886 | 0.916 | 0.803 |
| PID Parameters | Driver 1 GA-PID | Driver 2 GA-PID | Driver 3 GA-PID | Driver 4 GA-PID | Driver 5 GA-PID |
|---|---|---|---|---|---|
| Kp | 3.3 | 1 | 4.904 | 1.313 | 4.987 |
| Ki | 0.108 | 0 | 0.08 | 3.81 × 10⁻⁶ | 0.0035 |
| Kd | 13.543 | 6.866 | 2.399 | 6.891 | 4.416 |
| Scenario | Performance Index for Car’s Position | ||||
|---|---|---|---|---|---|
|
ITAE (m) Driver 1 |
ITAE (m) Driver 2 |
ITAE (m) Driver 3 |
ITAE (m) Driver 4 |
ITAE (m) Driver 5 | |
| Driving behaviour without GA-PID | 32,980.38 | 10,829.86 | 18,419.31 | 126,787.6 | 45,695.87 |
| Driving behaviour with GA-PID | 25,737.86 | 4903.1 | 11,542.43 | 21,467.32 | 18,523.59 |
| Improvement | 7242.52 | 5926.76 | 6876.88 | 105,320.3 | 27,172.28 |
| Percentages | 21.96% | 54.73% | 37.34% | 83.07% | 59.46% |
| Scenario | Performance Index for Car’s Orientation | ||||
|---|---|---|---|---|---|
|
ITAE (rad) Driver 1 |
ITAE (rad) Driver 2 |
ITAE (rad) Driver 3 |
ITAE (rad) Driver 4 |
ITAE (rad) Driver 5 | |
| Driving behaviour without GA-PID | 28,847.46 | 14,056 | 57,108.31 | 48,903.29 | 19,472 |
| Driving behaviour with GA-PID | 22,565.04 | 13,193.2 | 56,420.41 | 46,398.59 | 18,340.5 |
| Improvement | 6282.42 | 862.80 | 687.90 | 2504.70 | 1131.50 |
| Percentages | 22% | 6.14% | 1.20% | 5.12% | 5.81% |
| Scenario | Driver 1 | Driver 2 | Driver 3 | Driver 4 | Driver 5 | Driver 6 | Driver 7 |
|---|---|---|---|---|---|---|---|
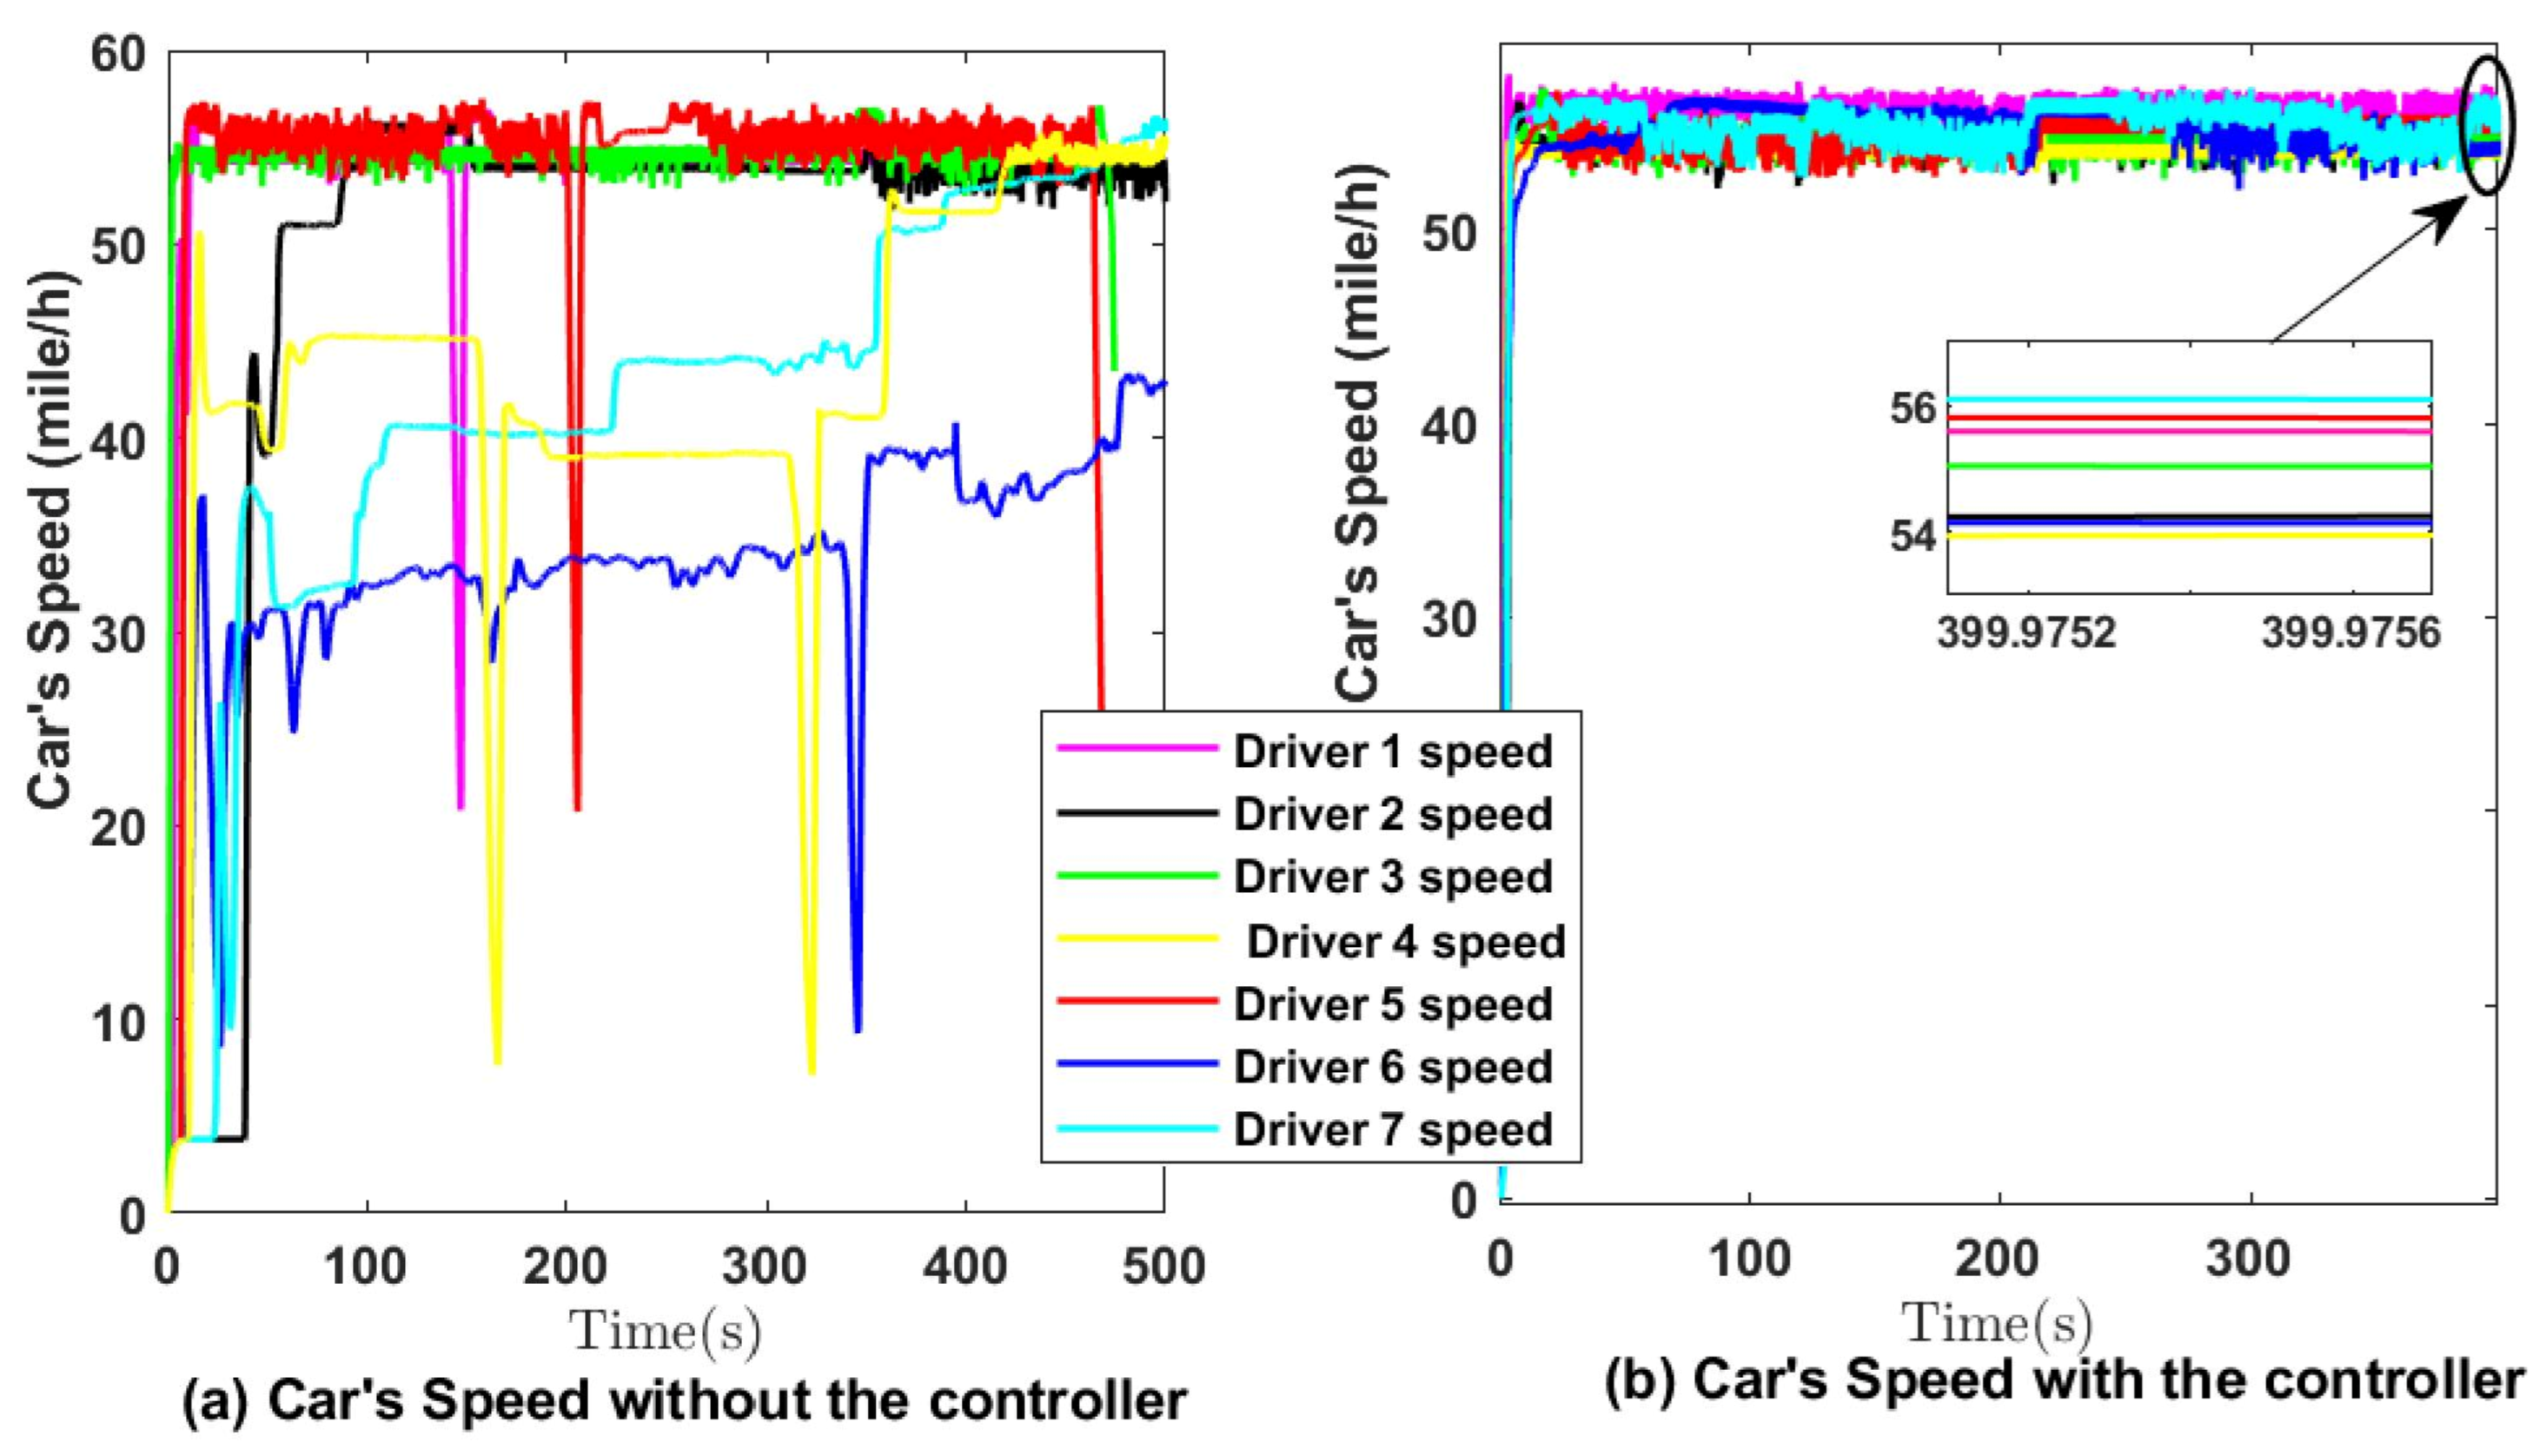
| Driving Speed with Fuzzy-PID | 56.1204 | 54.4615 | 53.9873 | 53.8683 | 54.7353 | 55.0315 | 55.0937 |
| Driving Speed without Fuzzy-PID | 53.853 | 54.5193 | 49.5171 | 43.0751 | 52.6064 | 33.3196 | 41.7989 |
| Scenario | Performance Index for Car Position | ||||||
|---|---|---|---|---|---|---|---|
|
ITAE (m) Driver 1 |
ITAE (m) Driver 2 |
ITAE (m) Driver 3 |
ITAE (m) Driver 4 |
ITAE (m) Driver 5 |
ITAE (m) Driver 6 |
ITAE (m) Driver 7 | |
| Driving behaviour without fuzzy-PID | 76,150.91 | 136,021.6 | 81,759.06 | 106,950.6 | 82,891.66 | 61,278.152 | 135,595.3 |
| Driving behaviour with fuzzy-PID | 33,634.73 | 44,330.49 | 36,789.21 | 24,357.55 | 29,514.59 | 19,682.56 | 41,600.55 |
| Improvement | 42,516.18 | 91,691.07 | 44,969.85 | 82,593.03 | 53,377.07 | 41,595.592 | 93,994.76 |
| Percentages | 56% | 67% | 55% | 77% | 64% | 68% | 69% |
| Scenario | Performance Index for Car Orientation | ||||||
|---|---|---|---|---|---|---|---|
|
ITAE (rad) Driver 1 |
ITAE (rad) Driver 2 |
ITAE (rad) Driver 3 |
ITAE (rad) Driver 4 |
ITAE (rad) Driver 5 |
ITAE (rad) Driver 6 |
ITAE (rad) Driver 7 | |
| Driving behaviour without fuzzy-PID | 248,431.6 | 258,389.1 | 219,338.83 | 304,274 | 228,586 | 225,661.2 | 295,849.9 |
| Driving behaviour with fuzzy-PID | 231,439 | 216,183.4 | 113,396.1 | 210,842.6 | 214,620.7 | 82,985.34 | 181,997 |
| Improvement | 16,992.59 | 42,205.66 | 105,942.73 | 93,431.33 | 13,965.30 | 142,675.88 | 113,852.9 |
| Percentages | 7% | 16% | 48.30% | 30.71% | 6% | 63% | 38% |
| Scenario | Haptic Feedback Steering Wheel Torque (Nm) | ||||||
|---|---|---|---|---|---|---|---|
| Driver 1 | Driver 2 | Driver 3 | Driver 4 | Driver 5 | Driver 6 | Driver 7 | |
| Feedback Torque without Fuzzy-PID | 1485.2 | 1816.7 | 1665.2 | 1485.6 | 1677.2 | 1149.7 | 1911 |
| Feedback Torque with Fuzzy-PID | 890.35 | 1006.4 | 980.75 | 604.4 | 959.9 | 819.1 | 1217.4 |
| Improvement | 594.85 | 810.3 | 684.45 | 881.2 | 717.3 | 330.6 | 693.6 |
| Percentages | 40% | 45% | 41% | 59% | 43% | 29% | 36% |
| Scenario | Performance Index for Car’s Position | ||||
|---|---|---|---|---|---|
|
ITAE (m) Driver 1 |
ITAE (m) Driver 2 |
ITAE (m) Driver 3 |
ITAE (m) Driver 4 |
ITAE (m) Driver 5 | |
| Driving behaviour without controller | 89,178 | 1.58 × 10⁵ | 94,400 | 1.22 × 10⁵ | 6.73 × 10⁴ |
| Driving behaviour with GA-PID | 53,325 | 66,207 | 51,320 | 82,845 | 66,207 |
| Improvement with GA-PID | 35,853 | 91,493 | 43,080 | 39,085 | 1112 |
| Percentages | 40% | 58% | 46% | 32% | 2% |
| Driving behaviour with fuzzy-PID | 10,183 | 19,918 | 28,220 | 21,467.32 | 34,420 |
| Improvement with fuzzy-PID | 78,995 | 1.38 × 10⁵ | 66,180 | 100,462.7 | 32,899 |
| Percentages | 88.58% | 87.37% | 70.11% | 82.39% | 48.87% |
| Scenario | Performance Index for Car’s Orientation | ||||
|---|---|---|---|---|---|
|
ITAE (rad) Driver 1 |
ITAE (rad) Driver 2 |
ITAE (rad) Driver 3 |
ITAE (rad) Driver 4 |
ITAE (rad) Driver 5 | |
| Driving behaviour without controller | 2.05 × 10⁵ | 1.98 × 10⁵ | 1.38 × 10⁵ | 2.66 × 10⁵ | 8.77 × 10⁴ |
| Driving behaviour with GA-PID | 1.79 × 10⁵ | 1.07 × 10⁵ | 7.15 × 10⁴ | 1.96 × 10⁵ | 1.26 × 10⁵ |
| Improvement with GA-PID | 25,810 | 90,267 | 66,112 | 69,900 | −38,517 |
| Percentages | 13% | 46% | 48% | 26% | −44% |
| Driving behaviour with fuzzy-PID | 1.45 × 10⁵ | 55,322 | 75,620 | 1.48 × 10⁵ | 51,208 |
| Improvement with fuzzy-PID | 59,930 | 1.42 × 10⁵ | 61,990 | 118,290 | 36,525 |
| Percentages | 29.19% | 72.02% | 45.05% | 44.48% | 41.63% |
| Scenario | Haptic Feedback Steering Wheel Torque (Nm) | ||||
|---|---|---|---|---|---|
| Driver 1 | Driver 2 | Driver 3 | Driver 4 | Driver 5 | |
| Driving behaviour without controller | 1249.10 | 1733.50 | 1173.60 | 1442.80 | 1171.50 |
| Driving behaviour with GA-PID | 1156.90 | 1207.70 | 988.35 | 1137.00 | 811.45 |
| Improvement with GA-PID | 92.20 | 525.80 | 185.25 | 305.80 | 360.05 |
| Percentages | 7.4% | 30.3% | 15.8% | 21.2% | 30.7% |
| Driving behaviour with fuzzy-PID | 204.10 | 767.25 | 969.60 | 758.15 | 534.00 |
| Improvement with fuzzy-PID | 1045 | 966.25 | 204 | 684.65 | 637.5 |
| Percentages | 83.66% | 55.74% | 17.38% | 47.45% | 54.42% |
Disclaimer/Publisher’s Note: The statements, opinions and data contained in all publications are solely those of the individual author(s) and contributor(s) and not of MDPI and/or the editor(s). MDPI and/or the editor(s) disclaim responsibility for any injury to people or property resulting from any ideas, methods, instructions or products referred to in the content. |
© 2024 by the authors. Licensee MDPI, Basel, Switzerland. This article is an open access article distributed under the terms and conditions of the Creative Commons Attribution (CC BY) license (https://creativecommons.org/licenses/by/4.0/).
Share and Cite
Noubissie Tientcheu, S.I.; Du, S.; Djouani, K.; Liu, Q. Data-Driven Controller for Drivers’ Steering-Wheel Operating Behaviour in Haptic Assistive Driving System. Electronics 2024, 13, 1157. https://doi.org/10.3390/electronics13061157
Noubissie Tientcheu SI, Du S, Djouani K, Liu Q. Data-Driven Controller for Drivers’ Steering-Wheel Operating Behaviour in Haptic Assistive Driving System. Electronics. 2024; 13(6):1157. https://doi.org/10.3390/electronics13061157
Chicago/Turabian StyleNoubissie Tientcheu, Simplice Igor, Shengzhi Du, Karim Djouani, and Qingxue Liu. 2024. "Data-Driven Controller for Drivers’ Steering-Wheel Operating Behaviour in Haptic Assistive Driving System" Electronics 13, no. 6: 1157. https://doi.org/10.3390/electronics13061157