
Augmented Reality Visualization and Quantification of COVID-19 Infections in the Lungs

 and
and
Abstract
:1. Introduction
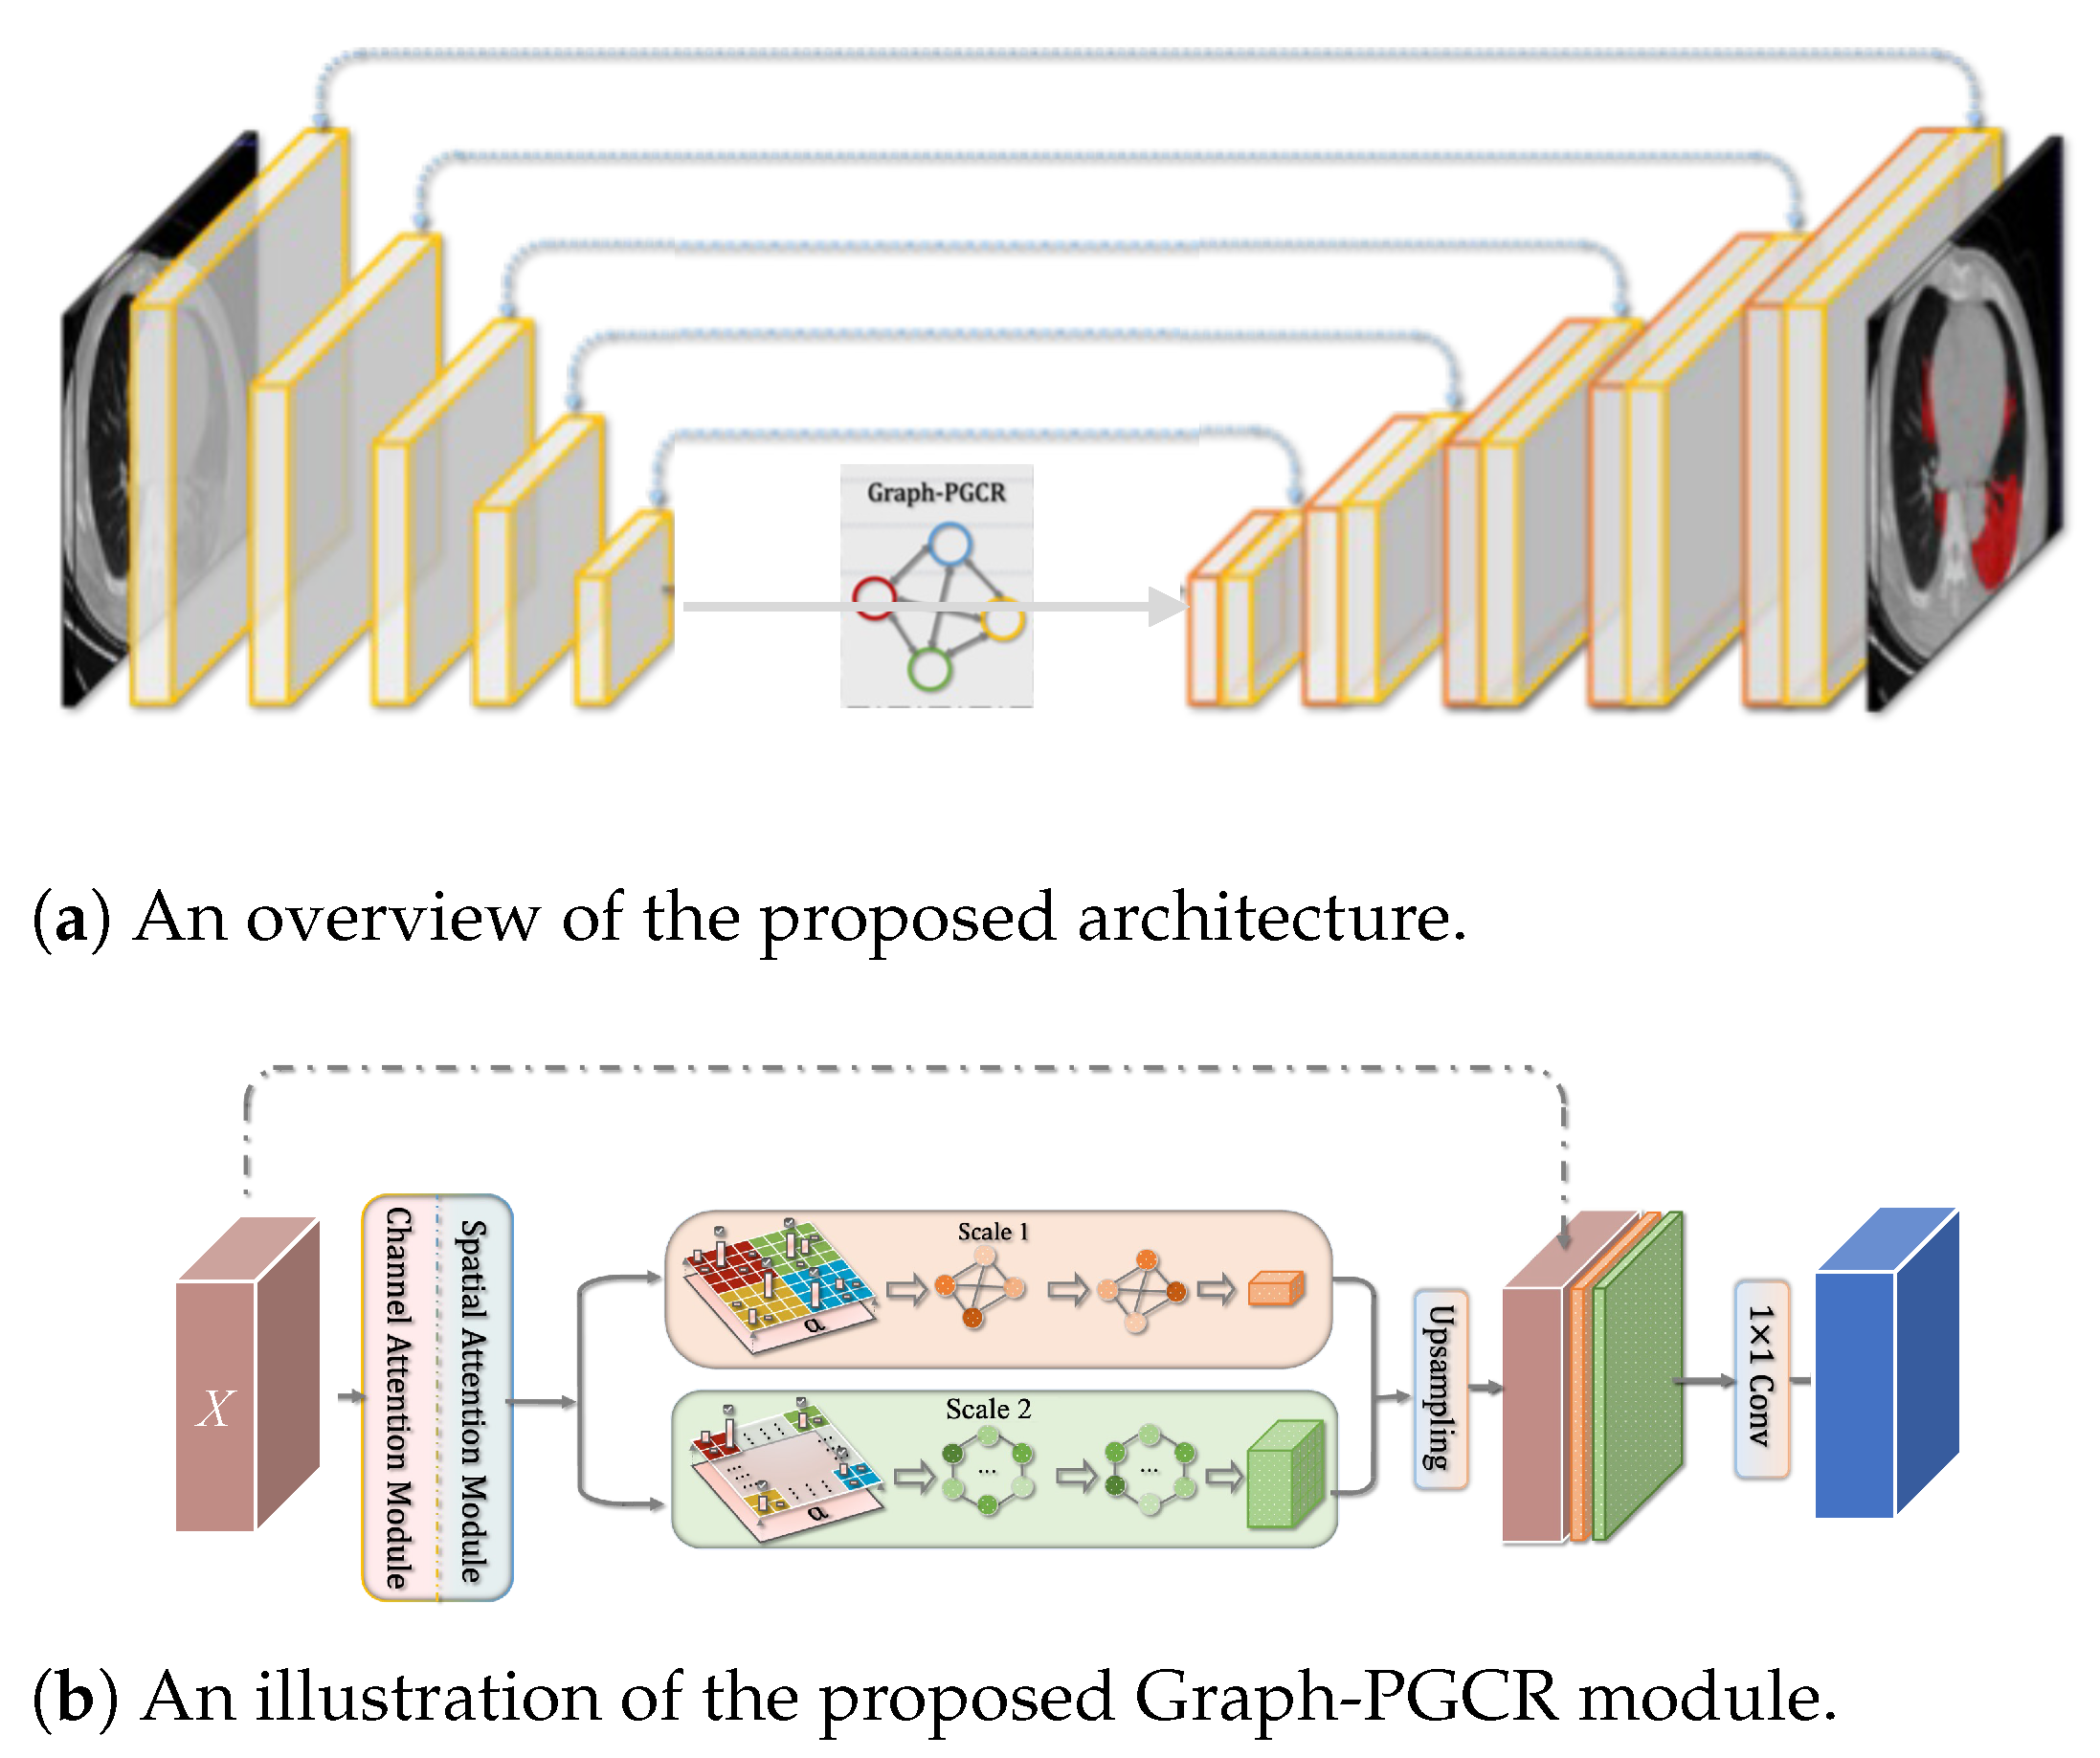
2. Proposed Method
2.1. Segmentation of COVID-19-Infected Lung Regions
2.2. Calculation of CTIS
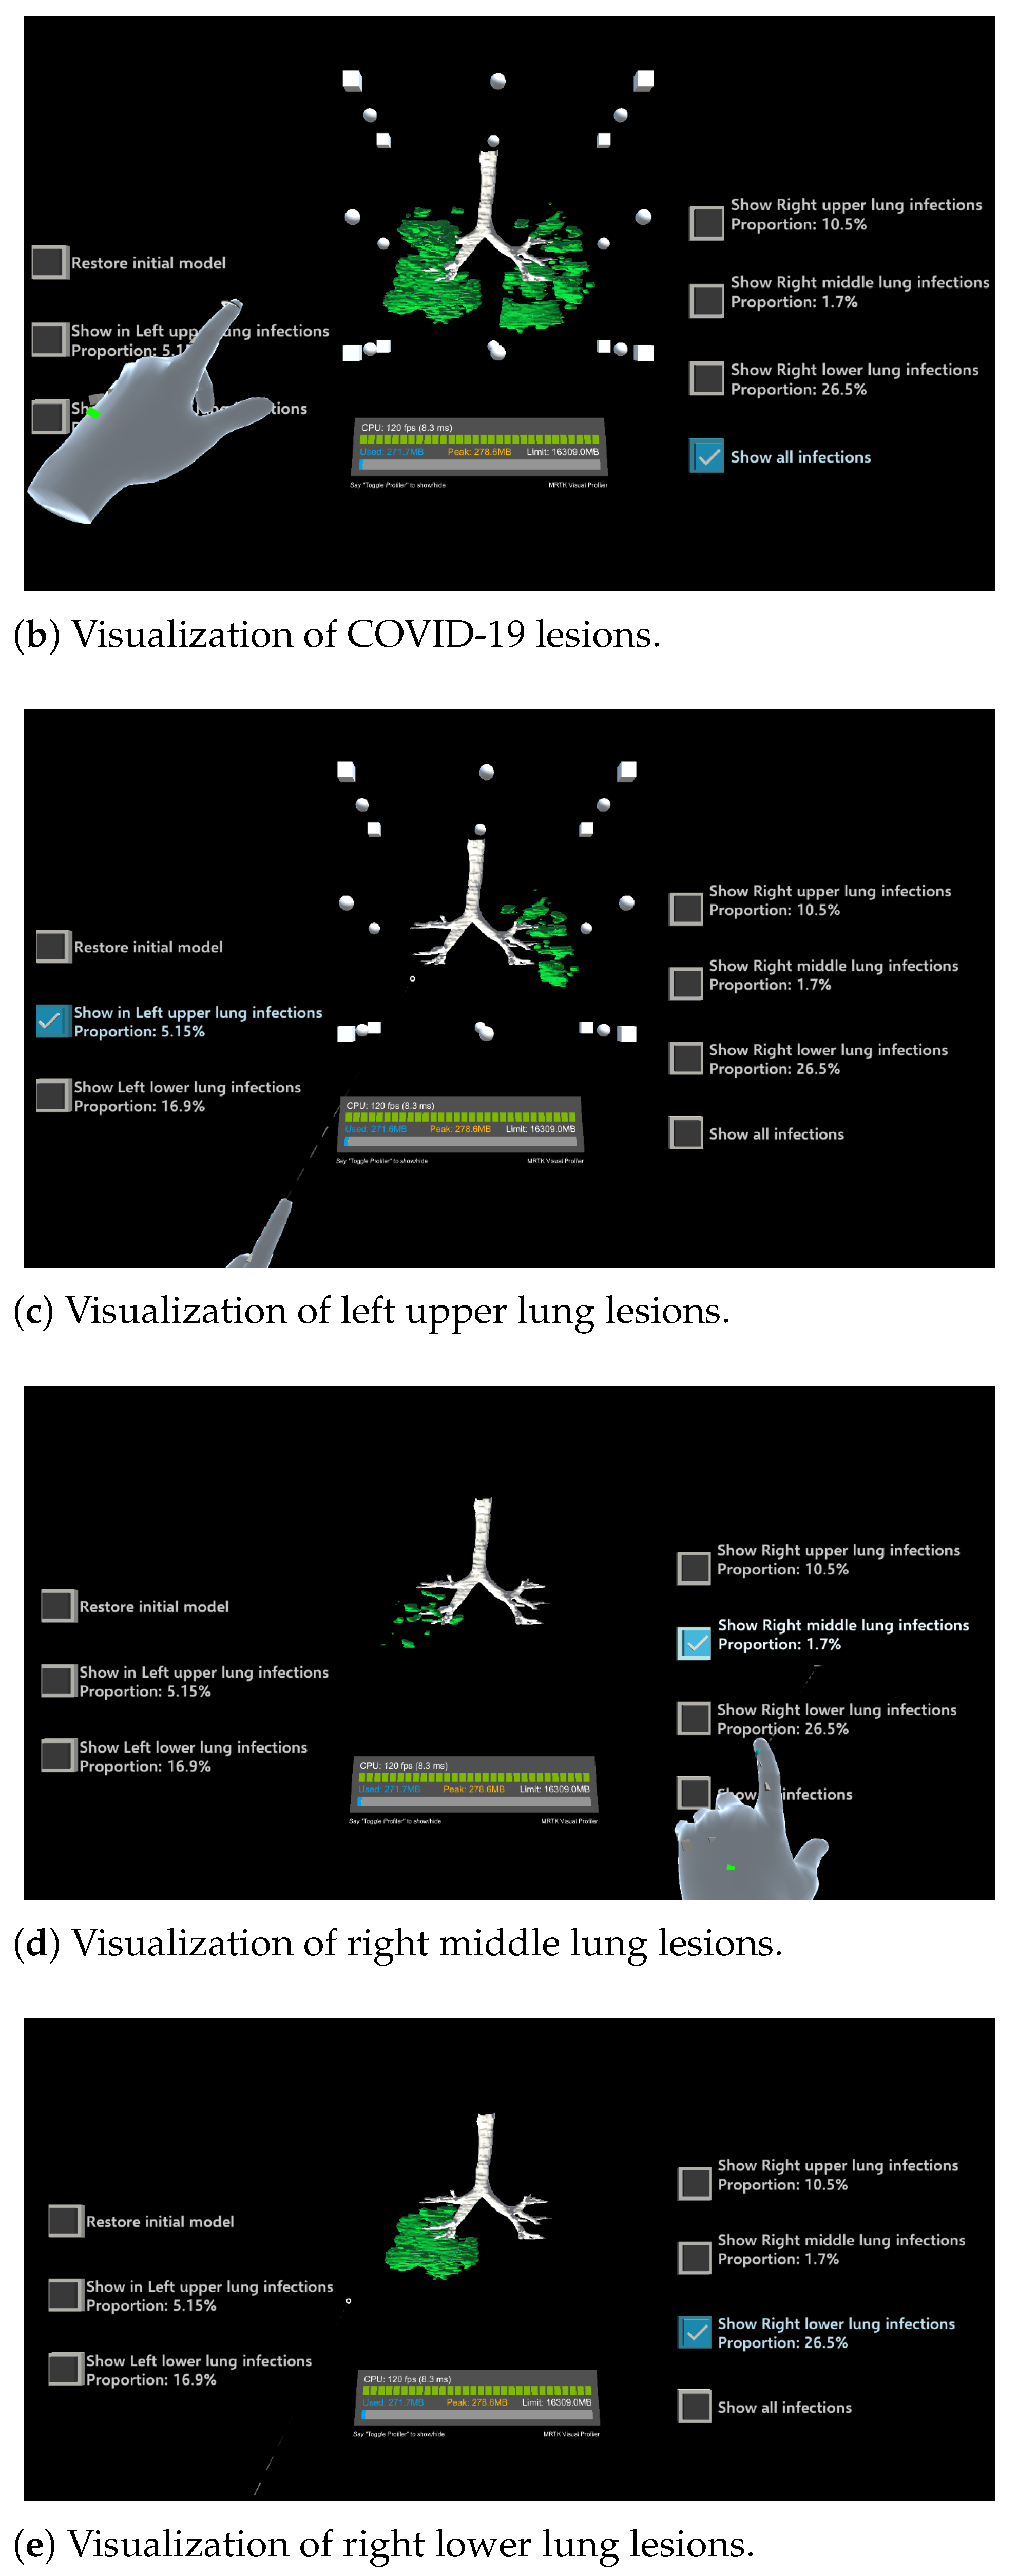
2.3. HoloLens-Based 3D Visualization Module
3. Performance Evaluation
3.1. Automatic Segmentation Results Using Graph-PGCR
3.2. Calculation of CTIS and Evaluation of Severity
3.3. Three-Dimensional Visualization of Inflamed Region

| Region | GT | Results | |
|---|---|---|---|
| Left lung upper | Ratio (%) | 16.89 | 10.87 |
| CTIS | 2 | 2 | |
| Left lung lower | Ratio (%) | 44.4 | 39.61 |
| CTIS | 3 | 3 | |
| Right lung upper | Ratio (%) | 19.9 | 25.24 |
| CTIS | 2 | 2 | |
| Right lung middle | Ratio (%) | 28.17 | 21.04 |
| CTIS | 3 | 2 | |
| Right lung lower | Ratio (%) | 9.67 | 5.63 |
| CTIS | 1 | 1 |
| Region | GT | Results | |
|---|---|---|---|
| Left lung upper | Ratio (%) | 18.59 | 20.05 |
| CTIS | 3 | 3 | |
| Left lung lower | Ratio (%) | 0.32 | 0.7 |
| CTIS | 1 | 1 | |
| Right lung upper | Ratio (%) | 4.34 | 4.1 |
| CTIS | 1 | 1 | |
| Right lung middle | Ratio (%) | 0.38 | 0.94 |
| CTIS | 1 | 1 | |
| Right lung lower | Ratio (%) | 58.91 | 43.79 |
| CTIS | 4 | 3 |
3.4. Subjective Evaluation
3.5. Limitations of the Proposed Method
4. Conclusions
Supplementary Materials
Author Contributions
Funding
Institutional Review Board Statement
Informed Consent Statement
Data Availability Statement
Conflicts of Interest
References
- WHO World Health Organization. Coronavirus Disease 2019 (COVID-19): Situation Report, 88. 2020. Available online: https://www.who.int/emergencies/diseases/novel-coronavirus-2019 (accessed on 25 February 2024).
- Shi, F.; Wang, J.; Shi, J.; Wu, Z.; Wang, Q.; Tang, Z.; He, K.; Shi, Y.; Shen, D. Review of artificial intelligence techniques in imaging data acquisition, segmentation and diagnosis for COVID-19. IEEE Rev. Biomed. Eng. 2020, 14, 4–15. [Google Scholar] [CrossRef] [PubMed]
- Simpson, S.; Kay, F.U.; Abbara, S.; Bhalla, S.; Chung, J.H.; Chung, M.; Henry, T.S.; Kanne, J.P.; Kligerman, S.; Ko, J.P.; et al. Radiological Society of North America Expert Consensus Statement on Reporting Chest CT Findings Related to COVID-19. Endorsed by the Society of Thoracic Radiology, the American College of Radiology, and RSNA. Radiol. Cardiothorac. Imaging 2020, 2, e200152. [Google Scholar] [CrossRef]
- Francone, M.; Iafrate, F.; Masci, G.M.; Coco, S.; Cilia, F.; Manganaro, L.; Panebianco, V.; Andreoli, C.; Colaiacomo, M.C.; Zingaropoli, M.A.; et al. Chest CT score in COVID-19 patients: Correlation with disease severity and short-term prognosis. Eur. Radiol. 2020, 30, 6808–6817. [Google Scholar] [CrossRef] [PubMed]
- Cao, Y.; Xu, Z.; Feng, J.; Jin, C.; Han, X.; Wu, H.; Shi, H. Longitudinal assessment of COVID-19 using a deep learning–based quantitative CT pipeline: Illustration of two cases. Radiol. Cardiothorac. Imaging 2020, 2, e200082. [Google Scholar] [CrossRef] [PubMed]
- Song, Y.; Zheng, S.; Li, L.; Zhang, X.; Zhang, X.; Huang, Z.; Chen, J.; Zhao, H.; Jie, Y.; Wang, R.; et al. Deep learning enables accurate diagnosis of novel coronavirus (COVID-19) with CT images. medRxiv 2020. [Google Scholar] [CrossRef] [PubMed]
- Chen, J.; Wu, L.; Zhang, J.; Zhang, L.; Gong, D.; Zhao, Y.; Hu, S.; Wang, Y.; Hu, X.; Zheng, B.; et al. Deep learning-based model for detecting 2019 novel coronavirus pneumonia on high-resolution computed tomography: A prospective study. medRxiv 2020. [Google Scholar] [CrossRef]
- Shan, F.; Gao, Y.; Wang, J.; Shi, W.; Shi, N.; Han, M.; Xue, Z.; Shen, D.; Shi, Y. Lung infected regions Quantification of COVID-19 in CT Images with Deep Learning. arXiv 2020, arXiv:2003.04655. [Google Scholar]
- Jin, S.; Wang, B.; Xu, H.; Luo, C.; Wei, L.; Zhao, W.; Hou, X.; Ma, W.; Xu, Z.; Zheng, Z.; et al. AI-assisted CT imaging analysis for COVID-19 screening: Building and deploying a medical AI system in four weeks. medRxiv 2020. [Google Scholar] [CrossRef]
- Zheng, C.; Deng, X.; Fu, Q.; Zhou, Q.; Feng, J.; Ma, H.; Liu, W.; Wang, X.; Xie, Y.; Wang, Z.; et al. Deep learning-based detection for COVID-19 from chest CT using weak label. medRxiv 2020. [Google Scholar] [CrossRef]
- Fan, D.P.; Zhou, T.; Ji, G.P.; Zhou, Y.; Chen, G.; Fu, H.Y.; Shen, J.; Shao, L. Inf-Net: Automatic COVID-19 Lung infected regions Segmentation from CT Images. IEEE Trans. Med. Imaging 2020, 39, 2626–2637. [Google Scholar] [CrossRef] [PubMed]
- Huang, H.; Zhang, Z.; Li, Q.; Guo, Y.; Zhang, Y. Graph-based pyramid global context reasoning with a saliency-aware projection for COVID-19 lung infected regionss segmentation. In Proceedings of the 2021 IEEE International Conference on Acoustics, Speech and Signal Processing (ICASSP), Toronto, ON, Canada, 6–11 June 2021; pp. 1050–1054. [Google Scholar] [CrossRef]
- Liu, J.; Huang, H.; Wang, F.; Yuan, Y.; Tateyama, T.; Iwamoto, Y.; Lin, L.; Chen, Y.W. Touch-Based Interactive System for Assessment and Visualization of COVID-19. IEICE Trans. 2022, J105-D, 89–96. [Google Scholar]
- Venkatesan, M.; Mohan, H.; Ryan, J.R.; Schürch, C.M.; Nolan, G.P.; Frakes, D.H.; Coskun, A.F. Virtual and augmented reality for biomedical applications. Cell Rep. Med. 2021, 2, 100348. [Google Scholar] [CrossRef] [PubMed]
- Gasmi, A.; Benlamri, R. Augmented reality, virtual reality and new age technologies demand escalates amid COVID-19. In Novel AI and Data Science Advancements for Sustainability in the Era of COVID-19; Academic Press: Cambridge, MA, USA, 2022; pp. 89–111. [Google Scholar] [CrossRef]
- Asadzadeh, F.; Samad-Soltani, T.; Rezaei-Hachesu, P. Applications of virtual and augmented reality in infectious disease epidemics with a focus on the COVID-19 outbreak. J. Med. Syst. 2021, 45, 100579. [Google Scholar] [CrossRef]
- Ronneberger, O.; Fischer, P.; Brox, T. U-net: Convolutional networks for biomedical image segmentation. In Proceedings of the Medical Image Computing and Computer-Assisted Intervention–MICCAI 2015: 18th International Conference, Munich, Germany, 5–9 October 2015; Proceedings, Part III. Springer International Publishing: Cham, Switzerland, 2015; pp. 234–241. [Google Scholar]
- Microsoft, SpectatorView Pro Code on GitHub. Available online: https://github.com/Microsoft/MixedRealityCompanionKit/tree/master/SpectatorView (accessed on 25 February 2024).
- Ma, J.; Wang, Y.; An, X.; Ge, C.; Yu, Z.; Chen, J.; Zhu, Q.; Dong, G.; He, J.; He, Z.; et al. Towards Efficient COVID-19 CT Annotation: A Benchmark for Lung and Infection Segmentation. arXiv 2020, arXiv:2004.12537. [Google Scholar]


| CTIS | Proportion |
|---|---|
| 0 | 0% involvement |
| 1 | <5% involvement |
| 2 | 5%∼25% involvement |
| 3 | 26%∼49% involvement |
| 4 | 50%∼75% involvement |
| 5 | >75% involvement |
| Methods | Dice (%) |
|---|---|
| U-Net [10] | 77.50 |
| Inf-Net [11] | 78.63 |
| Graph-PGCR [12] | 80.58 |
| Slow | ← | → | Fast | ||
| Move speed | 1 | 2 | 3 | ➃ | 5 |
| Rotation speed | 1 | 2 | 3 | ➃ | 5 |
| Poor | ← | → | Excellent | ||
| Intuitive | 1 | 2 | 3 | 4 | ➄ |
| Smoothness | 1 | 2 | ➂ | 4 | 5 |
| Precision | 1 | 2 | 3 | ➃ | 5 |
| Button sensitivity | 1 | 2 | 3 | ➃ | 5 |
| Fatigue | 1 | 2 | 3 | ➃ | 5 |
| Comfort of glasses | 1 | 2 | ➂ | 4 | 5 |
| Clarification of ratio | 1 | 2 | 3 | ➃ | 5 |
| COVID-19 stereoscopic | 1 | 2 | 3 | 4 | ➄ |
| COVID-19 clearness | 1 | 2 | 3 | 4 | ➄ |
| Help for diagnosis | 1 | ➁ | 3 | 4 | 5 |
| Help for education | 1 | 2 | 3 | ➃ | 5 |
Disclaimer/Publisher’s Note: The statements, opinions and data contained in all publications are solely those of the individual author(s) and contributor(s) and not of MDPI and/or the editor(s). MDPI and/or the editor(s) disclaim responsibility for any injury to people or property resulting from any ideas, methods, instructions or products referred to in the content. |
© 2024 by the authors. Licensee MDPI, Basel, Switzerland. This article is an open access article distributed under the terms and conditions of the Creative Commons Attribution (CC BY) license (https://creativecommons.org/licenses/by/4.0/).
Share and Cite
Liu, J.; Lyu, L.; Chai, S.; Huang, H.; Wang, F.; Tateyama, T.; Lin, L.; Chen, Y. Augmented Reality Visualization and Quantification of COVID-19 Infections in the Lungs. Electronics 2024, 13, 1158. https://doi.org/10.3390/electronics13061158
Liu J, Lyu L, Chai S, Huang H, Wang F, Tateyama T, Lin L, Chen Y. Augmented Reality Visualization and Quantification of COVID-19 Infections in the Lungs. Electronics. 2024; 13(6):1158. https://doi.org/10.3390/electronics13061158
Chicago/Turabian StyleLiu, Jiaqing, Liang Lyu, Shurong Chai, Huimin Huang, Fang Wang, Tomoko Tateyama, Lanfen Lin, and Yenwei Chen. 2024. "Augmented Reality Visualization and Quantification of COVID-19 Infections in the Lungs" Electronics 13, no. 6: 1158. https://doi.org/10.3390/electronics13061158