Article

Optimal Beamwidth for Maximizing Uplink Coverage Probability in Quasi Earth-Fixed LEO Satellite Communication System

1
Department of Communications Engineering, National Chung Cheng University, Chiayi 621301, Taiwan
2
Advanced Institute of Manufacturing with High-Tech Innovations, National Chung Cheng University, Chiayi 621301, Taiwan
*
Authors to whom correspondence should be addressed.
Electronics 2024, 13(7), 1349; https://doi.org/10.3390/electronics13071349
Submission received: 17 February 2024 / Revised: 24 March 2024 / Accepted: 1 April 2024 / Published: 3 April 2024

Abstract

:
Satellite communication is proposed to fulfill the ubiquitous coverage for next-generation wireless networks. Considering the propagation delay and path loss, low-earth orbit (LEO) satellites are widely adopted. However, since the beam boresight directions become close in quasi-earth-fixed cells (QEFC) scenarios at low elevation angles, the interference increases and causes low communication quality. This paper introduces the optimal beamwidth maximizing uplink coverage probability scheme for quasi-earth-fixed cells in LEO satellite communication systems. The proposed scheme dynamically adjusts the beamwidth to achieve max uplink coverage probability at different elevation angles. The simulation results show that the proposed scheme matches the exhaustive search method in different scenarios and target signal-to-interference-plus-noise ratios. Furthermore, the proposed scheme significantly mitigates interference and improves the uplink coverage probability. Compared with the 3GPP setting, the proposed scheme improves the uplink coverage probability by 0.93 at time 100 s, and compared with the three-color frequency reuse, the proposed scheme improves the uplink coverage probability by 0.195 at time 100 s. The dynamic beamwidth and boresight direction adjustments enable the satellite to maintain seamless and reliable communication services across a wide range of operating conditions, ultimately realizing the goal of ubiquitous communications in the QEFC LEO satellite system.

1. Introduction

The fifth-generation mobile network (5G) is expected to provide high-quality communications, such as a high sum rate, low latency, extended coverage, and low power consumption [1]. However, ubiquitous coverage remains a significant challenge to solve. According to [2], an estimated 34 percent of the global population cannot use the Internet. To ensure the anytime and anywhere 5G service, satellite communication, also called non-terrestrial networks (NTNs), was proposed and is becoming increasingly popular. The satellite communication system provides a comprehensive coverage area, an attractive solution for ubiquitous wireless coverage for next-generation wireless networks, especially in areas where terrestrial networks are difficult to deploy or are cost-prohibitive [3]. The Third-Generation Partnership Project (3GPP), an international standardization organization for mobile telecommunications, started studying and standardizing how to implement satellite communication on the 5G New Radio (NR) system in Release 15 and 17. Compared with medium-earth and geostationary orbit, low-earth orbit (LEO) satellites, with altitudes less than 2000 km, they are an attractive solution to achieving ubiquitous wireless coverage and high spectral efficiency by considering propagation delay and channel attenuation.
Two types of LEO service links are introduced in the 3GPP standard (as shown in Figure 1):
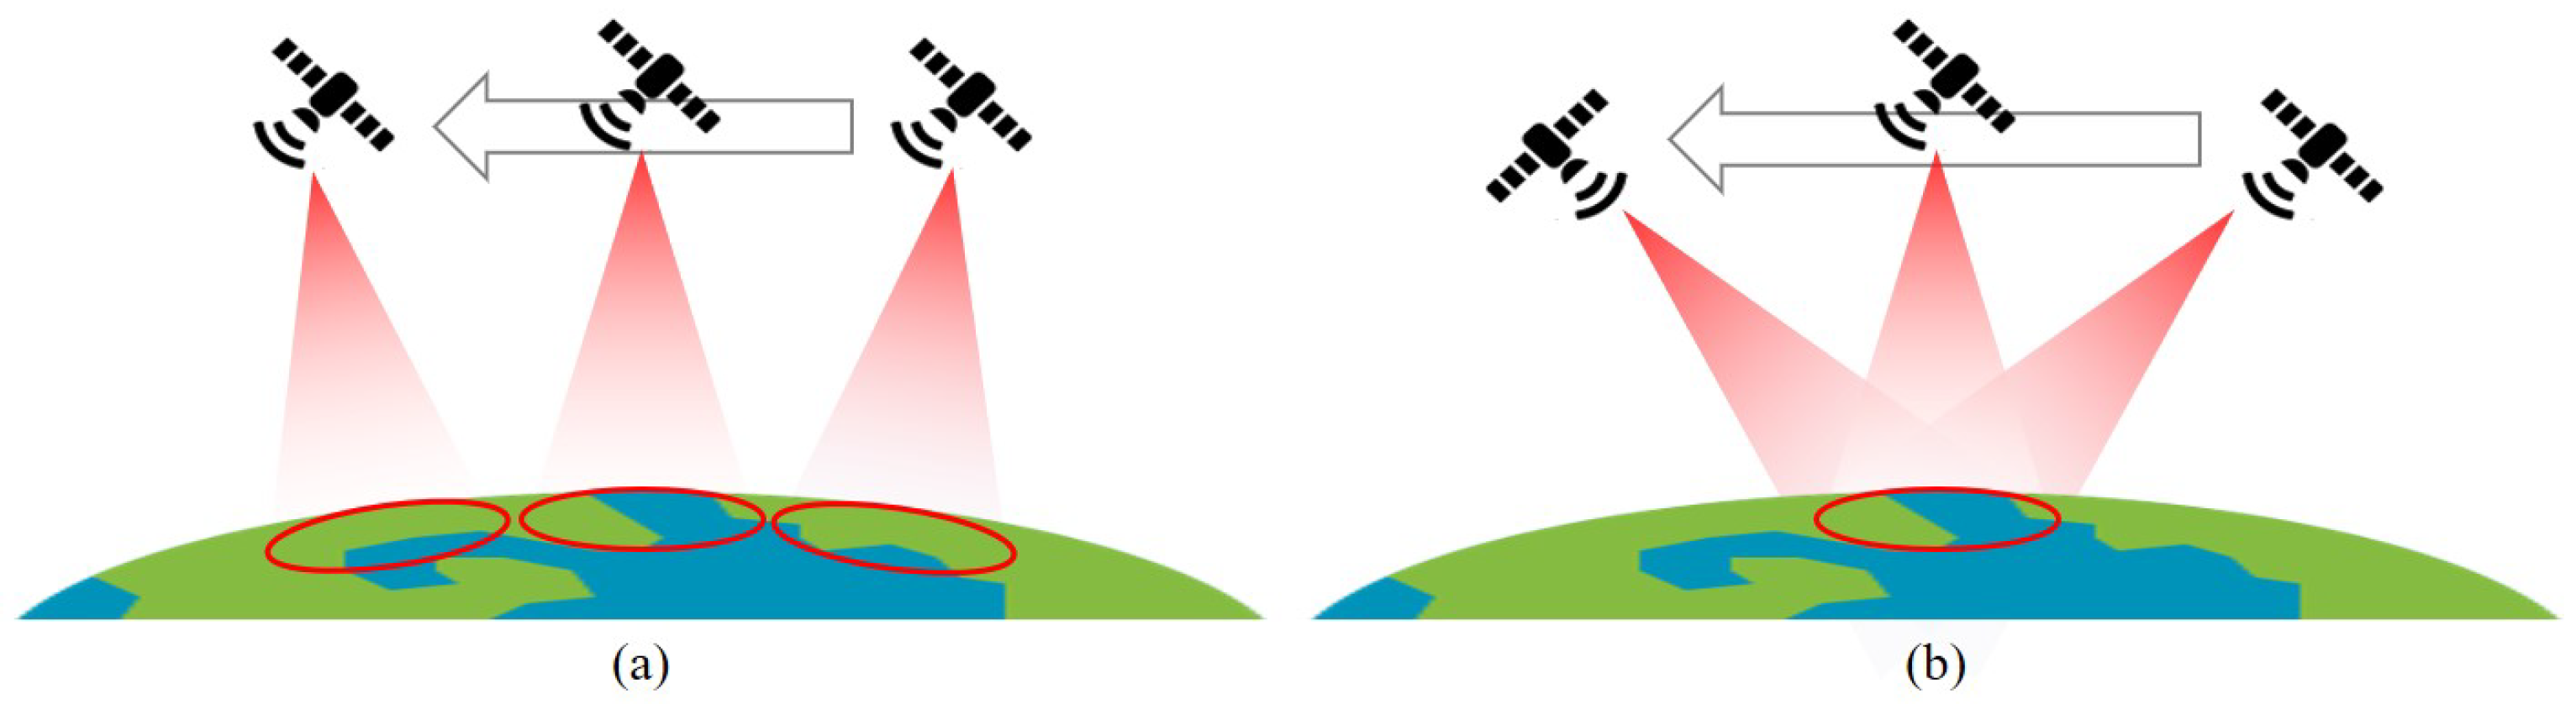
  • Quasi earth-fixed cells (QEFC): satellites can compensate and steer the beams at the same position on the earth while satellites move.
  • Earth-moving cells (EMC): satellites cannot provide steerable beams. The position of beams changes while satellites move.
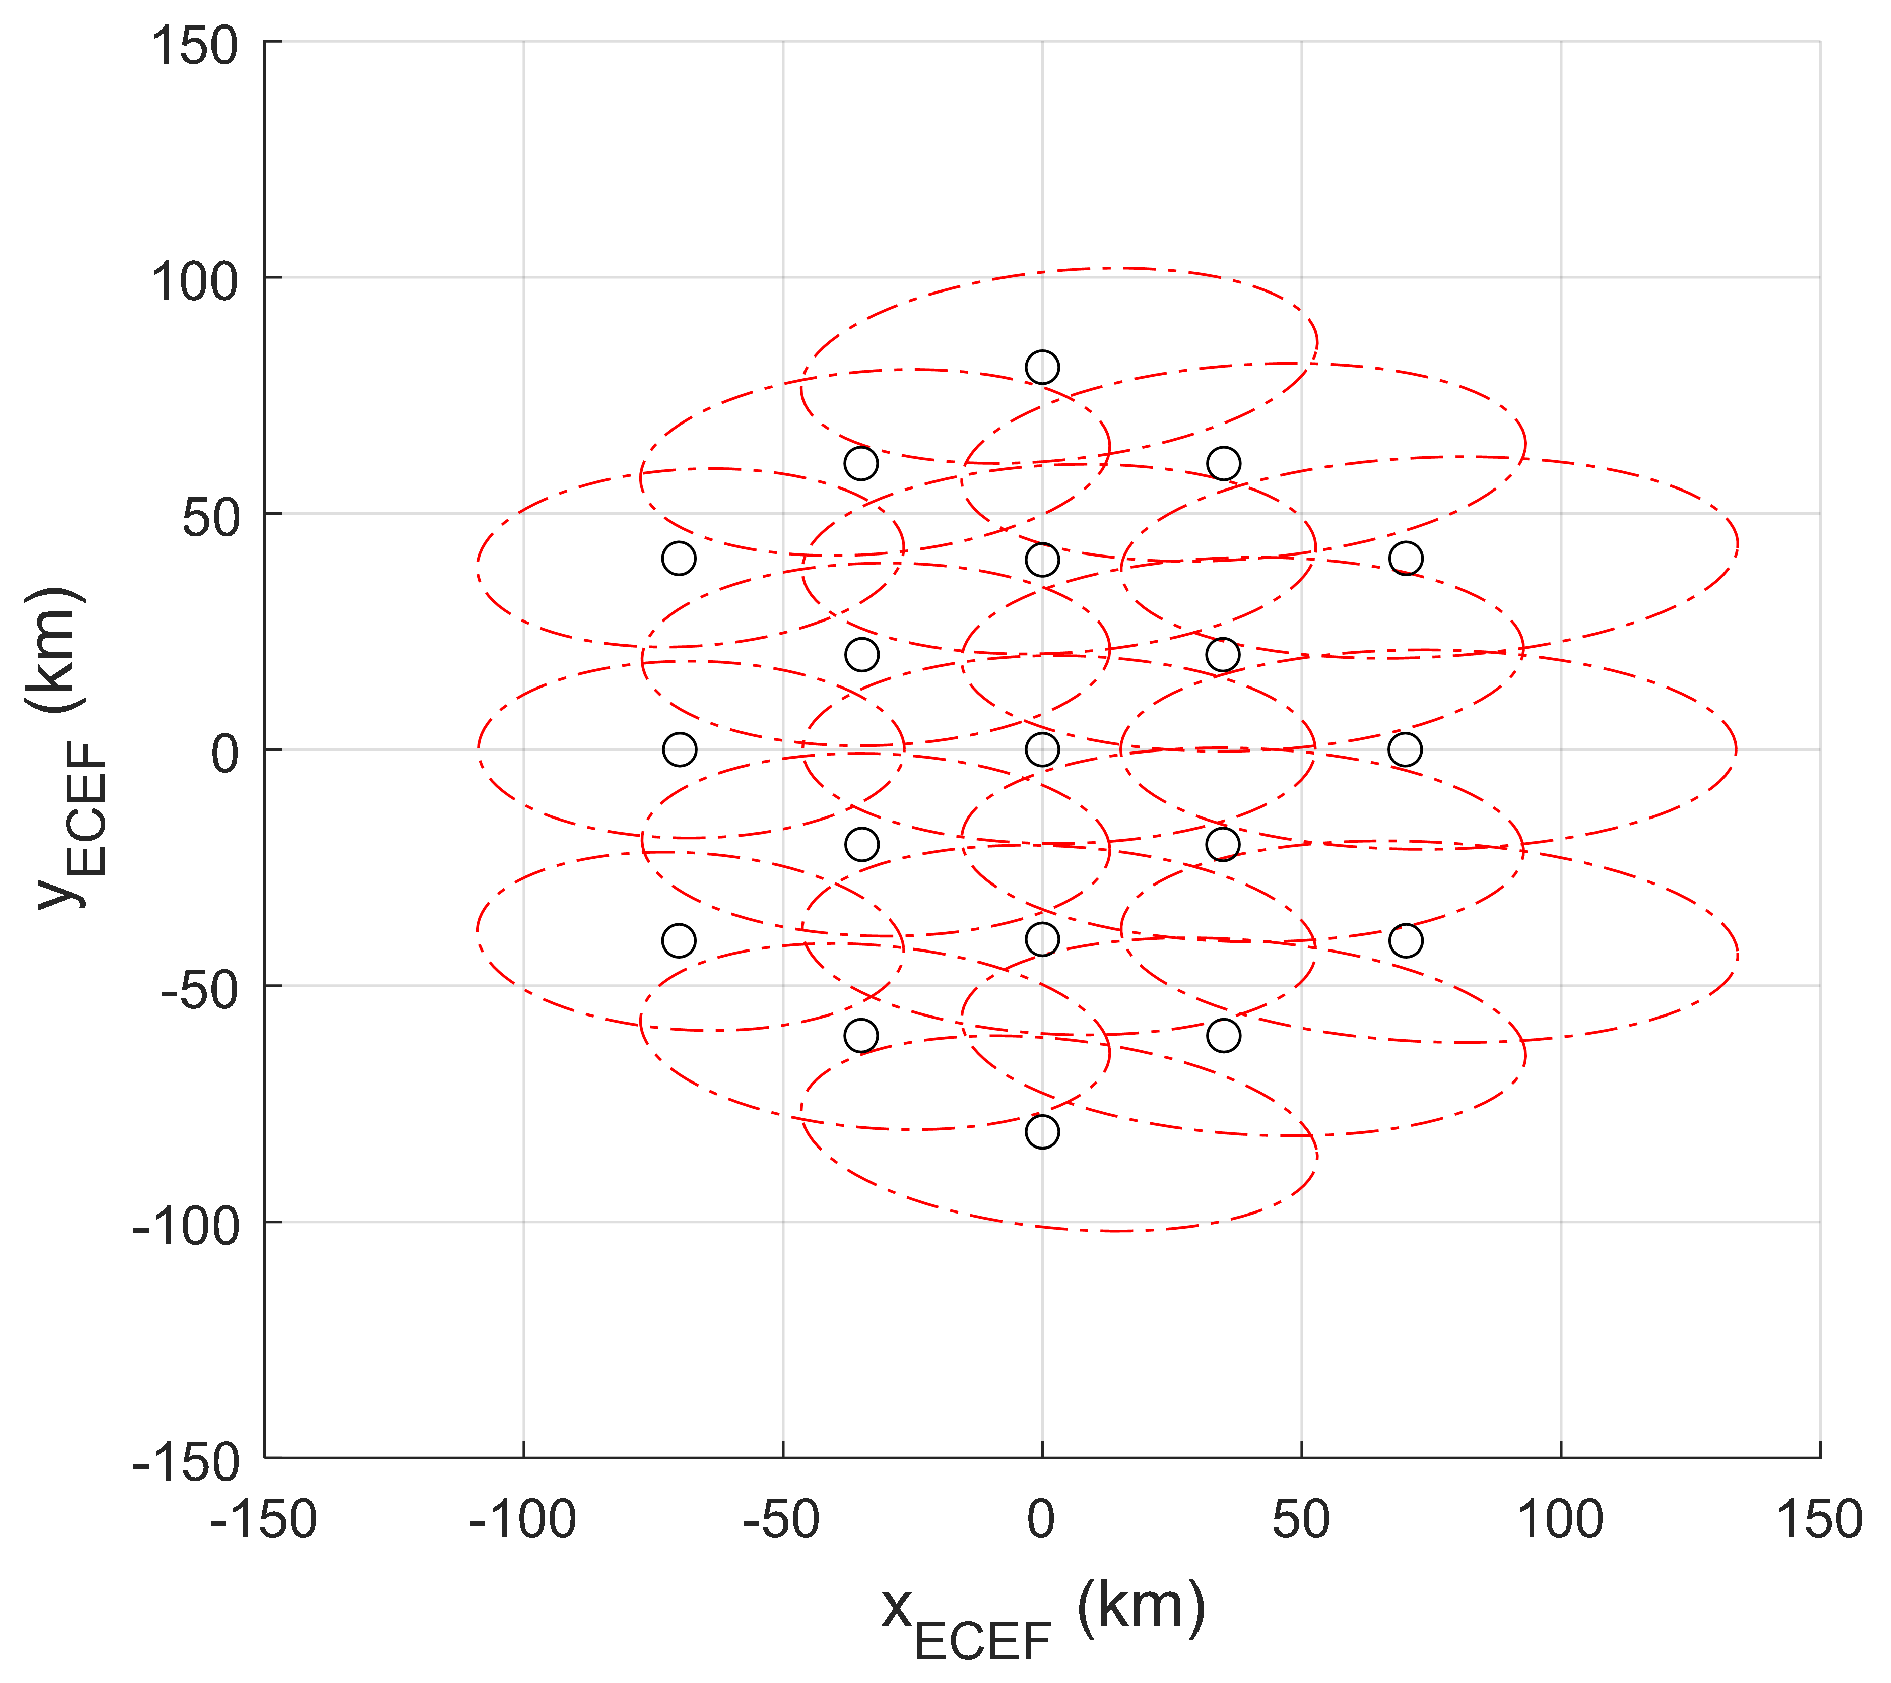
Since the earth-moving LEO satellite moves very fast and each provides many beams, user equipment (UE) can stay inside the beam footprint for only a few seconds [4]. The rapid footprint location change creates problems for paging and handover [5]. Although 3GPP reduces the neighbor cell measurements for handover procedures with predictable satellite locations using ephemeris information in Release 17, the network still needs to spend a lot of resources on random access procedures to handle the frequent handovers of numerous UEs.
The QEFC LEO satellites are designed to steer beams to specific areas on Earth within configurable time frames, solving frequent handover issues. Over the years, 3GPP has developed various handover strategies for the QEFC scenario, such as conditional handover in Release 17 and satellite switch with re-sync in Release 18 [6]. The QEFC scenario holds significance for the cellular satellite communications network. However, despite this importance, only a few studies have discussed and analyzed the performance of QEFC satellites. The authors of [7] evaluated the throughput and reference signal received power with different beam-fixed time durations, and the authors of [8] evaluated different elevation angles’ downlink signal-to-noise-plus-interference ratio (SINR). The evaluation results show that UEs have low communication quality at low elevation angles. However, they did not delve into the reasons behind this performance drop or propose any solutions. Hence, addressing the issue of low SINR to enhance signal quality for mobile satellite communications in the QEFC scenario is essential. This paper aims to fill this gap by evaluating and analyzing the SINR of QEFC LEO satellites and proposing solutions to mitigate the low SINR problem, ultimately striving towards achieving ubiquitous coverage.
Since the max transmission power of a handheld user devices is limited to 0.2 watts, it is hard for the receiver to decode the uplink signal successfully with the long-distance communication system. Some uplink coverage enhancements were proposed to strengthen the receiving power in the 3GPP NR standard, including physical uplink shared channel (PUSCH) repetition [9], joint channel estimation [9], and peak-to-average-power ratio reduction [10]. To confirm whether the satellite communication system can provide 5G service, 3GPP analyzed the uplink link budget for NTNs. Unfortunately, the analysis showed that the carrier-to-noise ratio is insufficient to provide voice-over NR (VoNR) service (4.75 kbps) at an elevation angle of 30 degrees for LEO 1200 km satellites with the existing PUSCH repetition method [11,12]. Thus, 3GPP discussed and supported joint channel estimation for NR NTN in Release-18. Moreover, 3GPP did not consider interference; interference leads to worse coverage performance.
The interference mitigation scheme must be studied to provide ubiquitous coverage in the QEFC satellite communication system. One of the well-known interference mitigation solutions for satellite communication is frequency reuse. The frequency reuse scheme divides the frequency band into sub-bands so that the adjacent beams have disjoint frequency bands [13]. Although frequency reuse significantly mitigates the interference, it reduces the available bandwidth for each beam. Furthermore, frequency reuse does not solve the severe path loss problem; the performance still degrades at low elevation angles due to high path loss. Another interference mitigation scheme is beamwidth control. SpaceX in [14] mentions that the increasing size of the spot on the ground increases the potential for interference with other beams using the same frequencies. SpaceX controls the half-power beamwidth between 2.15 and 2.45 in the Ku-band to mitigate interference by controlling the active antenna elements at various steering angles [14]. The authors of [15] controlled the beamwidth and altitude of the satellite to maximize uplink coverage probability. The controlled beamwidth mitigates interference by limiting the interference region and improves the uplink coverage probability. However, the authors of [15] did not consider the antenna pattern effect, an essential issue in directional antenna systems.
Based on the above discussion, this paper evaluates the performance of QEFC LEO satellites, an area that has received relatively less attention. We analyze serving and interference power for each elevation angle by considering the antenna gain, antenna pattern, and large-scale fading. To improve the uplink coverage probability and solve the low SINR problem highlighted in [7,8], especially at low elevation angles, we propose the optimal beamwidth maximizing uplink coverage probability scheme. The proposed scheme maximizes uplink coverage probability with target SINR for QEFC LEO satellites by tuning beamwidth for different elevation angles.
The remainder of the paper is organized as follows. The primary notations in this paper are listed in Table 1. Section 2 introduces the system model, which is the large-scale channel model described in [16]. Section 3 introduces the proposed optimal beamwidth maximizing uplink coverage probability. Three parts are included in the proposed scheme: beam boresight direction, uplink coverage probability analysis model, and beamwidth optimization. The numerical results and discussion of the proposed scheme are shown in Section 4. Finally, the concluding remarks are in Section 5.

2. System Model

This paper evaluates and analyzes the multi-beam QEFC LEO satellite system with inter-beam interference. We use the NTN large-scale channel model defined in [16]. We assume all users are transmitting with the same power P t . The receiving power P s , l ( t , m ) from user s to beam l in satellite with equivalent antenna aperture m at time t is given by
P s , l ( t , m ) = P t L s ( t ) κ ϵ s , l ( t ) ζ ϵ s , l ( t ) + G ( φ l s ( t ) , m ) .
Path loss L s of user s consists of free-space path loss (FSPL), ionospheric loss of 2.2 dB [17], atmospheric loss, building entry loss, and polarization loss of 3 dB [17]. This paper assumes all users are outdoors, and atmospheric loss is negligible in the S-band. Atmospheric loss and building entry loss are equal to zero. The path loss is obtained as follows [16]:
L s ( t ) = F S P L s ( t ) + 2.2 + 3
F S P L s ( t ) = 32.45 + 20 log 10 f c + 20 log 10 d s ( t )
d s ( t ) = | | x s a t ( t ) x s ( t ) | |
where x s a t is the location vector of satellite, x s is the location vector of UE s, d s is the distance between user s and the satellite, h is the satellite height, R E is the earth radius, and f c is carrier frequency.
In the 3GPP satellite communication system, the equivalent antenna aperture is used to model the satellite antenna. The larger equivalent antenna aperture represents more active antenna elements, which form a narrower and higher power gain beam. The antenna gain is calculated as follows [16,18]:
G ( ϕ , m ) = 10 log 10 η π 2 m 2 λ 2 g ( ϕ , m )
g ( ϕ , m ) = 1 , if ϕ = 0 4 | J 1 ( π m λ 1 sin ϕ ) π m λ 1 sin ϕ | 2 , otherwise
where m is equivalent antenna aperture, ϕ is the angle between the boresight of the beam and UE, J 1 ( . ) is the first-kind and first-order Bessel function, λ is the wave length, and η is the antenna aperture efficiency 0.57. The maximum antenna gain is 10 log 10 η π 2 m 2 λ 2 dBi. Finally, the SINR ξ s , l from user s S l to the serving beam l L f in the satellite expressed as linear form can be derived as follows
ξ s , l ( t , m ) = P s , l ( t , m ) k L f l s S k ρ s , s P s , l ( t , m ) + N
s . t . s S k ρ s , s = 1
where N is noise power, and ρ s , s { 0 , 1 } is the scheduling factor that captures the interference from other beams in shared resources. While ρ s , s = 1 represents that user s transmits in the same radio resource with user s and interferes with user s; while ρ s , s = 0 represents that user s does not interfere user s. In this paper, we assume the number of scheduled users in one resource block of each beam is limited to one, as described in (8).

3. Optimal Beamwidth Maximizing Uplink Coverage Probability Scheme

The proposed optimal beamwidth maximizing the uplink coverage probability scheme aims to address the increasing FSPL and mitigate inter-beam interference simultaneously by tuning the active antenna element number to control the beamwidth and antenna gain. This scheme utilizes a satellite equipped with a phased array antenna to facilitate adjustable beamwidth. The phased array antenna allows beam direction management as the satellite moves, meeting the demand for steerable beams in the QEFC system. This section introduces the management of the beam boresight direction, the uplink coverage probability analysis model, and the optimization function of the proposed scheme.

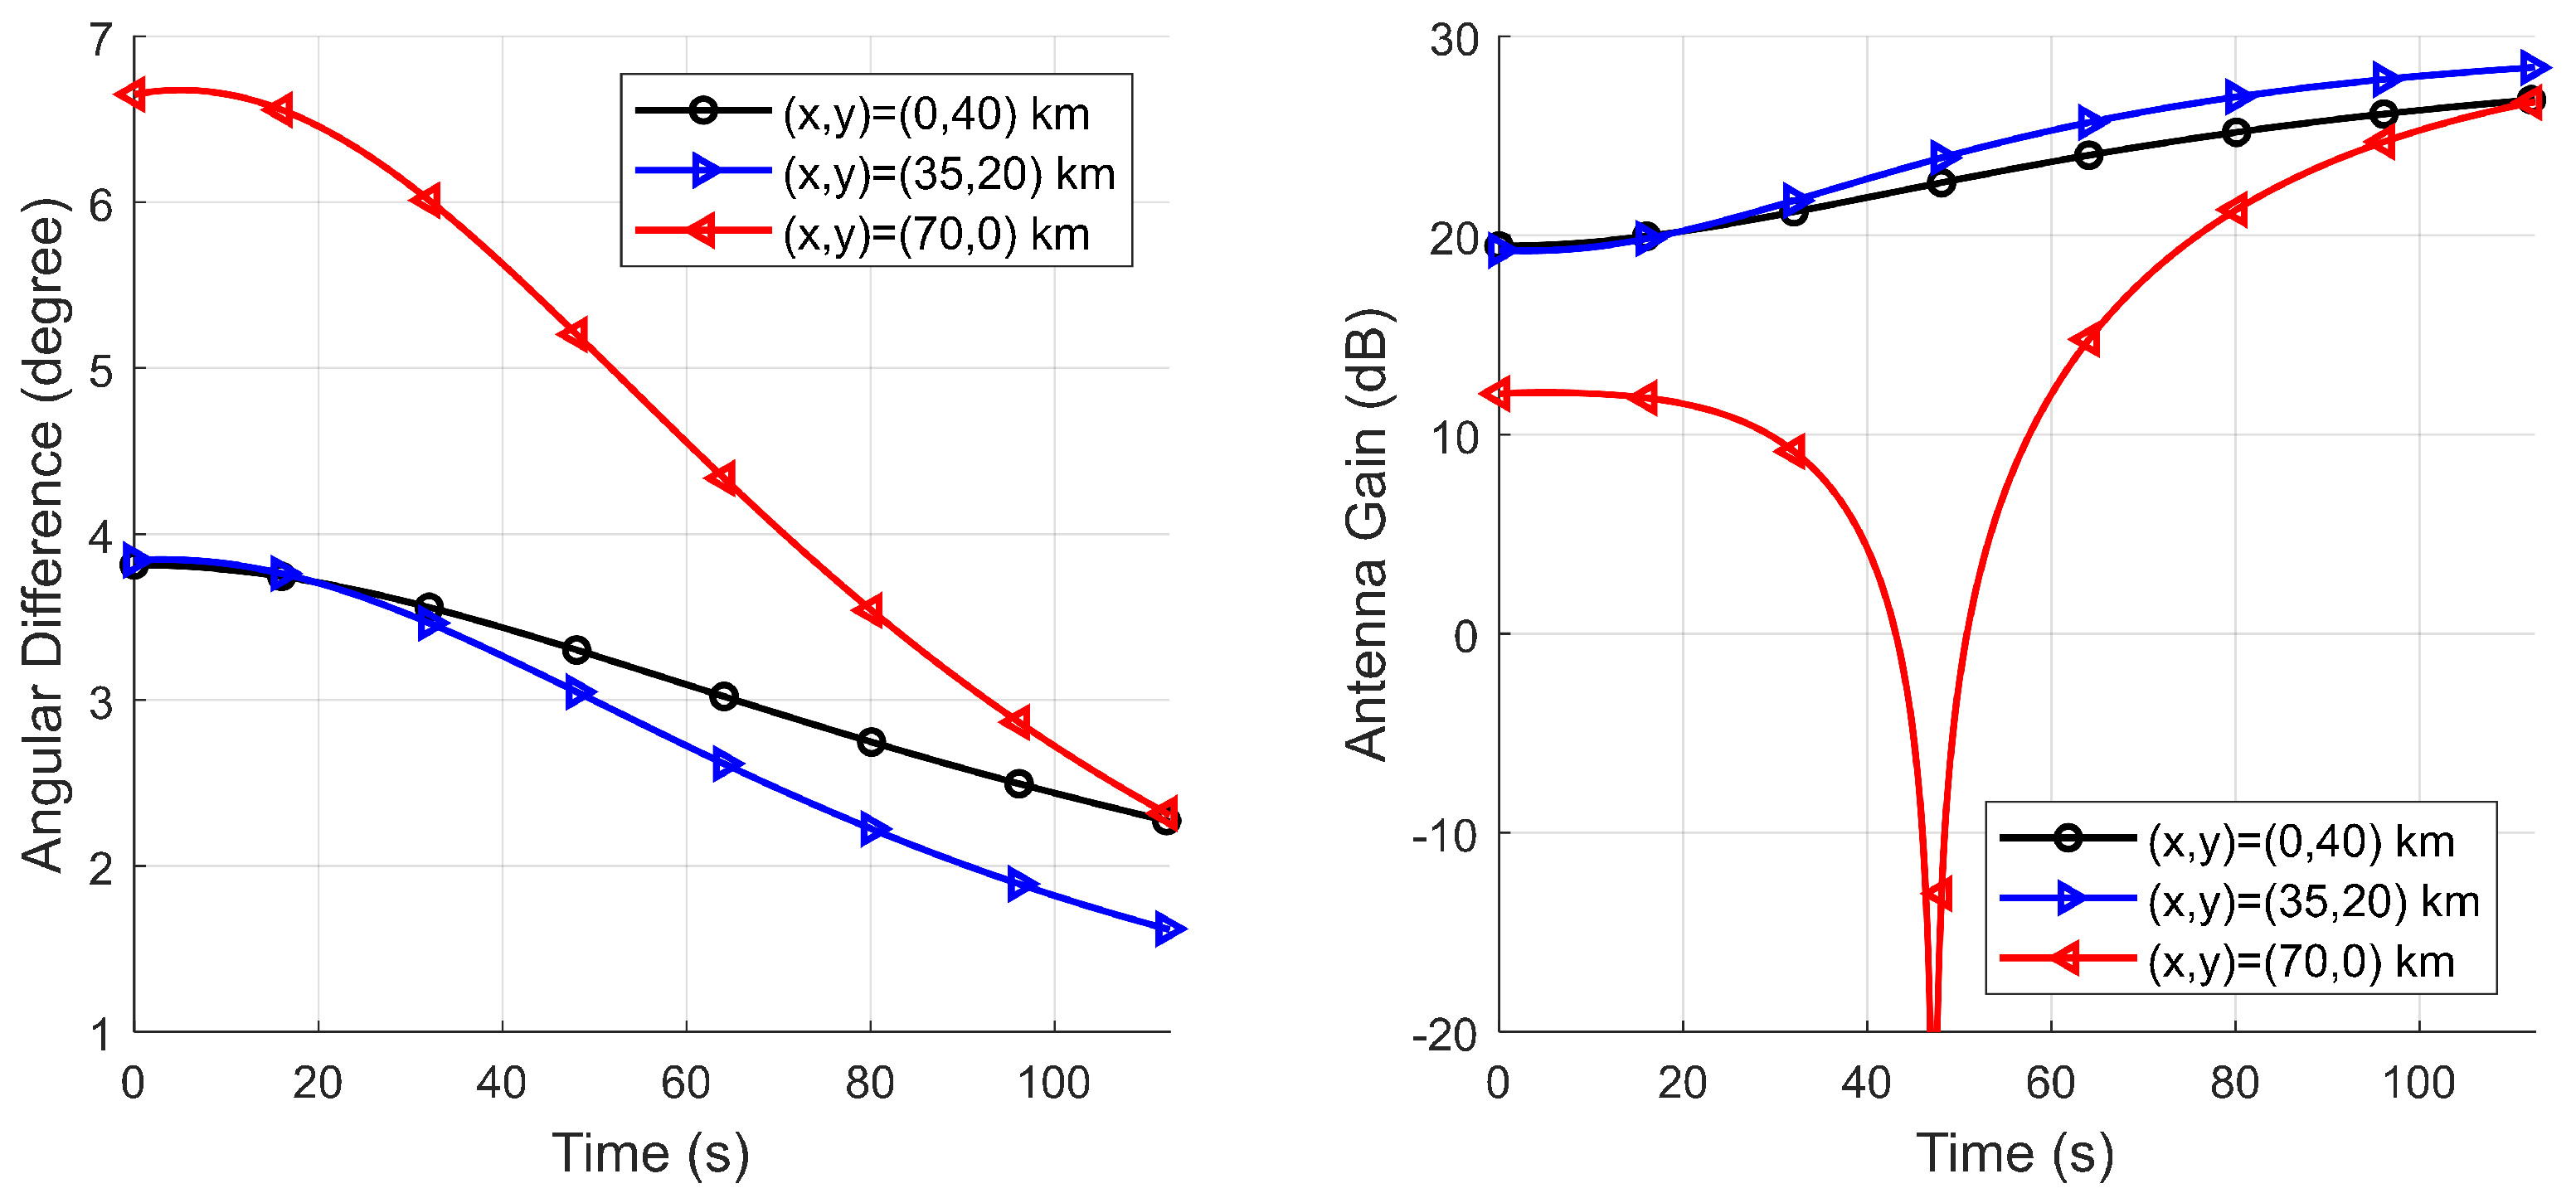
3.1. Beam Boresight Direction

In the QEFC satellite system, the network and satellite need to calculate and decide the beam boresight direction during the beam-fixed time. This section introduces the beam topology defined in [18] and formulates the beam boresight direction. The beam position is expressed as Earth-Centered Earth-Fixed (ECEF) coordinates [ x l y l z l ] T . Our beam topology follows [18] with the adjacent beam spacing is 3 . 82 , half-power beamwidth is 4 . 4127 , and the distance of the adjacent beam is around 40.2 km. With the pre-defined beam topology and the satellite orbit, the beam boresight direction [ ϕ l ( t ) θ l ( t ) ] can be calculated based on the satellite angular speed ω and relative beam position [ x l ( t ) y l ( t ) z l ( t ) ] T at time t as follows:
ω = G E · M E ( R E + h ) 3 = 3.98 × 10 14 ( R E + h ) 3
v l ( t ) = x ^ l ( t ) y ^ l ( t ) z ^ l ( t ) = cos ( ω t ) 0 sin ( ω t ) 0 1 0 sin ( ω t ) 0 cos ( ω t ) x l y l z l
x ^ 0 ( 0 ) y ^ 0 ( 0 ) z ^ 0 ( 0 ) = x 0 y 0 z 0 = 0 0 R E
δ l ( t ) = arccos z ^ l ( t ) R E
ϕ l ( t ) = arccos R E + h R E cos δ l ( t ) R E 2 + ( R E + h ) 2 2 R E ( R E + h ) cos δ l ( t )
θ l ( t ) = arctan y ^ l ( t ) x ^ l ( t )
ϵ l ( t ) = π 2 λ l ( t ) ϕ l ( t )
where G E is the earth’s gravitational constant, M E is the earth’s mass, ϕ l ( t ) and θ l ( t ) are the zenith and azimuth angle of departure, l = 0 denotes the center beam, and t = 0 denotes the time when ϵ 0 ( 0 ) = π 2 . The example for (12) to (15) is shown in Figure 2. With the defined beam boresight direction, the angular difference between beam l and user s can be calculated as follows:
φ l s ( t ) = arccos | | x s a t ( t ) x s ( t ) | | 2 + | | x s a t ( t ) v l ( t ) | | 2 | | x u ( t ) v l ( t ) | | 2 2 | | x s a t ( t ) x u ( t ) | | · | | x s a t ( t ) v l ( t ) | | .

3.2. Uplink Coverage Probability Analysis Model

This section uses mathematical reasoning to build the uplink coverage probability analysis model. The uplink coverage probability analysis model calculates the uplink coverage probability with different time t (different elevation angle), equivalent antenna aperture m, and target SINR γ . Since the elevation angle and footprint are different within each beam, the uplink coverage probability of the satellite should be calculated beam by beam. We calculate the uplink coverage probability p ( t , m , γ ) of the satellite by the uplink coverage probability of each beam with weighting as follows:
p ( t , m , γ ) = f F l L f w l P ( ξ s , l ( t , m ) γ )
s . t . | F | = 1 , t { T π 6 ϵ l ( t ) π 2 }
where w l is the ratio of the coverage area of beam l. Since the FSPL and elevation angle result in minor changes within a beam, our model uses the location of the beam center to present the FSPL and elevation angle to reduce the computation complexity as follows:
P ( ξ s , l ( t , m ) γ ) = P ( κ ϵ s , l ζ ϵ s , l + G ( φ l s ( t ) , m ) α s , l ( t ) ) P ( κ ϵ l ζ ϵ l + G ( φ l s ( t ) , m ) α l ( t ) )
α l ( t ) = γ P t + L l ( t ) + W l ( t )
W l ( t ) = 10 log 10 ( 10 N / 10 + I l ¯ ( t ) )
where W l ( t ) is the interference-plus-noise power of beam l at time t, and I l ¯ ( t ) is the expect interference power received in beam l at time t. Similarly, our model uses the location of the interference beam center to present the FSPL and elevation angle. Since shadow fading follows zero-mean Gaussian distribution, it is neglectable for the expected interference. Moreover, since the clutter is zero for LOS users, the LOS probability should be considered. Considering the LOS probability and received antenna gain, the expected interference power in linear form is calculated as
I l ¯ ( t ) = k L f l p L O S , ϵ k 10 ( P t L k + G ( φ k , l ( t ) , m ) ) / 10 + p N L O S , ϵ k 10 ( P t L k + G ( φ k , l ( t ) , m ) ) / 10
where φ k , l ( t ) denotes the angular difference between two beams. The angular difference can be derived similarly to (16) as follows:
φ k , l ( t ) = arccos | | x s a t ( t ) v k ( t ) | | 2 + | | x s a t ( t ) v l ( t ) | | 2 | | v k ( t ) v l ( t ) | | 2 2 | | x s a t ( t ) v k ( t ) | | · | | x s a t ( t ) v l ( t ) | | .
To calculate the uplink coverage probability in (19), the cumulative distribution function (CDF) for clutter loss, shadow fading, and antenna gain needs to be discussed. Clutter loss and shadow fading distributions follow LOS probability and Gaussian distribution, which can be calculated with low complexity. However, the adjacent beam spacing for each beam is different, so it is complex to calculate the probability of serving antenna gain. Thus, we simplify the model by assuming the adjacent beam spacings of each beam are the same value φ ¯ t . φ ¯ t equals to the average of adjacent beam spacings. With the assumed adjacent beam spacing φ ¯ t in the hexagonal layout, the receive antenna gain G ( φ l s ( t ) , m ) from user s to serving beam l is calculated by assuming 0 φ l s ( t ) φ ¯ t 3 , and the probability of receive antenna gain is determined as follows (as shown in Figure 3):
p φ ¯ t ( φ ) = 2 π φ A , if 0 φ φ ¯ t 2 12 φ A [ π 6 arccos ( φ ¯ t 2 φ ) ] , if φ ¯ t 2 < φ φ ¯ t 3 .
A = 3 φ ¯ t 2 2 .
Finally, the (19) can be driven to joint CDF form as follows:
P ( κ ϵ l ζ ϵ l + G ( φ s , l ( t ) , m ) α l ( t ) ) = P ( G ( φ s , l ( t ) , m ) ζ ϵ l α l ( t ) κ ϵ l ) = 0 φ ¯ t 3 p φ ¯ t ( φ ) P ( G ( φ , m ) ζ ϵ l α l ( t ) κ ϵ l ) d φ = p L O S , ϵ l 0 φ ¯ t 3 p φ ¯ t ( φ ) P L O S ( κ ϵ l G ( φ , m ) α l ( t ) ) d φ + p N L O S , ϵ l 0 φ ¯ t 3 p φ ¯ t ( φ ) P N L O S ( κ ϵ l G ( φ , m ) α l ( t ) ζ ϵ l ) d φ = p L O S , ϵ l 0 φ ¯ t 3 p φ ¯ t ( φ ) 1 2 [ 1 + e r f ( G ( φ , m ) α l ( t ) σ L O S , ϵ l 2 ) ] d φ + p N L O S , ϵ l 0 φ ¯ t 3 p φ ¯ t ( φ ) 1 2 [ 1 + e r f ( G ( φ , m ) α l ( t ) ζ ϵ l σ N L O S , ϵ l 2 ) ] d φ

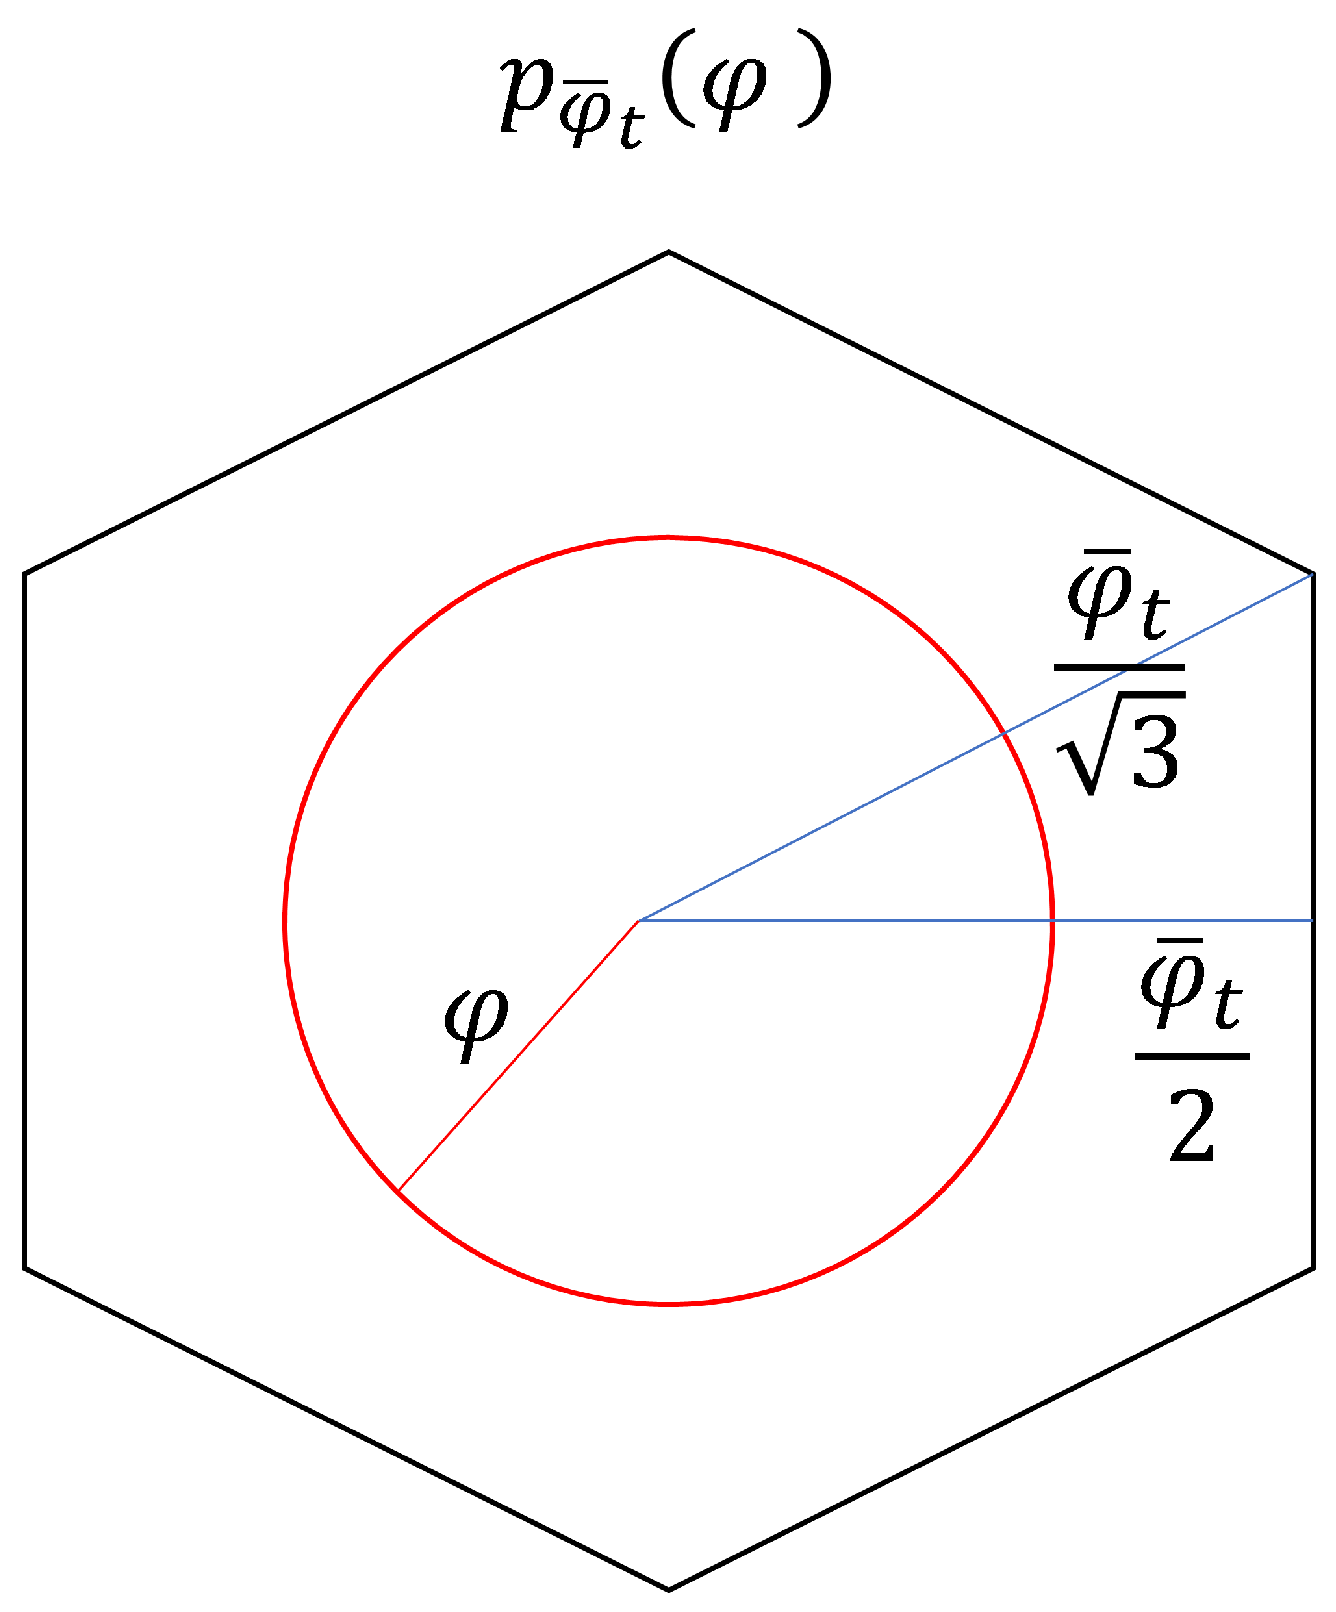
3.3. Beamwidth Optimization

Controlling the beamwidth through the number of active antenna elements, also known as the equivalent antenna aperture, is crucial for optimizing coverage in NTNs. Increasing the number of active antenna elements results in a narrower beam with higher antenna gain and vice versa. Although a narrow beam provides higher antenna gain, leading to improved signal strength and quality for users within the beam, it also results in a smaller footprint. This limited coverage area may allow users to move out of the serving area, potentially causing service interruptions or handover issues. To address this challenge, the optimal equivalent antenna aperture at different times (elevation angles) and service demands (target SINRs) can be determined using the uplink coverage probability function as follows:
m t * = argmax m p ( t , m , γ )
s . t . ( 17 ) , ( 18 ) , ( 26 ) .
Using the optimization function, satellites can dynamically adjust the number of active antenna elements during the beam-fixed time to achieve optimal performance with the service demand.
Finally, we summarize the proposed optimal beamwidth maximizing the uplink coverage probability scheme in Algorithm 1, which consists of two parts. In the first part, the satellite steers the beam to the specified position, where the departure angle follows ϕ l ( t ) and θ l ( t ) as calculated in (13) and (14). In the second part, the optimal equivalent antenna aperture m t * is calculated, and the antenna configuration is adjusted accordingly based on this optimal equivalent antenna aperture.
Algorithm 1 Optimal Beamwidth Maximizing Uplink Coverage Probability Scheme
Input: Beam position on Earth v l ( 0 ) , satellite hight h, and time t
Output: Beam boresight direction ϕ l ( t ) , θ l ( t ) , and optimal equivalent antenna aperture m t *
1:
for all Beam l L f do
2:
 Calculate relative beam position v l ( t ) from (9) to (11)
3:
 Calculate beam boresight direction ϕ l ( t ) and θ l ( t ) from (13) and (14)
4:
 Satellite steers the beam l following the beam boresight direction ϕ l ( t ) and θ l ( t )
5:
end for
6:
Calculate the optimal equivalent antenna aperture m t * from (27) and (28)
7:
Satellite tunes the beamwidth based on the optimal equivalent antenna aperture m t *

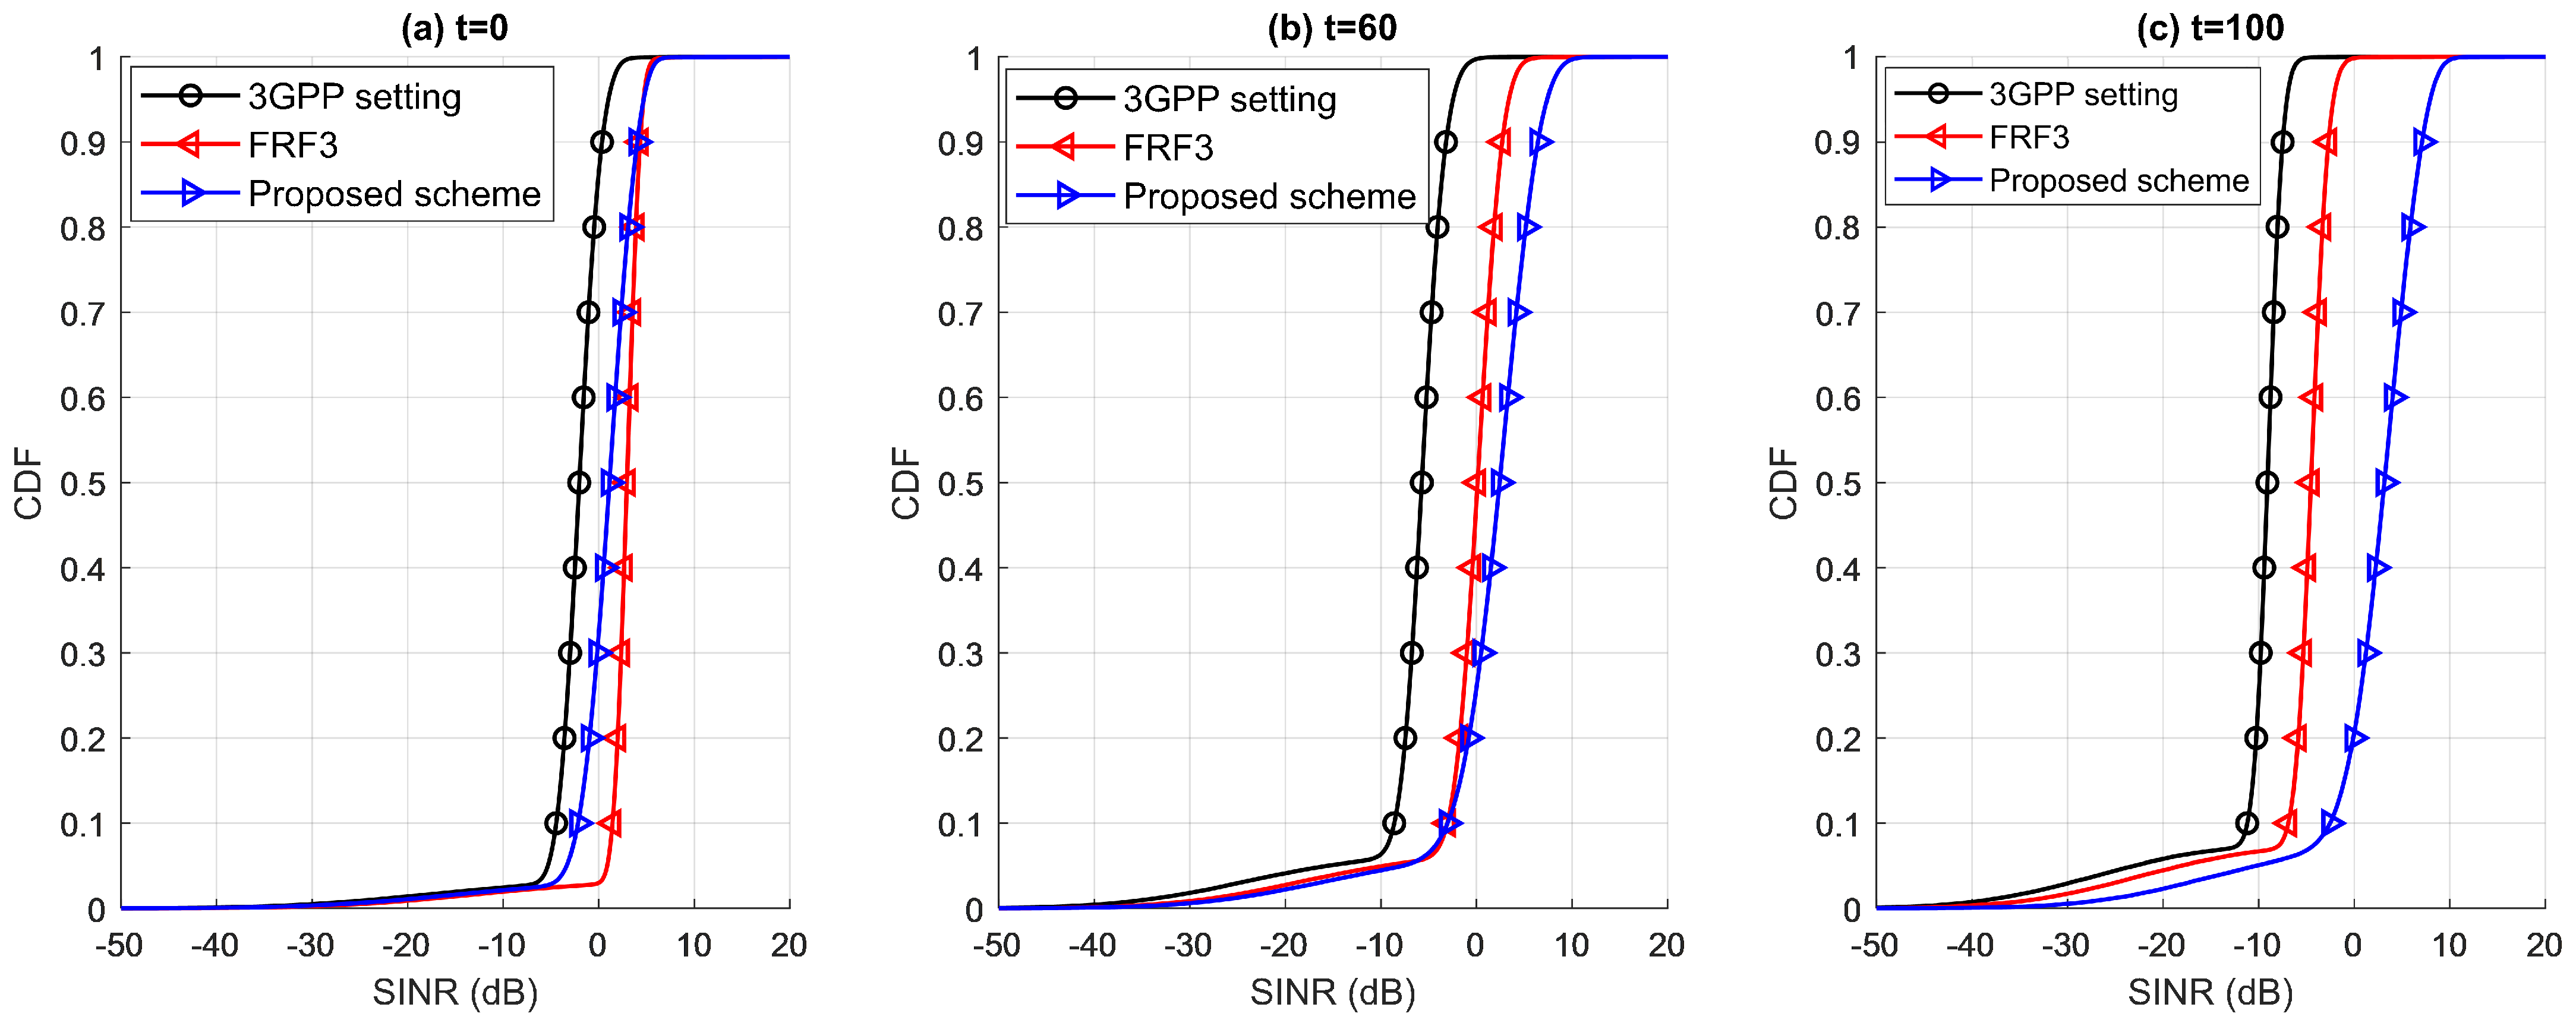
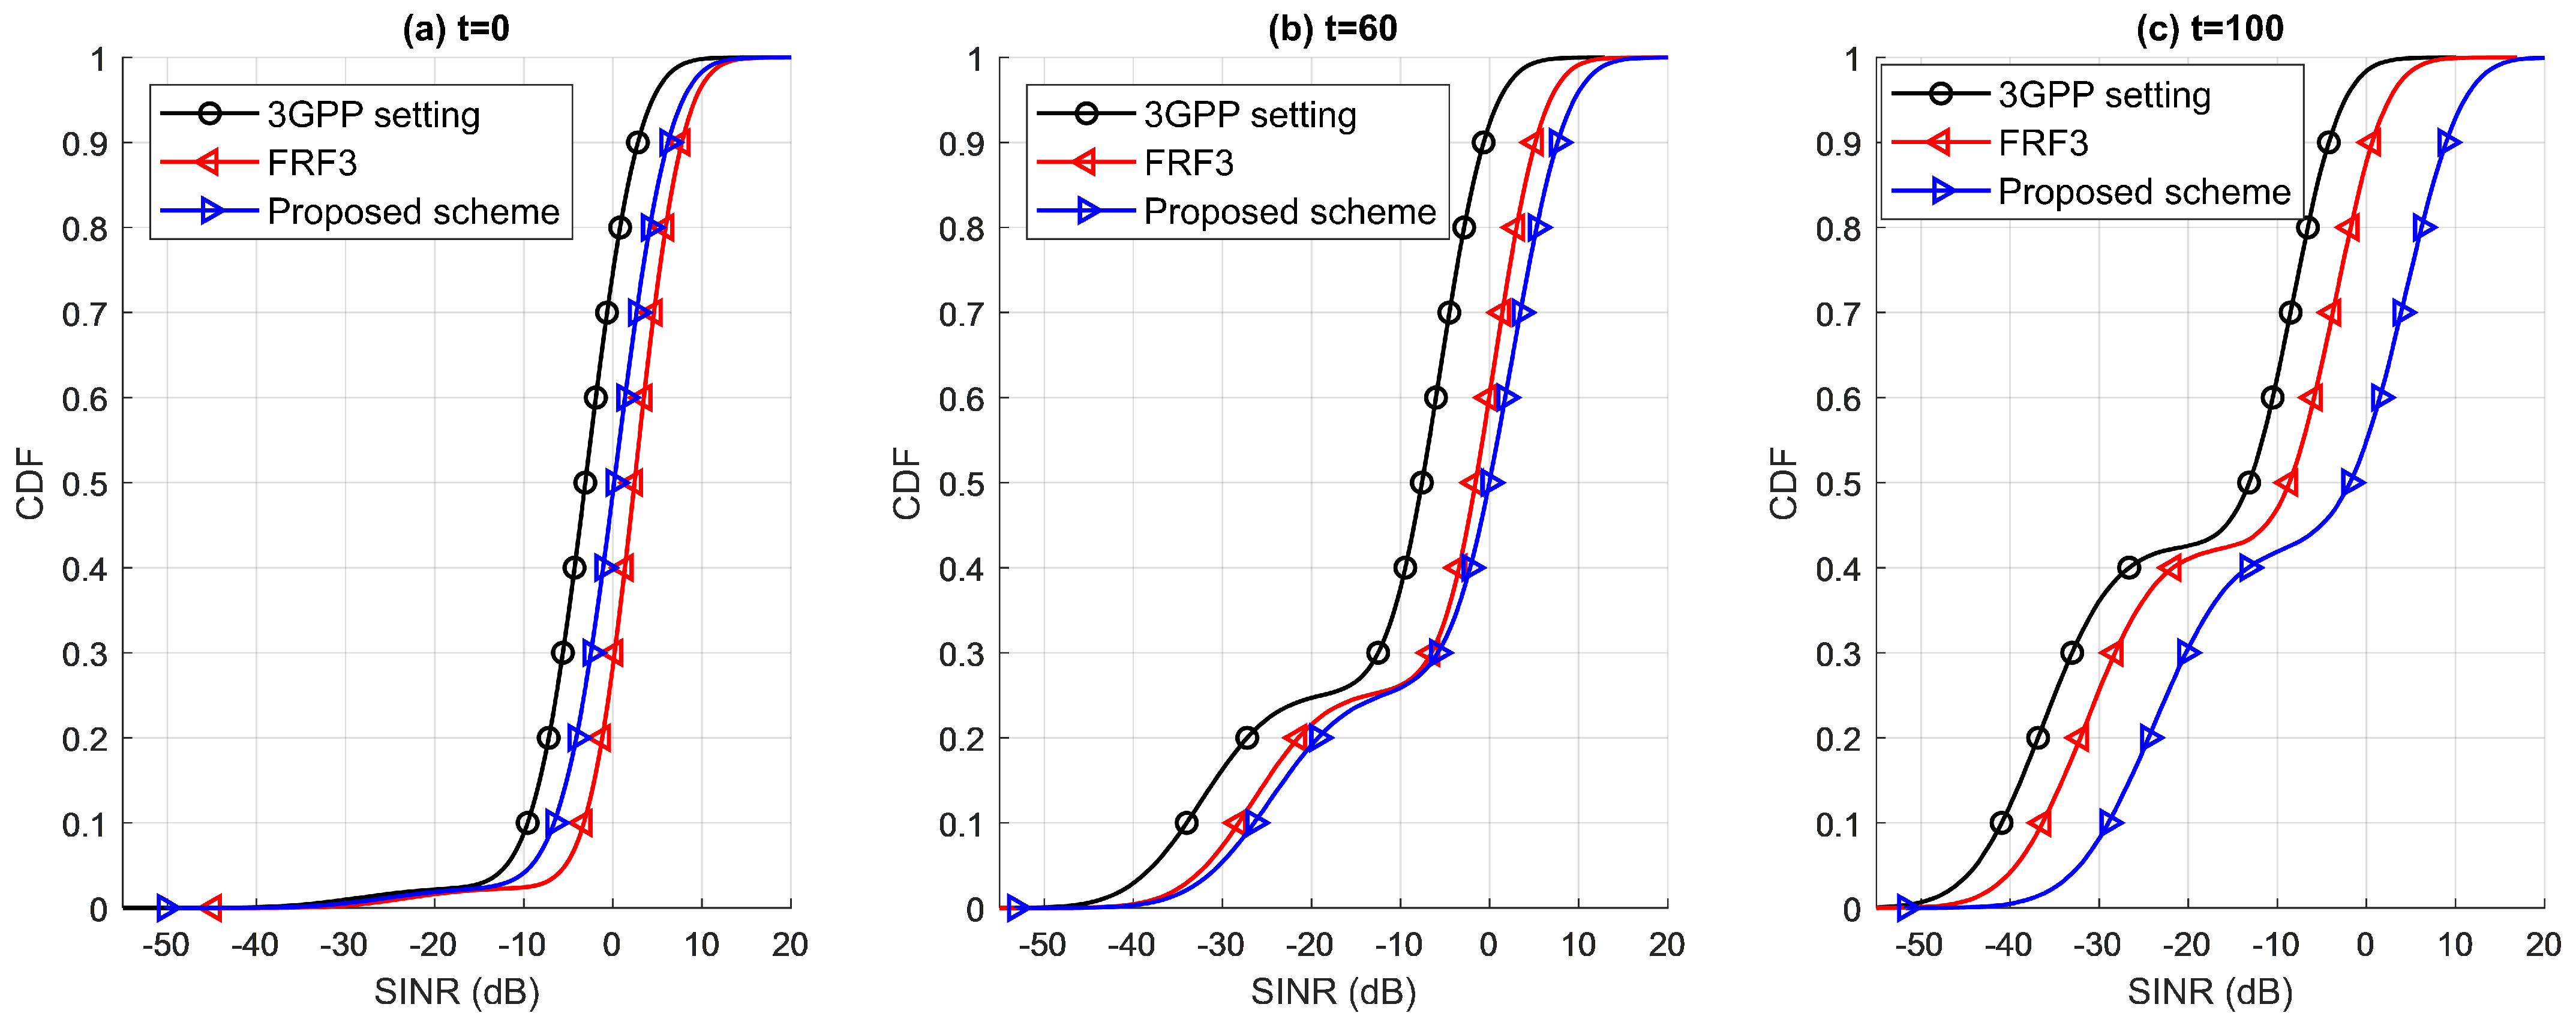
4. Numerical Results and Discussion

The previous section introduces the proposed optimal beamwidth maximizing uplink coverage probability. In this section, we compare the proposed scheme with the following:
  • 3GPP setting: the equivalent antenna aperture is 2 m, the max receive antenna gain is 30 dBi, and the half-power beamwidth is 4 . 4127 [18].
  • 3GPP setting with three-color frequency reuse (FRF3): The frequency band is divided into three sub-bands, and the adjacent beams are allocated to different sub-bands. Other assumptions follow the 3GPP setting. The three-color frequency reuse is also known as frequency reuse factor three.
  • Exhaustive antenna aperture search: exhaustively search the equivalent antenna aperture with the highest uplink coverage probability in a predefined target SINR for each simulated time. The exhaustive antenna aperture search denotes the upper bound of the uplink coverage probability for non-frequency reuse.
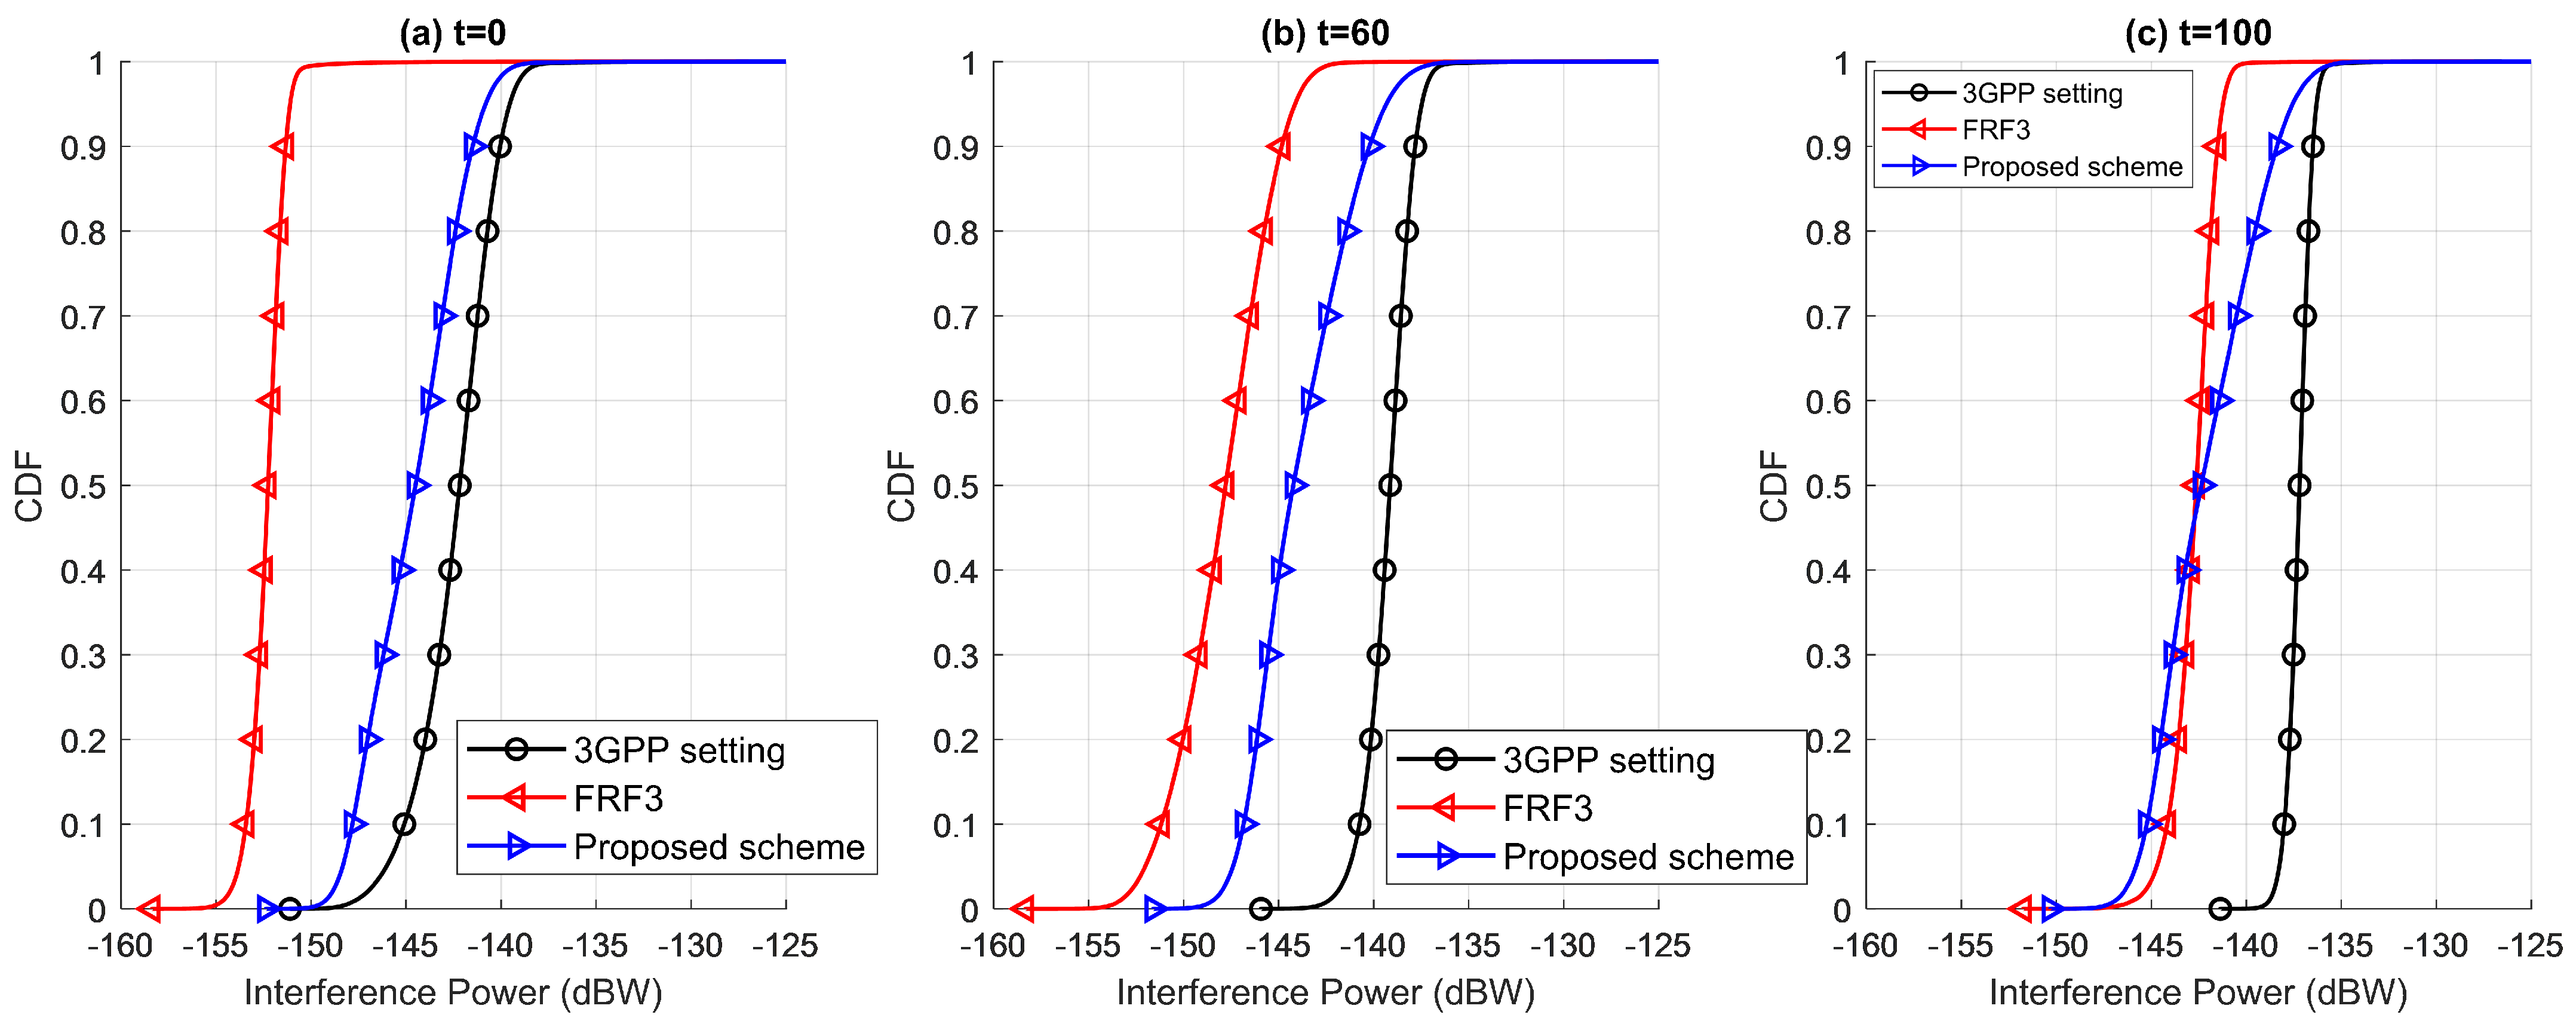
We calculate the uplink coverage probability using the Monte Carlo method. The evaluated scenarios are the NTN rural and NTN urban [16]. To fully address the interference from other satellites, we simulate a 19-beam satellite scenario with the wrap-around mechanism. Other simulation assumptions are summarized in Table 2. We evaluate the performance with target SINR −5.6 dB and −8.61 dB. The target SINR −5.6 dB and −8.61 dB denote the required SINR to satisfy 0.02 block error rate for VoNR with 10 and 20 times PUSCH repetition (transport block size is 184 bits and modulation order is quadrature phase shift keying).

4.1. Signal Quality

In this section, we show and discuss the results of signal quality. Firstly, we show the simulation result of the proposed scheme for the equivalent antenna aperture, antenna gain, half-power beamwidth, and elevation angle of the center beam in Figure 4. The results show that the optimal equivalent antenna aperture increases while the elevation angle decreases. The increasing equivalent antenna aperture provides a higher antenna gain and narrower beamwidth. Figure 5 shows the CDF of SINR for different settings in the NTN rural scenario. With the significant interference mitigation, the FRF3 performs best on SINR at t = 0 , as shown in Figure 5a. Compared to the 3GPP setting, the proposed scheme improves the SINR by 8.15 dB and 7.4 dB at the 50-percentile point and 5-percentile point at t = 60 and by 12.25 dB and 12.23 dB at the 50-percentile point and 5-percentile point at t = 100 . Compared to the FRF3, the proposed scheme improves the SINR by 2.29 dB and 1.63 dB at the 50-percentile point and 5-percentile point at t = 60 and by 7.68 dB and 8.53 dB at the 50-percentile point and 5-percentile point at t = 100 . The SINR results for the NTN urban scenario are shown in Figure 6. The figure also shows that the proposed scheme significantly improves the SINR at low elevation angles.
Figure 7 shows the CDF of interference power for different settings in the NTN rural scenario. As shown in Figure 7, the interference power increases while time increases (elevation angle decreases) for both the 3GPP setting, FRF3, and the proposed scheme. In Figure 7a, compared to the 3GPP setting, the proposed scheme and the FRF3 decrease interference power by 1.3 dBW and 11.6 dBW at the 95-percentile point. In Figure 7b, compared to the 3GPP setting, the proposed scheme decreases interference power by 1.8 dBW and 5.2 dBW at the 95-percentile point and the 50-percentile point, and the FRF3 decreases interference power by 6.6 and 8.7 dB at the 95-percentile point and the 50-percentile point. In Figure 7c, compared to the 3GPP setting, the proposed scheme decreases interference power by 1.2 dBW and 5.5 dBW at the 95-percentile point and the 50-percentile point, and the FRF3 decreases interference power by 4.9 dBW and 5.2 dB at the 95-percentile point and the 50-percentile point.
The results presented in Figure 7 highlight a notable increase in interference over time. This trend primarily arises due to the significant overlap of beam footprints. Figure 8 visually represents the beam topology and footprints at t = 0 and t = 100 for the 3GPP setting and FRF3. It illustrates how the beam footprints expand, particularly at low elevation angles, thereby reducing the angular difference between the serving beam and interfering UE, consequently leading to increased interference. Furthermore, Figure 9 shows the angular difference and antenna gain from interfering UEs to the center beam. The interfering UEs in the figure are at the center of their serving beams. Figure 9 demonstrates a decrease in the angular difference between interfering UEs and the center beam over time, accompanied by increased received antenna gain. Particularly for the UE located at ( x , y ) = ( 70 , 0 ) kilometers, the angular difference decreases from 6 . 65 to 2 . 3 , increasing antenna gain from 12 dBi to 26.7 dBi. This increase in antenna gain ultimately contributes to the escalating interference levels. As shown in Figure 10, the average interference rises from 0.64 × 10 14 to 2.08 × 10 14 watts for the 3GPP setting. Despite the FRF3 aims to mitigate interference, the average interference still rises from 0.06 × 10 14 to 0.66 × 10 14 watts.
Figure 4 illustrates that the satellite forms a narrower beam with the proposed scheme to mitigate interference as time progresses. Furthermore, as shown in Figure 11, the proposed scheme effectively reduces the overlap of beam footprints by adjusting the beamwidth. Specifically, the half-power beamwidth is adjusted to only 1 . 212 at t = 100 , significantly reducing the overlap of the beam footprints. Although the average interference power for all three schemes increases as the elevation angle decreases and FRF3 exhibits lower interference power than the proposed scheme, the proposed scheme demonstrates a minor increment owing to its narrower beamwidth. Specifically, the 3GPP setting and FRF3 experience an increase in average interference power of 1.44 × 10 14 (225%) and 0.6 × 10 14 (1000%) watts, respectively, while the proposed scheme only sees an increase of 0.5 × 10 14 (123%) watts. This difference can be attributed to the proposed scheme’s narrower beamwidth, effectively reducing interference overlap. The proposed scheme also has a significant impact on serving power. As explained in [16,18], FSPL increases with decreasing elevation angle, leading to a decline in the average serving power for both the 3GPP setting and FRF3, as shown in Figure 10. Conversely, the average serving power for the proposed scheme increases from 0.77 × 10 14 to 2.16 × 10 14 watts due to higher antenna gain. This higher antenna gain compensates for the growing FSPL and mitigates the impact of growing interference.

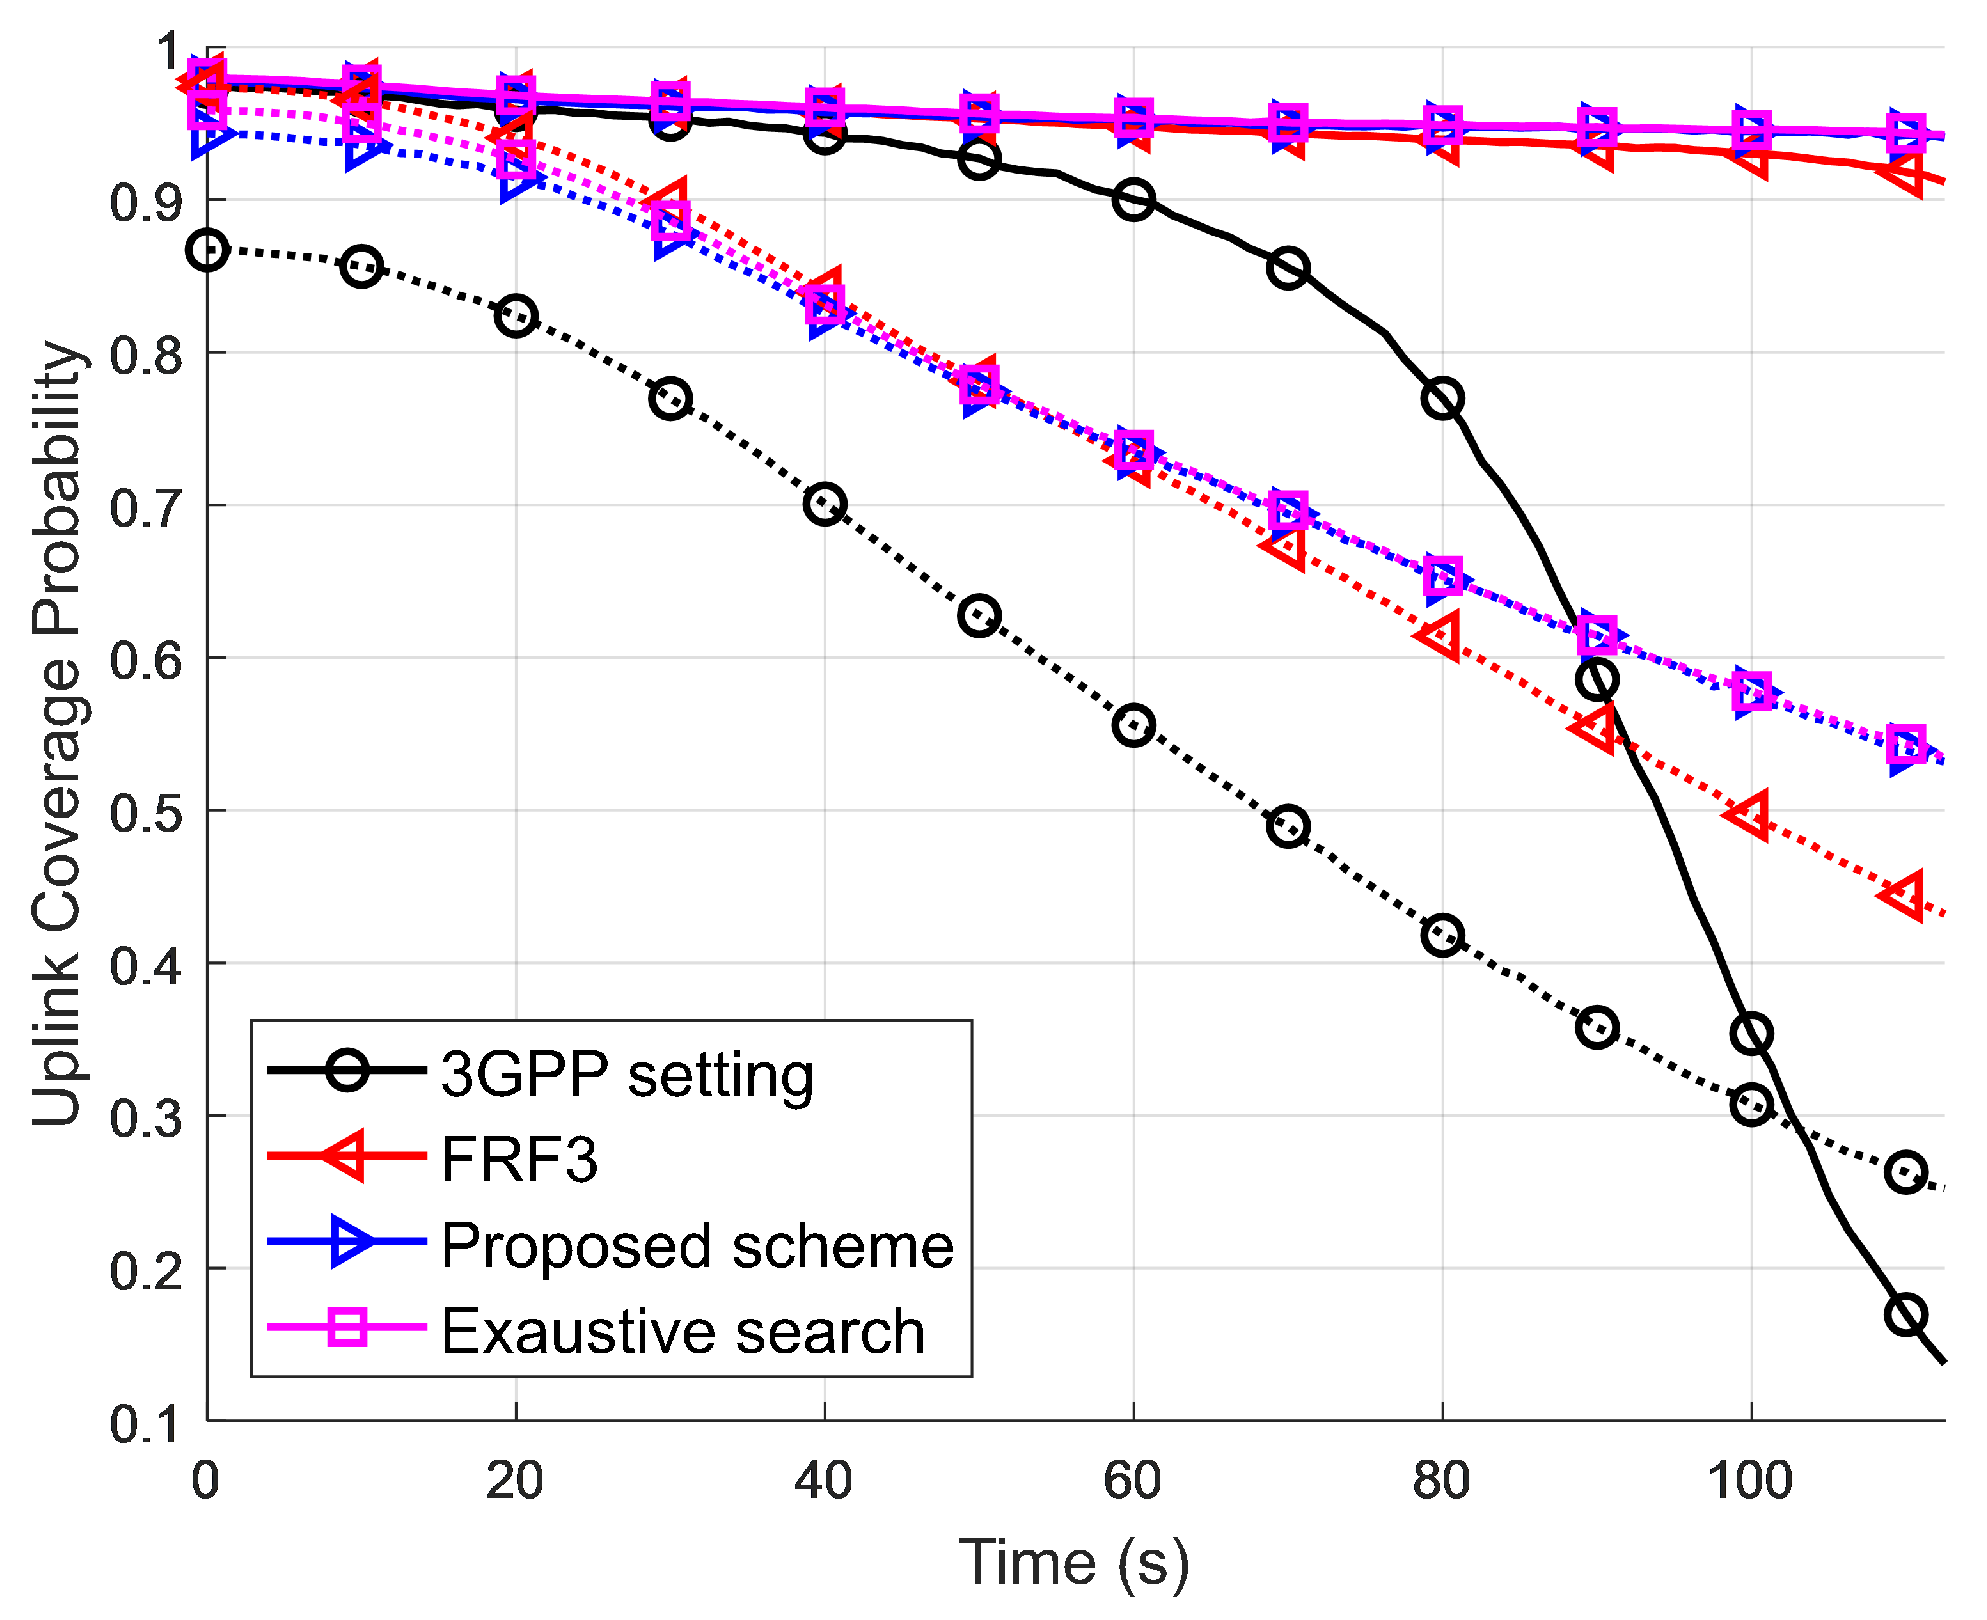
4.2. Uplink Coverage Probability

Figure 12 and Figure 13 show the uplink coverage probability for different target SINR in NTN rural and NTN urban scenarios. The simulations presented in Figure 12 and Figure 13 show the proposed scheme’s effectiveness in maximizing uplink coverage probability. The results demonstrate that the scheme’s performance closely approximates the upper bound established by exhaustive antenna aperture search methods. Specifically, the figures illustrate that the proposed scheme achieves notable proximity to the upper bound, with a maximum deviation of around 0.9% in the NTN rural scenario and around 5% in the NTN urban scenario. This indicates the robustness and efficacy of the proposed scheme in optimizing beamwidth.
Furthermore, the proposed optimal beamwidth maximizing uplink coverage probability scheme is advantageous over the 3GPP setting. As shown in Figure 7 and Figure 10, the interference increases at low elevation angles, which degrades the uplink coverage probability. In the NTN rural scenario, with a target SINR of −8.61 dB, the uplink coverage probability for the 3GPP setting starts above 0.95 but sharply declines to less than 0.36 by t = 100 . Similarly, in the scenario with a target SINR of −5.6 dB, the uplink coverage probability for the 3GPP setting nearly diminishes to zero by t = 100 . In contrast, the proposed scheme maintains an uplink coverage probability of at least 0.93 throughout all simulated times in the NTN rural scenario, irrespective of the target SINR. In the NTN urban scenario, where the low LOS probability impacts the uplink coverage probability, the proposed scheme still significantly improves compared to the 3GPP setting.
Despite FRF3 being considered a helpful interference mitigation scheme, the proposed scheme demonstrates improved uplink coverage probability through increased serving power, as shown in Figure 10. In the NTN rural scenario, the proposed scheme and FRF3 exhibit similar uplink coverage probability performance within t = 0 and t = 80 . Beyond t = 80 , the proposed scheme outperforms FRF3. In the NTN urban scenario, the uplink coverage probability of FRF3 surpasses that of the proposed scheme by approximately 0.085 and 0.03 at the beginning, with target SINR values of −5.6 and −8.61, respectively. However, as time progresses, the uplink coverage probability of FRF3 decreases, eventually falling below that of the proposed scheme around t = 55 and falling below by approximately 0.176 and 0.08 at t = 100 , with target SINR values of −5.6 and −8.61, respectively.
The simulation results and analysis show the proposed scheme’s advantages. The proposed scheme significantly enhances uplink coverage probability, SINR, and interference mitigation. Furthermore, it closely matches the results obtained from exhaustive search methods. These improvements indicate that the proposed scheme effectively addresses the low SINR problem in the QEFC scenario. However, it is essential to acknowledge its limitations. Typically, satellites are equipped with two types of antennas: phased array antennas or parabolic antennas. Since the proposed scheme focuses on adjustable beamwidth, it may not be suitable for satellites equipped with parabolic antennas. Moreover, as illustrated in Figure 4, the optimal equivalent antenna aperture is substantial, three times larger than that of the 3GPP setting. Achieving such high antenna gain and narrow beam design requires a significant number of antenna elements. This affects the satellite’s weight and, consequently, the deployment cost. Hence, a trade-off exists between price and performance in the QEFC scenario.

5. Conclusions

In this paper, we undertake a comprehensive performance analysis of the QEFC LEO satellite system. Our simulations show that QEFC LEO satellites encounter significant challenges, including high interference levels and low SINR. To address these issues and achieve ubiquitous coverage, we introduce an approach to optimizing beamwidth to maximize uplink coverage probability. Our proposed scheme aims to enhance SINR by determining the optimal beamwidth configuration that maximizes uplink coverage probability. We compare the performance of our proposed scheme against two existing configurations: the 3GPP setting and the three-color frequency reuse scheme.
Simulation results demonstrate that our proposed scheme yields notable improvements in serving power and effectively mitigates interference power compared to conventional configurations. Moreover, our scheme achieves the highest uplink coverage probability, closely approaching the upper bound of achievable uplink coverage probability. In the NTN rural scenario, the proposed scheme maintains the uplink coverage probability above 0.93. By leveraging optimized beamwidths, our proposed scheme offers a promising solution to the challenges faced by QEFC LEO satellite systems, ultimately enhancing network performance and facilitating ubiquitous coverage for users. However, considering the cost implications of the proposed scheme, future studies should explore strategies to maximize performance while operating within budget constraints.

Author Contributions

Conceptualization, C.-T.L. and J.-Y.P.; methodology, C.-T.L.; software, C.-T.L.; validation, C.-T.L.; formal analysis, C.-T.L.; investigation, C.-T.L.; resources, C.-T.L.; data curation, C.-T.L.; writing—original draft preparation, C.-T.L.; writing—review and editing, C.-T.L. and J.-Y.P.; visualization, C.-T.L.; supervision, C.-T.L. and J.-Y.P.; project administration, J.-Y.P.; funding acquisition, J.-Y.P. All authors have read and agreed to the published version of the manuscript.

Funding

This research was funded by the National Science and Technology Council, Taiwan, R.O.C., under Grants MOST 112-2218-E-305-001 and NSTC 112-2218-E-194-004.

Data Availability Statement

Data are available in a publicly accessible repository. The data presented in this study are openly available in FigShare at https://doi.org/10.6084/m9.figshare.25497694.v2, accessed on 31 March 2024.

Acknowledgments

This research was partly supported by the Advanced Institute of Manufacturing with High-Tech Innovations from the Featured Areas Research Center Program within the framework of the Higher Education Sprout Project by the Ministry of Education (MOE) in Taiwan.

Conflicts of Interest

The authors declare no conflict of interest.

Abbreviations

The following abbreviations are used in this manuscript:
3GPPThird-Generation Partnership Project
5GFifth-Generation mobile network
ECEFEarth-Centered Earth-Fixed
EMCEarth-moving cells
FRF3Three-color frequency reuse
FSPLFree-space path loss
LEOLow earth orbit
LOSLine-of-sight
NLOSNon-line-of-sight
NRNew Radio
NTNNon-terrestrial networks
PUSCHPhysical uplink shared channel
QEFCQuasi earth-fixed cells
SINRSignal-to-interference-plus-noise ratio
UEUser equipment
VoNRVoice-over New Radio

References

  1. Liao, Q.; Kaneko, M. Global Energy Efficiency Optimization of a Ka-Band Multi-Beam LEO Satellite Communication System. IEEE Access 2021, 9, 55232–55243. [Google Scholar] [CrossRef]
  2. Measuring Digital Development: Facts and Figures 2022. Available online: https://www.itu.int/hub/publication/d-ind-ict_mdd-2022/ (accessed on 1 April 2024).
  3. Xia, S.; Jiang, Q.; Zou, C.; Li, G. Beam Coverage Comparison of LEO Satellite Systems Based on User Diversification. IEEE Access 2019, 7, 181656–181667. [Google Scholar] [CrossRef]
  4. Juan, E.; Lauridsen, M.; Wigard, J.; Mogensen, P. Performance Evaluation of the 5G NR Conditional Handover in LEO-based Non-Terrestrial Networks. In Proceedings of the 2022 IEEE Wireless Communications and Networking Conference (WCNC), Austin, TX, USA, 10–13 April 2022. [Google Scholar] [CrossRef]
  5. Darwish, T.; Kurt, G.K.; Yanikomeroglu, H.; Bellemare, M.; Lamontagne, G. LEO Satellites in 5G and Beyond Networks: A Review From a Standardization Perspective. IEEE Access 2022, 10, 35040–35060. [Google Scholar] [CrossRef]
  6. 3GPP R2-2313877. RACH-less satellite switch procedure. In Proceedings of the 3GPP TSG RAN WG2 Meeting #124, Chicago, IL, USA, 13–17 November 2023. [Google Scholar]
  7. Yu, J.; Kim, J.H. Analysis of SINR according to Elevation Angle in Earth Fixed Beam. In Proceedings of the 2022 27th Asia Pacific Conference on Communications (APCC), Jeju Island, Republic of Korea, 19–21 October 2022. [Google Scholar] [CrossRef]
  8. Baik, J.S.; Kim, J.H. Analysis of the Earth Fixed Beam Duration in the LEO. In Proceedings of the 2021 International Conference on Information Networking (ICOIN), Jeju Island, Republic of Korea, 13–16 January 2021. [Google Scholar] [CrossRef]
  9. Yi, J.; Kim, Y.; Ryu, H. Performance of Uplink Coverage Enhancement Schemes for 5G NR in 3GPP. In Proceedings of the 2022 IEEE 95th Vehicular Technology Conference: (VTC2022-Spring), Helsinki, Finland, 19–22 June 2022. [Google Scholar] [CrossRef]
  10. Nasarre, I.P.; Levanen, T.; Pajukoski, K.; Lehti, A.; Tiirola, E.; Valkama, M. Enhanced Uplink Coverage for 5G NR: Frequency-Domain Spectral Shaping With Spectral Extension. IEEE Open J. Commun. Soc. 2021, 2, 1188–1204. [Google Scholar] [CrossRef]
  11. 3GPP R1-2208321. Final Report of 3GPP TSG RAN WG1 #110 v1.0.0. In Proceedings of the 3GPP TSG RAN WG1 Meeting #110bis-e, Online Meeting, 10–19 October 2022. [Google Scholar]
  12. 3GPP R1-2207811. Summary #4 on 9.12.1 Coverage enhancement for NR NTN. In Proceedings of the 3GPP TSG RAN WG1 Meeting #110, Toulouse, France, 22–26 August 2023. [Google Scholar]
  13. Vázquez, M.Á.; Pérez-Neira, A.; Christopoulos, D.; Chatzinotas, S.; Ottersten, B.; Arapoglou, P.; Ginesi, A.; Taricco, G. Precoding in Multibeam Satellite Communications: Present and Future Challenges. IEEE Wirel. Commun. 2016, 23, 88–95. [Google Scholar] [CrossRef]
  14. Spacex Non-Geostationary Satellite System Attachment a Technical Information to Supplement Schedule S. November 2016. Available online: https://fcc.report/IBFS/SAT-LOA-20161115-00118/1158350 (accessed on 1 April 2024).
  15. Al Homssi, B.; Al-Hourani, A. Optimal Beamwidth and Altitude for Maximal Uplink Coverage in Satellite Networks. IEEE Wirel. Commun. Lett. 2022, 11, 771–775. [Google Scholar] [CrossRef]
  16. 3GPP TR 38.811. Study on New Radio (NR) to Support Non-Terrestrial Networks (Release 15). V15.4.0, September 2020. Available online: https://portal.3gpp.org/desktopmodules/Specifications/SpecificationDetails.aspx?specificationId=3234 (accessed on 1 April 2024).
  17. 3GPP R1-2208321. Discussion on NR NTN coverage enhancement. In Proceedings of the 3GPP TSG RAN WG1 Meeting #110, Toulouse, France, 22–26 August 2023. [Google Scholar]
  18. 3GPP TR 38.821. Solutions for NR to Support Non-Terrestrial Networks (NTN) (Release 16). V16.1.0, May 2021. Available online: https://portal.3gpp.org/desktopmodules/Specifications/SpecificationDetails.aspx?specificationId=3525 (accessed on 1 April 2024).
  19. 3GPP RP-222654. Revised WID: NR NTN (Non-Terrestrial Networks) enhancements. In Proceedings of the 3GPP TSG RAN Meeting #97-e, Online Meeting, 12–16 September 2022. [Google Scholar]
Figure 1. Service link types (a) earth-moving cells and (b) quasi earth-fixed cells.
Electronics 13 01349 g001
Figure 2. The illustration of Equations (12)–(15).
Electronics 13 01349 g002
Figure 3. The illustration of probability for receiving antenna gain.
Electronics 13 01349 g003
Figure 4. Elevation angle of the center beam ϵ 0 ( t ) and optimal solutions of equivalent antenna aperture, max receive antenna gain, and half-power beamwidth with target SINR −5.6 dB in NTN rural scenario.
Electronics 13 01349 g004
Figure 5. The SINR results for 3GPP setting, FRF3, and the proposed scheme (target SINR −5.6 dB) in NTN Rural scenario at (a) t = 0, (b) t = 60, (c) t = 100.
Electronics 13 01349 g005
Figure 6. The SINR results for 3GPP setting, FRF3, and the proposed scheme (target SINR −5.6 dB) in NTN Urban scenario at (a) t = 0, (b) t = 60, (c) t = 100.
Electronics 13 01349 g006
Figure 7. The interference results for 3GPP setting, FRF3, and the proposed scheme (target SINR −5.6 dB) in NTN Rural scenario at (a) t = 0, (b) t = 60, (c) t = 100.
Electronics 13 01349 g007
Figure 8. Beam topology and footprints with elevation angle (a) ϵ 0 ( 0 ) = 90 and (b) ϵ 0 ( 100 ) = 36 . 53 for the 3GPP setting and FRF3. Black dots represent the position of the beam center, and red circles represent the footprints of half-power beamwidth ( 4 . 4127 ).
Electronics 13 01349 g008
Figure 9. Angular difference φ 0 s ( t ) and received antenna gain G ( φ 0 s ( t ) , 2 ) between interfering UE and the center beam.
Electronics 13 01349 g009
Figure 10. Average serving power and average interference power for QEFC LEO satellite in NTN rural scenario. The target SINR for the proposed scheme is −5.6 dB.
Electronics 13 01349 g010
Figure 11. Beam topology and footprints with elevation angle ϵ 0 ( 100 ) = 36 . 53 for the proposed optimal beamwidth scheme. Black dots represent the position of the beam center, and red circles represent the footprints of half-power beamwidth ( 1 . 212 ).
Electronics 13 01349 g011
Figure 12. Simulation results of uplink coverage probability with target SINR −5.6 dB in rural (dashed) and urban (solid) scenario.
Electronics 13 01349 g012
Figure 13. Simulation results of uplink coverage probability with target SINR −8.61 dB in rural (dashed) and urban (solid) scenario.
Electronics 13 01349 g013
Table 1. The description of notations.
NotationDistriptions
F , T The set of the simulated frequency band and time. | F | = 3 for FRF3 and | F | = 1 for non-frequency reuse.
L f , S l The set of beams in frequency band f ( f F ), UE serving by beam l ( l L f ).
ϵ l , ϵ s , l Elevation angle of beam l, elevation angle of user s served by beam l.
ζ ϵ Clutter loss. Clutter loss is 0 for the LOS state. The values for the (NLOS state at elevation angle ϵ are defined in [16].
κ ϵ Shadow fading at elevation angle ϵ . Shadow fading is zero mean Gaussian variable.
σ L O S , ϵ , σ N L O S , ϵ The variation in shadow fading for lien-of-sight (LOS) and non line-of-sight (NLOS) states at elevation angle ϵ [16].
p L O S , ϵ , p N L O S , ϵ LOS probability and NLOS probability at elevation angle ϵ [16].
φ k , l Angle difference of boresight direction between beam l and beam k ( l , k L and l k ).
φ l s Angle difference of UE s and boresight direction of beam l.
P ( x ) , P y ( x ) The probability of the condition x to be satisfied, P y ( x ) = P ( x | y ) .
Table 2. Simulation assumptions.
AssumptionValue
Satellite height600 km
Satellite beam pattern19 spot beams with wrap-around
Max antenna gain for 3GPP setting and FRF330 dBi
Carrier frequency2 GHz
UE-typeHandheld
UE antenna configurationOmni-directional, −5.5 dBi antenna gain [19]
UE transmit power23 dBm
UE attachmentRSRP
Scheduled bandwidth180 kHz (1 resource block)
Noise power−147 dBW
Disclaimer/Publisher’s Note: The statements, opinions and data contained in all publications are solely those of the individual author(s) and contributor(s) and not of MDPI and/or the editor(s). MDPI and/or the editor(s) disclaim responsibility for any injury to people or property resulting from any ideas, methods, instructions or products referred to in the content.

